
Abstract
The concept of Tourism Destinations Competitiveness has evolved from a price-focused perspective to the consideration of multiple factors including sustainability, residents’ well-being, or destination image. Regardless of the version used, it is expected that a competitive destination should be able to convert its advantageous position into economic returns. However, the pandemic has come to upset the foundations of the sector, since many of the destinations traditionally classified as highly competitive have also been the most affected by the pandemic. In this paper, we propose to review the notion of competitiveness by considering properly the dimension of inherent risk, using specific composite indexes, and adjusting conventional competitiveness indicators including these dimensions. We revise the results of these new adjusted by risk competitiveness indexes for the organization for economic cooperation and development (OECD) and OECD partner countries. Among other relevant points, the findings indicate relevant changes in rankings when we explicitly include risk in the competitiveness calculations.
Introduction
Tourism has been acknowledged as one of the economic activities most affected by the pandemic worldwide (Nicola et al., 2020) and it is not surprising that the literature generated on the effects of the pandemic on tourism does not stop growing (Sigala, 2020; Lee and Chen, 2022; Gössling and Schweiggart, 2022). The shock of COVID-19 has shaken some pillars of knowledge in tourism. The perception of tourism as an activity with constant and robust global growth has been questioned and the sector is assessing which changes will be reversed and which other ones will remain.
One of the pillars of tourism knowledge that can be potentially questioned would be related both to the theoretical concept of Tourism Destination Competitiveness (TDC) and the empirical applications using different indicators leading to the popular country or destination rankings. It is expected that a competitive destination should be able to convert its advantageous position into economic returns (Abreu-Novais et al., 2015; Li et al., 2013). In this context, it could be argued that in the same way that a competitive destination should be able to capture a higher share of tourism demand compared to its competitors in a context of global tourism growth, a competitive destination should be able to release a lower share of tourism demand compared to its competitors in a context of global tourism crisis.
Research on tourism risk, crisis, and disaster management shows how most empirical literature has centered its attention on studying a single crisis and disaster case or a single tourism destination or region. In contrast, multiple case studies to compare different types of crises and disasters, or to compare how different tourism destinations/regions or sectors respond or recover from crises and disasters are seldom used (Ritchie and Jiang, 2019). This circumstance makes it difficult to obtain indicators of risk management capacity for different destinations and, ultimately, to incorporate them into the traditional destination competitiveness indicators although it is acknowledged that managers’ perceptions and attitudes toward risk influence crisis and disaster planning and response strategies (Wang and Ritchie, 2012) and consequently are part of the capacity of destinations to attract and manage tourism. As a result, the concept of risk had been fairly neglected in TDC destination ranks studies despite the upward trend in the number of variables included in the analysis (Dwyer et al., 2003; Hallmann et al., 2014; Shariffuddin et al., 2023).
However, tourist demand dynamics during the years of the Covid-19 pandemic for different countries collected by the OECD show that those traditionally classified as highly competitive according to the Travel and Tourism Competitive Index (TTCI) provided by the World Economic Forum (WEF) (WEF, 2019), have presented significant decreases in international flows. For instance, in Spain, which was ranked first in the 2019 TTCI, international tourism decreased a 77% in 2020, more than in the Southern/Mediterranean Europe region considered jointly (71%); In France and Germany, ranked second and third, the drop was 54% and 69%, while the whole Western Europe region fell by 60%; in Japan, ranked fourth, international tourism decreased by 87%, while in the whole Asia and the Pacific area, the fall was 84%; Finally, in United States, ranked fifth in the 2019 TTCI, international tourism fell by 76%, while in the whole North America area, the fall was 68%. Consequently, the economic risk inherent in destinations seems not adequately accounted for in the WEF index.
These data show a clear contradiction between the competitiveness of the destinations given by the indicator proposed by the WEF and the results in terms of tourist demand after the pandemic. That is why we argue that the economic risk inherent in destinations has not been adequately discussed in competitiveness literature but may also affect tourism destination competitiveness. Accordingly, this work aims to fill this gap by constructing a synthetic indicator of vulnerability and analyzing its relationship with the standard notion of competitiveness. Specifically, we built a risk Index for the OECD (and OECD partners) countries that we use to adjust competitiveness for risk. The main results show that country rankings become affected by the explicit inclusion of risk.
The paper is organized as follows. Next section revises the literature on competitiveness and risk. Then, the methodological proposal about aggregate risk measures and the adjustment of the standard competitiveness indexes are presented. Comming up next the main results obtained, including some robustness checks, are shown. Finally, the main conclusions and extensions are considered.
Risk: A missing pillar in traditional TDC indicators
A review of the most popular academic definitions of the concept of TDC shows that it is possible to identify three common dimensions from existing definitional statements: Economic, Attractiveness & Satisfaction, and Sustainability (Abreu-Novais et al., 2015). The economic dimension is the predominant one and has, in turn, two main subdimensions. The first one is related to price differentials and productivity of the different services that are included in the tourist product that can be evaluated by the number of tourists, tourist expenditure, market share, and balance of payments (Dwyer et al., 2000; Heath, 2003; Crouch and Ritchie, 2012; Rey-Maqueira and Ramos, 2016). The second one is related to the development and wealth of the local population. Thus, competitiveness refers too to the ability of a destination to maintain and increase a good standard of living for the residents (Bahar and Kozak, 2007; Buhalis, 2000; Crouch and Ritchie, 1999; Dwyer and Kim, 2003).
The second dimension comprises the ability of a destination to attract and satisfy potential tourists. This dimension is related to the destination image and the idea that destinations need to strive for an overall appeal and offer a tourism experience that is superior to competing destinations (Crouch and Ritchie, 1999; Dwyer and Kim, 2003). Finally, the third dimension concerns sustainability and has been identified in most definitions of competitiveness (Abreu-Novais et al., 2015; Hassan, 2000). In the context of destination competitiveness, sustainability is referred to local resources for ensuring the maintenance of long-term success as well as the achievement of equitable returns on resources utilized to satisfy all stakeholders (Buhalis, 2000).
Despite the widespread acceptance of the theoretical definition of TDC and its different components, its application at the empirical level is not simple (Dwyer and Kim, 2003). Shariffuddin et al. (2023) illustrate findings on TDC in the past decade through systematic literature analysis showing that not a closed list of items, attributes, or indicators to measure the competitiveness of tourism destinations exists. Early efforts were directed toward focusing on the price factors of competitiveness through the costs incurred by a tourist for transportation, accommodation, and other goods and services purchased at the destination (Azzoni and De Menezes, 2009; Dwyer et al., 2000, 2002) or measuring destination image and attractiveness by comparing destination attributes for different destinations or by identifying tourists’ perceptions (Bramwell and Rawding, 1996; Echtner and Ritchie, 1993; Faulkner et al., 1999; Hu and Ritchie, 1993).
During the last few years, literature on tourism destination competitiveness has recognized the multidimensional complexity of the concept and has attempted more holistic approaches that include not only prices and tourist perceptions but also a wide list of indicators related to the issues stated in the theoretical argumentation about sustainability and residents’ wellness (Crouch, 2010; Dwyer and Kim, 2003; Enright and Newton, 2004; Gooroochurn and Sugiyarto, 2005). Accordingly, most recent literature usually includes more than 20 indicators (Bahar and Kozak, 2007; Caber et al., 2012; Wang et al., 2012) and even more than 80 (Chens et al., 2008; Dwyer et al., 2003; Hallmann et al., 2014) to include all the concepts mentioned at a theoretical level.
Despite the criticisms and attempts to improve received (Martín et al., 2017; Martínez-Gonzalez et al., 2021; Rodríguez-Díaz and Pulido-Fernández, 2021), the WEF publishes periodically one of the most popular TDC indexes since 2007. The 2019 WEF Tourism and Travel Competitiveness Index (2019TTCI) ranks 140 countries on a 1–7 scale and comprises 90 indicators, arranged into 14 pillars by taking simple averages. Pillars are averaged to form 4 sub-indices (From A to D), which, in turn, are averaged into the final composite.
Subindex A refers to Enabling Environment and includes the pillars of Business Environment, Safety and Security, Health and Hygiene, Human Resources and Labor Market, and ICT Readiness. Subindex B describes T&T Policy and Enabling Conditions and includes the pillars of Prioritization of Travel & Tourism, International Openness, Price Competitiveness, and Environmental Sustainability. Pillar C collects data about Infrastructure and includes the pillars of Air Transport Infrastructure, Ground and Port Infrastructure, and Tourist Service Infrastructure. Finally, Subindex D refers to Natural and Cultural Resources and includes the pillars of Natural Resources, Cultural Resources, and Business Travel.
The WEF Competitiveness Index does not incorporate a specific sub-index accounting for risk. It includes (few) risk-related variables, but their importance in the final composite becomes blurred by construction. For example, it includes indicators of disease epidemics. These indicators are averaged with other variables to form the “Health and Hygiene” pillar. This becomes averaged with the other four pillars to form the first sub-index, and the result is averaged once more to form the final composite. More importantly, the index does not incorporate indicators for the risk that comes from the specific structure of a destination’s source markets, such as the importance of domestic market, which is known to be the most resilient component of demand (Barrot et al., 2016; Gnangon, 2016; Gössling et al., 2020; Phuc and Dinh, 2020; Arbulú et al., 2021), nor for the likelihood of most natural hazards.
In 2021, the WEF Competitiveness Index evolved into the T&T Development Index. The change concentrates on the inclusion of a sustainability sub-index (both environmental and social), also incorporating indicators of demand pressure. As a result, it incorporates a few more risk-related variables than the Competitiveness Index. For example, it includes seasonality (a market-vulnerability factor) as an indicator of demand pressure. Also, it includes the Global Climate Change Index as an indicator of environmental sustainability. However, risk indicators have little weight in the final composite and, more importantly, the dimensions covered are largely incomplete. 1
However, it is important to note how the topic of risk and disaster management is attracting increasing attention in tourism (Becken and Hughey, 2013; Faulkner, 2001; Ritchie, 2008). It is acknowledged that tourism is vulnerable to multiple types of hazards, and disasters often deter visitors from traveling to affected destinations (Bhati et al., 2016). The review of the theoretical literature relative to the concept of risk and vulnerability in the context of tourism destinations can be approached with the chaos theory arguing that one-off shocks such as major extreme events (health crises, international economic and financial crises, terrorism, wars, and natural disasters) could damage the attractiveness of the destination sharply and instantly (and in some cases increase the attractiveness of competitors) with the possibility of a persistent impact following the butterfly effect principle (Charles et al., 2019).
In this framework, research to date has centered the attention on crisis management and disaster risk reduction plans to prepare, protect, and rebuild a destination after a disaster (Aljerf and Choukaife, 2016) but also in the demand quantification of the effects of different disasters (Jin et al., 2019; Rosselló et al., 2020) evidencing the relationship between disasters and the drop in tourism activity. Thus, the perception of safety is an important aspect of destination image, and different types of risks and events have been studied in the context of visitor travel information seeking and decision-making (Sharifpour et al., 2014; Trumbo et al., 2016; Williams and Baláz, 2015).
Additionally, we should consider how the obvious impact of major extreme events such as health epidemics gives support to the “tourism-led vulnerability hypothesis” (Hoarau, 2022). International tourism, more than a victim, has been considered too as a major factor of the COVID-19 pandemic outbreak. International travel and tourism constitute strong forces in the emergence of diseases and will continue to shape the outbreak, frequency, and spread of infections in geographic areas and populations. Consequently, the tourism-led vulnerability hypothesis may give some interesting explanations for the fact of the most attractive tourism destination were also the most affected by the pandemic. Whatever the context, to date, no study has tried to specifically include the concept of risk in tourism competitiveness indicators, even though the recent pandemic has taught us that the most competitive destinations are not precisely those that have been characterized by a lower impact in terms of demand.
To illustrate the lack of consideration of risk indicators in the WEF Competitiveness Index, Figure 1 shows the relationship between the percentage fall in 2020 demand due to the Covid 19 shock for the OECD and partner countries (OECD, 2022). Change in OECD tourism demand 20/19 versus Competitiveness. (a): International. (b): International. Note: Names of the OECD and OECD partner countries use the Alpha-3 ISO 3166-1 code. Own elaboration.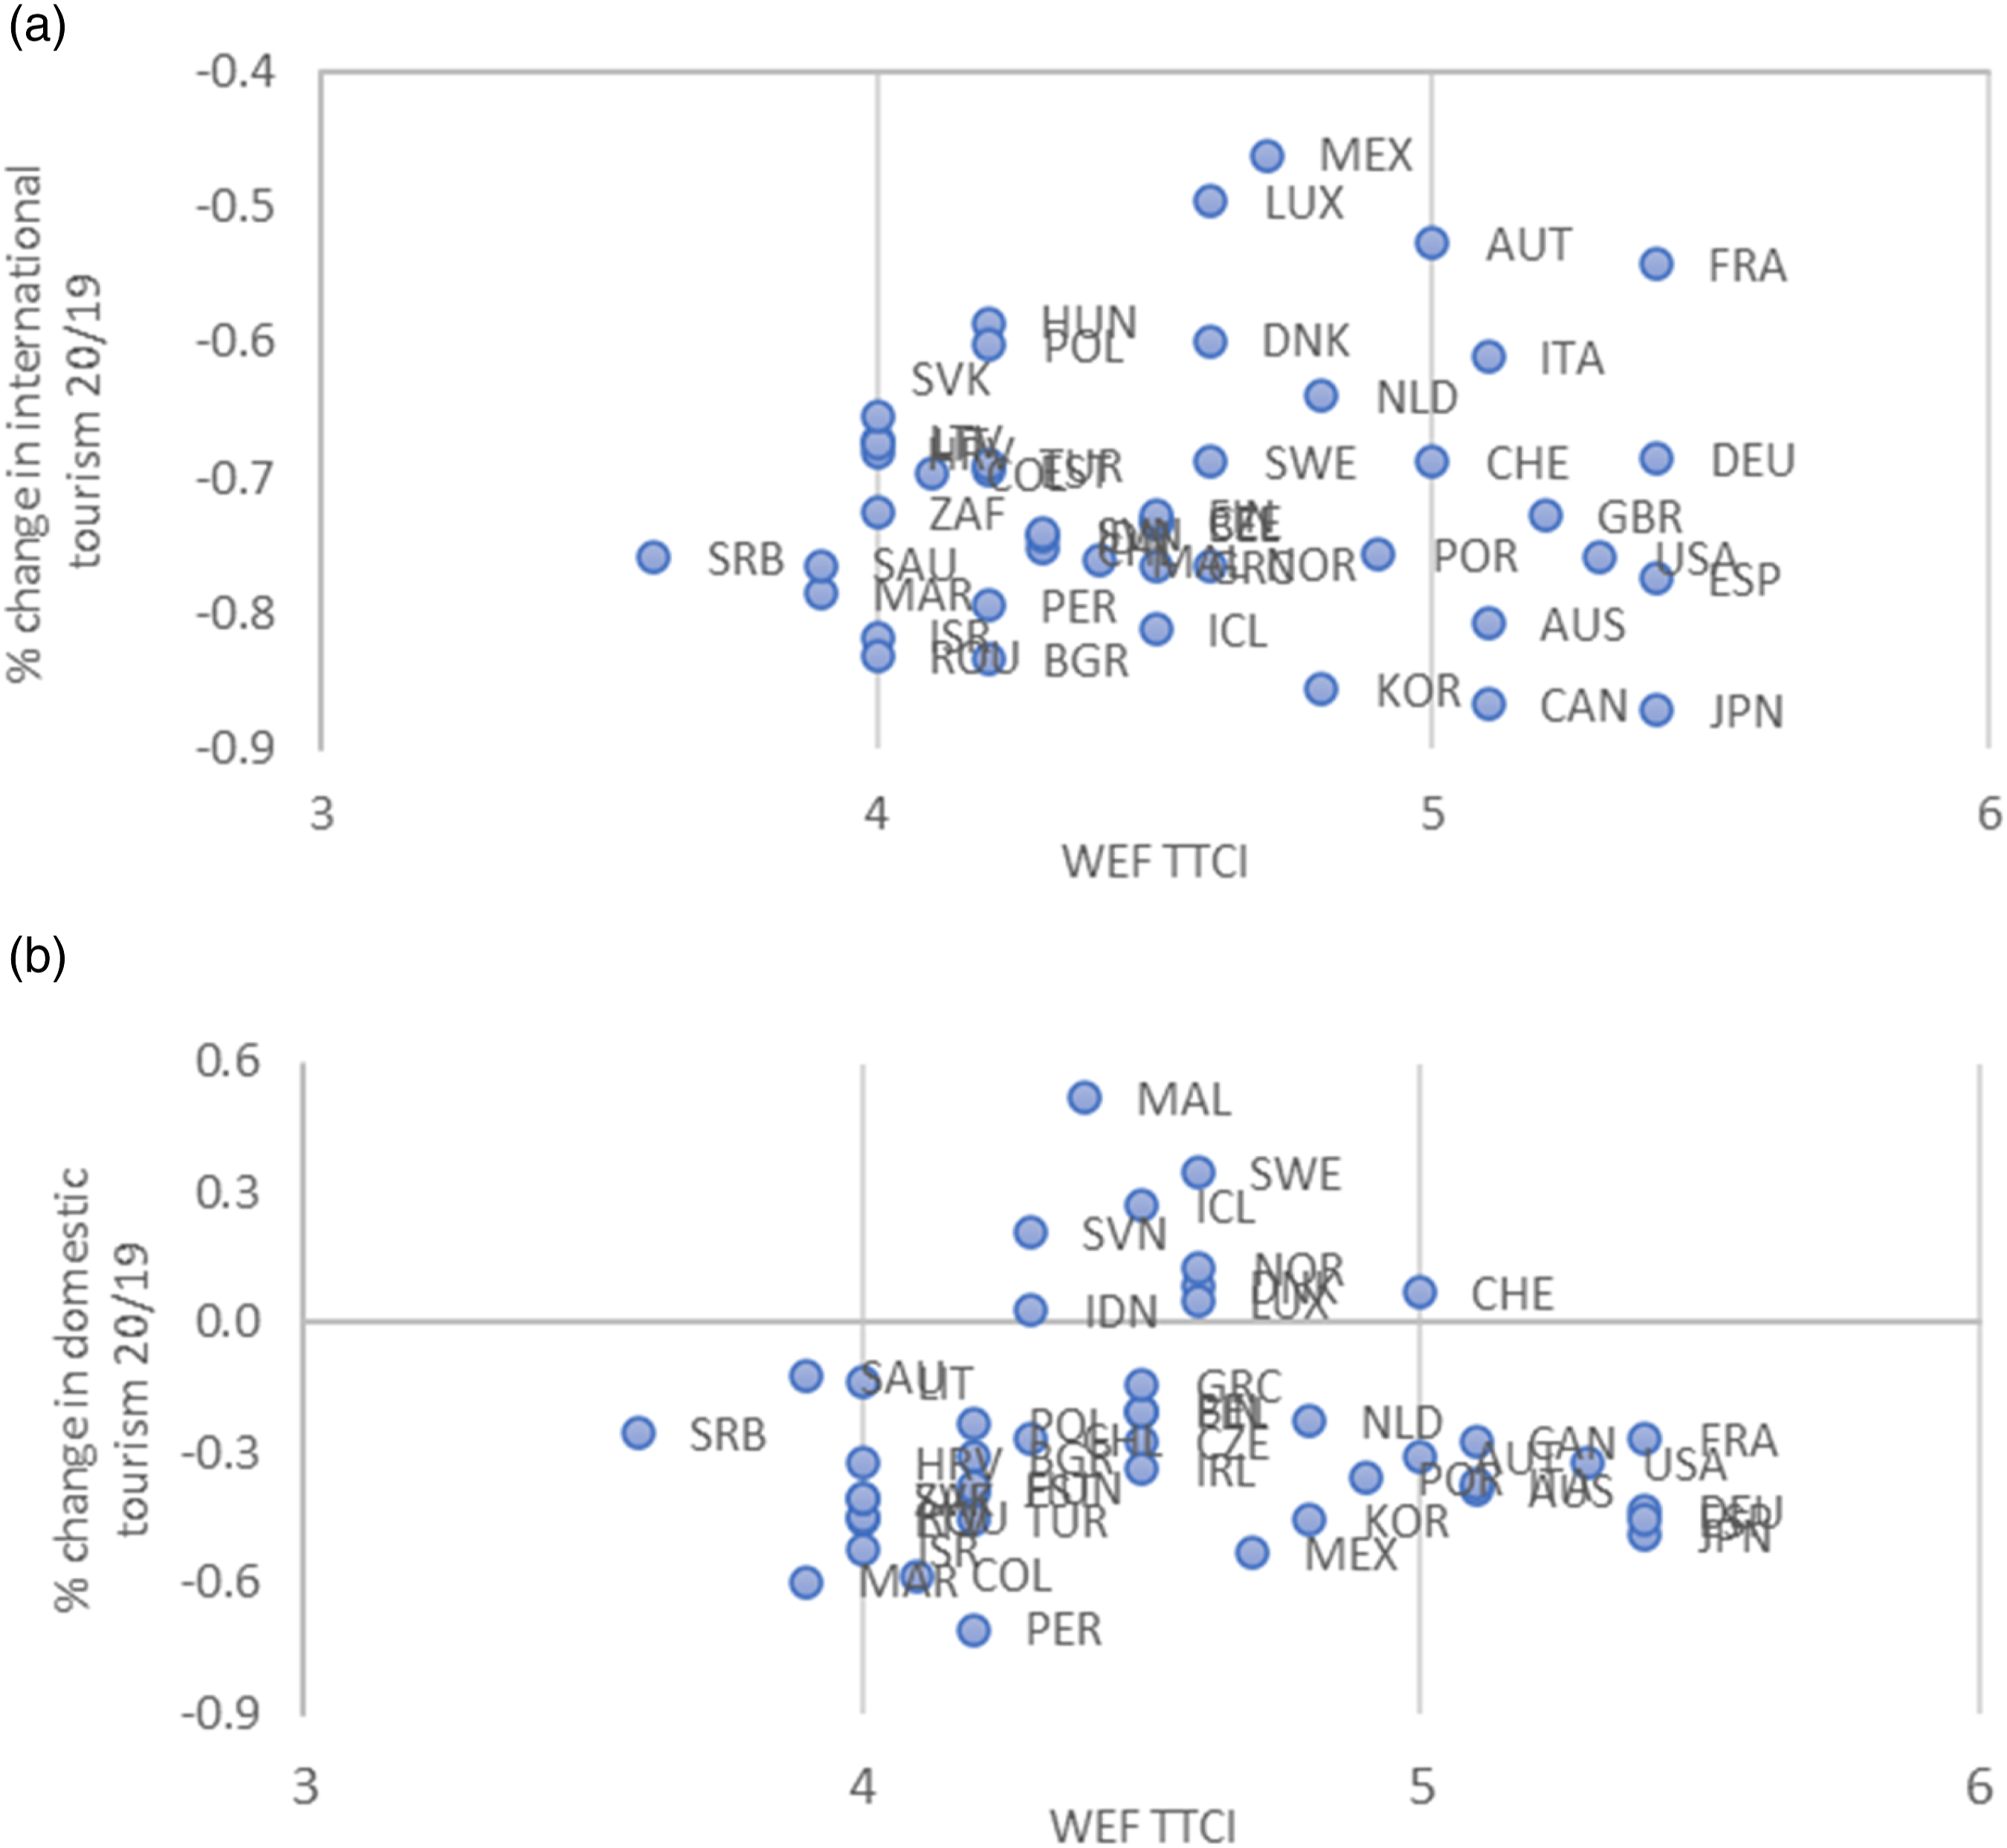
As it is shown in Figure 1, there is no clear relationship between the fall in the number of tourists in 2020 and the WEF competitiveness index, neither international nor domestic, thus the index does not contain information to anticipate which countries have been the most/least impacted by the pandemic in terms of tourist arrivals.
Overall, the main message is that risk has been largely understated in assessing tourism competitiveness. In this paper, we account for this knowledge gap and propose a simple framework to adjust competitiveness for risk. Building on the existent vulnerability literature (Calgaro et al., 2014; Hall et al., 2022; Kumar, 2023), we construct a composite index of destination risk, which allows us to rank destinations according to the potential risk of their tourism sector. We employ this risk index to adjust a comparable competitiveness index by aggregating the two in a single composite, aimed to assess risk-adjusted competitiveness.
Methodology: Into a risk-adjusted competitiveness index
Let’s define a risk-adjusted competitive index (RA_TTCI) as the (weighted) average between two indices: a travel risk and competitiveness index (TTRI) and the TTCI

In particular, the WEF equally weights indicators to compute its tourism and travel competitiveness index. Consistent with this procedure, we rely on equal weighting for the baseline specification of the proposed risk-adjusted competitiveness index. However, as a robustness check, we explore other weighting alternatives, as well as the use of geometric means for aggregation (see Section 4.4).
To adjust a competitiveness index for risk, we need available comparable risk and competitiveness indices. Next, we provide details on how we obtain these two intermediate indices for the current study.
Benchmark risk index
According to the European Commission and the Inter-Agency Standing Committee Reference Group on Risk, Early Warning and Preparedness, risk envisages three dimensions: hazards & exposure, vulnerability, and lack of coping capacity (see Miola et al., 2015 for a review). The definition is to compute a risk index (INFORM Risk) aimed to assess and monitor humanitarian crises and disasters.
Building on this definition, we build the benchmark Tourism and Travel Risk Index (TTRI) as the composite of three sub-indices standing for the previous dimensions, as summarized in Figure 2. Dimensions of the tourism and travel risk index. Source: Own elaboration.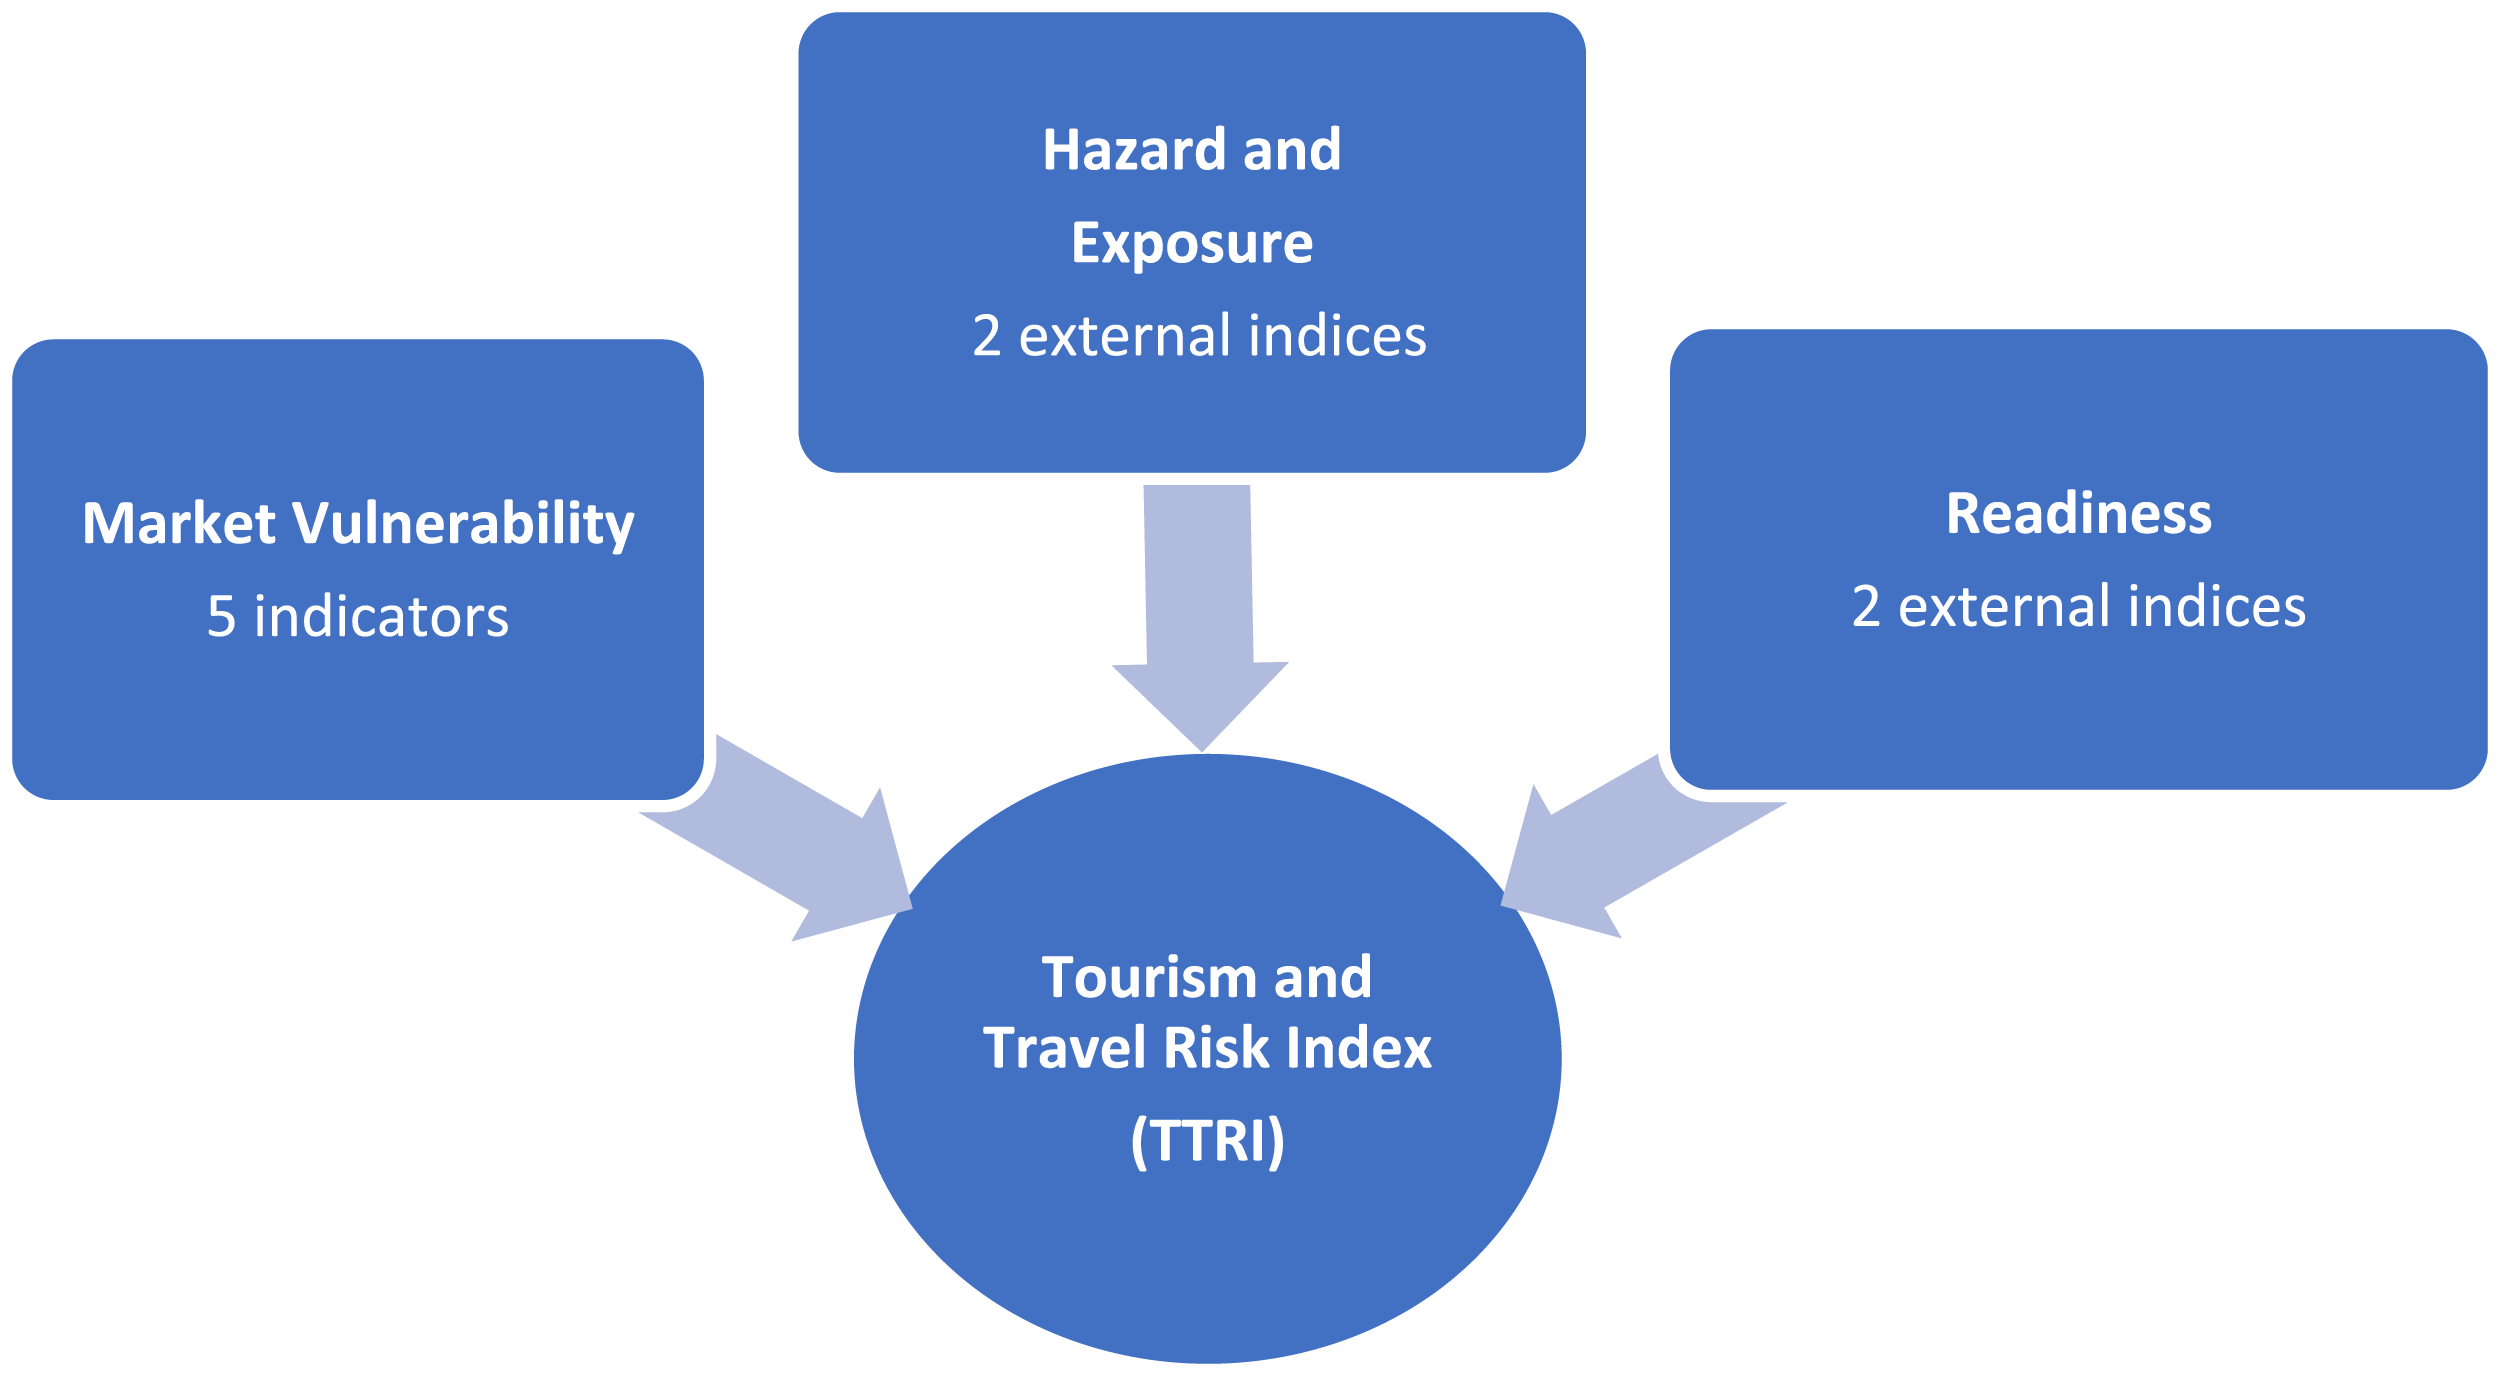
Details about the indicators’ selection for each of the dimensions and the variables used to measure them are presented below:
Market vulnerability
This first dimension of the risk index accounts for the vulnerability that comes from the structure of the demand market. It is computed as the average of four individual indicators that have already been used in the literature to account for this risk (see, e.g., Duro et al., 2021, 2022). Details follow: ⁃ Importance of the domestic market (DOM). The domestic market has been massively highlighted in the literature as a factor of vulnerability mitigation. The lower importance of this market further exposes destinations to international shocks, making them more vulnerable (Barrot et al., 2016; Gnangon, 2016; Gössling et al., 2020; Phuc and Dinh, 2020; Arbulú et al., 2021; Duro et al., 2022b). We measure this indicator by the % of domestic tourists. ⁃ Importance of proximity markets (REG). Some markets are less vulnerable than others because they are closer or because they have tighter links of mutual knowledge and exchange (Duro et al., 2021, 2022b). We measure this indicator by the % of visitors from the same world region. ⁃ Concentration (CONC). Market concentration is another factor behind the destinations’ vulnerability (Bull and Weed, 1999; Sharpley, 2003). Concentration is an indicator of exposure typically found in the industrial organization and marketing literature. In this context, note that no matter the distance, concentrating the international demand in a reduced set of countries increases exposure because it implies fewer substitution possibilities, making a destination more vulnerable (Gallego and Font, 2019). We measure concentration by the % of international visitors accounted for by the main source market. ⁃ Seasonality (SEAS). Seasonality also increases vulnerability (Koo et al., 2016; Batista e Silva et al., 2018; Duro et al., 2021). The argument is analogous to that of market concentration, but in this case, for the temporal (monthly) approach. Destinations with a more homogeneous distribution of demand throughout the year may resist better the drop in demand (Batista e Silva et al., 2018). The greater concentration in specific months increases exposition, as implies fewer chances of reversing the effect of the shock if that occurs in the months when demand is concentrated (Koo et al., 2016). Seasonality is measured by the % of international visitors in the three busiest months.
Hazard and exposure
The second dimension of the risk index reflects the probability of physical exposure associated with specific hazards. Represents the load that the destination must deal with when exposed to a hazardous event. It is formed by the average of two external composite indicators provided by INFORM Risk (INFORM, 2022). ⁃ Natural hazards (NH): composite of individual indicators measuring the exposed population to earthquakes, tsunamis, floods, tropical typhoons, and droughts. ⁃ Human-made hazards (HH): composite of individual indicators measuring conflict intensity and projected conflict intensity, thus encompassing civil wars, high-intensity crime, civil unrest, as well as terrorism.
Readiness
Finally, the third dimension reflects the lack of coping capacity. It is, which issues the government has addressed to increase the resilience of the country and how successful their implementation is. Measures the destination’s capacity to cope with disasters. Like the HE subindex, the READ index is formed by the aggregation of two external composite indicators provided by INFORM Risk (INFORM, 2022). ⁃ Institutional (INST): composite index measuring the existence of disaster risk reduction plans in the country for assessing and monitoring disaster risks and enhancing early warning, together with other indicators of the governess’ effectiveness and corruption perception. ⁃ Infrastructure (INFRA): composite index of individual indicators of communications networks, physical infrastructure, and access to the health system, measuring the destination ability for emergency response and recovery.
To compute the MV indicators we rely on the OECD database (OECD, 2022). Our data covers the OECD and OECD partner countries except for New Zealand and Costa Rica due to data availability. 3 The reference year for the construction of the indices is 2019, which helps to overcome the influence of the COVID-19 pandemic on the proposed index. As noted above, the indicators for the HE and READ indices come from European Commission INFORM Risk (INFORM, 2022). A summary of indicators and variables is provided in the Appendix.
We make all indicators comparable by re-scaling them in a range [1, 7] orienting them towards lower risk. Thus, if the indicator


Consistent with the benchmark specification in equation (1), the risk index employs unweighted averages for aggregation. That is, normalized indicators are aggregated into their corresponding sub-indices


As a robustness check, we aggregate the eight individual indicators directly using weights obtained from Principal Component Analysis (PCA) in Section 4.4.
Benchmark competitiveness index
Once with a risk index at hand, we still need a competitive index that serves as a benchmark to adjust for risk. To do so, we rely on the index provided by the WEF, which has become the standard index for cross-country tourism competitiveness comparisons. To be consistent with the data used for the construction of the risk index, we employ the 2019 wave of the competitiveness index, but the results are robust to the use of 2021 (data available on request).
The value of the index provided by the WEF, however, is not directly comparable to the benchmark risk index because of normalization. 4 To overcome this issue, we recompute the index from its 14 pillars normalized to the 1–7 scale with Min-Max. The resulting index has virtually a one-to-one correlation (0.99) with the index provided by the WEF but is directly aggregable to risk using equation (1). Nevertheless, in the robustness section, we adjust by risk the actual competitiveness index provided by the WEF using geometric averaging, which remains appropriate even when the indicators have different units of measure.
Results
The tourism and travel risk index
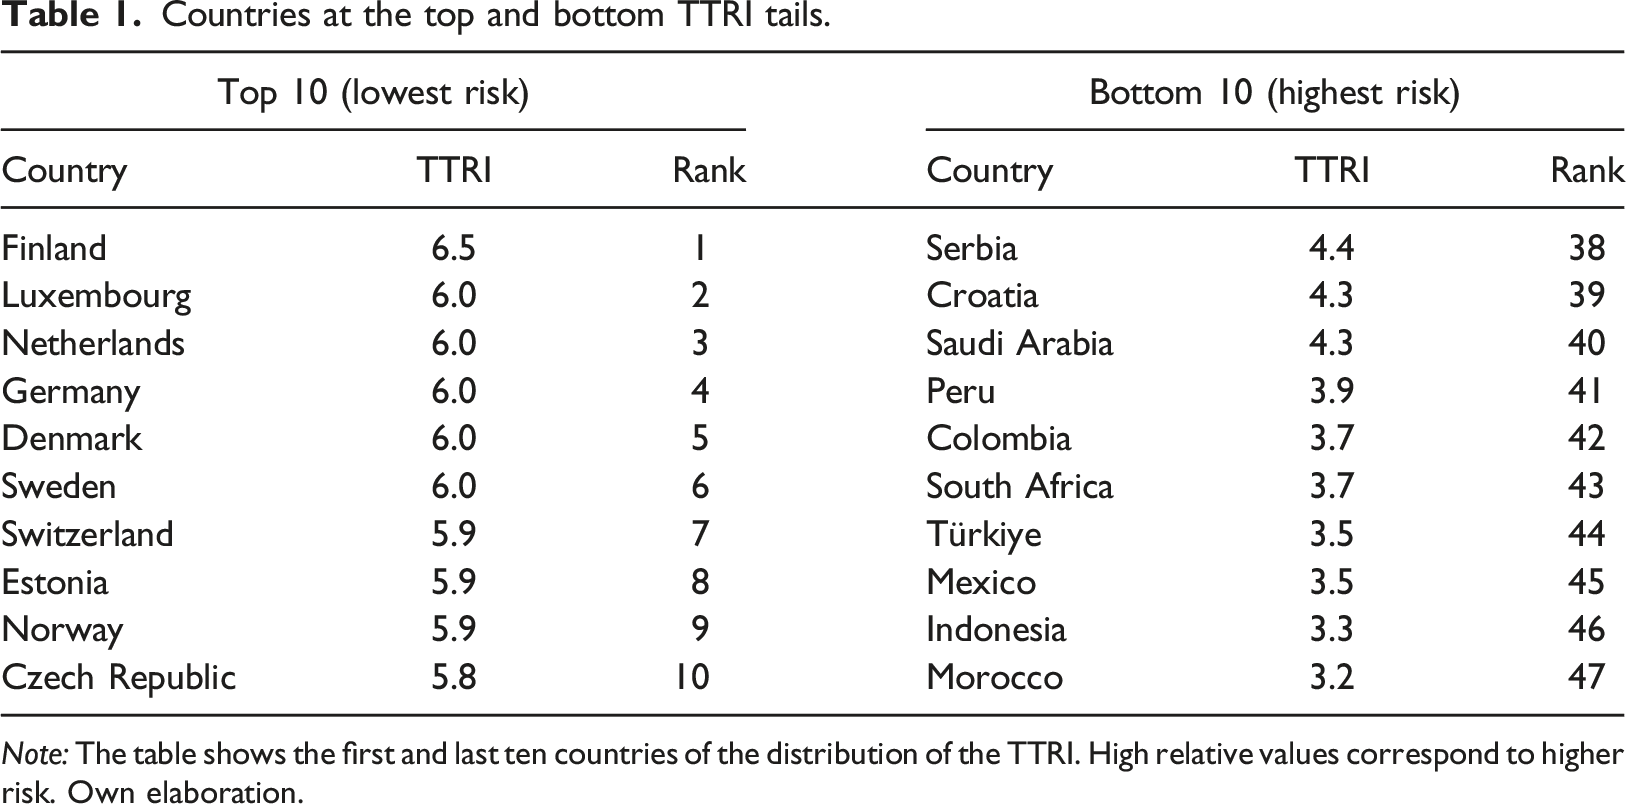
Figure 3 maps the values of the computed Tourism and Travel Risk Index (TTRI), computed as explained in Section 3.1. The value for the top and bottom ten countries of the distribution of the index are presented in Table 1. The specific results for all OECD and partner countries may be found in the Appendix. The tourism and travel risk index. Notes: The risk index is oriented towards lower risk. High values of the index (in green color) denote lower-risk OECD and partner destinations. Red areas denote high risk. Own elaboration. Countries at the top and bottom TTRI tails. Note: The table shows the first and last ten countries of the distribution of the TTRI. High relative values correspond to higher risk. Own elaboration.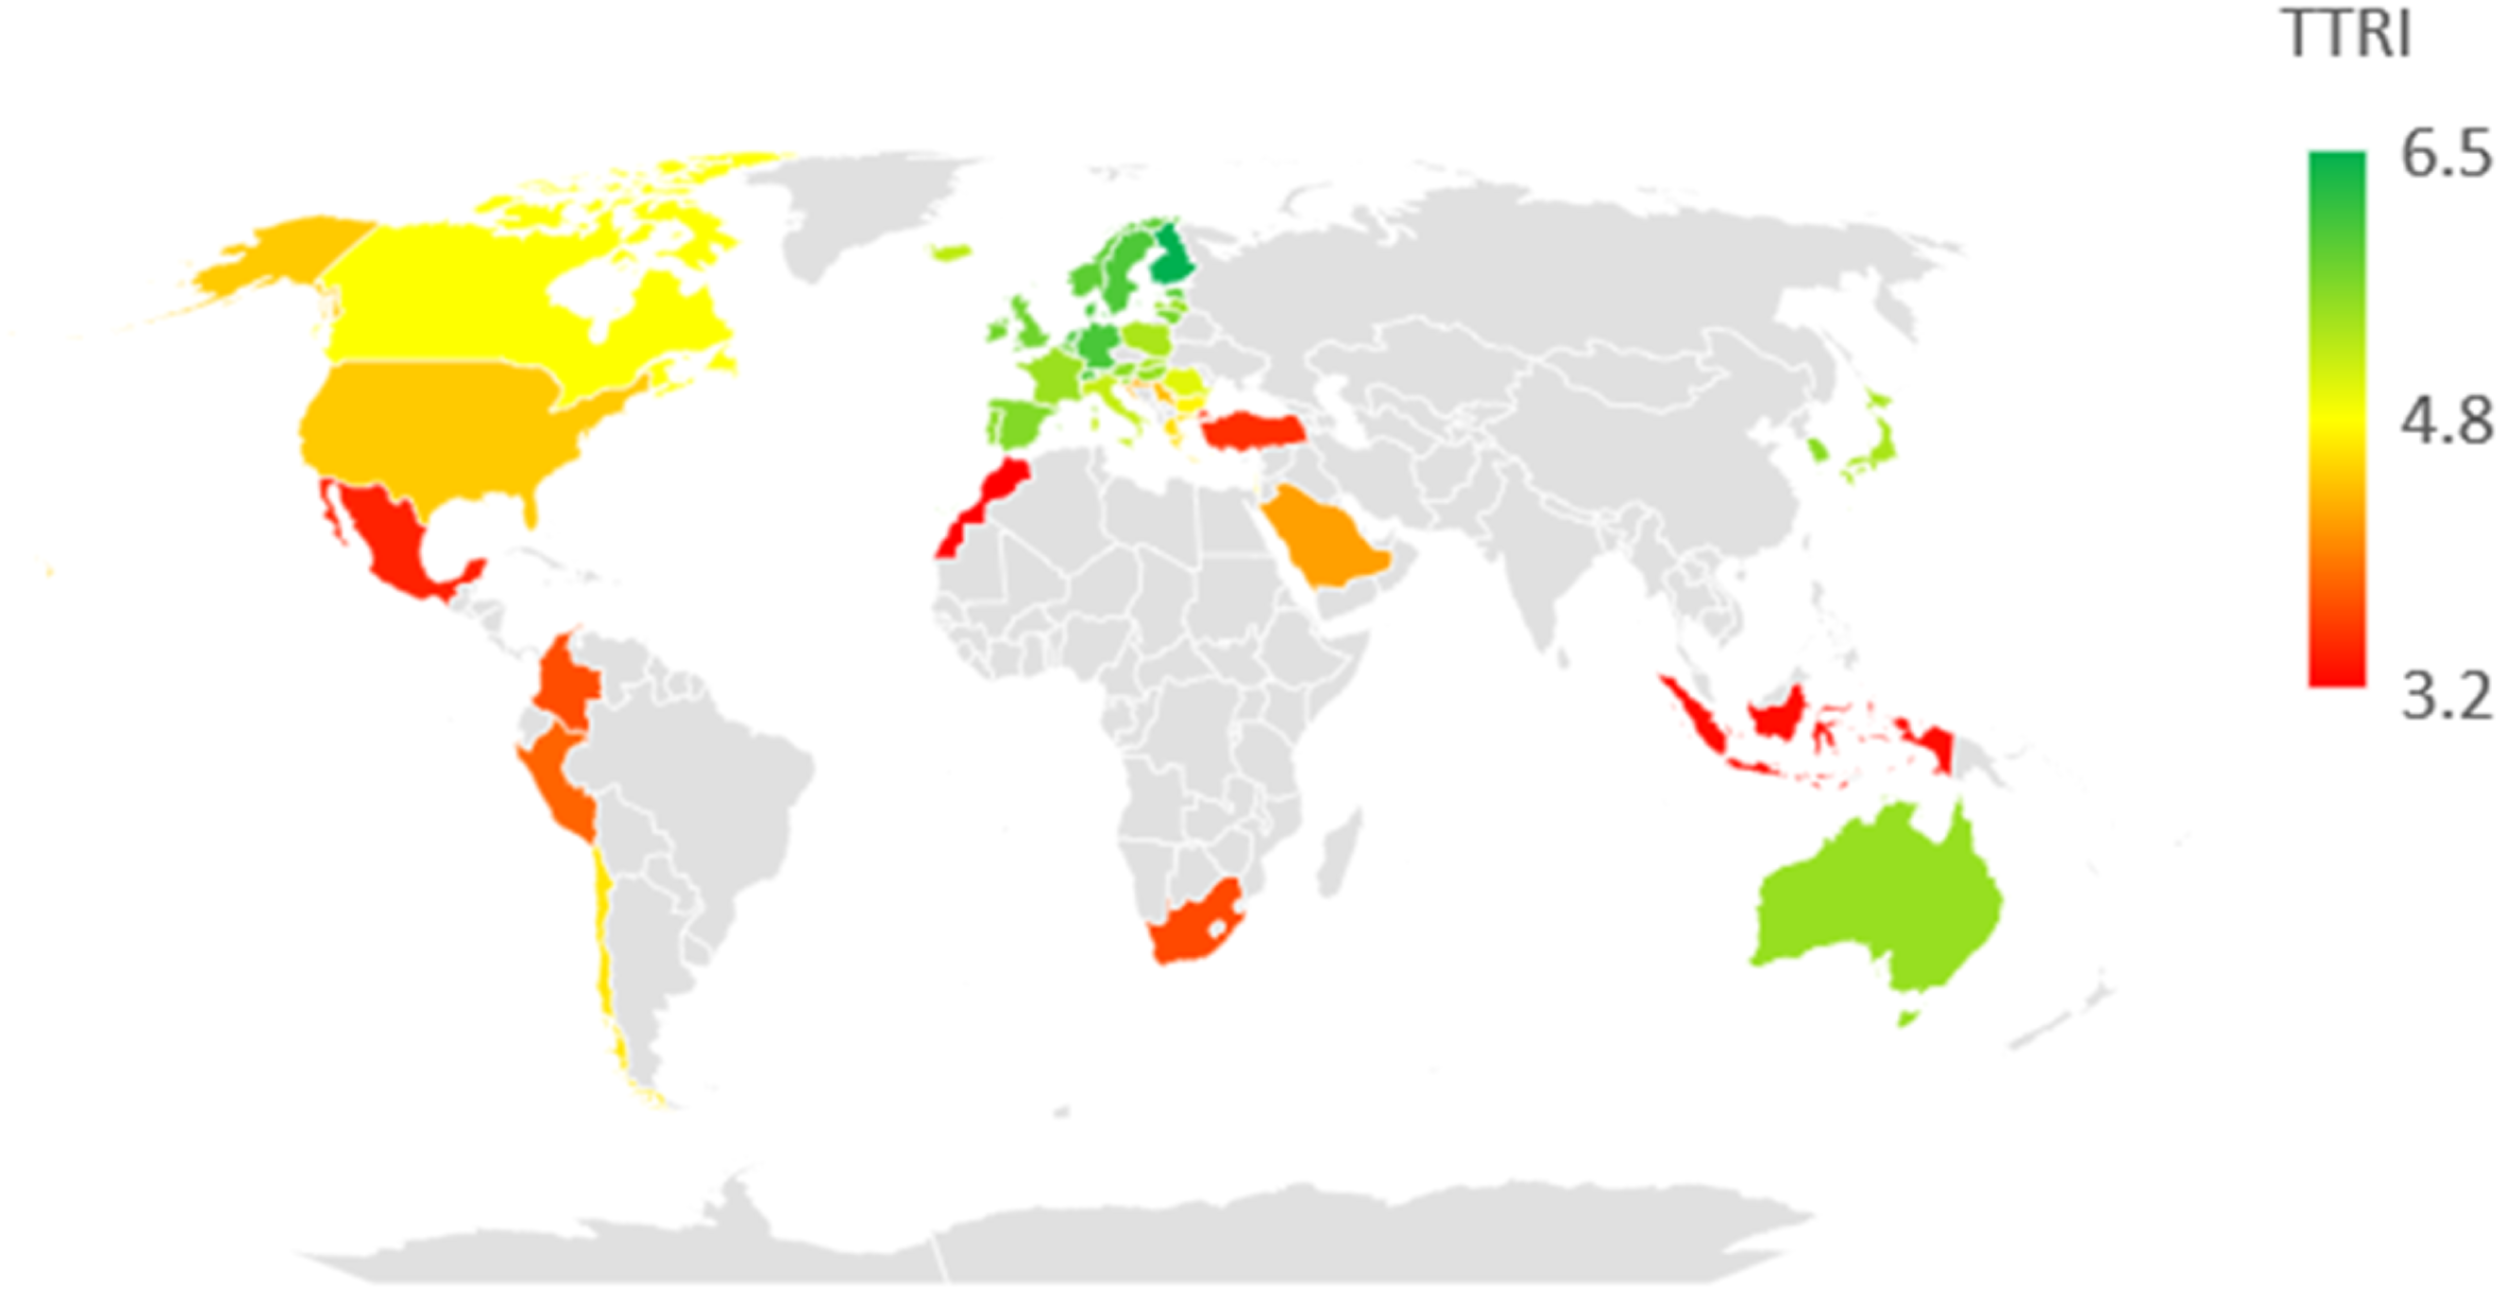
As Figure 3 shows, low-risk destinations concentrate mostly in European countries. Especially Northern European, which has lower relative intrinsic risk and higher coping capacity. Moreover, they usually have strong domestic and proximity markets, which are less vulnerable than distant. On the other hand, countries at the bottom of the distribution, such as Morocco, Turkey, or Mexico, typically have large exposure to risk and lack the coping capacity of northern European countries.
Particularly interesting is the relative position of the US. This country lies in a middle position according to Figure 3 even if it ranks very high in competitiveness indices, as it will be shown in the next subsections. This result is explained by the country's greater exposure to hazardous events. The position of Italy is also interesting. Yet with relatively low risk, Italy is the Western European country presenting the highest value of the risk index driven by an adverse market composition.
The tourism and travel competitiveness index
Figure 4 maps the value of the benchmark Tourism and Travel Competitiveness Index (TTCI) computed as explained in Section 3.2. Its value for the ten most and least competitive countries is presented in Table 2. Again, details for all OECD and partner countries might be found in the Appendix. The tourism and travel competitiveness index. Notes: The risk index is oriented towards higher competitiveness. High values of the index (in green color) denote more competitive OECD and partner destinations. Red areas denote low competitiveness. Own elaboration. Own elaboration of the TTCI using data from the WEF. Countries at the top and bottom TTCI tails. Note: The table shows the first and last ten countries of the distribution of the TTCI. High relative values correspond to higher competitiveness. Own elaboration.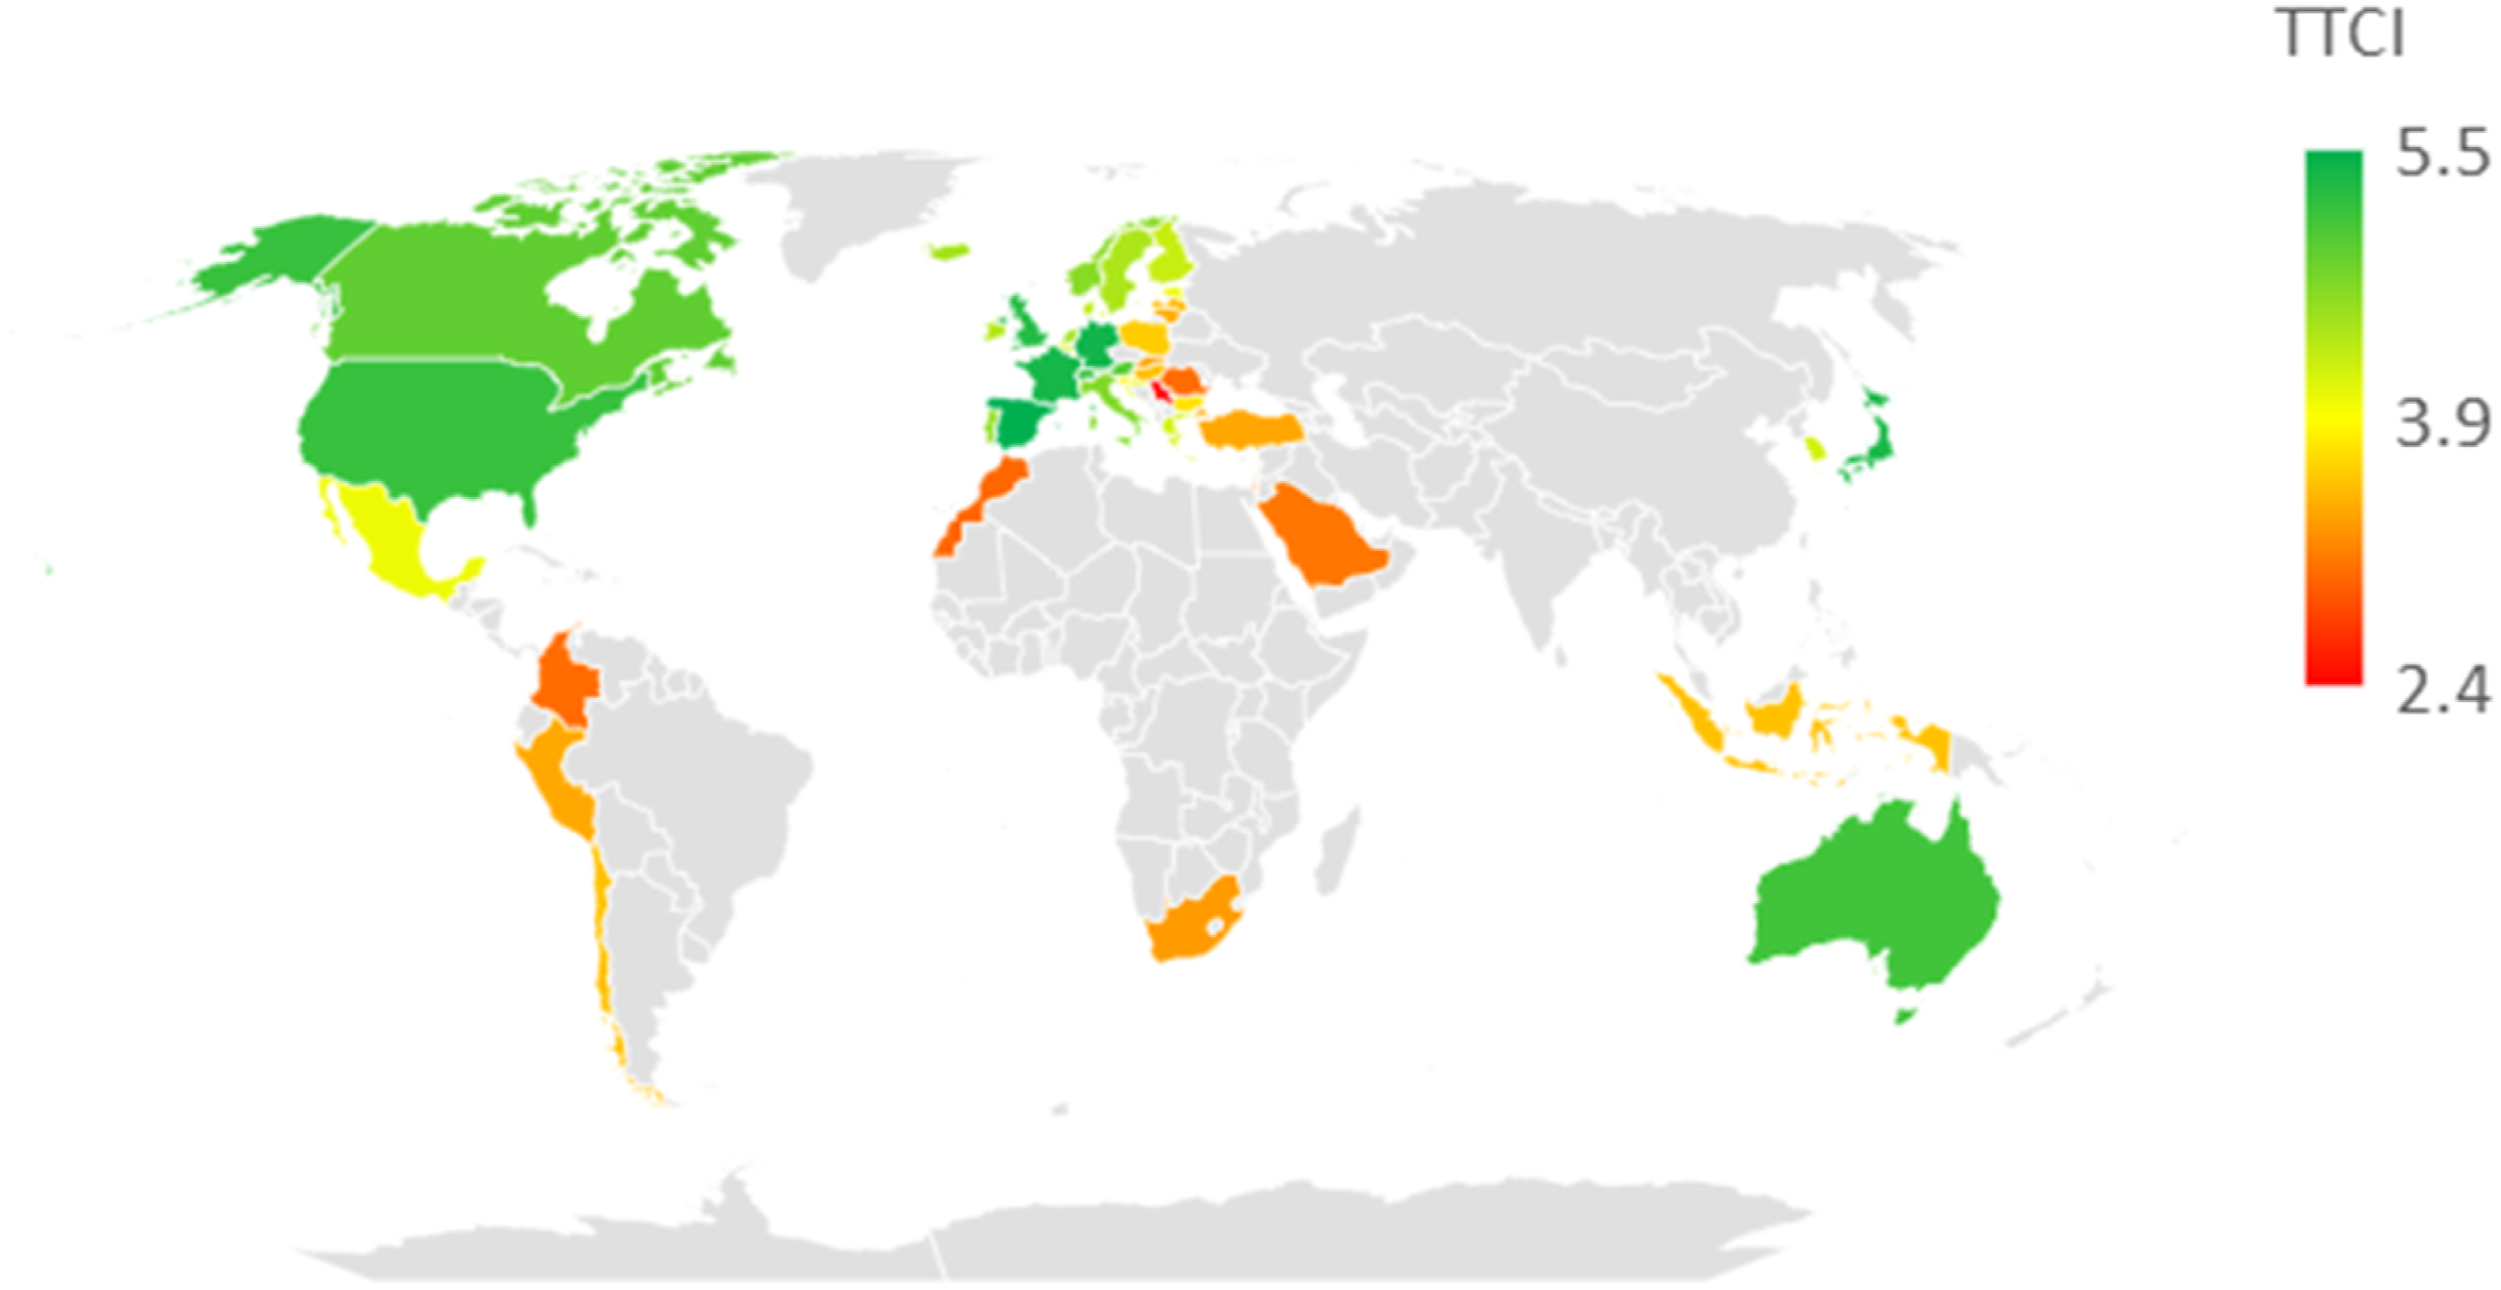
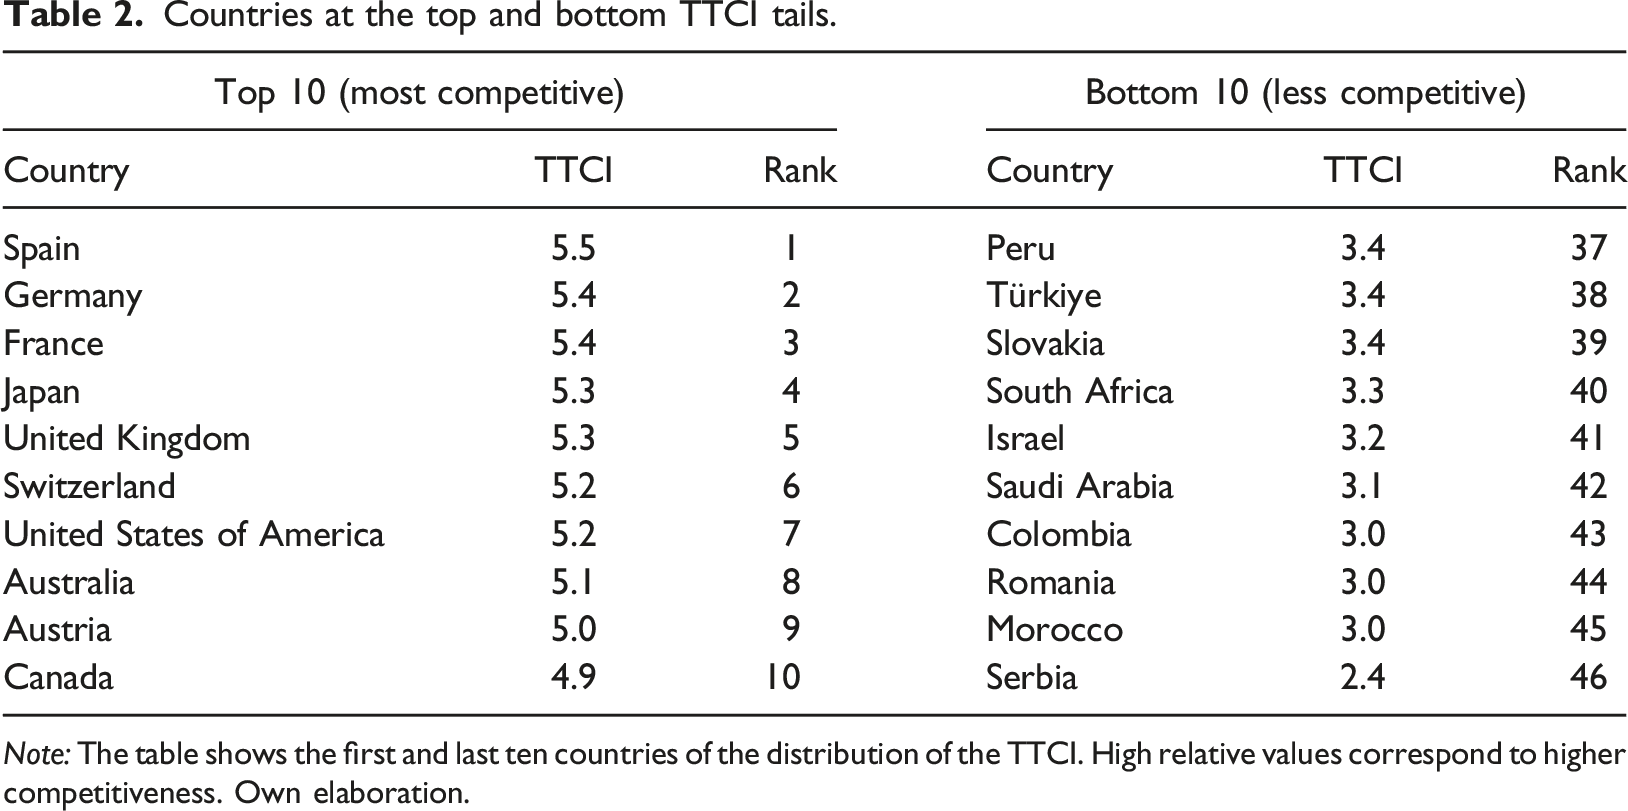
As noted in Section 3, our benchmark competitiveness index virtually yields the same distribution as the one provided by the WEF, but it is directly aggregable with risk. Spain, Germany, and France fill the top positions of the ranking while Romania, Morocco, and Serbia are the less competitive destinations among OECD and partner countries. Yet, the interesting question here is how competitiveness relates to risk. It is expected that the two indices correlate positively, that is, more competitive countries tend to present lower tourism and travel risk. However, results in Table 2 indicate that the relationship is far to be one to one, as destinations in the upper and lower quartiles of the competitiveness index do not correspond to those for the risk index in Table 1. The correlation between the two indices is far to be one (0.58), implying that the risk explains only about one-quarter of the variability in competitiveness across destinations (R-squared = 0.28). The correlation of the competitiveness index with some of the risk components, such as the market vulnerability, is virtually zero, consistent with the results found in recent literature (Duro et al., 2021, 2022b).
The risk-adjusted travel and tourism competitiveness index
Once we have discussed the two intermediate indices, we provide details of the proposed Risk-Adjusted Tourism and Travel Competitiveness Index (RA-TTCI), where we aggregate risk and competitiveness into a single index according to equation (1). Results are presented in Figure 5 and Table 3. Once more, the specific values for all OECD and partner countries are in the Appendix. The tourism and travel risk-adjusted competitiveness index. Notes: Higher values of the index (in green color) denote more competitive countries once adjusted for risk. Own elaboration. Countries at the top and bottom RA-TTCI tails. Note: The table shows the first and last quartile of the TTCI computed for OECD and partner countries. High relative values correspond to higher competitiveness. Own elaboration.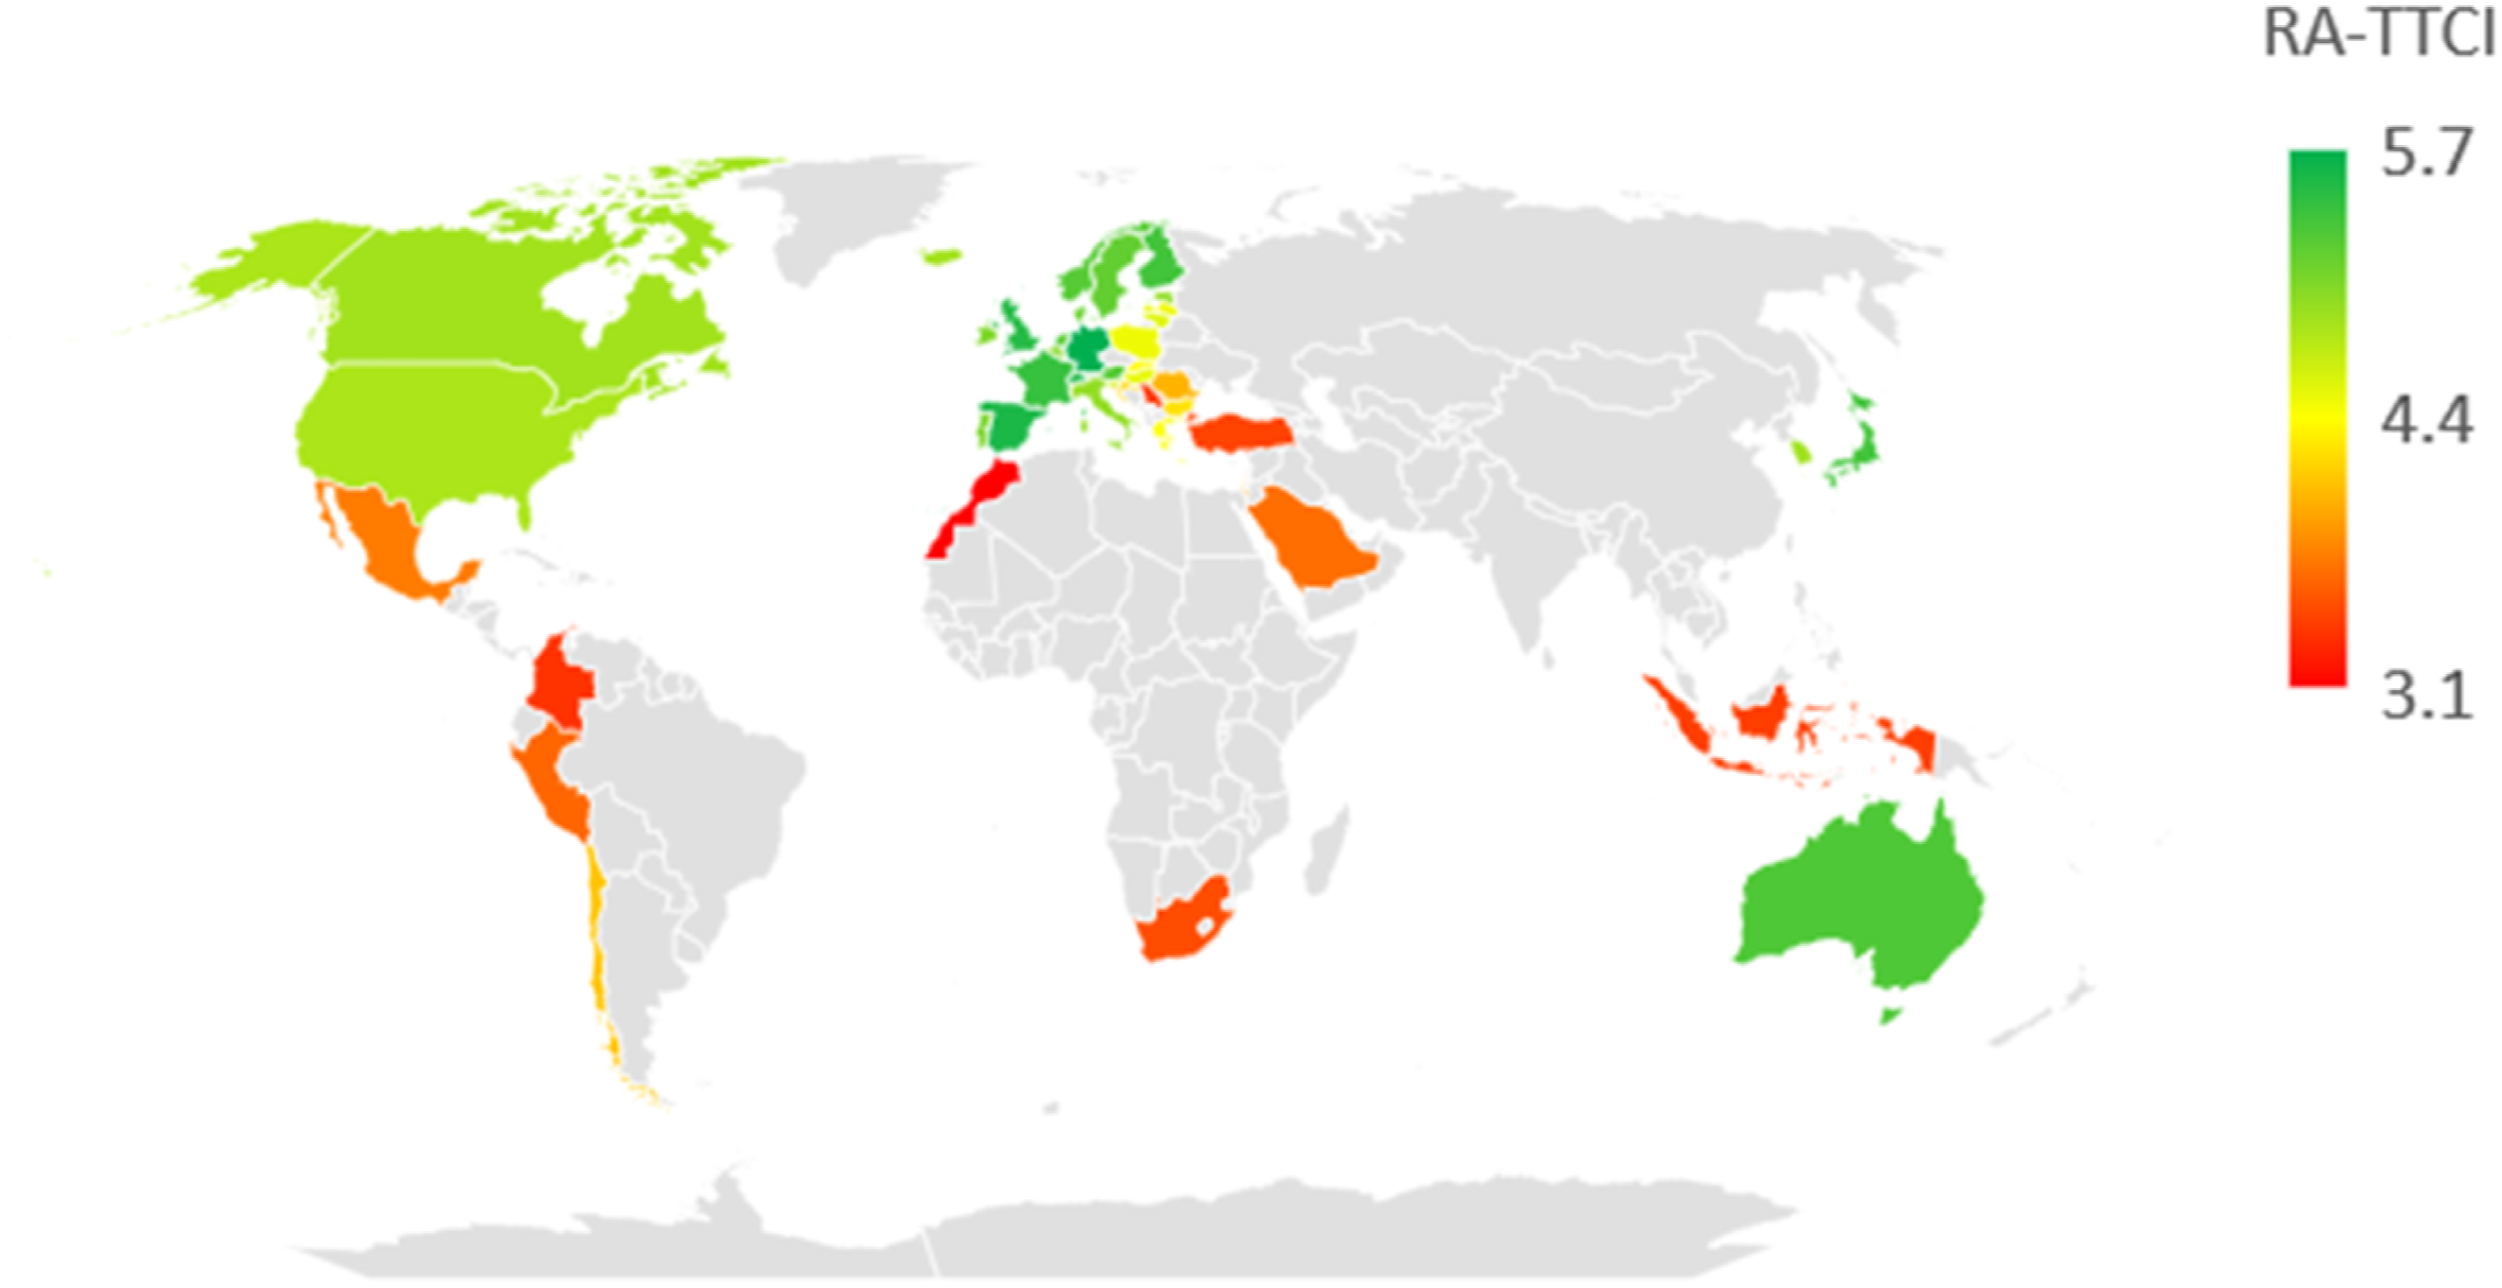
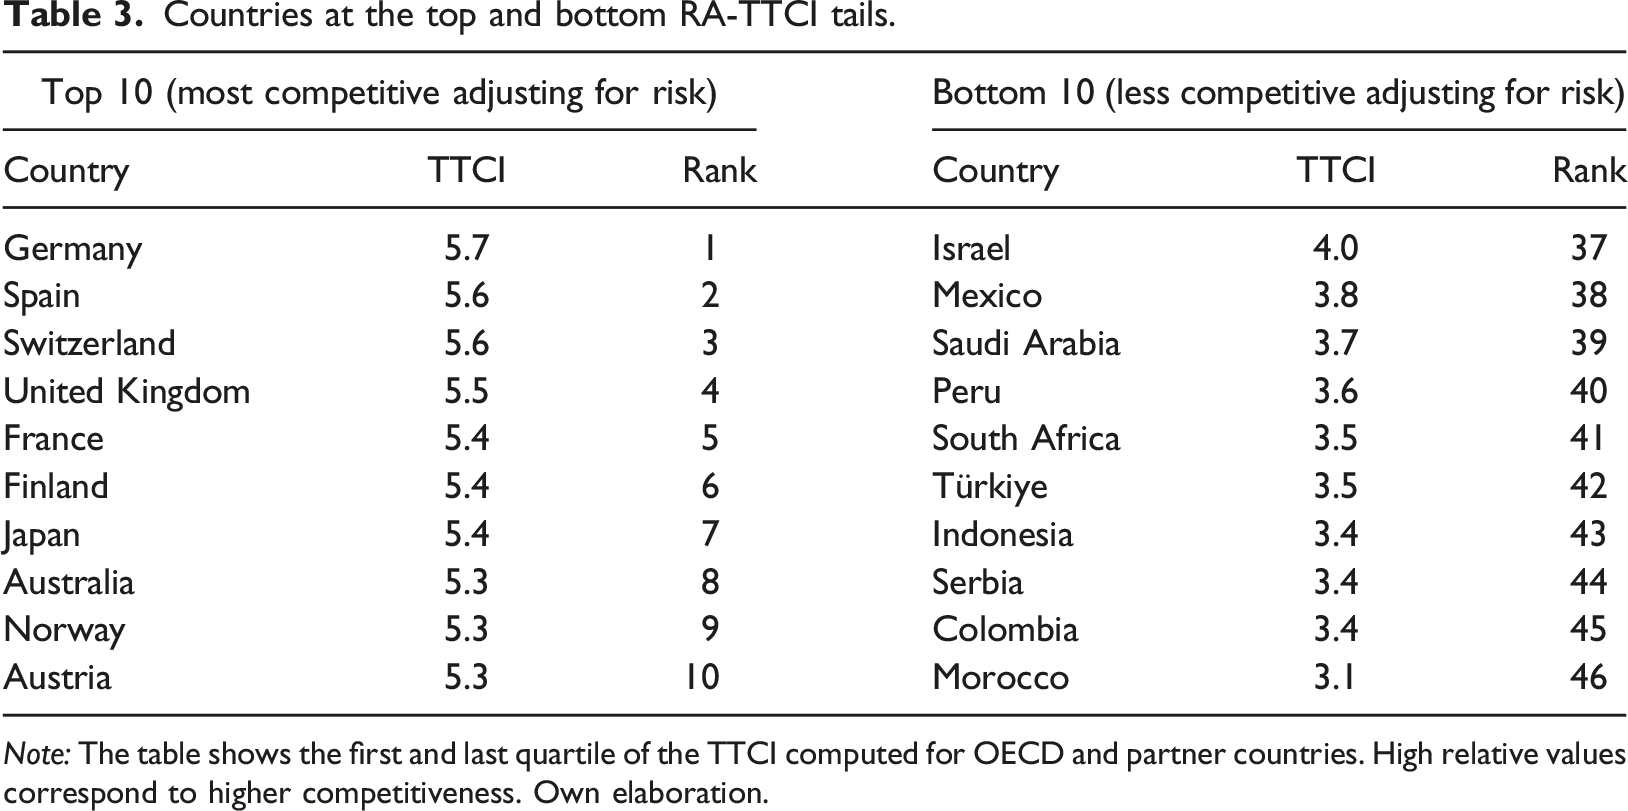
The resulting distribution of the risk-adjusted competitiveness index is not far from the unadjusted version presented in Figure 4. Many countries in the upper and lower tales of the distribution of the competitiveness index in Table 2 are also present in Table 3. However, not all countries coincide between the two tables and, most importantly, there seems to be a substantial change in ranking.
To understand better the effect of adjusting competitiveness by risk, Figure 6 depicts the relationship between the three indices. As Figure 6 shows, the resulting composite is positive and strongly related to both risk and competitiveness (correlations of 0.88 and 0.86, respectively) even if the relationship between risk and competitiveness is not particularly strong, as shown in the previous section (correlation equal 0.52). Relationship between risk, competitiveness, and risk-adjusted competitiveness. Notes: Association between the risk and competitiveness (a), risk and risk-adjusted competitiveness (b), and competitiveness and risk-adjusted competitiveness (c); ρ = correlation coefficient. *, **, *** state for significance at 10, 5, and 1%. Own elaboration.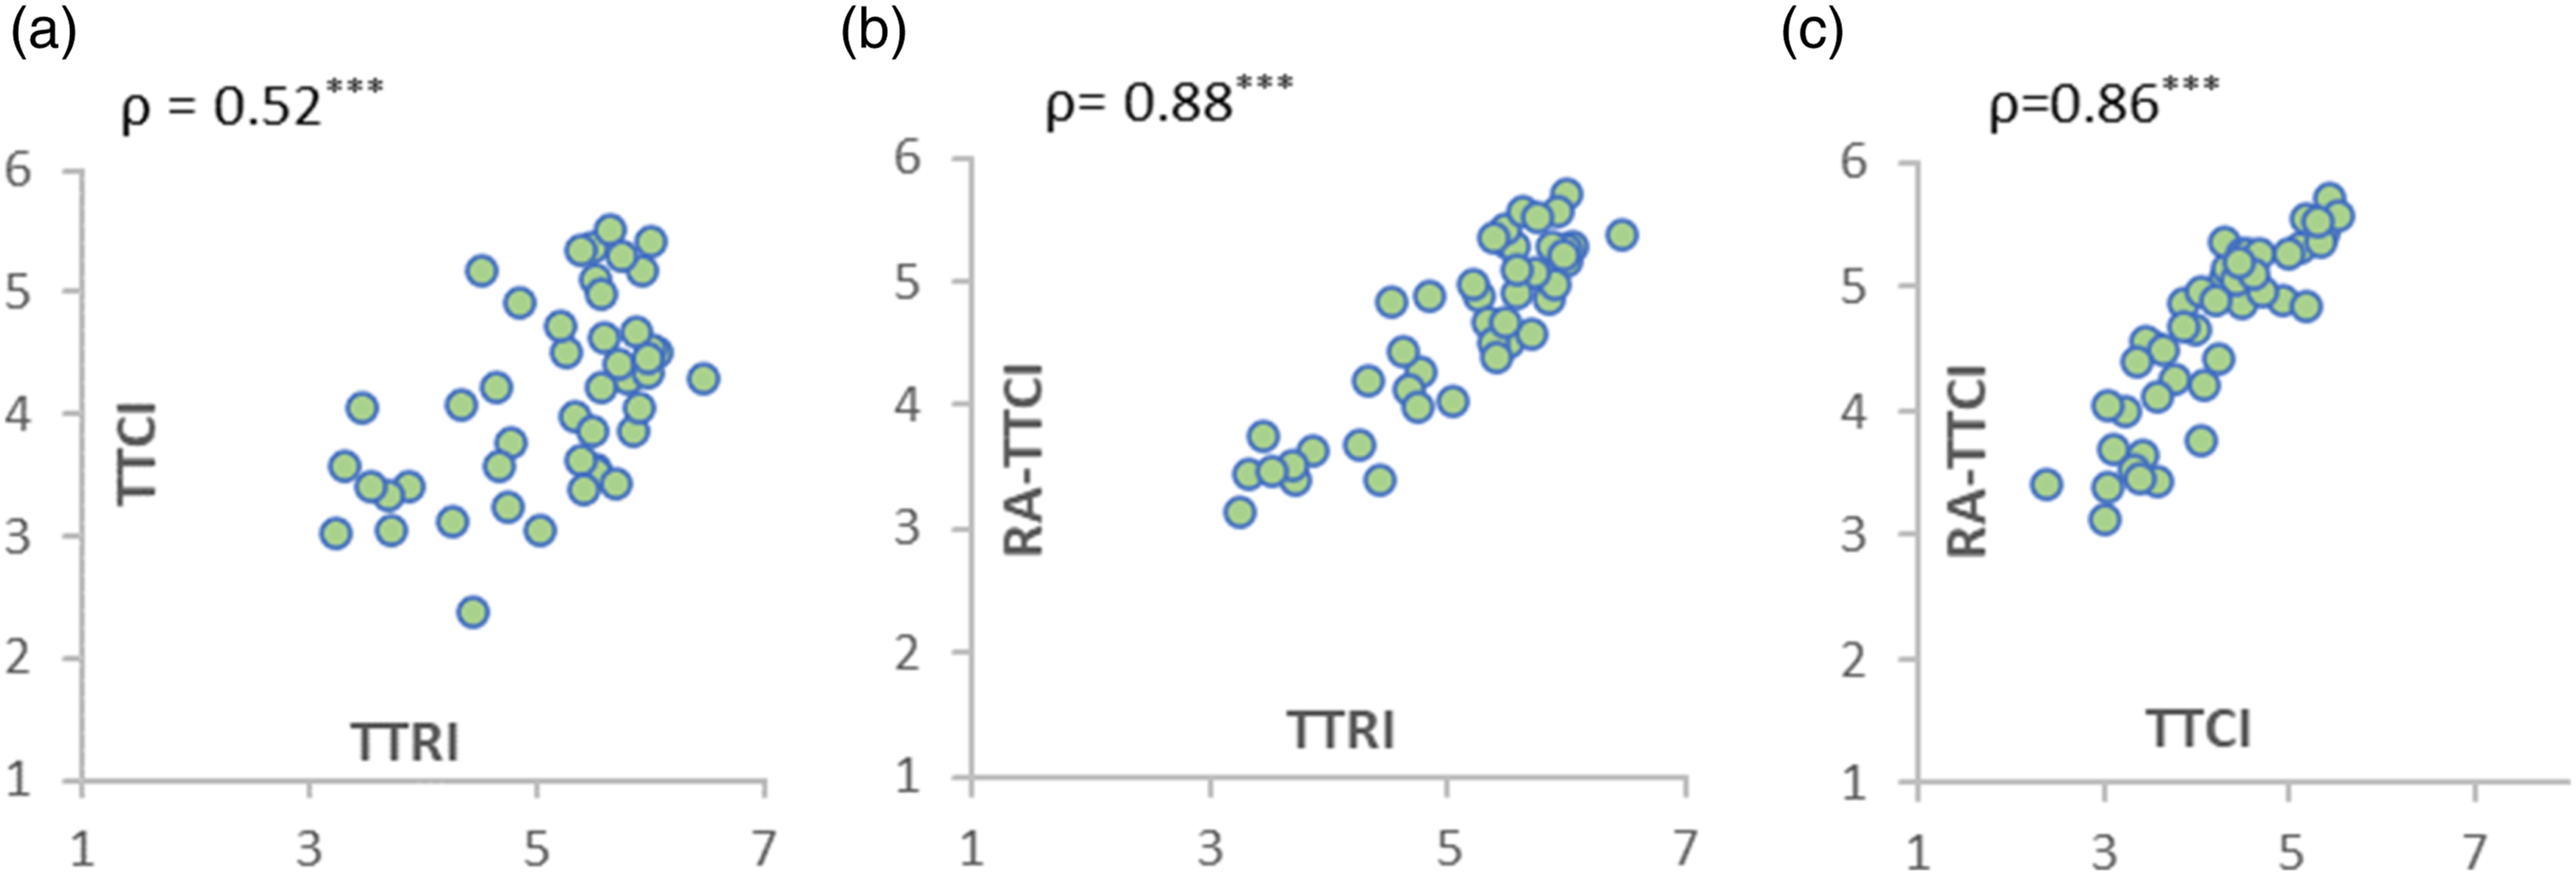
This result indicates that there is individual information contained in sub-indices that is brought to the final composite. As a result, adjusting by risk does not dramatically distort the distribution of competitiveness—which is important because we still want the final composite captures this dimension—but the aggregation is not neutral—there are important changes in the ranking of destinations.
Changes in rank ordering: Most and least favored.
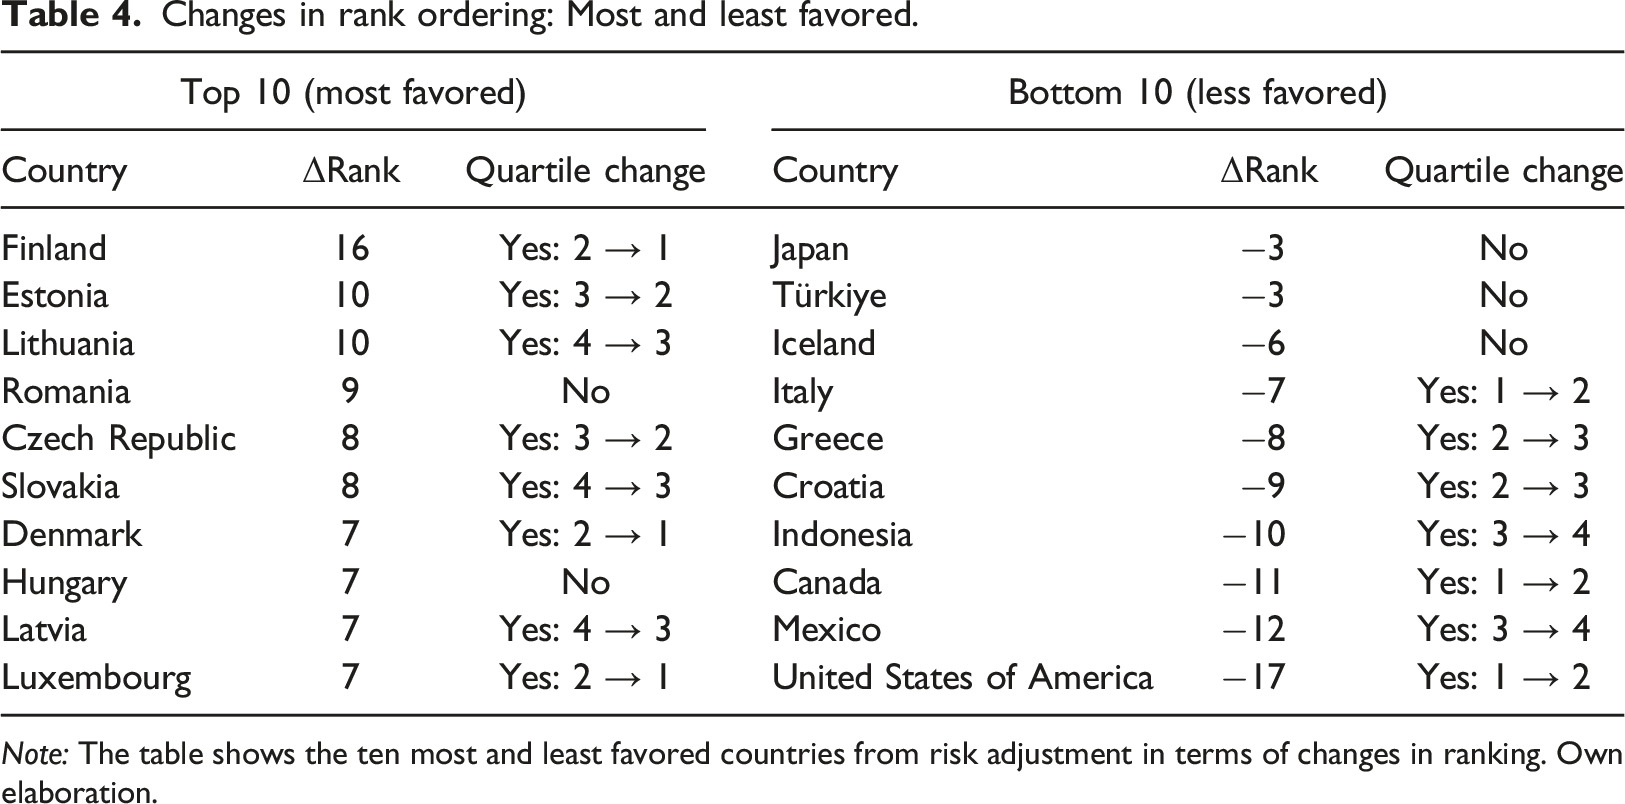
Note: The table shows the ten most and least favored countries from risk adjustment in terms of changes in ranking. Own elaboration.
As a last step in the analysis, we assess if the risk-adjusted competitiveness index has more information to explain Covid-19 resilience than the unadjusted index. As noted in Section 1, the usual index does not contain information to anticipate the most affected destinations from the pandemic.
We do not expect the proposed risk-adjusted index to completely account for the observed heterogeneity either. On the one hand, the index is not meant to measure resilience but competitiveness (even if adjusted for risk). On the other, Covid-19 has been a very particular shock, while the risk-adjusted index is aimed to be general. Important indicators for Covid-19 resilience, such as pandemic incidence or health policy strategies, have not been considered.
Nevertheless, as far as we have correctly accounted for vulnerability, even if from a general point of view, adjusting competitiveness for risk should improve the capacity to explain the 2020 drop in demand to some extent. To evaluate this hypothesis, Figure 7 presents the correlation between the percentage change in international and domestic tourism demand from 2020 to 2019 and the two competitiveness indices, both the adjusted and the unadjusted versions. Correlation between the % change in 2020 tourism demand and the TTCI and RA-TTCI. Notes: Correlation between the % change in 2020–2019 demand and the competitiveness (TTCI) and risk-adjusted competitiveness indices. *, **, *** state for significance at 10, 5, and 1%. Own elaboration.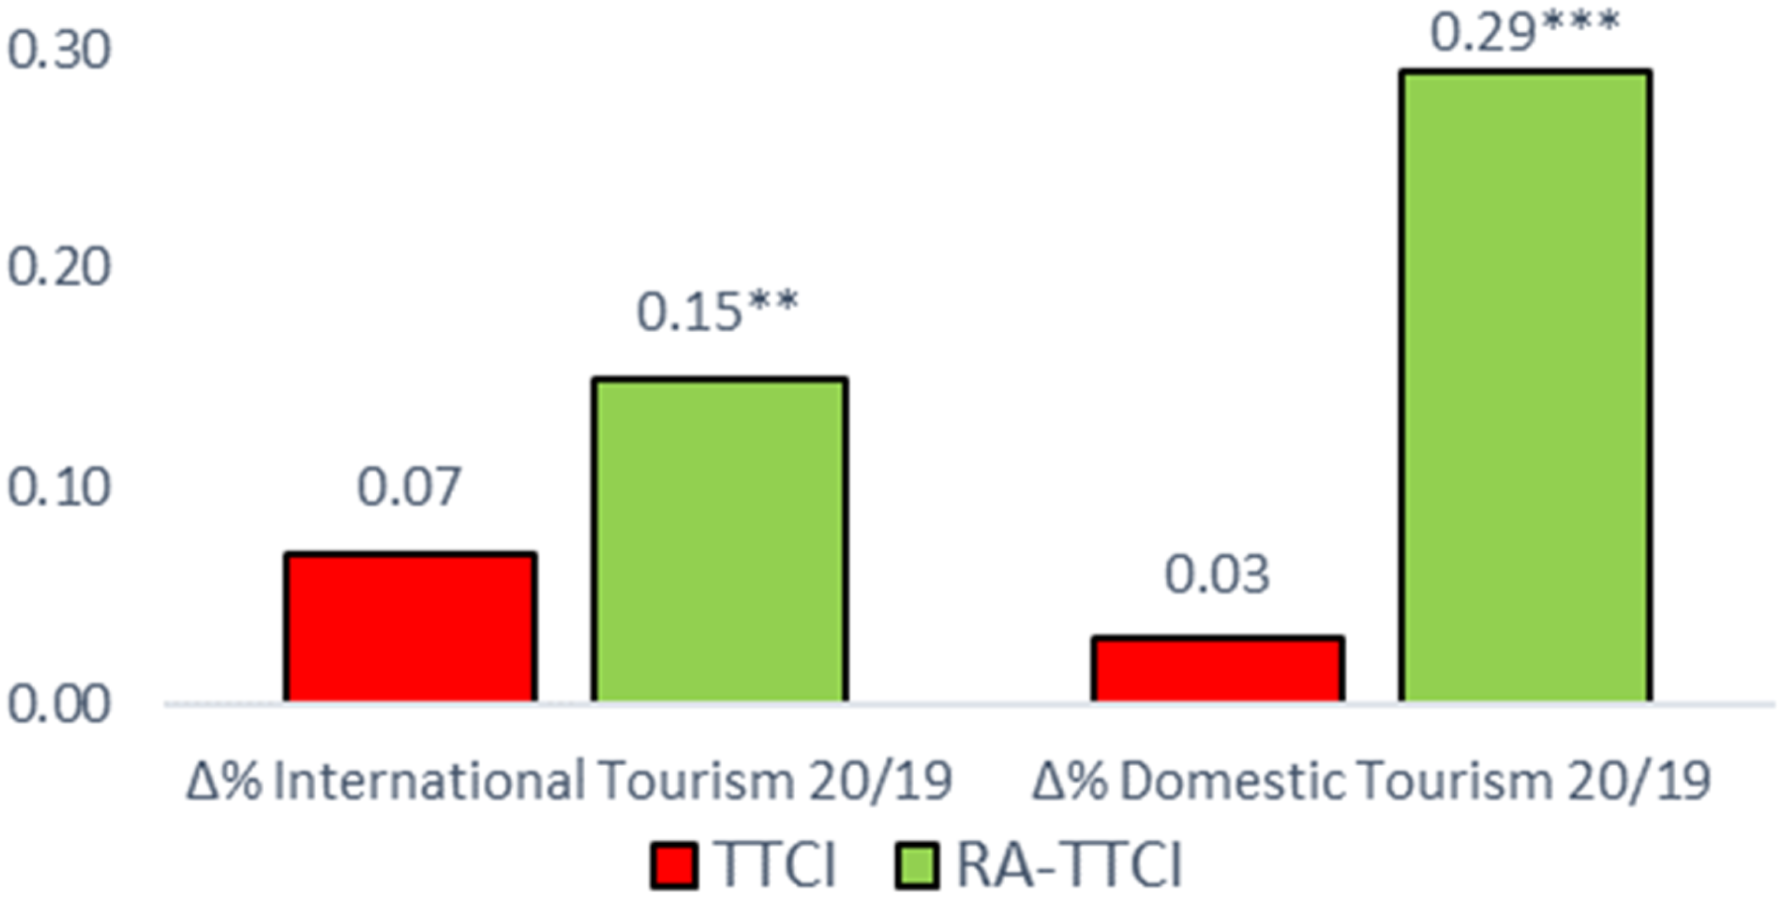
As the figure shows, the correlations are positive, implying that, smaller drops (less negative changes) tend to be related to competitive destinations. However, the estimated correlation parameters for the unadjusted index are small, and not statistically different from zero. That is, the usual competitiveness index has statistical power to explain neither the international nor the domestic 2020 demand drop.
As conjectured, adjusting competitiveness by risk increases the explanatory, and correlations become larger, especially with the domestic market. More importantly, the correlation coefficients are both statistically different from zero at the usual significance levels, implying that the proposed composite does have explanatory power to anticipate the most vulnerable destinations to Covid-19.
Thus, this is a surprisingly good result considering the specificity of the Covid-19 shock and the strong association of the risk-adjusted index with the standard notion of competitiveness (recall that the correlation with the unadjusted index is large).
Robustness
In this section, we analyze the sensitivity of the results to some of the discretionary choices made in the previous sections. To start, we study if the benchmark risk index in Section 3.1 is robust to the weighting methodology. As discussed in equations (4)–(7), we construct the benchmark index by sequentially aggregating the individual indicators into the intermediate indices using unweighted averages and averaging these intermediate into the final risk index.
Non-weighted average is the most used methodology for constructing composite indices, justified by the lack of consensus on a weighted alternative. However, there are common data-driven alternatives that derive weights avoiding subjective weightings, such as principal component analysis (e.g., Santero-Sanchez et al., 2015; Duro et al., 2021), the data envelopment analysis (e.g., Chercheye et al., 2007; Blancard and Hoarau, 2013), or the P2 distance method (e.g., Somarriba and Pena, 2007).
We employ Principal Component Analysis (PCA) to derive weights for risk indicators following the methodology in Nicoletti et al. (2000). PCA is a multivariate method that linearly transforms the original indicators into orthogonal variables (principal components) ordered in decreasing overall explained variance. Unlike classical techniques, the method in Nicoletti et al. (2000) derives weights from more than one component, being useful in many empirical applications where the largest component does not capture enough portion of the overall variance. Further details of the method might be found in the OECD Handbook on Constructing Composite Indicators (OECD, 2008).
Selected robustness results.
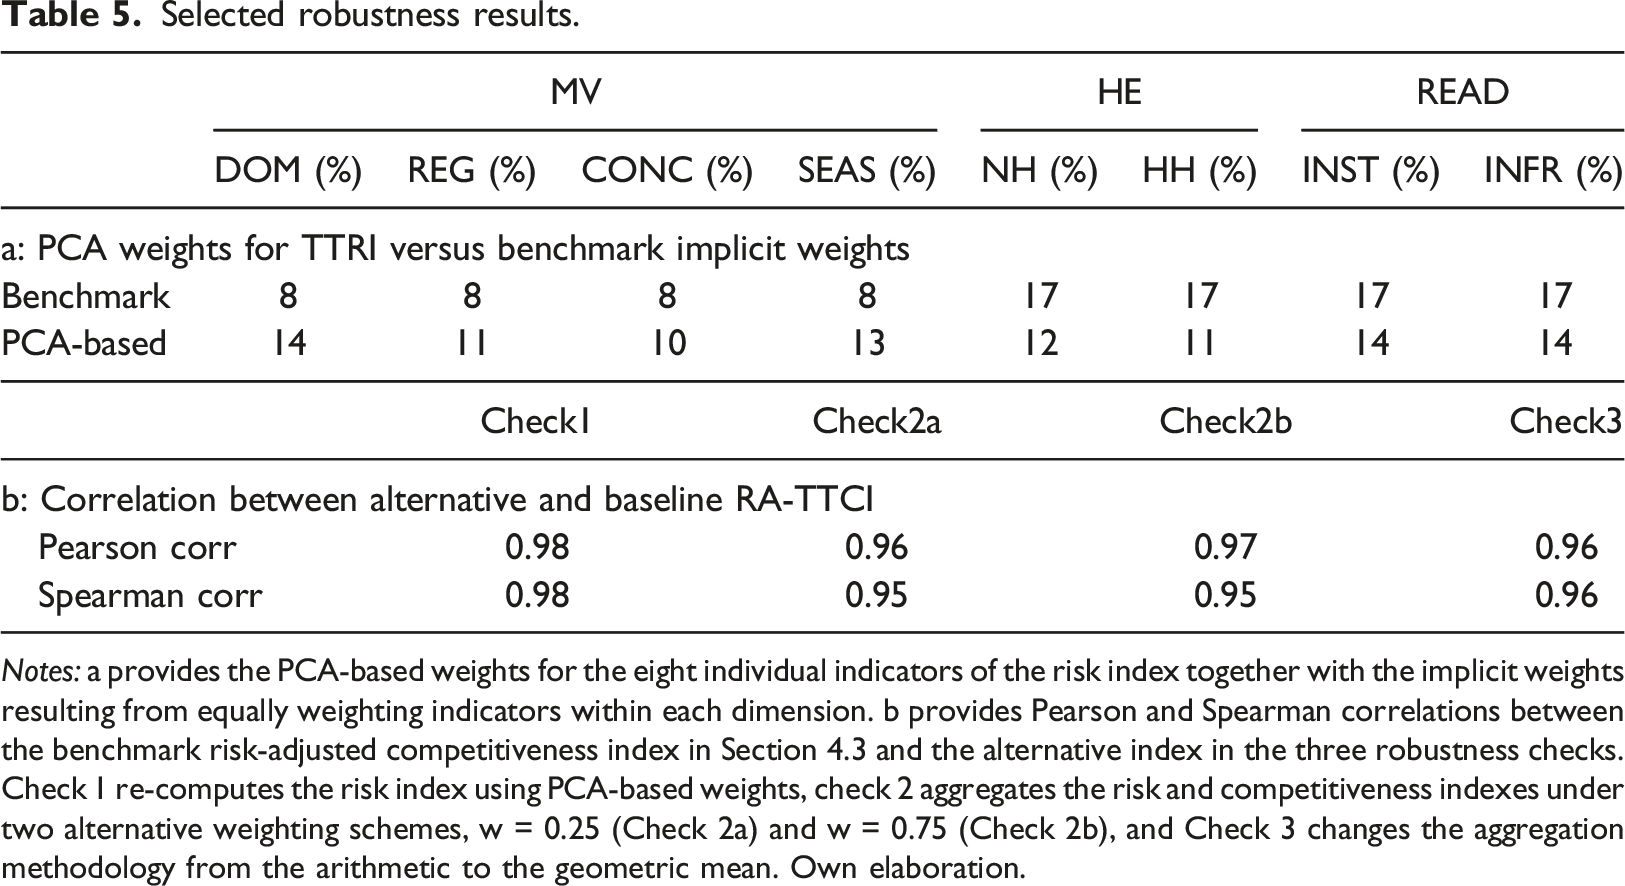
Notes: a provides the PCA-based weights for the eight individual indicators of the risk index together with the implicit weights resulting from equally weighting indicators within each dimension. b provides Pearson and Spearman correlations between the benchmark risk-adjusted competitiveness index in Section 4.3 and the alternative index in the three robustness checks. Check 1 re-computes the risk index using PCA-based weights, check 2 aggregates the risk and competitiveness indexes under two alternative weighting schemes, w = 0.25 (Check 2a) and w = 0.75 (Check 2b), and Check 3 changes the aggregation methodology from the arithmetic to the geometric mean. Own elaboration.
The second check also concerns weighting but focuses on the aggregation of the risk and competitiveness indices in equation (1). Unlike with the previous check, we do not employ PCA because it trivially delivers equal weights in the case of two variables.
5
As an alternative to the benchmark unweighted average, we consider two opposite possibilities. The first one places one-third weight on the risk index
Finally, the last check completely changes the aggregation methodology and uses geometric means instead of arithmetic. Given a set of numbers 
Geometric aggregation is used for indicators that are exponential in nature or are supposed to be multiplied together. For example, from 2020 on, the UN Human Development Index uses a geometric mean to aggregate Life Expectancy, Education, and Income indices. For positive different values, the geometric mean is always below the arithmetic. It also has two interesting features for the robustness check in this section. First, it penalizes larger discrepancies further than the arithmetic mean, making it more difficult to substitute one entity with another. Second, it can be applied even when variables are measured in different units. In this way, we can rely on the actual values of the competitiveness index provided by the WEF to form the risk-adjusted composite.
We first employ the geometric average to derive an alternative version of the risk index using sequential aggregation. However, unlike in equations (4) to (7), we employ the geometric average. The resulting risk index also correlates strongly with the benchmark risk index in Section 3.1 (the correlation coefficient is 0.97). Thus, the risk index is sensitive neither to the weights, as shown in the first check, nor to the aggregating methodology employed in its construction. Further, if the alternative risk indicator with geometric averaging is aggregated to the original WEF competitiveness index to adjust the latter by risk (also using a geometric mean), the resulting composite strongly correlated with the benchmark, as shown in the last row of Table 5b (Check 3).
Results in Table 5b indicate that changes in the weighting schemes nor the aggregation methodology fundamentally alter the distribution of the benchmark risk-adjusted index across countries. Yet, it does not imply that these changes are neutral, as specific countries might become affected, especially under Check 2, which substantially modifies the strength of the adjustment. For example, the US, penalized by risk adjustment due to its relatively high exposure to natural hazards, loses (increases) positions if the aggregation places a higher (lower) weight on risk. Up to a lower extent, this is also true under Check 3, as the geometric aggregation makes it more difficult to compensate one dimension with another. However, overall, the proposed risk-adjusted competitiveness index became largely unaffected by sensitivity checks, indicating that the results obtained in the previous sections are robust.
Conclusions and implications
The need for strategic regional planning and management leads to the concept of destination competitiveness. It was acknowledged that a competitive destination should be able to capture a higher share of tourism demand compared to its competitors in the context of global tourism growth. But how should a competitive destination behave in a context of a world tourist demand crisis and negative shock? According to the theoretical underpinnings analyzed and assuming the symmetry of the concept of TDC, competitive destinations should be better able to withstand drops in demand, and less competitive countries should suffer more from a world tourism demand crisis. However, the recent COVID-19 pandemic episode and the impact of international tourism demand at the country level do not show this expected behavior up to now. Consequently, this study seeks to investigate the paradox observed because of the tourism data after CoVID-19 in which the countries traditionally classified as the most competitive have not been the ones that have best resisted the impact of the pandemic. It is of foremost significance for tourism managers to understand the response of the tourism sector to uncertainties and shocks and develop strategies to moderate the vulnerability and boost resilience.
Because the concept of risk had been fairly neglected in TDC destination rank studies despite the upward trend in the number of variables included in the analysis, we have reviewed the factors included in the competitiveness by including a specific risk pillar. To do so, we have computed a risk index for OECD and partner countries that we employ to adjust competitiveness by risk. The proposed risk indicator does not present an especially high correlation with competitiveness, thus bringing new information to the risk-adjusted composite.
Our results show that country rankings become largely affected by the explicit inclusion of risk in competitiveness indices. OECD destinations with large tourism markets, such as the US, Italy, Mexico Turkey, and Greece suffer from risk adjustment, dropping many positions in competitiveness rankings. On the other side, Northern European countries, such as Finland or Denmark, and some Eastern European, such as Estonia, Lithuania, and Slovenia, result largely benefited, raising an important number of positions.
Our proposal must be conceived as an initial step to obtain richer competitiveness measures, in this case, focused on risk. Nevertheless, our work is not without limitations. Destination risk has many aspects and can be motivated by many factors, including natural disasters, terrorism, climate change, and infectious diseases… Evaluating the vulnerability of a destination is not the same as one or another factor. Future work should investigate other forms of vulnerability associated with other factors to improve TDC indicators and perhaps distinguish those risk factors that are within the “tourism-led vulnerability hypothesis” (and consequently tourism is considered an enhancer) from those that are not.
Finally, we must be aware that the study is restricted to OECD and partner countries which have allowed us to use comparable data and focus on a homogeneous set of countries. Although these countries represent a large portion of the World’s international demand (2/3), the WEF TTCI index considers a substantially largest set. Future work must therefore study whether our results can be extended to a broader set of countries. Alternatively, it would be also interesting to focus on less aggregated territorial units for the analysis, such as regions. We consider these important avenues for future research.
Supplemental Material
Supplemental Material - Towards a risk-adjusted tourism and travel competitiveness index
Supplemental Material for Towards a risk-adjusted tourism and travel competitiveness index by Juan Antonio Duro, Melchor Fernández-Fernández, Alejandro Pérez-Laborda, and Jaume Rosselló-Nadal in Tourism Economics.
Footnotes
Declaration of conflicting interests
The author(s) declared no potential conflicts of interest with respect to the research, authorship, and/or publication of this article.
Funding
The author(s) disclosed receipt of the following financial support for the research, authorship, and/or publication of this article: We acknowledge the Agencia Estatal de Investigación (AEI) for supporting the project PID2019-106738GB-I00/MCIN/AEI/10.13039/501100011033 and Euroregion Pyrenees Mediterranean for supporting the project “Vulnerabilitat turística a la regió EPM: anàlisis i estratègies de resiliència futura.”
Supplemental Material
Supplemental material for this article is available online.
Notes
Author biographies
References
Supplementary Material
Please find the following supplemental material available below.
For Open Access articles published under a Creative Commons License, all supplemental material carries the same license as the article it is associated with.
For non-Open Access articles published, all supplemental material carries a non-exclusive license, and permission requests for re-use of supplemental material or any part of supplemental material shall be sent directly to the copyright owner as specified in the copyright notice associated with the article.