
Abstract
The widespread adoption of information and communication technologies has led to the emergence of new business models and increased competition among tourist destinations. In recent years, Smart Tourism Destinations (STDs) have started to leverage information and communication technologies to enhance the overall tourist experience, allegedly improving operational efficiency. The goal of this study is to empirically examine whether transforming a destination into an STD has indeed an effect on its productive efficiency, understood as those that achieve a higher volume of overnights stays given a set of inputs. The analysis is performed using panel data on 137 destinations in Spain in the period 2005–2021. Using Stochastic Frontier Analysis, our results show that becoming an STD does not have a significant effect on productive efficiency. Our analysis thus casts doubt on the common belief that STDs are more efficient and offer relevant implications for destination managers and policy makers.
Keywords
Introduction
Smart Tourism Destinations (hereafter STDs) can be conceptualized as those that take advantage of new technologies to collect data and transform it into business value, with a clear focus on efficiency, sustainability, and improving the tourist experience (Gretzel, 2021; Gretzel et al., 2015). The implementation of cutting-edge technology has been said to increase destination management efficiency by providing valuable information about tourists’ patterns, reducing costs, and offering more sustainable and enjoyable solutions (AENOR, 2018; Femenia-Serra et al., 2019). Big data analysis, the Internet of Things, artificial intelligence, and cloud data storage offer valuable insights into behaviour, commercial transactions, and human impacts, enabling real-time decision-making (Del Chiappa and Baggio, 2015; Huang et al., 2017).
A growing body of research has discussed the opportunities, advantages and disadvantages of STDs for destination planning and management (Buhalis and Amaranggana, 2014; Ivars-Baidal et al., 2019, 2024; Jovicic, 2019; Soares et al., 2022; Sustacha et al., 2024; Williams et al., 2020; Xiang et al., 2021). 1 In the short term, the transition towards an STD is expected to increase destination competitiveness and sustainability by applying intelligence to travellers’ needs before, during, and after their journey, making it more appealing (Jeong and Shin, 2020; Wang et al., 2013). In the medium to long term, STDs that make use of technological developments are said to be more efficient in their service production (Boes et al., 2016), which ultimately results in better tourist’s satisfaction and destination loyalty (Azis et al., 2020; Jeong and Shin, 2020). The extensive use of information and communication technologies can support destination efficiency, enriching and personalizing the tourist experience and driving innovation (Cerdá-Mansilla et al., 2024; Williams et al., 2020).
While there seems to be a theoretical consensus that the transition towards an STD should contribute to an improvement in tourism managerial and production efficiency, few studies have empirically addressed this issue (Ma et al., 2023; Wu et al., 2024). The conversion into an STD requires the implementation of several changes and investments, and policy makers and destination managers need to know whether these efforts pay off.
The purpose of this article is to provide empirical evidence on the impact that transforming a tourist destination into an STD has on its efficiency. In particular, our research question is the following: Do tourist destinations become more productive efficient after becoming an STD? While previous studies have proposed different indicators to measure STD performance (e.g., Ivars-Baidal et al., 2021), inefficiency is conceptualized here from a services production perspective as the difference between observed levels of production and the maximum attainable levels given a set of input factors (Kumbhakar, 2024).
To answer our research question, we conduct an empirical analysis using annual panel data on 137 municipalities (the most important in terms of tourist supply according to the Spanish Statistical Institute) in Spain covering the period 2005–2021. Previous research has discussed the management strategies adopted by STDs in Spain (Ivars-Baidal et al., 2023) or the improved sustainability of Benidorm city after its transformation into an STD (Aguirre et al., 2023), but there is scarce evidence on whether STDs are, as theoretically argued, more productive efficient.
We use Stochastic Frontier Analysis (hereafter SFA) to test the change in productive inefficiency associated with STD certification. Importantly, the analysis controls for potential time-invariant inefficiency gaps between STDs, destinations that are in a transition process towards eventually becoming STDs, and the rest of destinations. Our analysis thus exploits the within variation in inefficiency in STDs as compared to that experienced by the rest. Methodologically, we estimate a True Fixed Effects model (Greene, 2005) under a truncated normal distribution with the scaling property (Wang and Schmidt, 2002) that allows for some covariates to simultaneously affect both the mean and the variance of the inefficiency component.
The paper contributes to the extensive literature on STDs by examining the potential gains in productive efficiency between STDs and the rest of tourist destinations. To our knowledge, there are only two studies providing evidence on this topic, both for the case of China (Ma et al., 2023; Wu et al., 2024). Our study expands our understanding of the efficiency gains from transitioning to a smart destination for the case of Spain. This country is a leading destination for international tourists and a pioneering country in adopting a destination management model based on the levers of innovation, knowledge and technology, as well as collaborative tourism governance (SEGITTUR, 2015). From this viewpoint, we provide complementary insights to the emerging literature on STDs in Spain (e.g., Aguirre et al., 2023; Ivars-Baidal et al., 2023).
The remainder of the paper is structured as follows. First, we review the related literature. Next, we describe the case study and the dataset. Then, we outline the econometric strategy. The estimation results are subsequently presented and discussed. Finally, the paper concludes with the main takeaways from the study together with some limitations and avenues for future research.
Literature review
The analysis of tourist destinations’ efficiency
The growing economic importance of tourism and the increasing competition among destinations in a highly globalized economy have led to a greater focus on evaluating the performance of tourist destinations by governments and academia alike. Several studies have examined the productive efficiency of destinations in recent years. Assuming that tourism is a service production industry, scholars have evaluated the ability of destinations to produce the maximum output given a set of input factors. That is, individual performance is compared to a full potential benchmark indicating the maximum feasible output attainable with a given set of inputs (Kumbhakar, 2024). Most empirical studies have evaluated performance efficiency in hotels (Arbelo et al., 2021; Bernini and Galli, 2023; Parte-Esteban and Alberca-Oliver, 2015; Pulina et al., 2010; Sellers-Rubio and Casado-Díaz, 2018). Nonetheless, scholars have recently also examined tourism efficiency in rural houses (Baños-Pino et al., 2024; Sánchez-Sánchez and Sánchez-Sánchez, 2023) and Airbnb accommodations (Pérez-Rodríguez and Hernández, 2023a, 2023b).
Concerning the variables used, input factors typically include employed personnel (e.g., Assaf and Josiassen, 2012; Cracolici et al., 2008; Tsionas and George Assaf, 2014) and measures of accommodation capacity like the number of beds (Niavis and Tsiotas, 2019), establishments (Barros et al., 2011), or rooms (Assaf and Tsionas, 2015; Castiglione et al., 2024). Regarding the outputs, the most used are overnight stays (Barros et al., 2011; Cuccia et al., 2017; Niavis and Tsiotas, 2019) and tourist numbers (Algieri and Álvarez, 2023; Chaabouni, 2019), with tourist expenditure (Tsionas and George Assaf, 2014), value added (Bernini and Galli, 2023) and average length of stay (Assaf and Josiassen, 2012; Assaf and Tsionas, 2015) also being prominent.
Most empirical studies identify destinations with countries, comparing the efficiency levels of different nations and creating rankings based on their relative efficiency scores (Assaf and Josiassen, 2012; Assaf and Tsionas, 2015, 2018a; Hadad et al., 2012; Tsionas and George Assaf, 2014). The main goal is to provide information for destination managers about tourism benchmarking: how each destination compares to others and the potential factors explaining their relative position. This literature has shown that while most destinations improve their technical efficiency over time, a substantial share of inefficiency persists in the long run (Tsionas and George Assaf, 2014).
Other works have used datasets at subnational levels, mainly considering regions or provinces within a country (Algieri and Álvarez, 2023; Baños-Pino et al., 2024; Barros et al., 2011; Castiglione et al., 2024; Chaabouni, 2019; Cracolici et al., 2008; Cuccia et al., 2017; Dapeng et al., 2020; Dong et al., 2023; Niavis and Tsiotas, 2019; Nurmatov et al., 2021; Pérez-Granja and Inchausti-Sintes, 2023; Pulina et al., 2010; Sellers-Rubio and Casado-Díaz, 2018). A common finding is the existence of substantial differences in productive efficiency across space associated with climatic and cultural dimensions (Chaabouni, 2019), the quality of supply in terms of tourist attractions (Assaf and Tsionas, 2015; Barros et al., 2011; Castiglione et al., 2024; Dong et al., 2023), tourism specialization (Dapeng et al., 2020) or transport connectivity (Assaf and Josiassen, 2012; Hadad et al., 2012), among others. Few studies, though, have considered data at more geographically disaggregated levels like cities or municipalities, with the studies by Sánchez-Sánchez and Sánchez-Sánchez (2023, 2024) standing as notable exceptions.
Spain is a country that has been extensively investigated given its high popularity as a vacation destination (e.g., Pérez-Rodríguez and Acosta-González, 2007; Sellers-Rubio and Casado-Díaz, 2018). Available evidence points to substantial heterogeneity across regions (Baños-Pino et al., 2024; Parte-Esteban and Alberca-Oliver, 2015; Sánchez-Sánchez and Sánchez-Sánchez, 2024), which is partially attributed to differences in industrial and services specialization (Pérez-Granja and Inchausti-Sintes, 2023) and seasonality (Puertas-Medina et al., 2022). In this respect, tourism-led provinces have been found to be the most productive efficient (Nurmatov et al., 2021), plausibly through a better endowment of complementary services and amenities.
The efficiency of Smart Tourism Destinations
STDs have been conceptualized as “tourism systems that take advantage of smart technology in creating, managing and delivering intelligent touristic services/experiences and are characterized by intensive information sharing and value co-creation” (Gretzel et al., 2015: 560). STDs integrate smart technologies into tourism activities to enrich the tourist experience (Jeong and Shin, 2020; Sustacha et al., 2023), creating a better environment (Huang et al., 2017), raising destination awareness and perceived quality (Sustacha et al., 2024), and improving tourist satisfaction (Azis et al., 2020). The use of intelligent systems, cloud computing, social networks and mobile applications helps tourism producers to collect relevant data about consumer habits (Jovicic, 2019), which can be subsequently exploited to improve the quality of tourism supply (Boes et al., 2016) and to develop marketing campaigns (Ivars-Baidal et al., 2021).
By facilitating real-time information sharing, the adoption of new technologies is said to improve STDs’ efficiency through various mechanisms. On the one hand, data on tourist behaviour and patterns optimize the use of inputs and resources, allowing for more customized services (Femenia-Serra et al., 2019; Ivars-Baidal et al., 2019). Moreover, they enhance tourists’ perceptions of security, as technology can provide real-time updates on weather conditions, congestion or unexpected events (Sustacha et al., 2023). On the other hand, tourist involvement enables real-time feedback, which helps to identify and solve issues more quickly based on collective knowledge (Xiang et al., 2021). Additionally, technology can improve sustainability by monitoring and managing tourist flows, preventing overcrowding and reducing the environmental impact in sensitive areas (Sustacha et al., 2022).
However, evidence on the productive efficiency of STDs is scarce to date. To our knowledge, there are only two empirical studies in this respect. Wu et al. (2024) use DEA combined with a second-stage Tobit model to examine the role of information and communication technologies on the sustainable performance of 50 STDs in China. Their findings indicate that both online attention and the digital economy have significant positive impacts on sustainable performance. By considering a sample of STDs only, their analysis has the limitation that they cannot evaluate the evolution of efficiency as compared to that of the rest of tourist destinations.
This limitation is circumvented by Ma et al. (2023), who examine the impact of building smart cities on the tourism efficiency of Chinese prefecture-level cities between 2004 and 2019. Their results indicate that the creation of smart cities is positive for the eastern region cities with high development levels, but insignificant or even negative for cities in remote and less developed cities in the central, western and northeastern regions. One potential methodological limitation of their study is that they proceed in two stages: the first estimates inefficiency using SFA, and then they conduct a difference-in-differences regression on inefficiency estimates from the first stage. Inference in the second stage is challenging since the dependent variable is a set of estimates themselves, which requires bootstrapping to get reliable standard errors.
The present study adds new insights for the Spanish case. Similar to Ma et al. (2023), we also assess the effect of conversion into STD on productive inefficiency. However, unlike them, our empirical strategy estimates the production frontier and the potential shift in inefficiency in a single step.
Context and data
The Spanish model for Smart Tourism Destination management
As discussed by Andrades et al. (2024), the STD management and planning methodology started in 2012 as a strategic priority within the National Integrated Tourism Plan 2012–2015, aimed at establishing a unified framework for Spanish tourism destinations. The main objective was to implement an innovative model to enhance competitiveness and sustainable tourism development, based on governance and tourism co-responsibility (SEGITTUR, 2015). 2 This globally pioneering program (Ivars-Baidal et al., 2023) was promoted by the Spanish Secretary of State for Tourism and managed by SEGITTUR (the State Company for the Management of Tourism Innovation and Technologies). The first version of the STD methodology was developed in 2013. The framework was built around five strategic pillars (governance, innovation, technology, sustainability, and accessibility), representing key areas for destination performance.
To achieve its objectives, STDs project promotes the adoption of a management model that considers both the cross-cutting nature of tourism activity and the characteristics of each destination. It offers a common roadmap, locally applicable, through which municipalities can move and evolve to become more resilient and sustainable destinations (Andrades et al., 2024). This approach is based on a diagnostic methodology that culminates in the formulation of a system of recommendations, an action plan, and a monitoring system. This operational framework allows for a process of continuous improvement in destination management, as well as facilitating adaptation to current and future challenges in tourism (SEGITTUR and Alzua-Sorzabal, 2024).
The effective implementation of the STD methodology requires the involvement and close coordination of all the departments and the public and private actors that directly or indirectly make tourist activity possible within the municipality. The process starts upon receiving an incorporation request to the Smart Tourism Destinations Network (STD Network) from the destination, which undertakes to implement the STD model. The methodology is divided into two cycles. The first (Diagnosis and Planning) involves conducting an initial diagnostic report of the destination to design an action plan with recommendations to improve the destination’s performance. During the second (Execution and Monitoring), the action plan is implemented, and the accreditation is regularly monitored and renewed (SEGITTUR and Alzua-Sorzabal, 2024).
The STD diagnosis is structured into 16 main areas of action, developed into 97 requirements and 261 indicators, which allow the level of destination performance to be measured homogeneously and compared with other destinations (Andrades et al., 2024). The full set is presented in Appendix A. For instance, STDs are required to devote public resources to tourism innovation, provide free Wi-Fi access, attain a cybersecurity strategy and cloud and edge computing solutions, or develop indicators to measure tourism carrying capacity, among others.
To acknowledge destinations’ commitment to the values of the STD model and the work done to implement it, SEGITTUR confers two distinctions upon completion of the initial cycle of the methodological process. A destination can be recognized as a “Smart Tourism Destination” by achieving a degree of compliance equal to or higher than 80% of the requirements. If it falls short of 80% but achieves at least 20%, it qualifies as a “Smart Tourism Destination Associated”. In both cases, it will move on to cycle 2. These certifications are valid for two years and are subject to a renewal process to validate compliance with all STD requirements and indicators. In this regard, it is anticipated that the destination’s commitment to the STD distinctions and what it implies will be upheld alongside a renewal of objectives and strategies to adapt to the needs of the evolving environment.
Throughout the whole process, the STD Network serves as a vital tool for implementing the STD model, facilitating the exchange of experiences and knowledge to drive intelligent development in tourist destinations. Acting as a meeting point, it offers essential support to destinations as they transition towards a more intelligent, digitally-driven management model and a sustainable tourism development approach. The network provides project monitoring from diagnosis onwards, fostering cohesion, facilitating the exchange of best practices, and harnessing synergies among destinations.
Data and variables
We utilize an annual panel dataset covering the period 2005–2021, comprising 137 Spanish destinations. Each destination refers here to what the Spanish National Statistics Institute (INE) defines as Tourism Sites, which correspond with municipalities where the concentration of tourist amenities is significant. The list of the 137 municipalities considered in the sample is shown in Appendix B, Table B1. The panel is unbalanced due to missing values in some of the variables of interest for certain destinations, resulting in a total of 2255 observations. 3 Nonetheless, the sample enables a representative analysis: except for the provinces of Huelva and Palencia and the autonomous city of Melilla, there is at least one tourist destination in the sample per province.
We collect information on the total number of hotel overnight stays per destination and year. The data is sourced from the Hotel Occupancy Survey conducted by INE. This variable will be our tourism output measure for the empirical analysis, in line with the literature on tourism efficiency (e.g., Assaf and Tsionas, 2015; Cracolici et al., 2008). Regarding the inputs, we consider the employed personnel in the sector (labour input) and the number of bed places offered by hotel establishments (capital input), following standard practice (e.g., Parte-Esteban and Alberca-Oliver, 2015; Sellers-Rubio and Casado-Díaz, 2018).
Based on public information from SEGITTUR website, we classify destinations on the cross-sectional dimension into three groups and define the following dummy variables: (1) Dest. Level 2: takes value 1 for those that at some point during the sample period will be certified as STD (i.e., they comply with 80% or more of the criteria). (2) Dest. Level 1: those that during the sample period will apply for becoming an STD but have a compliance degree with the requirements below 80% but above 20%, so that they do not transition into an STD. These destinations are those labelled as Smart Tourism Destination Associated by SEGITTUR. (3) Rest: those that during the sample period neither apply nor become an STD.
We also define a dummy variable that takes value 1 for Dest. Level 2 since the year they become an STD and 0 otherwise, which we label as STD. Please note that this variable is defined as
Figure 1 plots the geographic location of each of the tourist destinations in the sample. The cities of Benidorm (2018), Santander (2018), Donostia-San Sebastián (2019), Málaga (2019), Gijón (2020), and Tenerife (2020) get the STD recognition during our sample period. Other destinations like Granada, León, Salamanca or Salou are Level 1 destinations. That is, they have applied to become an STD but do not attain the certification (i.e., they comply with less than the 80% of the criteria). Other popular destinations like Madrid, Santiago de Compostela, or Alicante neither are STD nor have applied for it during the sample period, thereby belonging to the ‘Rest’ category. Map of tourist destinations in Spain.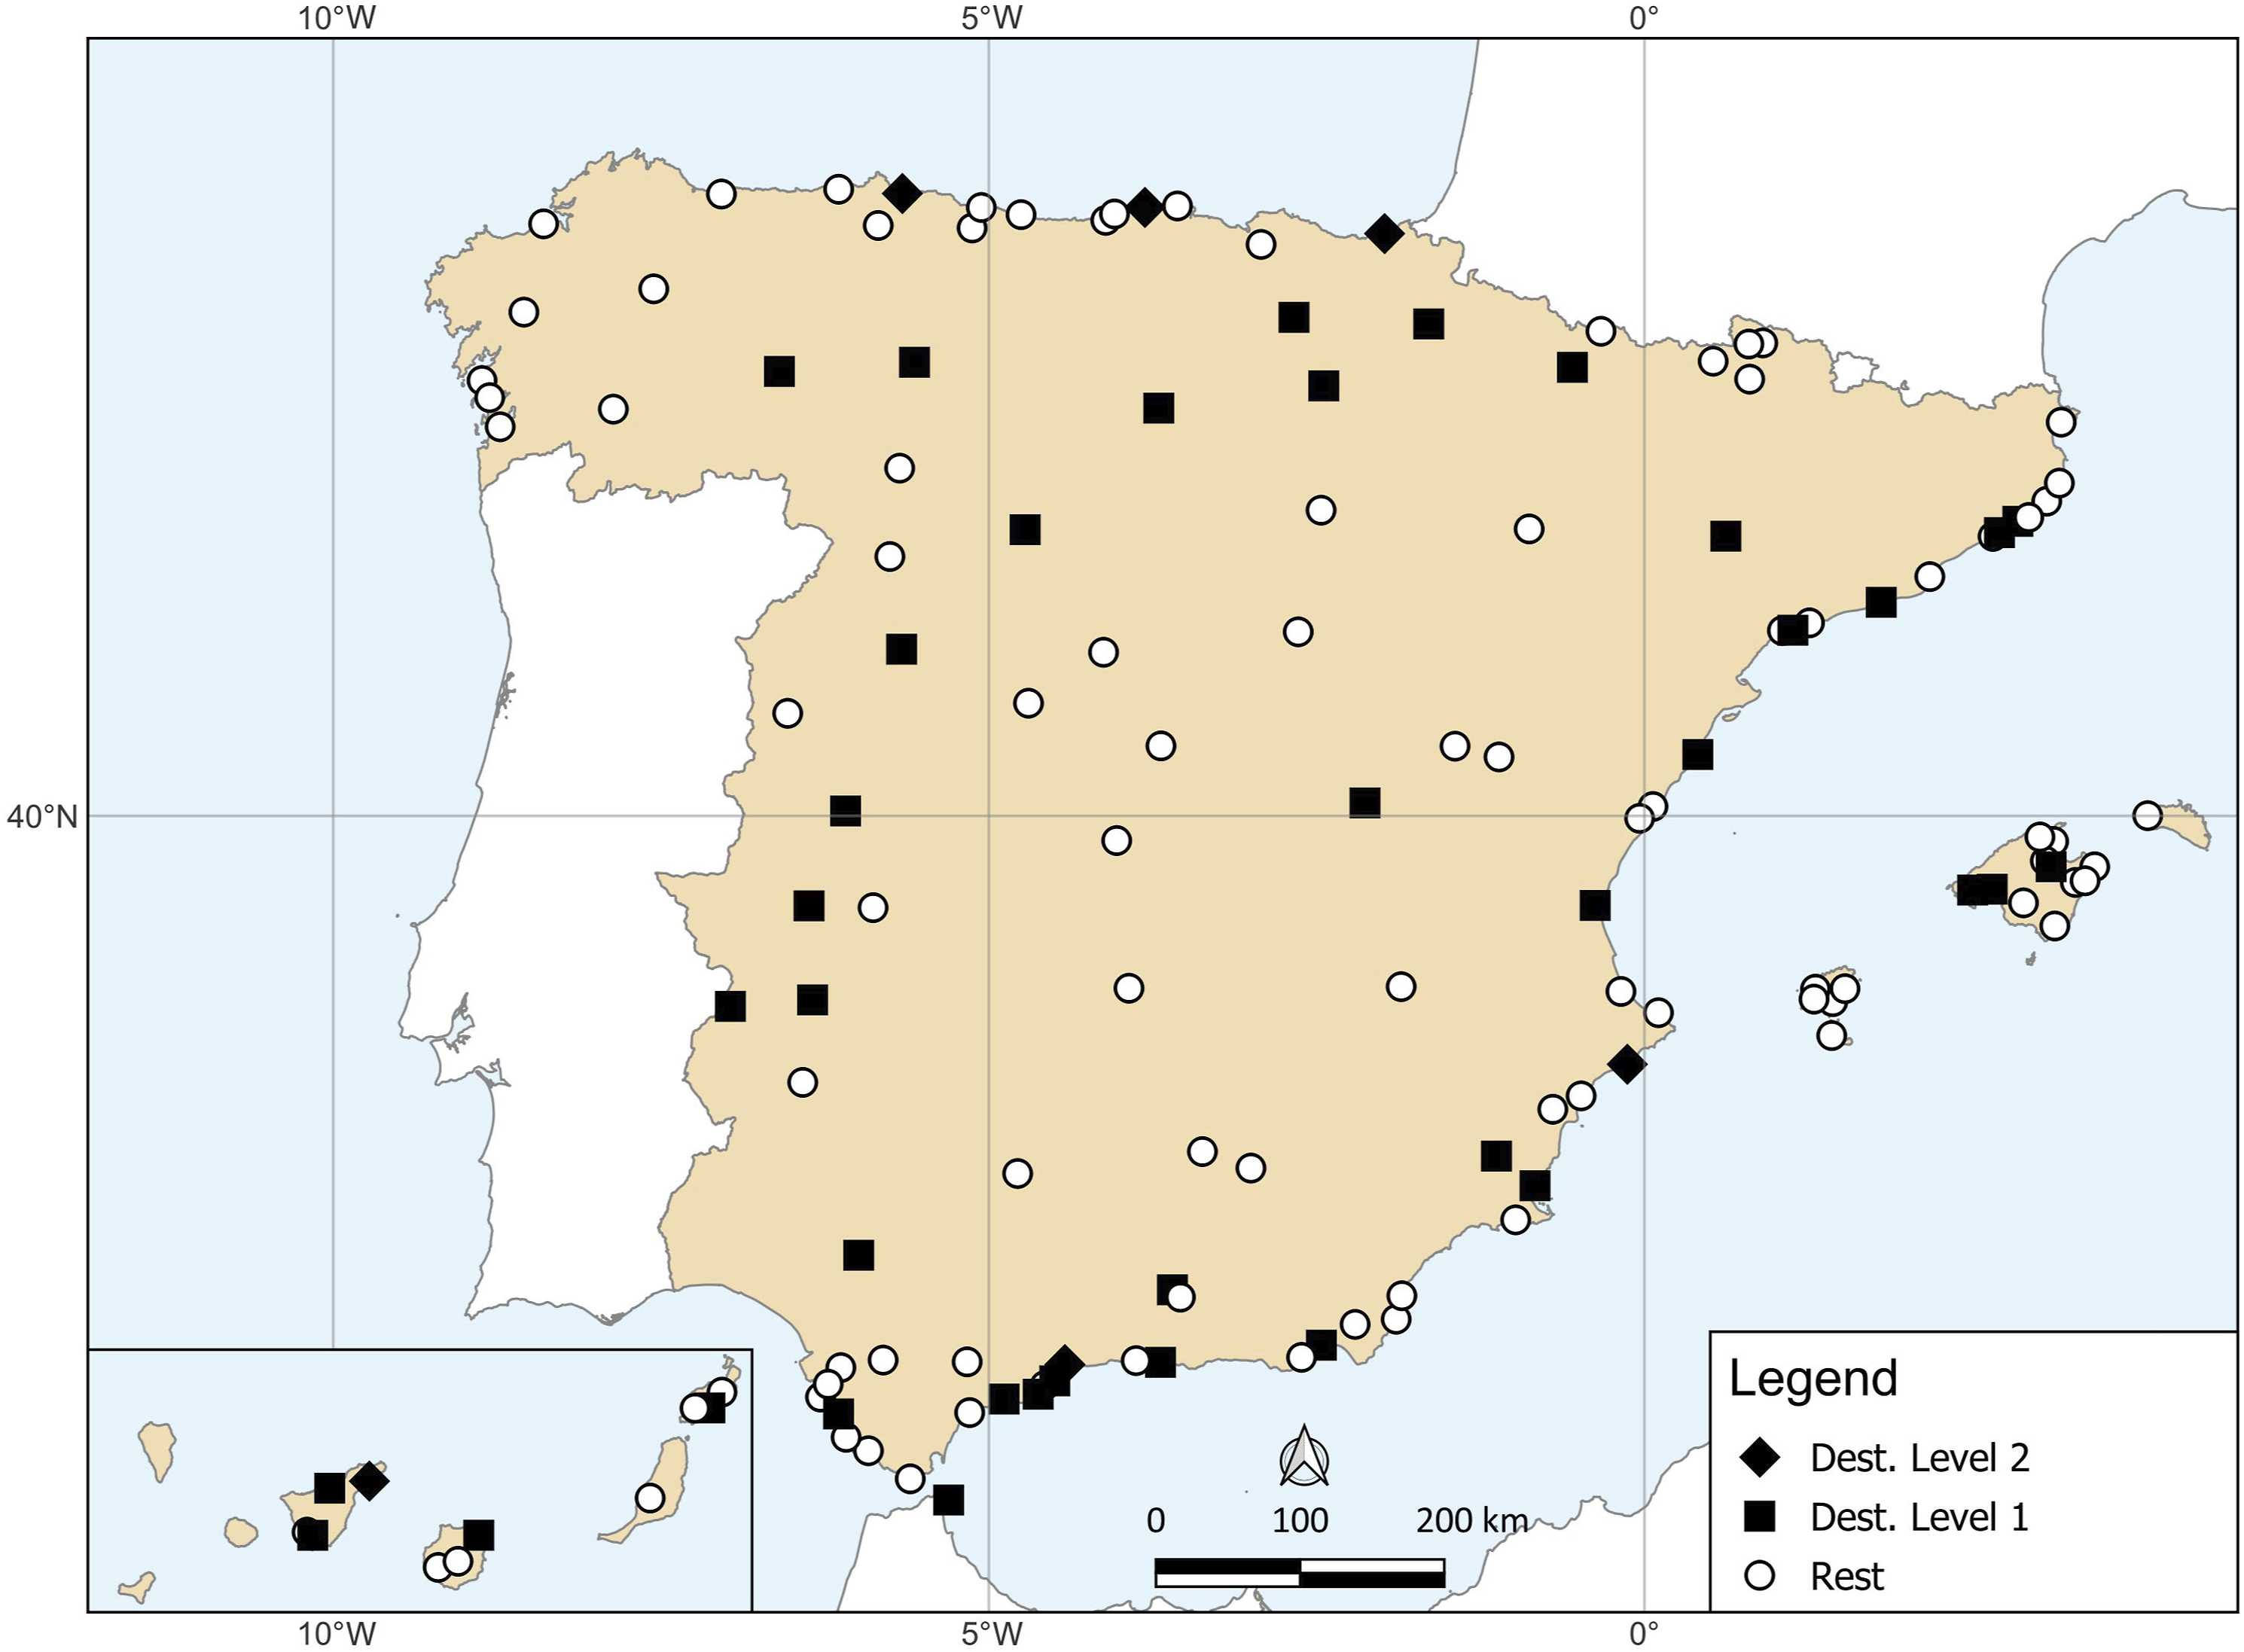
Descriptive statistics
Summary statistics of the variables (NxT = 2255).
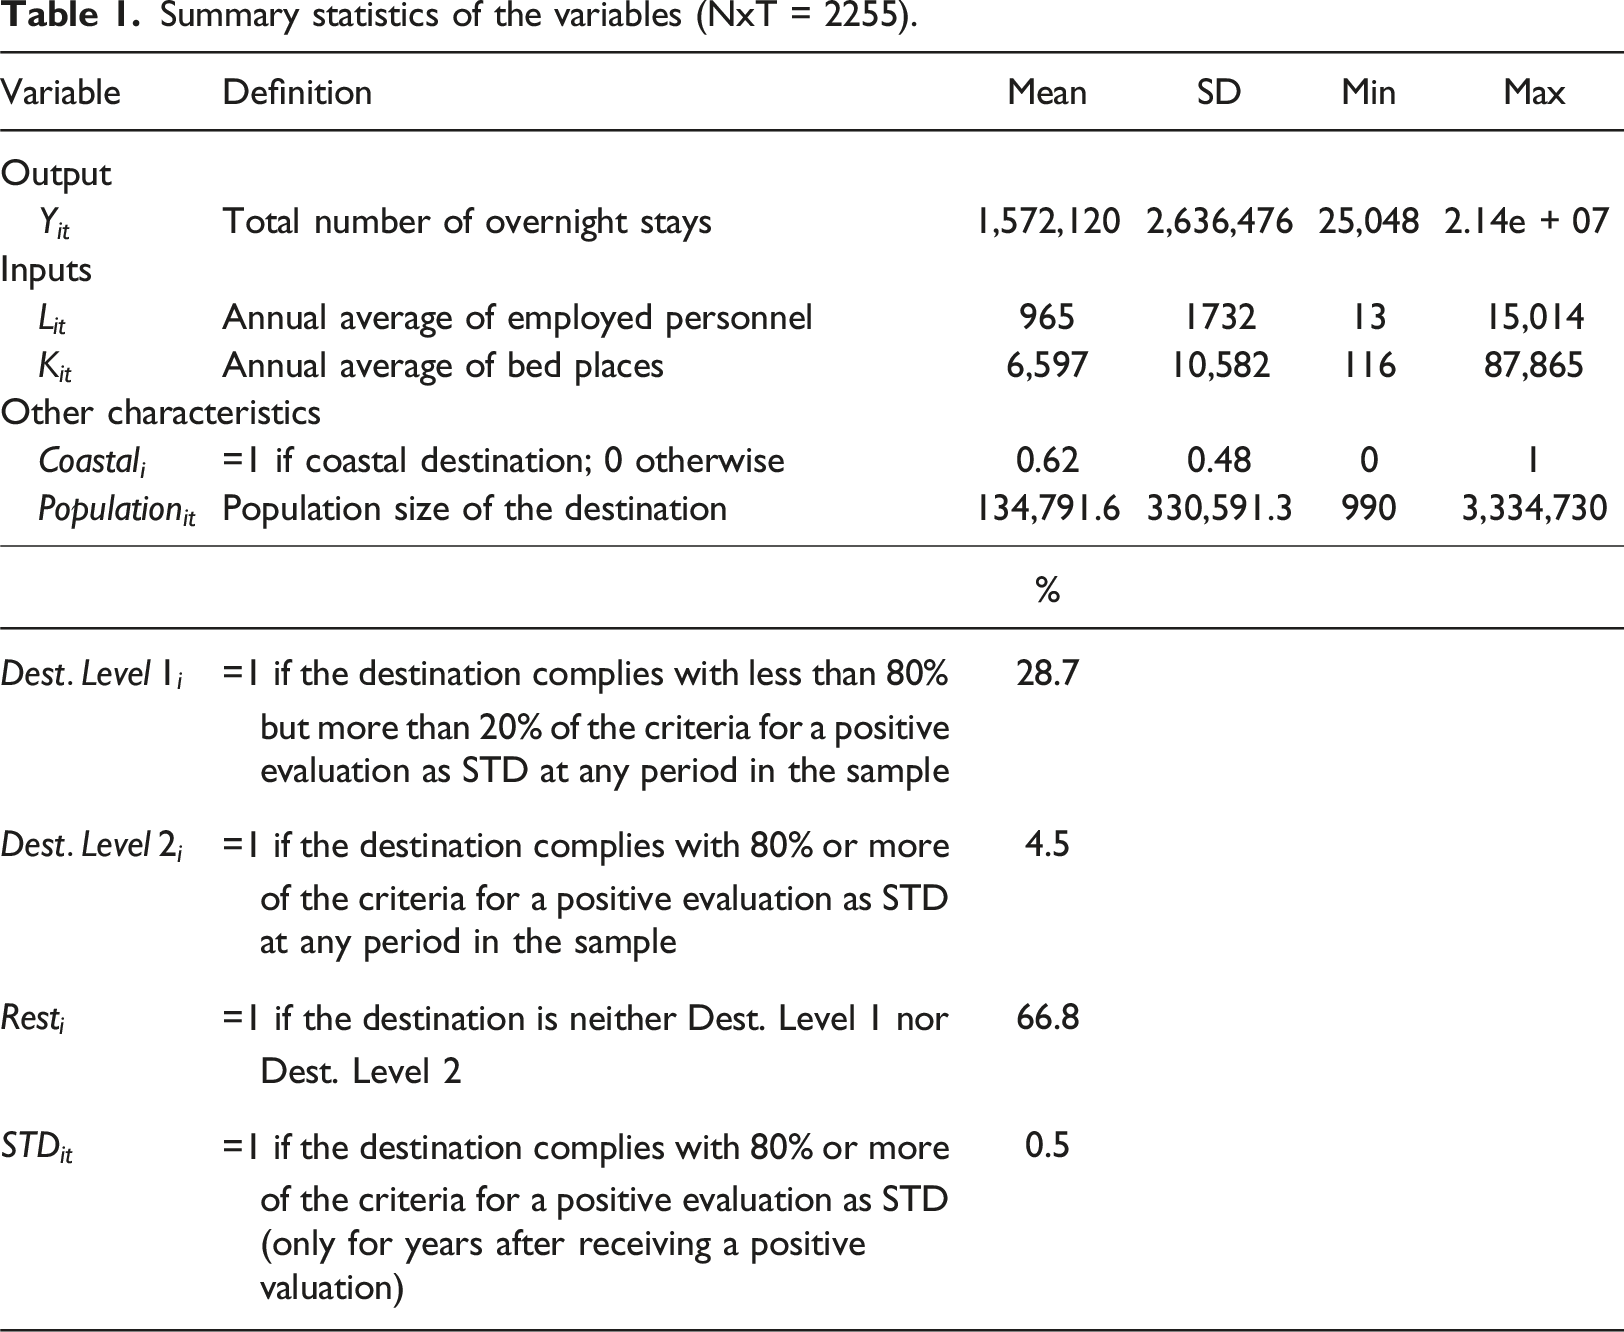
On the cross-sectional dimension, 28.5% of the sample (39/137 destinations) are Dest. Level 1 (Smart Tourism Destination Associated), and only 4.3% (6/137 destinations) are Dest Level 2 (STDs). The remaining 67.1% (92/137 destinations) thus neither apply nor become an STD during the sample period. On the panel (pooled data) dimension, the percentages are similar albeit not exactly equal because the panel is not perfectly balanced.
The destinations included are highly diverse: 85 are coastal and 52 are inland. Some of them are specialized in sun and beach tourism whereas others focus on urban and snow tourism. Table C1 in Appendix C reports summary statistics separately by destination type (Level 1, Level 2, and Rest). Destinations level 2 present higher average stays, employment and bed places, followed by destinations level 1 and then the rest. All destinations in level 2 are coastal, having around 248,000 inhabitants. Destinations level 1 are smaller in terms of population (mean population size is 153,380 inhabitants) and only 53% are coastal.
Figure 2 presents the temporal evolution of the output (total overnight stays) and input variables (bed places and employed personnel). We normalize them to take a value of 100 in 2005 to better illustrate their dynamics. Hotel bed places and employees have grown steadily over time until the COVID-19 pandemic, during which both plummeted. Similarly, overnight stays increased until the 2008 financial crisis, and then, from 2009 onwards, they exhibited an upward trend until 2020. Temporal evolution of the output and input variables in the sample period (2005 = 100).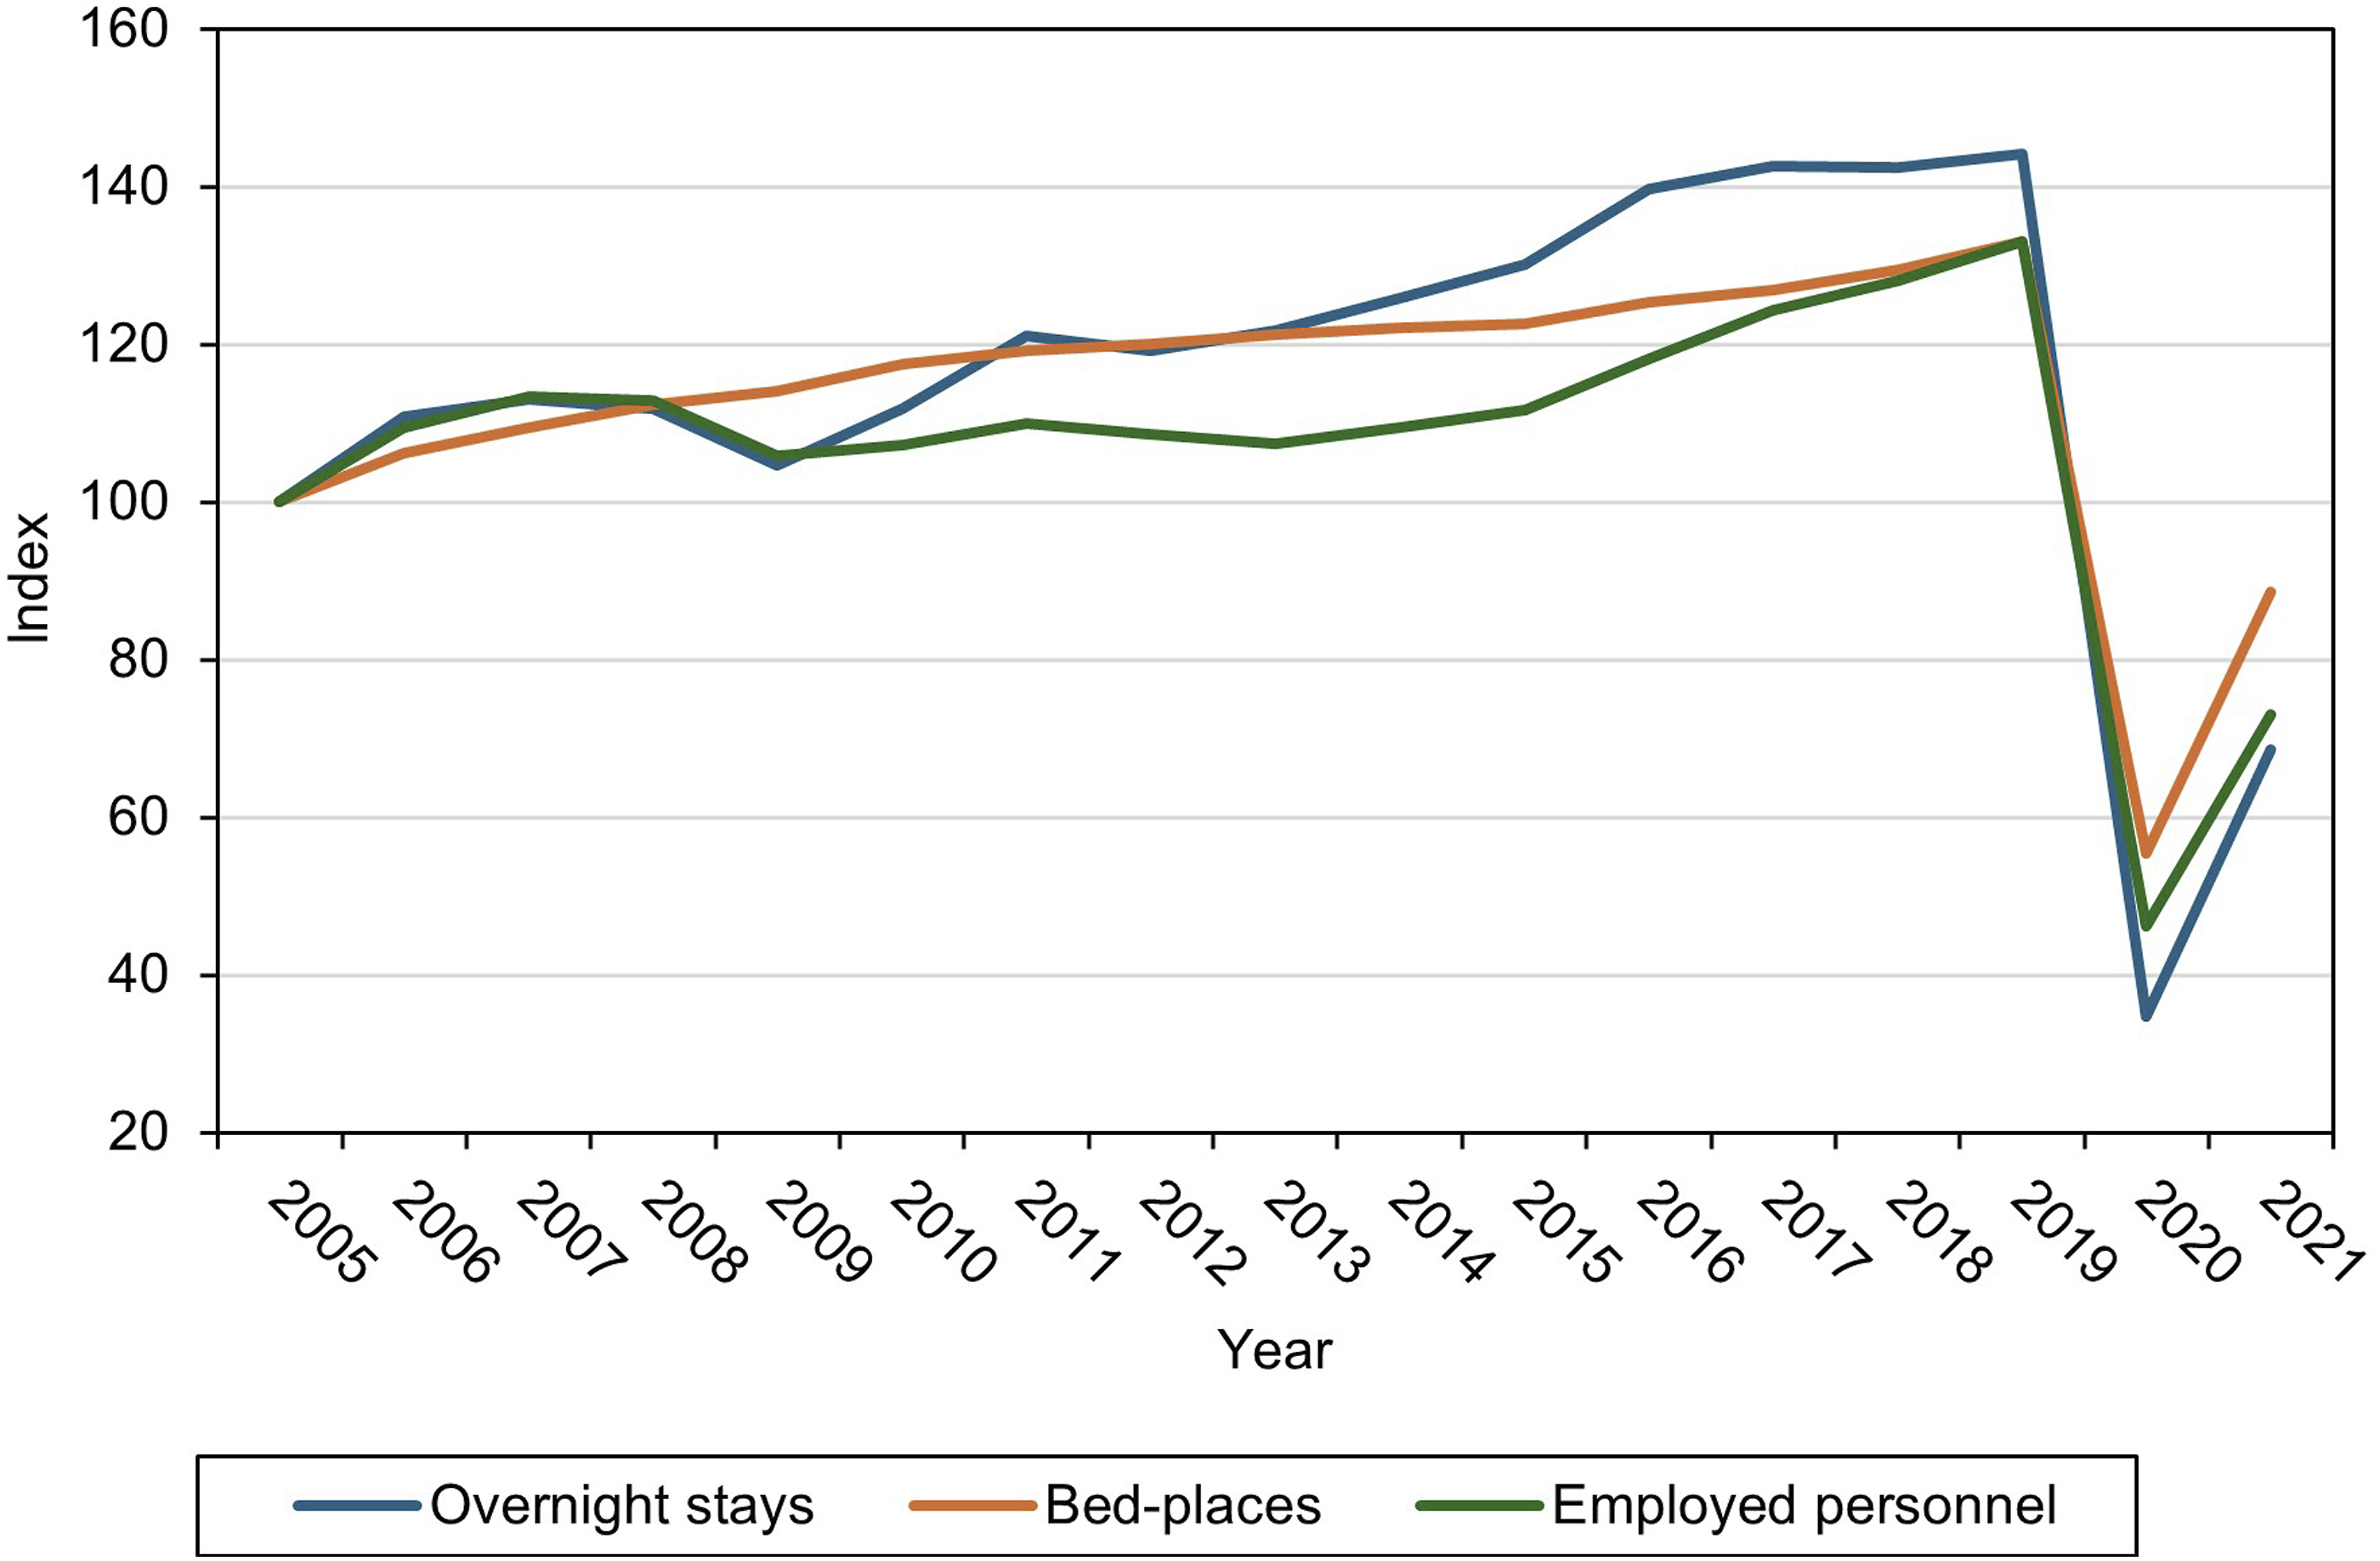
Econometric modelling
From a methodological standpoint, the literature on performance efficiency has mainly relied on non-parametric Data Envelopment Analysis (DEA) and parametric Stochastic Frontier Analysis (SFA). While most DEA methods are mostly deterministic, attributing any deviation from the frontier to technical inefficiency, SFA allows for separating technical inefficiency from unobserved idiosyncratic factors. Each methodology has nonetheless its own strengths and weaknesses. SFA requires specifying a functional form for the production technology (primarily Cobb-Douglas or translog) and making assumptions about the statistical distribution of the error term while DEA is more data-driven. An in-depth discussion of the two methodologies applied to the analysis of destination performance can be found in Assaf and Josiassen (2016).
In this study, we rely on SFA. This is because apart from allowing for random noise, this methodology allows us to model variations in output as the sum of changes in input use, changes in productive inefficiency over time, and technological progress that shifts the production frontier. Moreover, it avoids potential biases from two-stage DEA plus Tobit methods (Wang and Schmidt, 2002) by estimating the production frontier and the inefficiency term simultaneously. Therefore, to test the role of becoming an STD on destinations’ productive efficiency, we estimate the following translog production function: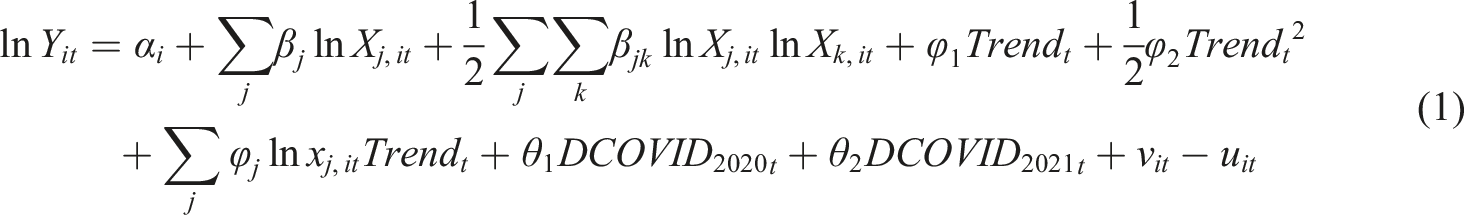
The fixed effects
We adopt a translog functional form with non-neutral technical progress, as it provides greater flexibility than the Cobb-Douglas by not imposing perfect substitutability between inputs (Assaf and Josiassen, 2016; Bernini and Galli, 2023). Following common practice, we impose the symmetry property so that
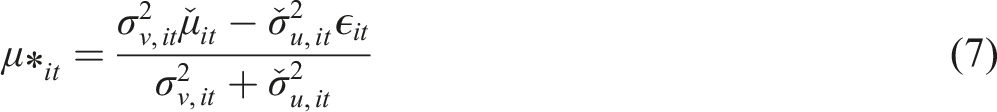
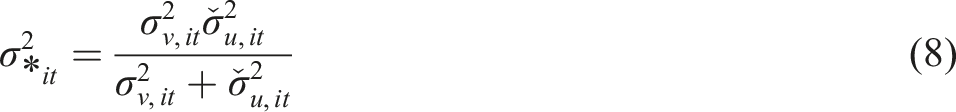
Along the lines of Wang and Schmidt (2002), we assume the inefficiency term 
The deterministic component varies across observations depending on the values of 
The key parameter of interest is
Importantly, the inefficiency term in equation (3) exhibits the so-called scaling property, according to which changes in 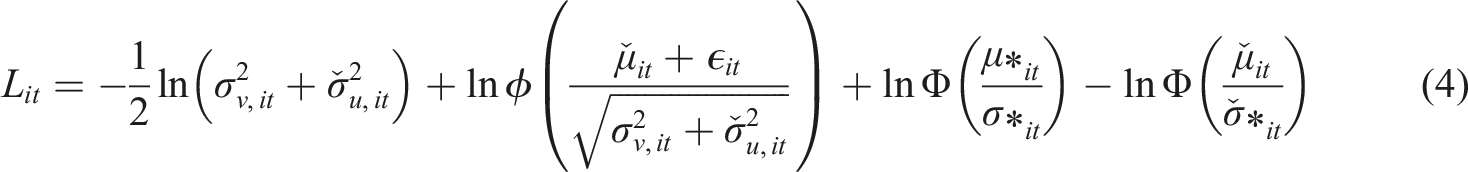


The model is estimated in one step by Maximum Likelihood using Stata 17.1 (StataCorp, 2019) and custom code following Kumbhakar et al. (2015).
Results
Baseline results
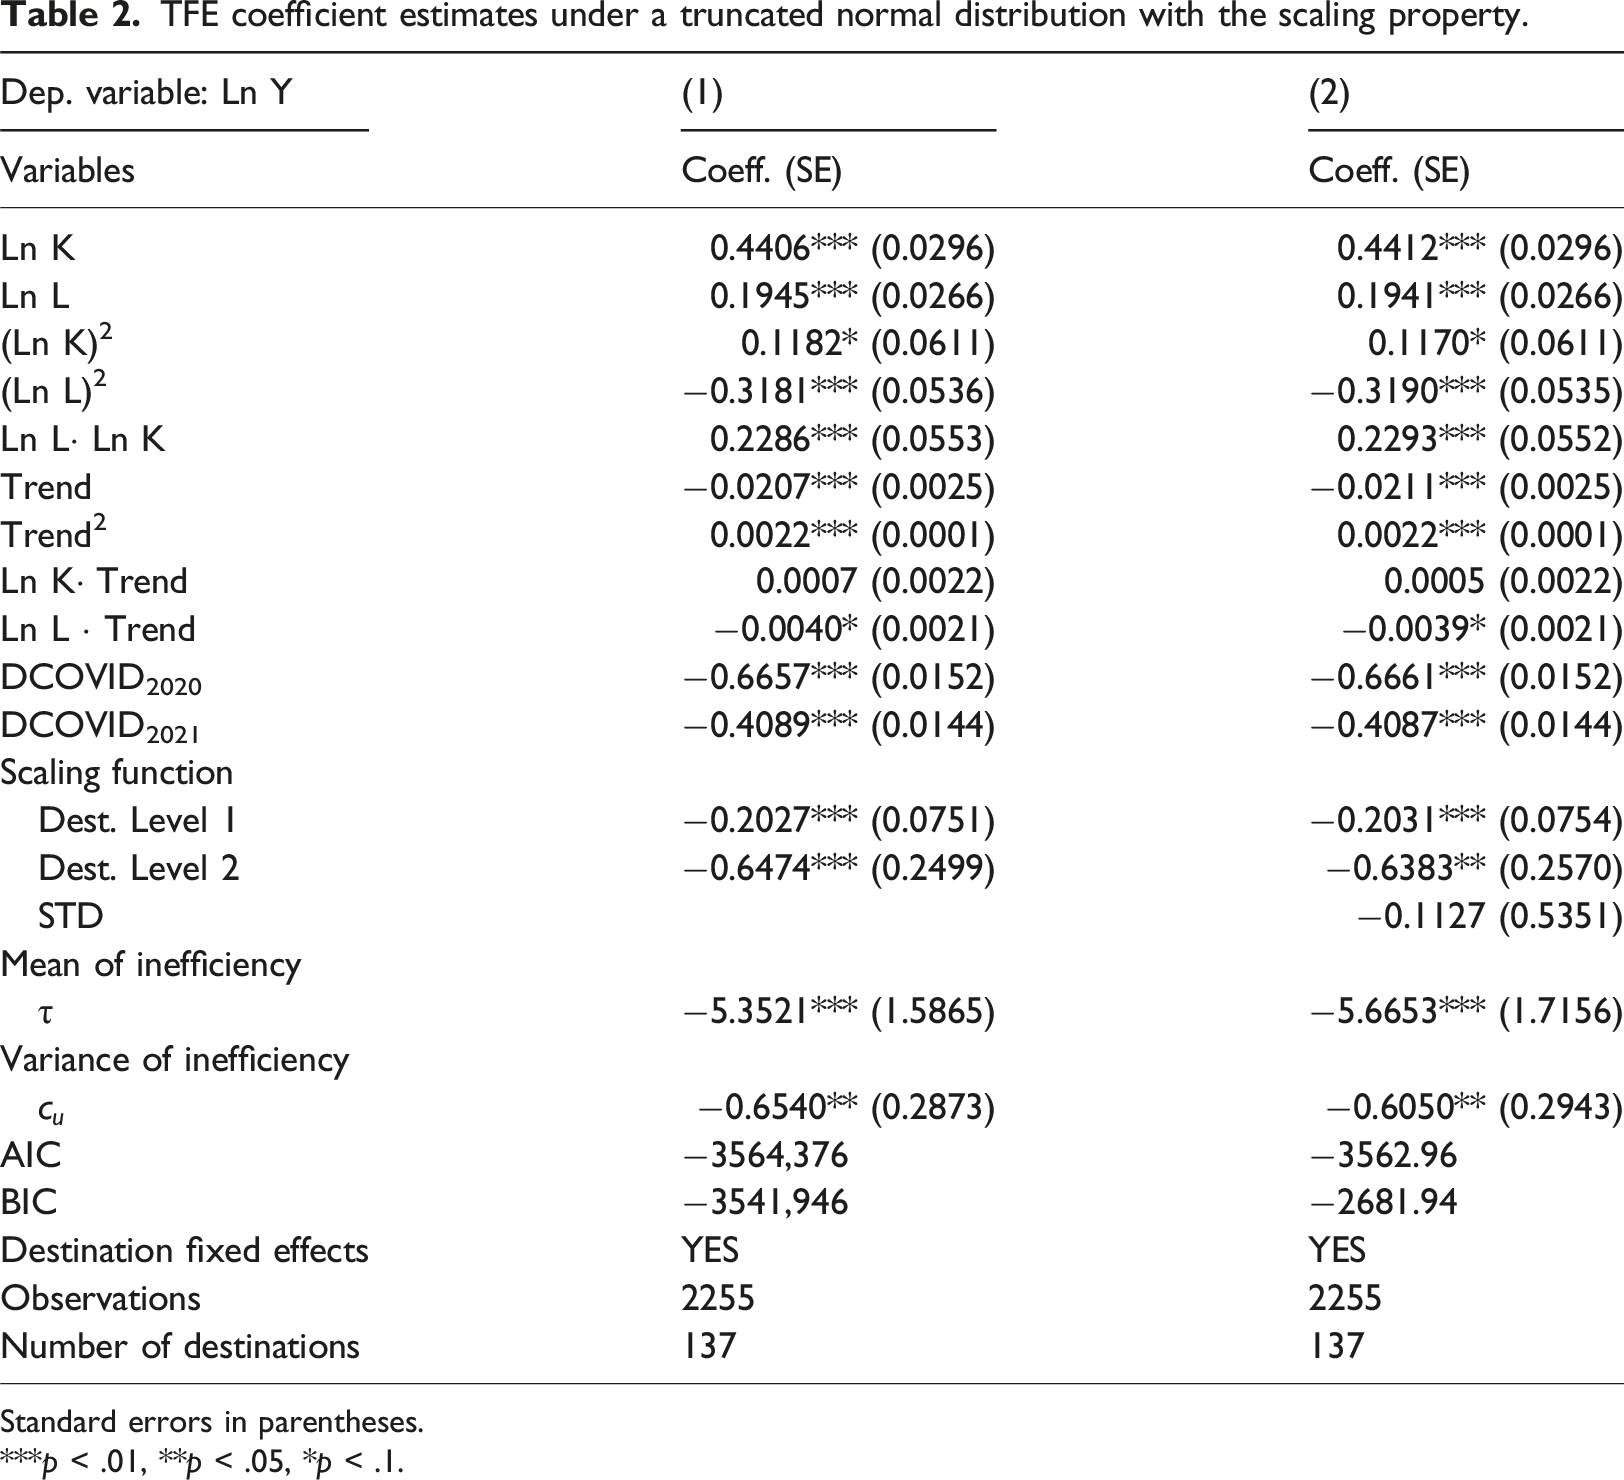
TFE coefficient estimates under a truncated normal distribution with the scaling property.
Standard errors in parentheses.
***p < .01, **p < .05, *p < .1.
The first-order coefficients (which are understood as output elasticities at the sample means) present the expected positive signs and are statistically significant at 99% confidence level. Overnight stays at hotels in Spanish tourist destinations increase by around 0.20% per 1% increase in the number of workers and by 0.44% per 1% increase in the number of bed places. We reject the null hypothesis that the output elasticities sum to one (χ2 (1) = 533.3, p-value <.001), implying that hotels operate under decreasing returns to scale. This result is consistent with prior evidence for the Spanish hotel sector by Pérez-Rodríguez and Acosta-González (2007). A proportional increase of 10% in the number of workers and bed places in the hotel industry will be associated with a 6% increase in overnight stays, ceteris paribus.
As regards technical progress, overnight stays exhibit a U shape over time, everything else being equal. If we evaluate the partial derivative at the sample means (
Moving to the inefficiency determinants, we find that the coefficient estimate for STD is not statistically significant. Therefore, there is no evidence to support the claim that the transition toward an STD leads to efficiency gains in service production. Interestingly, the dummies for Level 1 and Level 2 show that these groups of municipalities are relatively more productively efficient than “the rest.” Moreover, the coefficient for Level 2 indicates even higher efficiency compared to Level 1. Altogether, it seems that Level 2 destinations are intrinsically more efficient, on average, during the sample period, but no change in efficiency is detected after they become certified as an STD.
Marginal effects on inefficiency.
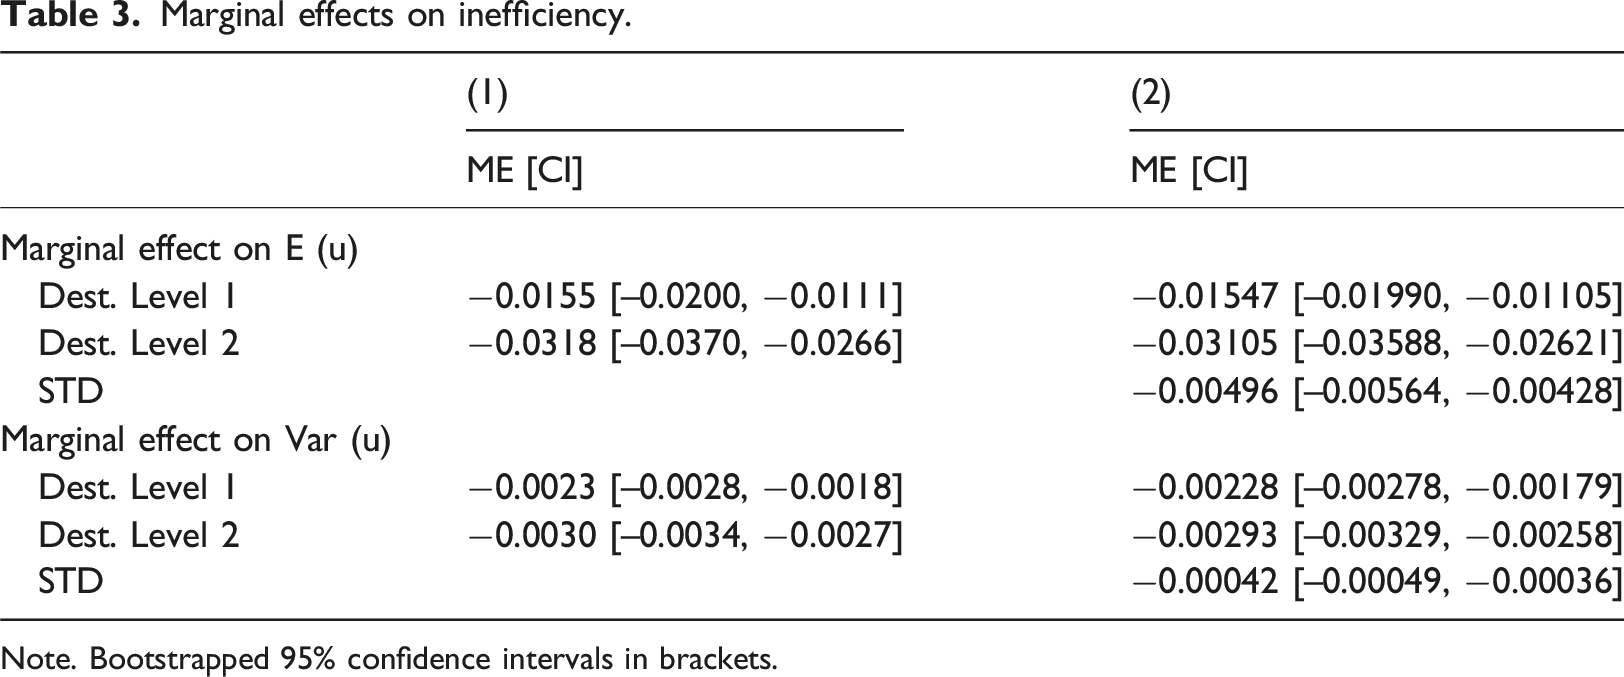
Note. Bootstrapped 95% confidence intervals in brackets.
Overall, these results indicate that destinations that either apply for STD certification (Level 1) or get it during the sample period (Level 2) are more efficient. These destinations likely present a richer endowment of hedonic characteristics plus better managerial strategies that make them perform close to their full potential. However, no significant gains in efficiency are documented after its full conversion into an STD. While it is true that the sample period post certification is not very long (the first cities to become certified as STD achieved it in 2018), our analysis therefore suggests that the common assumption that the transition into an STD leads to efficiency gains (e.g., Cerdá-Mansilla et al., 2024; Femenia-Serra et al., 2019; Gretzel, 2021; Gretzel et al., 2015; Ivars-Baidal et al., 2019; Williams et al., 2020) is not supported by the data, at least for the Spanish case.
Efficiency scores
For each destination and period, we computed efficiency score estimates according to the estimates in Column (2) in Table 2 using
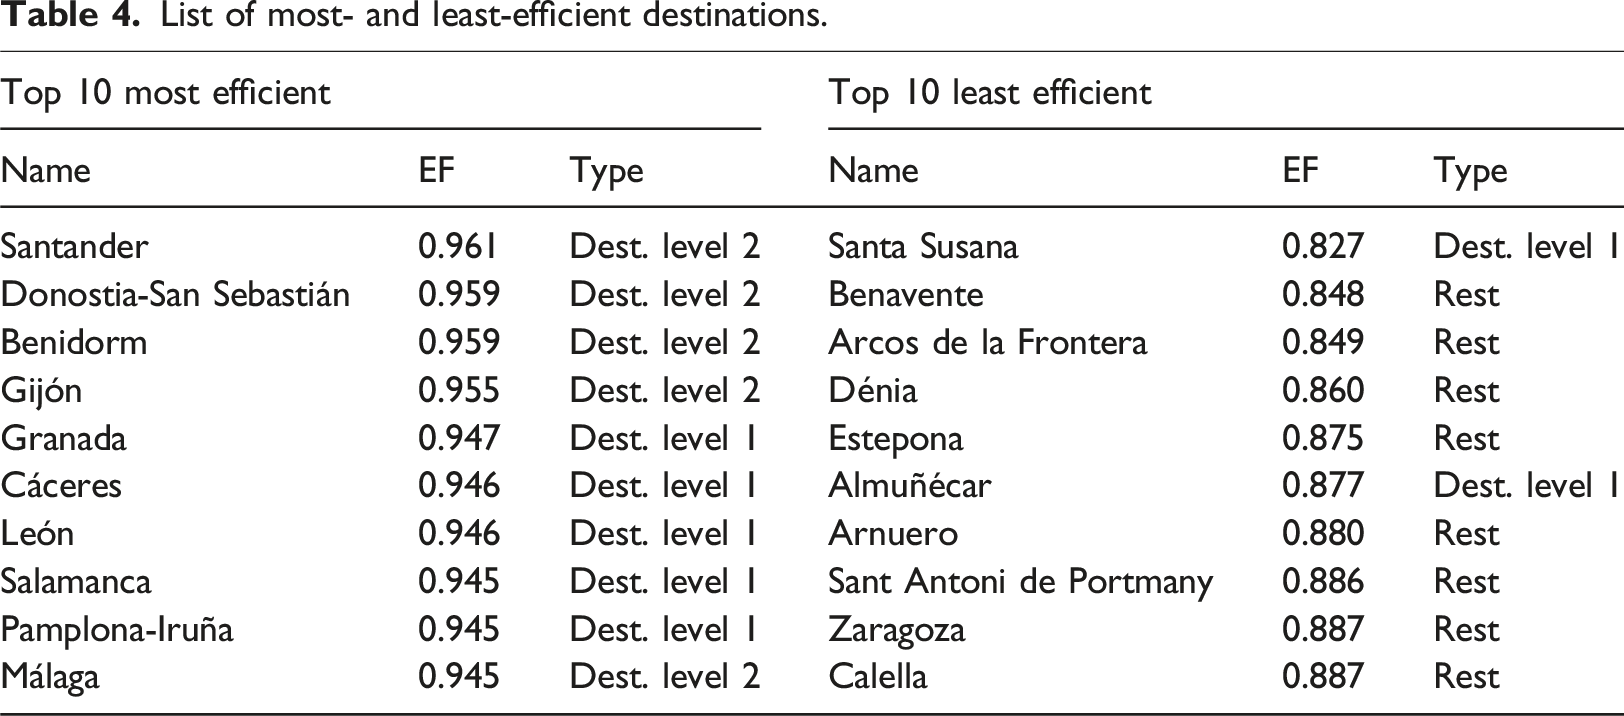
A kernel density plot of the distribution of efficiency scores by destination type is presented in Figure 3. In general, the mean level of technical efficiency in Spain is quite high (0.921), in line with prior evidence (e.g., Nurmatov et al., 2021). Table 4 reports a list of the 10 most- and least-efficient destinations. Santander, Donostia-San Sebastián, Benidorm and Gijón lead the ranking of the most efficient. These are Level 2 destinations that comply with at least 80% of the criteria set by SEGITTUR and gradually become an STD during the study period. Looking at the bottom positions of the ranking, there are only two Level 1 destinations (Santa Susanna and Almuñécar). Kernel density plot of productive efficiency by destination type. List of most- and least-efficient destinations.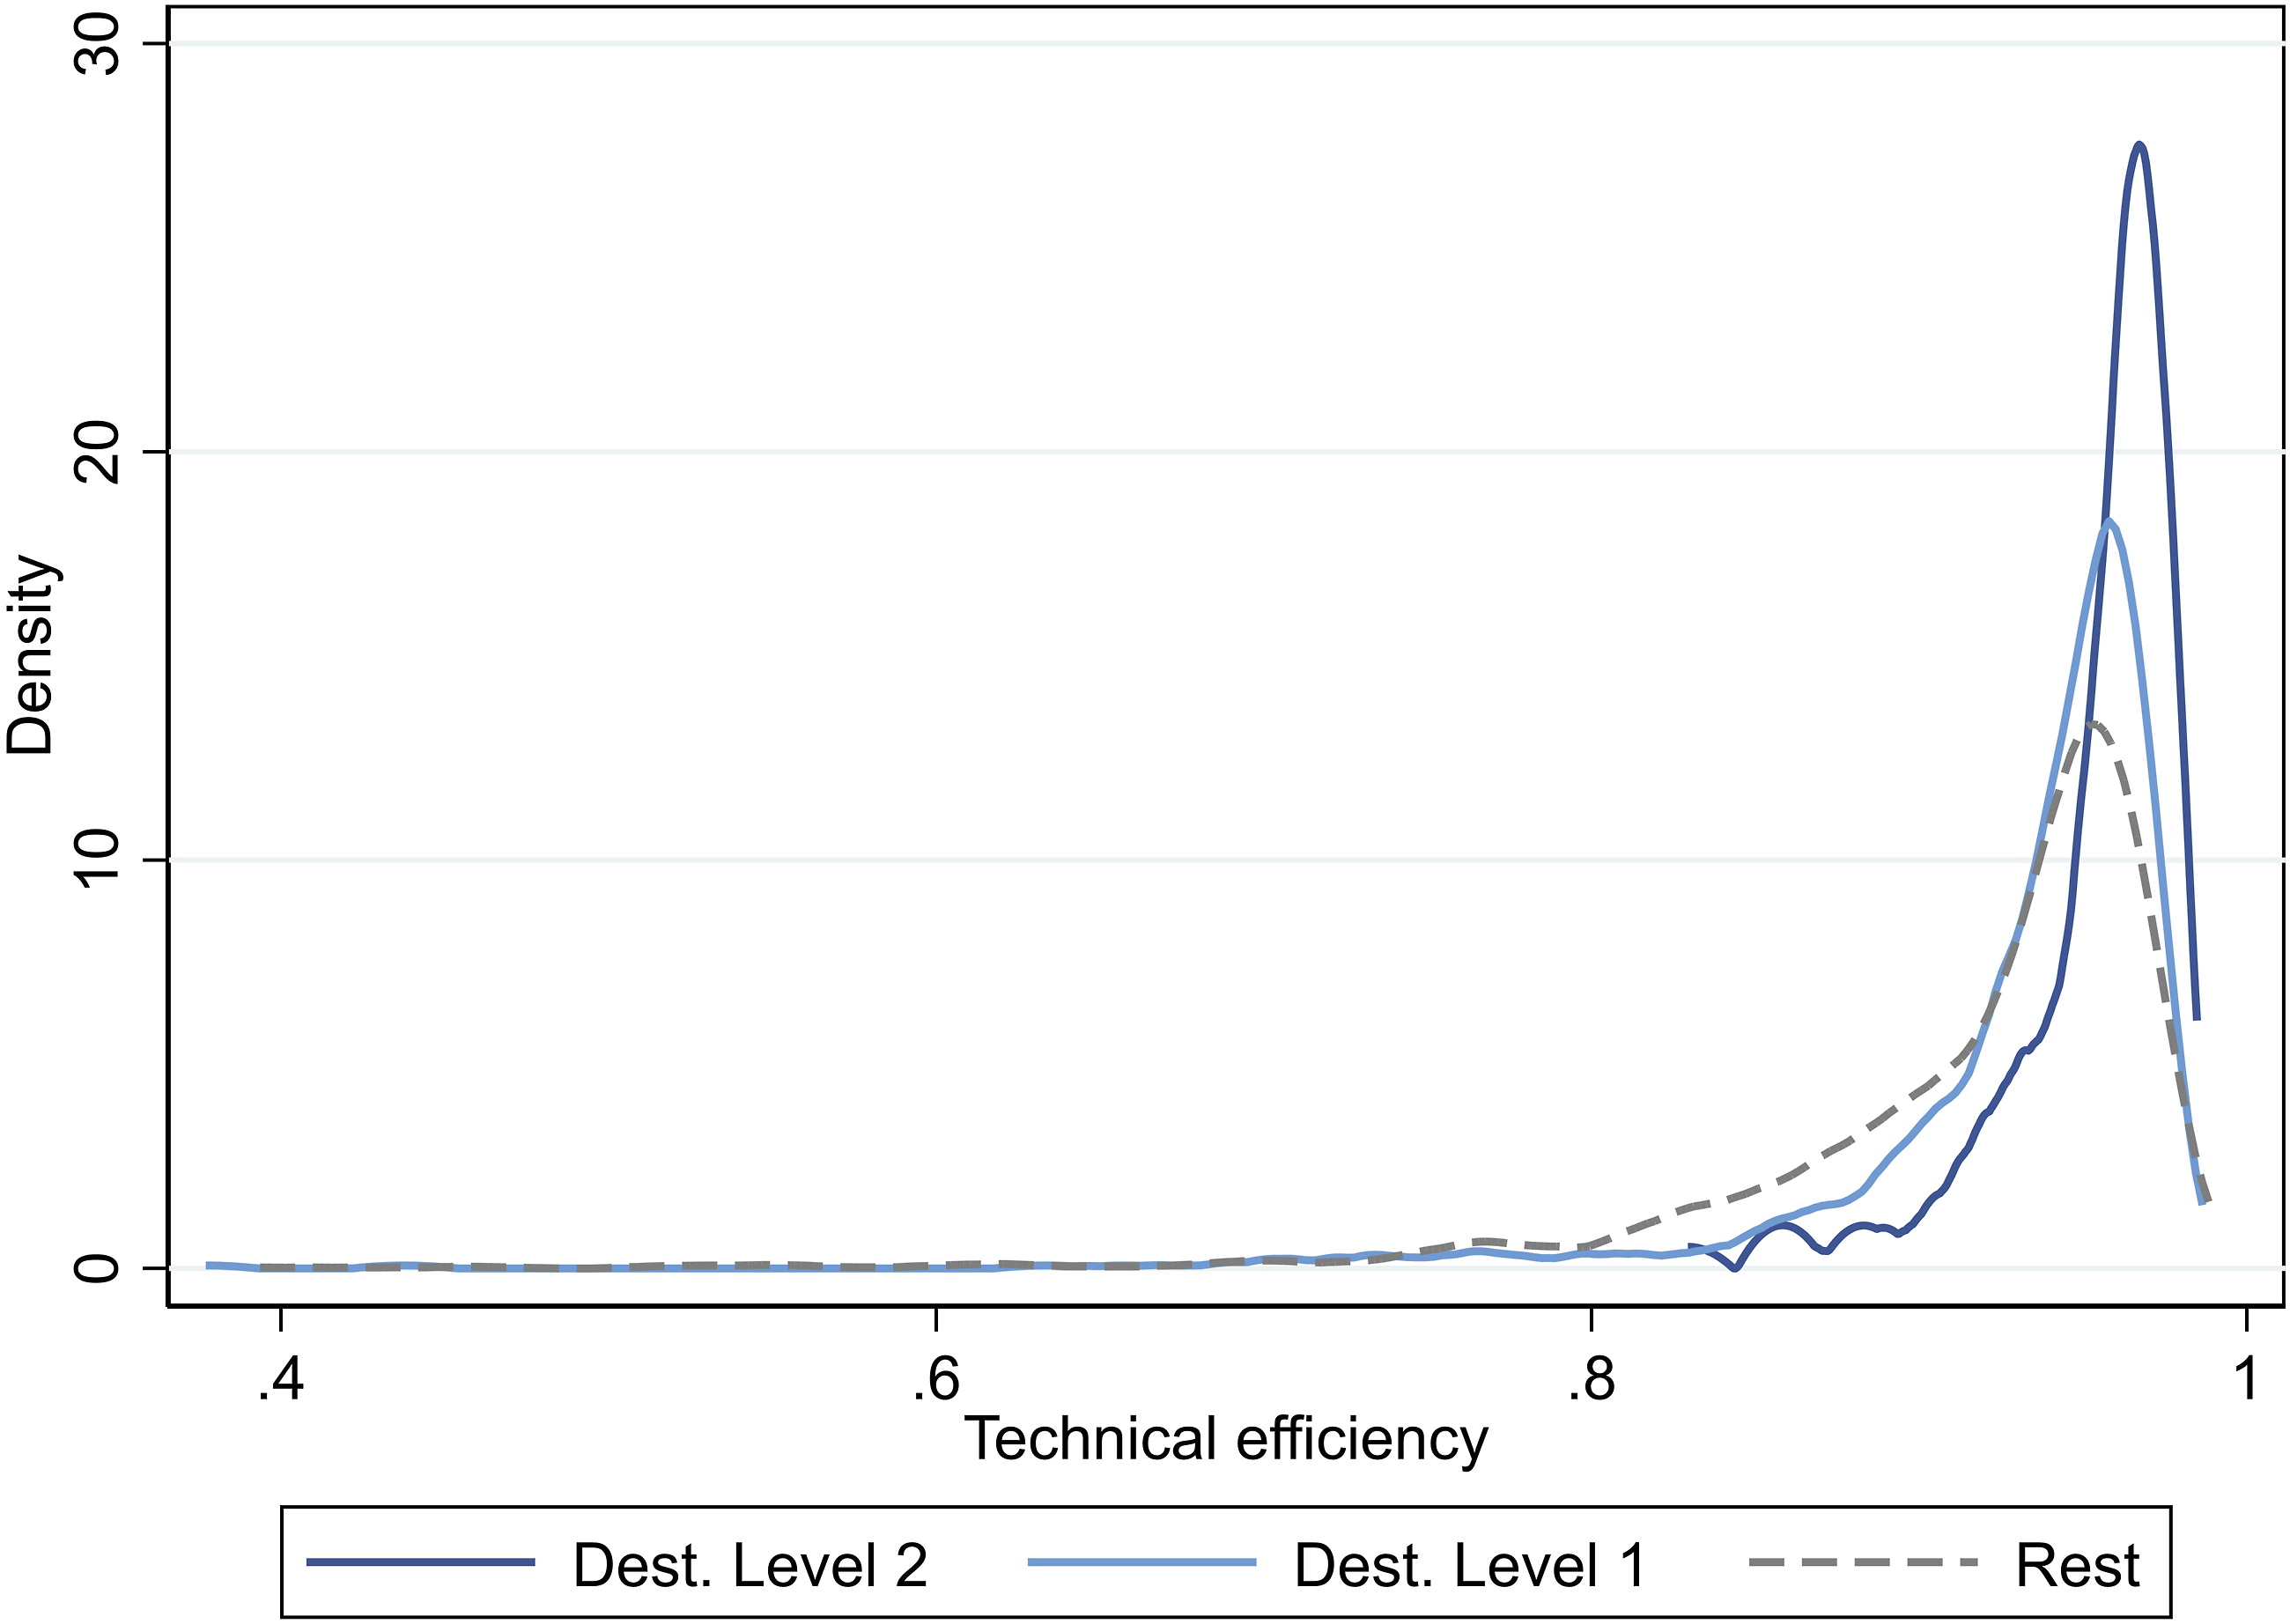
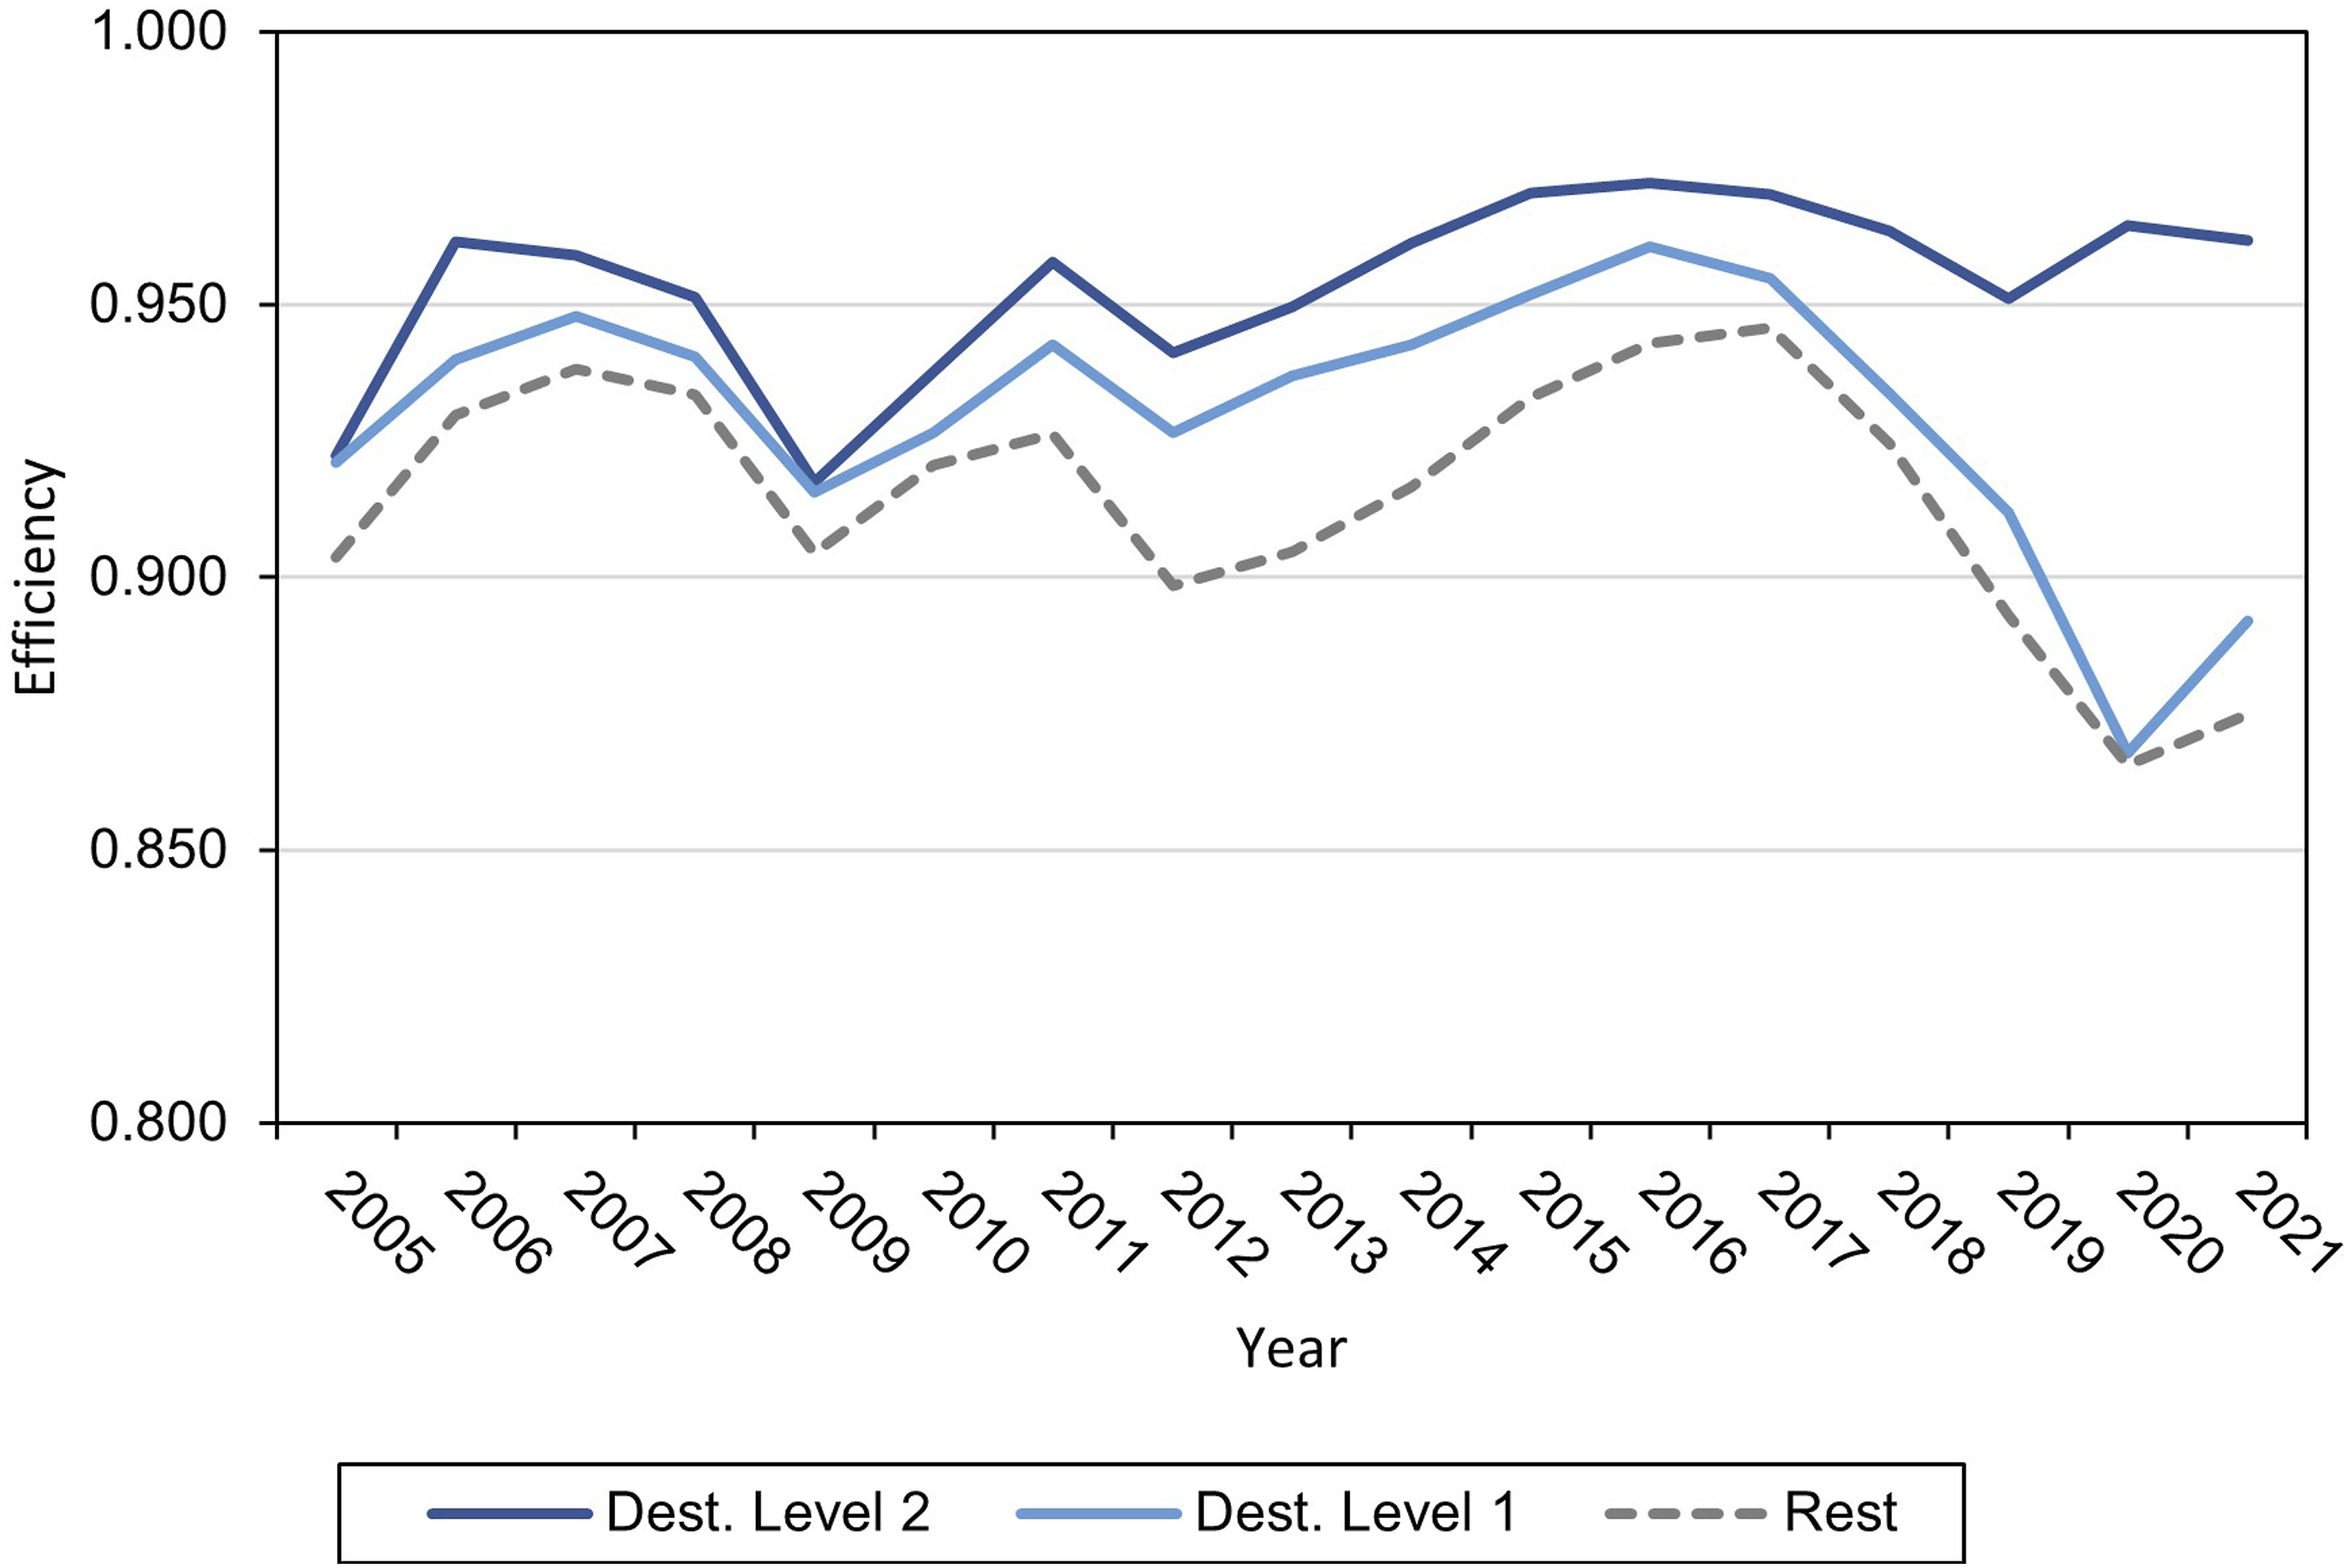
For illustrative purposes, Figure 4 maps the destinations according to their estimated productive efficiency. Those destinations that become an STD during the sample period (Level 2) exhibit greater productive efficiency, on average, than those who applied for this distinction without holding it (Level 1) (0.954 vs 0.930). From a temporal perspective, as shown in Figure 5, productive efficiency has fluctuated over time, with the gap between Level 2, Level 1 and the rest of the destinations being quite parallel. Nonetheless, it seems that, during the COVID-19 period, the efficiency of all destinations except for Level 2 ones has worsened. Map of tourist destinations according to their estimated productive efficiency. Temporal evolution of productive efficiency.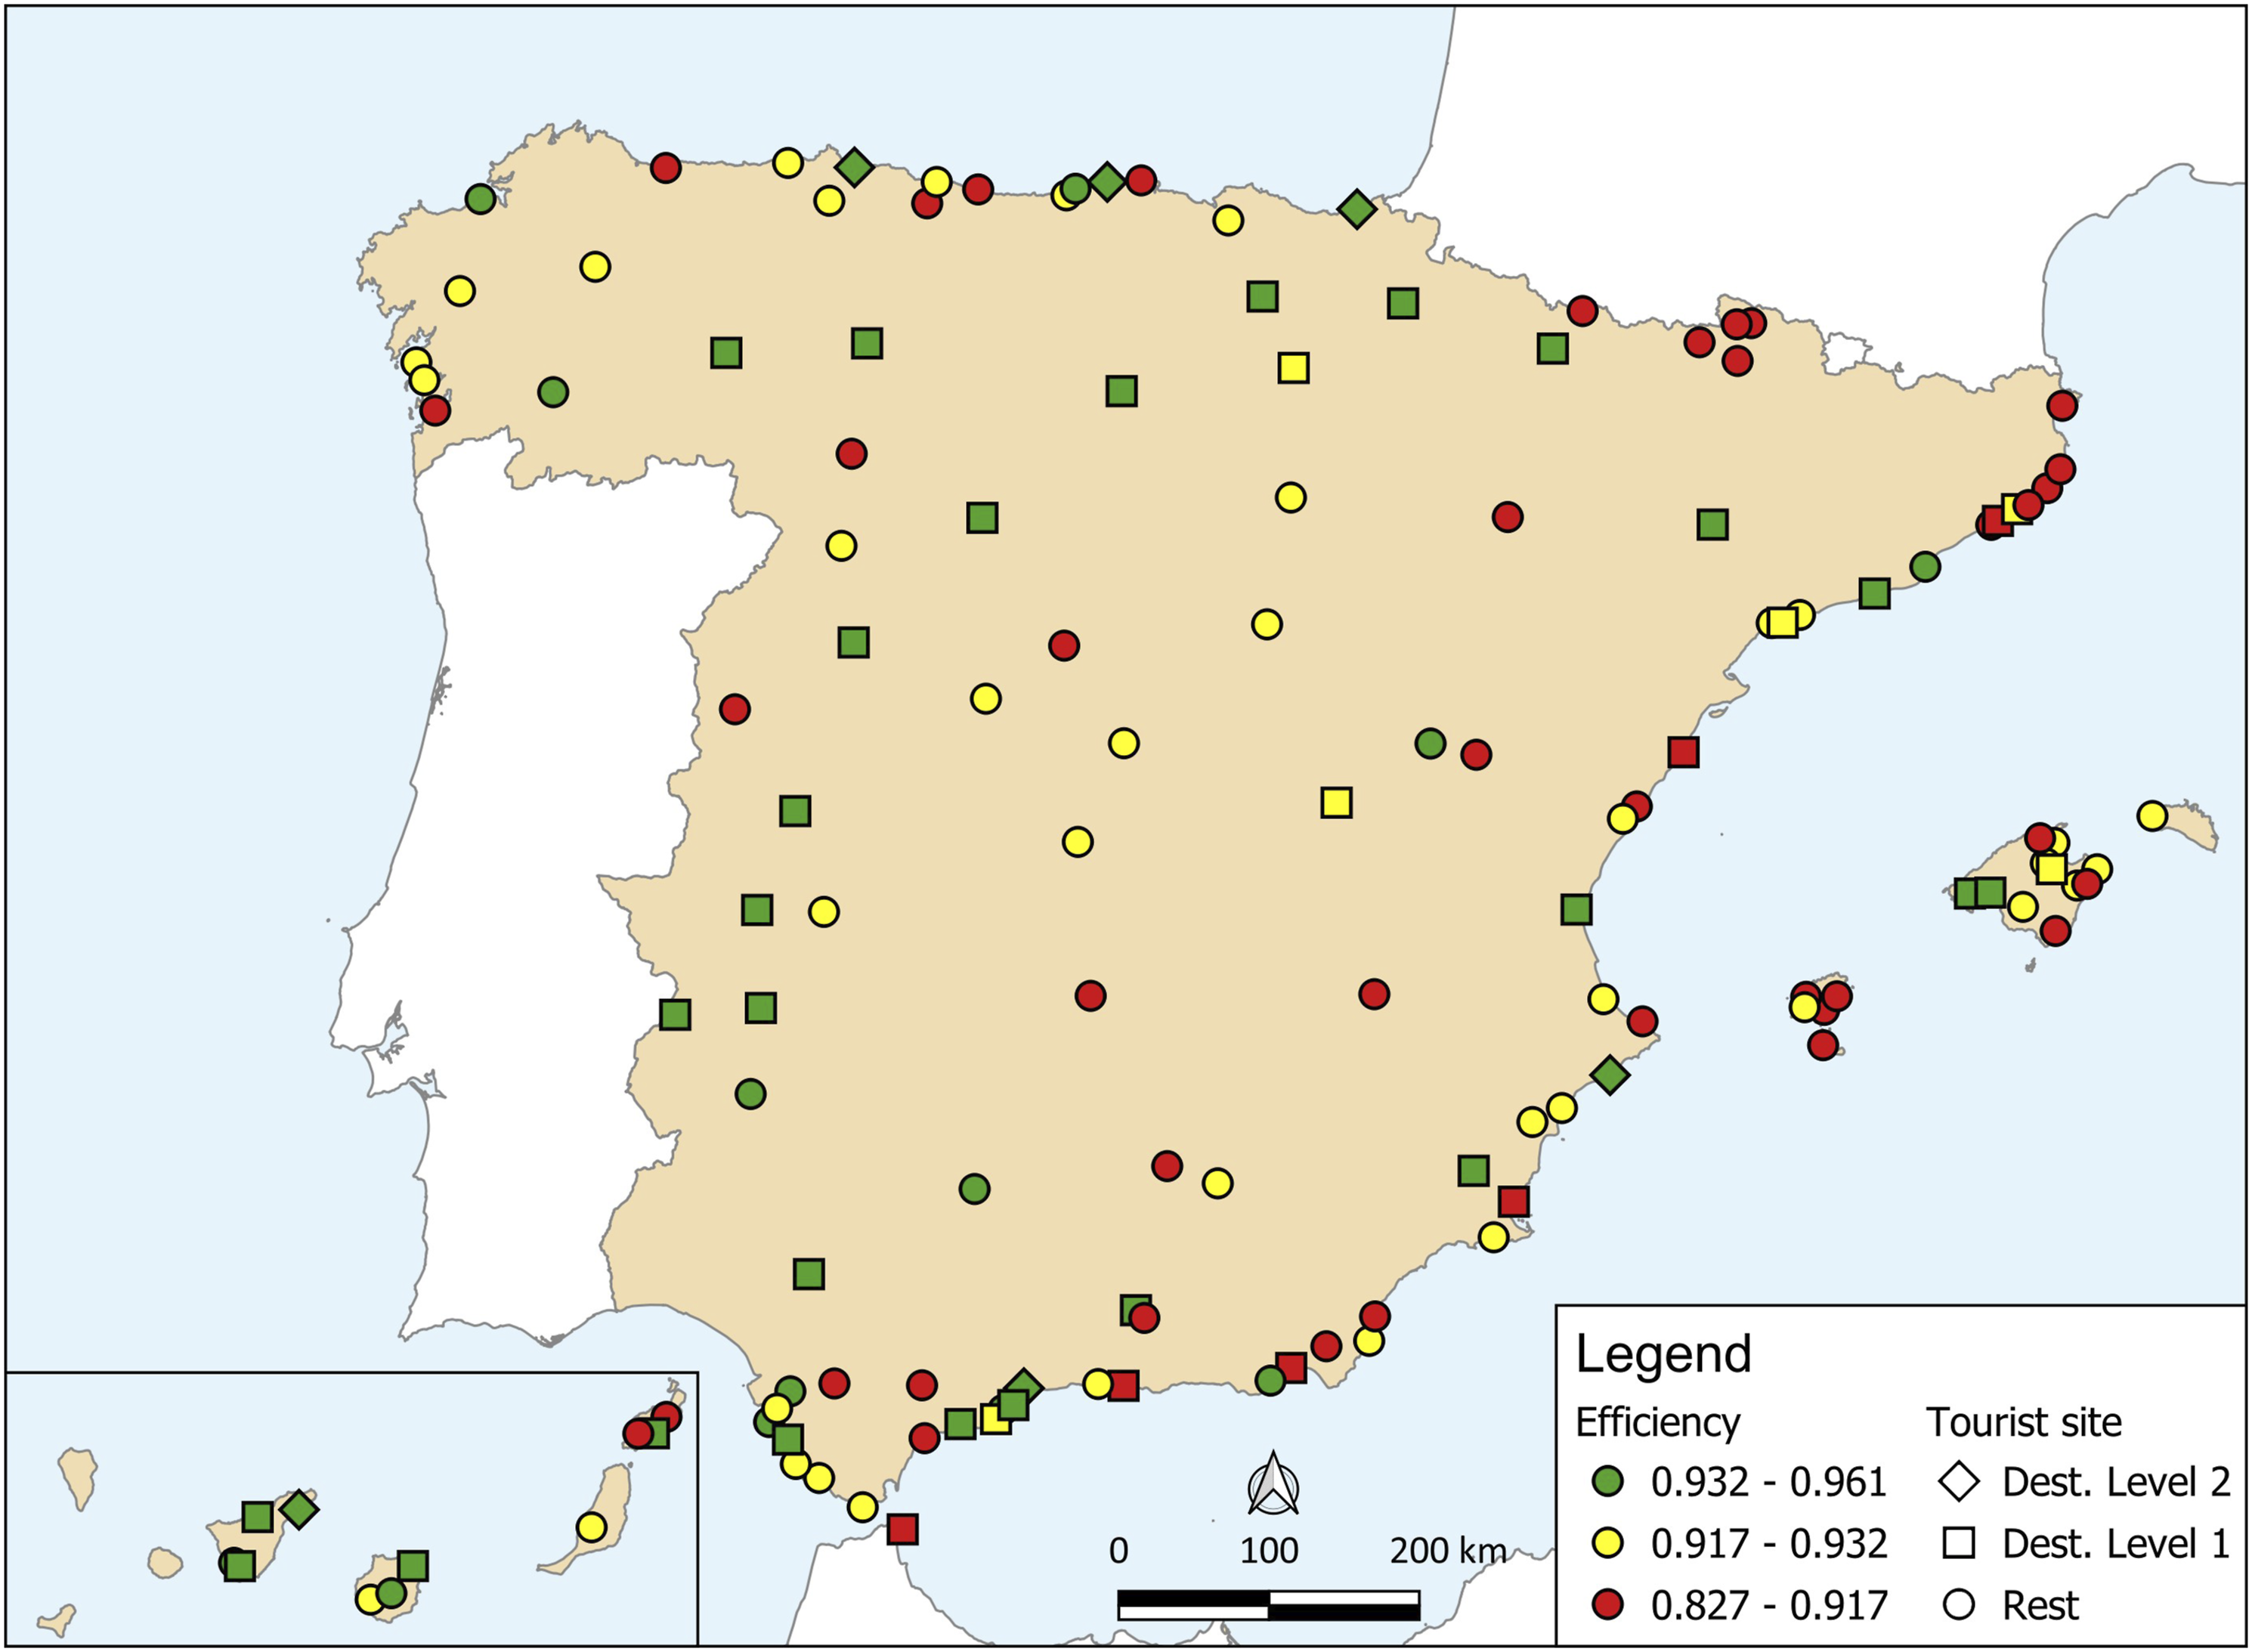
Robustness checks
We have done some checks on our baseline analysis. Firstly, we re-estimated the model considering two alternative distributions for the inefficiency term (exponential and half-normal) without the scaling property. In both cases, we estimated TFE models where Dest. Level 1, Dest. Level 2 and STD were included as predictors of the variance of the inefficiency term. The results are shown in Appendix E, Table E1. The coefficient estimates remain similar to those in Table 2, showing robustness to the distribution assumed for the inefficiency term.
Secondly, we re-estimated our baseline model considering 1-year and 2-year leads of the STD dummy: that is, we move one and two periods back, respectively, the timing when Level 2 destinations become an STD. This was done to test potential anticipation effects and efficiency gains before getting the certification. Again, the dummy for STD is not statistically significant (Appendix E, Table E2).
Thirdly, because there are relevant differences in size across the municipalities in the sample, we re-estimated the model by rescaling the dependent variable by the population size of the municipality each year. Again, the STD is not statistically significant, while the remaining coefficients keep their sign and statistical significance (Appendix E, Table E3). Nevertheless, we document a higher (smaller) output elasticity with respect to capital (labour) input compared to Table 2. Fourthly, although the model already considers non-neutral technical change in a non-linear way, we re-estimated the model including a dummy for the 2008 economic crisis, which takes the value 1 for the period 2008–2012. The estimates are shown in Appendix E, Table E4. The results remain unchanged when considering this specification, offering further robustness. 7

Difference-in-differences estimation results.
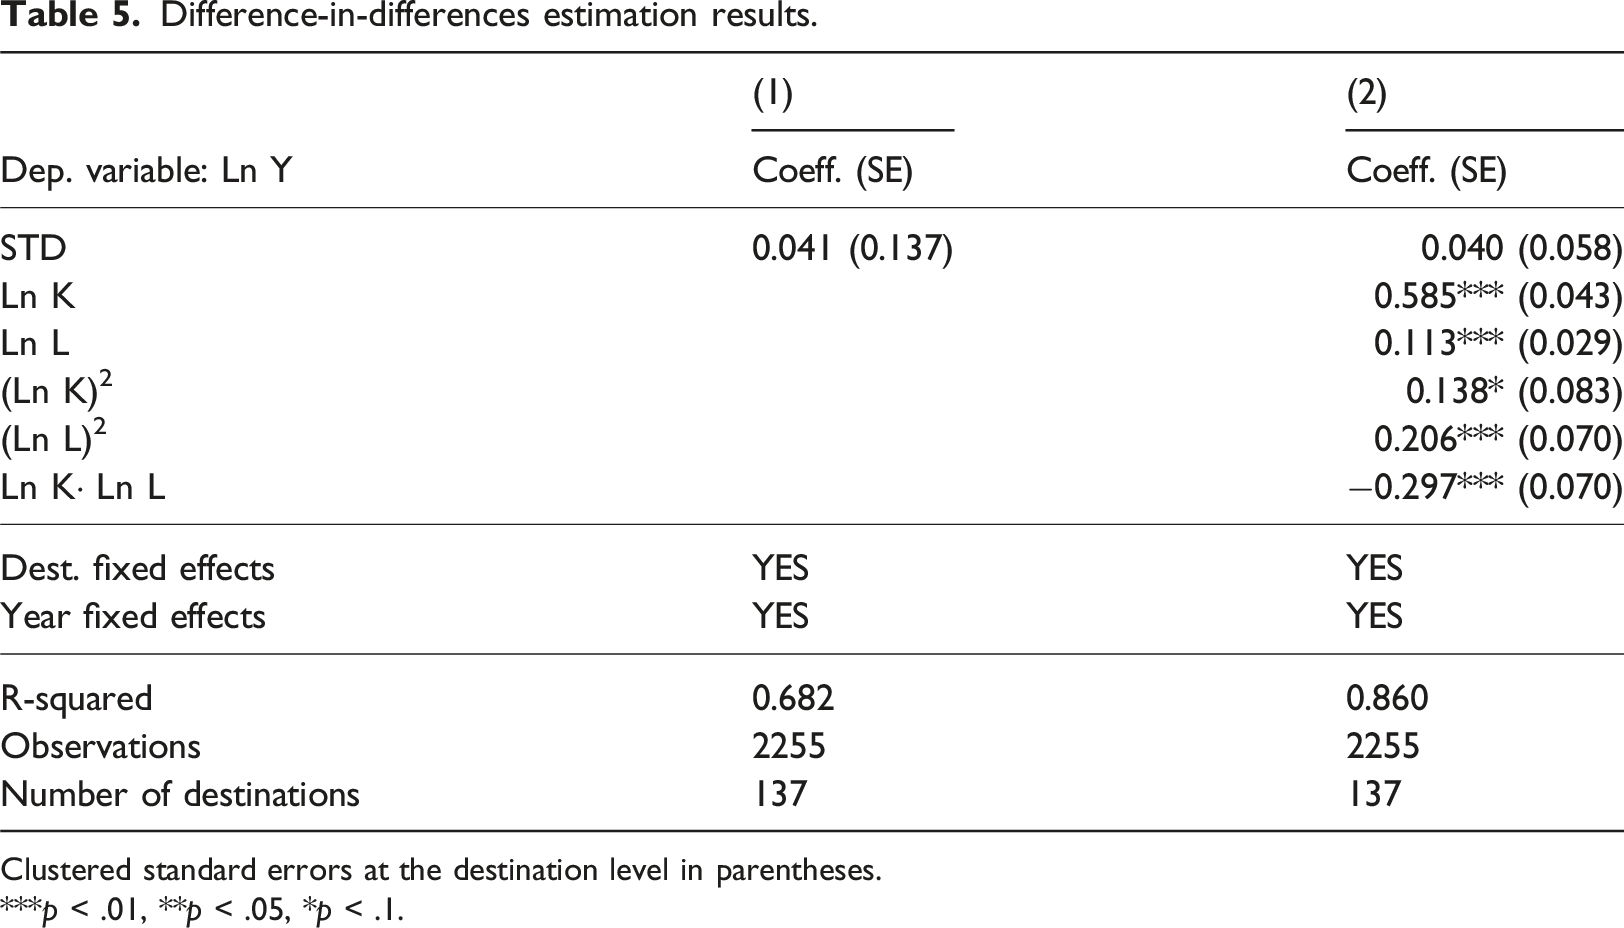
Clustered standard errors at the destination level in parentheses.
***p < .01, **p < .05, *p < .1.
Discussion and conclusions
Academic research has extensively discussed the opportunities and competitive advantages of STDs, primarily through the exploitation of data about tourists’ behaviour using information and communication technologies (Boes et al., 2016; Femenia-Serra et al., 2019; Huang et al., 2017; Ivars-Baidal et al., 2021; Jovicic, 2019; Soares et al., 2022; Sustacha et al., 2023; Williams et al., 2020; Xiang et al., 2021). This study has added novel evidence in this respect by formally investigating the potential gains in productive efficiency associated with the conversion into an STD. We have used a panel dataset for 137 Spanish destinations in the period 2005–2021 to empirically ascertain whether destinations that become certified as STD actually improve their efficiency since then.
Drawing upon a parametric service production approach, and using Stochastic Frontier Analysis, our results cast serious doubt about the alleged efficiency gains of STD claimed by previous literature. Our empirical estimates indicate that those destinations that become an STD at any period in our sample are, on average, more productive efficient. That is, their actual overnight stays are closer to their full potential given their input use. However, no significant change in efficiency is found after its conversion into an STD. Crucially, our empirical strategy has evaluated the within variation in inefficiency while controlling for time-invariant unobserved heterogeneity using a full set of destination fixed effects. This approach yields no significant change in inefficiency after attaining the STD certification as compared to the rest. This finding remains robust to alternative distributions for the inefficiency term or model specifications. Also, a canonical difference-in-differences analysis also points to the same conclusion.
Our results also reveal that the Spanish hotel sector operates under decreasing returns to scale, in line with evidence by Assaf and Tsionas (2018b) using data for the US, Europe, the Middle East and the Asia Pacific, and Pérez-Rodríguez and Acosta-González (2007) for the Canary Islands. A 1% increase in the inputs leads to a 0.6% increase in the output, everything else being equal. This finding is also coherent with recent evidence by Hernández-Guedes et al. (2024) for Spain showing a notable decline in the share of hotels operating under increasing returns to scale in recent years. Furthermore, we document technical regress up to 2009 and technical progress from then onwards. Our estimates also suggest that the average efficiency of the hotel industry in our sample is quite high (0.921), a result that aligns with previous studies (Nurmatov et al., 2021). To interpret this result, we should bear in mind that our sample is composed of the most relevant municipalities in terms of tourism supply. As previously documented by Pérez-Granja and Inchausti-Sintes (2023) and Nurmatov et al. (2021), tourism-led areas tend to be more efficient than the average thanks to productivity gains from specialization.
We believe that our findings could be of great interest to destination managers, particularly those of STDs. In recent years, local authorities have been heavily concerned about how to improve the competitiveness of tourist destinations. Smart strategies seem to be paramount for this goal, but they typically require significant efforts and good tourism governance together with public and private investment (Ivars-Baidal et al., 2024). According to our findings, it seems that the distinction as an STD does not improve, per se, destination performance. Instead, it seems that the trajectory of the destination in applying the series of good practices aligned with the requirements to attain such badge prior to its certification is what likely drives potential efficiency gains. Level 2 destinations are more efficient than Level 1 destinations, which at the same time are more efficient than the rest. As such, while the attainment of the badge does not make itself a significant difference, the effort made throughout the process of becoming an STD to comply with the requirements established by SEGITTUR seems to pay off.
Our findings contribute to the broader discussion on smart tourism development by highlighting that technological transformation and smart initiatives should be viewed as means rather than ends in themselves. The lack of significant efficiency improvements post-STD certification suggests that destinations should focus on implementing comprehensive, well-integrated smart strategies rather than simply pursuing certification status. The Spanish experience demonstrates that while smart tourism strategies may be valuable, their success depends more on the underlying transformation process and sustained commitment to improvement rather than the formal certification itself. These insights are particularly relevant as more destinations worldwide consider adopting smart tourism frameworks. The certification process might benefit from a greater emphasis on implementation and outcomes rather than mere compliance with technical requirements, a more transparent evaluation criteria and scoring systems, and a better integration between smart initiatives and existing tourism governance structures.
The fact that efficiency gains appear to be linked to the process of implementing smart practices rather than the certification itself suggests that destinations should focus on meaningful structural changes that benefit both tourists and residents. The transformation towards smart tourism should prioritise improvements in quality of life for local communities, not just tourist experiences. This perspective is particularly relevant considering that smart tourism development requires significant public investment and resource allocation.
Our study has some limitations that should be acknowledged. First, the conversion of Spanish destinations into STDs has taken place quite recently, and in some cases during the pandemic years. Although our analysis exploits the staggered transition of Level 2 destinations into STD over time while controlling for level shifts in the frontier in the years 2020 and 2021, it could be the case that the expected efficiency gains do not materialize in the short run and need more time. Future studies could explore the medium and long-term dynamics of productive inefficiency in STDs. Second, the expected efficiency gains from the STD model require effective smart tourism city governance. As Ivars-Baidal et al. (2024) have shown, there seems to be a disconnect between tourism governance and smart initiatives, which could partially explain our results. If such data were available, future studies could delve deeper into this issue by considering specific tourism governance policies or actions undertaken by DMOs as factors influencing inefficiency, applying the SFA methodology.
Another limitation is that we lack information on the scores obtained by the destinations on governance, innovation, technology, sustainability and accessibility in their evaluations. If such information were available, we could move to continuous rather than discrete indicators of compliance with STD methodology. Unfortunately, SEGITTUR has not been very transparent in that respect to date. A final limitation is that our study does not consider potential spillover effects and spatial dependence among destinations. This is left as a valuable avenue for future research.
Supplemental Material
Supplemental Material - Are smart tourist destinations more productive efficient? The Spanish case
Supplemental Material for Are smart tourist destinations more productive efficient? The Spanish case by José Francisco Baños-Pino, Inés Sustacha, David Boto-García and Eduardo Del Valle in Journal of Tourism Economics.
Footnotes
Acknowledgements
The authors wish to thank Antonio Álvarez and the conference participants of the XXVI Applied Economics Meeting and the 18th European Workshop on Efficiency and Productivity Analysis for their helpful comments and suggestions.
Declaration of conflicting interests
The author(s) declared no potential conflicts of interest with respect to the research, authorship, and/or publication of this article.
Funding
The author(s) disclosed receipt of the following financial support for the research, authorship, and/or publication of this article: This work was supported by grant PID2020-115183RB-C21 funded by the Spanish Ministry of Science and Innovation (MCIN/AEI//10.13039/501100011033).
Supplemental Material
Supplemental material for this article is available online.
Notes
Author biographies
References
Supplementary Material
Please find the following supplemental material available below.
For Open Access articles published under a Creative Commons License, all supplemental material carries the same license as the article it is associated with.
For non-Open Access articles published, all supplemental material carries a non-exclusive license, and permission requests for re-use of supplemental material or any part of supplemental material shall be sent directly to the copyright owner as specified in the copyright notice associated with the article.