
Abstract
Tourism is a potentially important source of economic growth, but its sustainability has become a widespread concern. In the U.S., a lack of consistent indicators has precluded the measurement of sustainability over time and across locations. Here we propose using secondary data to develop a novel composite indicator while also addressing advantages and limitations of the survey-based approaches used in Europe to measure sustainability. We apply this indicator to recreation-dependent U.S. counties and find that while some counties improve across multiple sustainability dimensions, others experience inconsistent trends, highlighting the complex relationships between tourism development and local community well-being. We also use a subset of indicators to predict how these counties were affected by the COVID-19 pandemic. Our results using a nationally valid and consistent indicator suggest that tourism sustainability requires tailored local approaches to balance economic benefits with social and environmental dimensions, rather than one-size-fits-all strategies.
Keywords
Introduction
Tourism has become an important engine of economic growth especially in places where traditional industries have declined (Lane et al., 2022; Roberts and Hall, 2001; U.S. Bureau of Economic Analysis, 2020). As the sector has grown worldwide, the ability to measure and monitor tourism sustainability has become more urgent because of heightened concerns among policymakers and stakeholders about the sector’s economic, social, and environmental impacts (Butler, 1999; Font et al., 2023; Miller and Torres-Delgado, 2023). Sustainability outcomes vary across places, and consistent, efficient measures over time are needed to capture local economic impacts alongside social and environmental consequences of tourism development.
Most of the existing research on tourism sustainability, especially in Europe, relies on local surveys and interviews (European Commission, 2016; World Tourism Organization, 2004). At the same time, many European environmental and social sustainability measures are also tracked through secondary-data systems (e.g., Eurostat) and evolving corporate reporting requirements (e.g., CSRD/ESRS), and destination organizations may combine these sources with tourism-focused toolkits such as ETIS. While these methods provide detailed and context-specific insights, they are also costly and cover relatively short time periods, restricting data collection to communities able to afford such efforts. Differences in survey methods and metrics further limit comparability across destinations, while irregular data collection schedules complicate efforts to track sustainability dynamics over time, especially during economic downturns or rapid growth phases (McLoughlin et al., 2018; Modica et al., 2018).
We follow the triple bottom line (TBL) framework of sustainability, which balances economic, social and environmental considerations (Elkington and Rowlands, 1999). The TBL framework is based on a well-established conceptual foundation for multidimensional assessment and is commonly used in tourism sustainability research (Dwyer and Kim, 2003; Miller and Twining-Ward, 2005). By using secondary data that can be applied consistently across places and over time, we address a key gap between tourism sustainability theory and practice.
Although our work is based on the TBL framework, it also draws on the Community Quality of Life (QoL) literature to capture social factors especially. Within TBL the social dimension is most directly connected to community well-being, and yet it is often underdeveloped in empirical applications (Boley, 2023; Elkington and Rowlands, 1999). Incorporating QoL concepts provides a resident-centered perspective that carefully considers how tourism-related changes are experienced by residents, adding depth and strength to the social sustainability dimension (Mihalič, 2000).
We draw on secondary data to construct a broad set of Sustainable Tourism Indicators (STIs) that can be applied consistently across tourism-dependent locations. While with limitations, this approach enables broad geographic coverage, consistent comparisons across destinations, and regular updating without the costs of primary data collection. We focus on the years 2009 to 2019, a relatively stable economic period between the 2007–08 Great Recession and the COVID-19 pandemic (Figure 1). From this broader pool of indicator variables, we retain a parsimonious set of six indicators (two per sustainability dimension) to construct a composite Sustainable Tourism Index (STI) that we use for benchmarking and for our COVID-19 resilience tests; we focus on these six because they are consistently available across counties and provide a transparent baseline that performs well in predicting post-shock Leisure and Hospitality employment recovery. The additional indicators are presented as supplemental measures to illustrate how the framework can be expanded as data availability and measurement priorities evolve. Because sustainability inherently involves a dimension of time, we construct the STI as a change over time rather than a level. Moreover, we restrict the sample to recreation-dependent counties,
1
because in these counties tourism and recreation are the primary drivers of economic and social change. Trend in L&H employment (million jobs), 2000–2023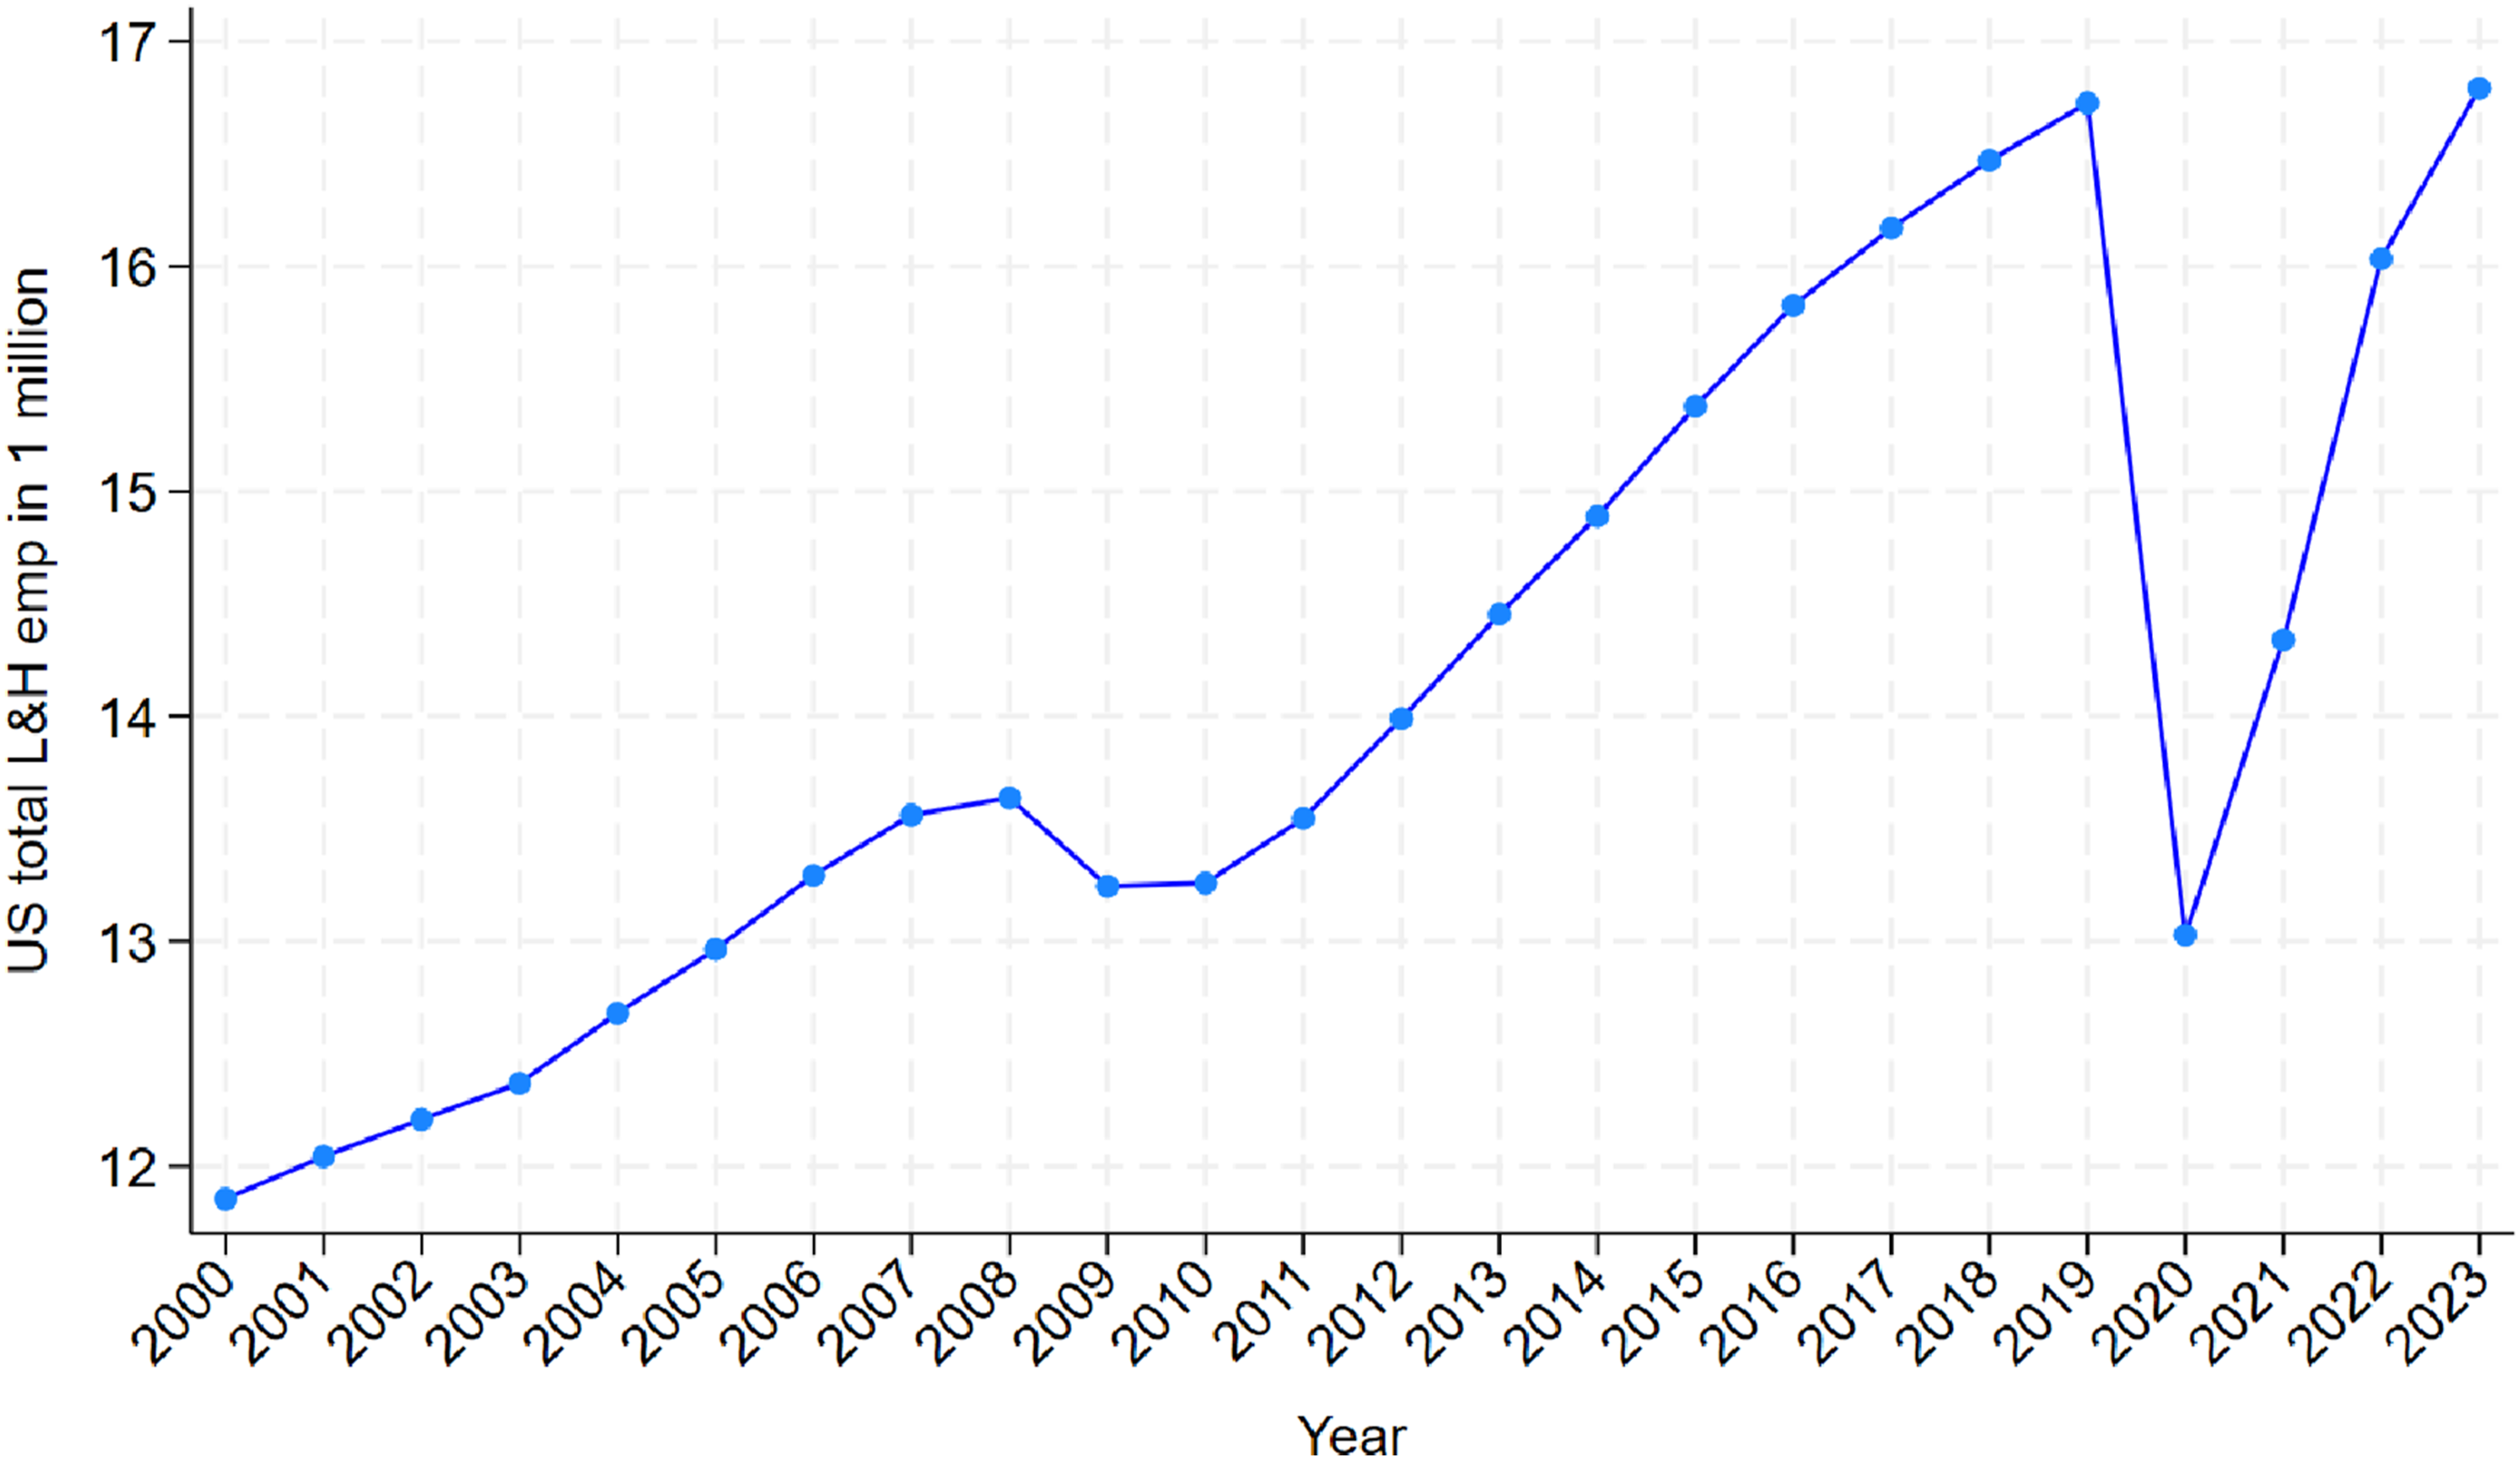
This paper makes three contributions to the literature on tourism sustainability. First, it shows how the TBL framework can be operationalized using secondary data, bridging the gap between sustainability concepts and measurement practice. Second, the paper advances understanding of tourism sustainability as a dynamic process by focusing on changes over time. Third, methodologically and practically, we suggest that it provides a replicable and cost-effective tool for researchers and practitioners to measure sustainability outcomes and to benchmark performance across destinations and over time.
A key design choice in this study is the use of counties as the unit of analysis. While sustainability challenges often arise across ecological systems or finer-grained community boundaries, counties represent a practical meso-scale in the U.S. context that connects measurement to governance. Many policy domains relevant to tourism – such as land use, housing, infrastructure, and public health – are administered or coordinated at the county level, making this scale especially useful for adaptive management and policy intervention (e.g., Han et al., 2023; Watson and Deller, 2022). Counties also provide the most consistent spatial unit for assembling longitudinal secondary data across economic, social, and environmental dimensions nationwide. We therefore treat the county scale not as a perfect representation of underlying social-ecological systems, but as a pragmatic choice between policy relevance, data consistency, and national comparability.
Literature review
The measurement and monitoring of tourism sustainability have received significant attention in the literature over the last three decades. STIs have been promoted as a means of operationalizing the abstract concept of sustainable tourism, enabling policymakers and destination managers to assess sustainability conditions, monitor change over time, and trigger policy or management responses using benchmarks, baselines, or critical thresholds (Miller and Twining-Ward, 2005; Torres-Delgado and Saarinen, 2014). Some authors argue that sustainable tourism is meaningless without indicators and monitoring tools capable of assessing impacts and determining whether they are locally acceptable (Hunter, 1997; McCool et al., 2001; Wheeller, 1993). Early STI frameworks developed by the World Tourism Organization (Rasoolimanesh et al., 2023) provided a foundation for systematic assessment of the diverse impacts of tourism on destinations. Butler’s (1999) seminal work highlighted the conceptual and practical challenges of translating sustainability principles into measurable indicators, emphasizing the need for balance across sustainability dimensions. Despite these advances, important gaps remain in how tourism sustainability is measured across places. The U.S. in particular, lacks a consistent, scalable, and longitudinal approach to indicator-based measurement, which limits comparability and ongoing monitoring. This study addresses that gap by proposing a replicable, county-level, multidimensional indicator system based on readily-available secondary data.
The measurement of tourism sustainability has evolved from early single-dimension approaches to more comprehensive frameworks that recognize the interconnected nature of economic, social, and environmental outcomes (Butler, 1999; Hunter, 1997). Recent contributions emphasize the importance of longitudinal analysis and the dynamic nature of sustainability outcomes (Font et al., 2023; Rasoolimanesh et al., 2023). Unlike static assessments that capture conditions at a single point in time, our approach aligns with emerging theoretical perspectives that view sustainability as an ongoing process requiring continuous monitoring and adaptive management (McCool et al., 2001; Torres-Delgado and Saarinen, 2014).
A related literature strand highlights the need to incorporate both objective and subjective measures. The Community QoL framework combines objective indicators, such as economic resources, employment, and access to services—with residents’ subjective evaluations, including life satisfaction, sense of belonging, and perceptions of equity (Andereck and Nyaupane, 2011). Subjective approaches rely on primary data collected through resident surveys and interviews (Choi and Sirakaya, 2006; Miller, 2001). While these studies provide rich, context-specific insights, they are also resource-intensive, difficult to replicate across destinations and often limited to short time frames. In contrast, objective approaches, most notably those using secondary data to construct STIs in other countries, have gained traction as a scalable and cost-effective alternative that supports comparative and longitudinal analysis, albeit at the expense of local nuance (Blancas et al., 2015). In addition, many destination management organizations (DMOs) and public authorities already use secondary data to estimate environmental performance, including the calculation of CO2 emissions (e.g., Scope 1 and Scope 2 where appropriate). We therefore reframe our contribution more precisely: the novelty is not that secondary-data approaches are absent in Europe, but that the U.S. tourism sustainability measurement landscape remains more fragmented and uneven across destinations, and that a replicable, county-level, longitudinal, multidimensional indicator system can help support comparability and monitoring at scale.
Despite global attention to sustainable tourism since the 1990s, the U.S. has lacked a coordinated approach to its measurement. Abolishment of the US Travel and Tourism Administration in 1996 and withdrawal from the World Tourism Organization further removed the U.S. from global efforts to promote sustainable tourism (Brewton and Withiam, 1998). Subsequent efforts to elevate sustainable tourism nationally, such as the 2005 North American Ecotourism Conference and the Bar Harbor Declaration on Ecotourism in the United States, had little influence on national policy (TIES, n.d.). Today, responsibility for sustainable tourism is fragmented across more than 50 federal agencies, with most resources directed toward environmental management and comparatively little attention paid to social impacts of tourism (Bricker, 2010).
In practice, domestic tourism development and sustainability initiatives in the U.S. have largely been left to the States. Although there are numerous programs and certification programs, they vary widely in scope and criteria and often are poorly aligned with global standards (Bricker and Schultz, 2011). This fragmentation is particularly evident in U.S. high-amenity rural and mountain destinations experiencing rapid growth in visitation. While tourism is recognized as the economic lifeblood of these communities, residents increasingly question the net benefits in light of housing pressures, congestion, and environmental stress (McCoy et al., 2025).
Recent destination-level initiatives illustrate both growing awareness of sustainability challenges and implementation difficulties. For example, Jackson Hole, Wyoming adopted a Sustainable Destination Management Plan (SDMP) in 2022 to guide development over a five-year period while balancing community well-being, visitor experiences, and protection of surrounding public lands (Jackson Hole Travel and Tourism Board, n.d.). Ongoing partnerships with academic institutions and local stakeholders aim to identify and monitor economic, social, and environmental indicators. Yet, as destination leaders have acknowledged, a central challenge lies not in data collection alone but in interpreting indicators coherently and understanding how different dimensions of sustainability interact to inform decision-making (Rotondo et al., 2022).
Outside the U.S., several national and multi-national systems have been created to institutionalize sustainability measurement in tourism. The European Union’s European Tourism Indicator System (ETIS) for Sustainable Management at Destination-Level launched in 2013 is one of the most comprehensive efforts to provide a standardized yet flexible toolkit for destination-level sustainability monitoring (European Commission, 2016). ETIS was designed as a locally owned and led process for monitoring, managing, and enhancing the sustainability of tourism destinations. It consists of a set of indicators, a toolkit, and a dataset that can be implemented by any destination without specialized training. The system is intended for use either as a standalone tool or integrated into existing destination monitoring frameworks. 2 However, the impacts of the ETIS framework have remained largely conceptual rather than realized, with few documented cases of successful integration (e.g., Ibănescu et al., 2018).
Across these frameworks, the content of sustainability indicators has continued to evolve. Economic indicators have expanded beyond tourism revenue, employment, and wages to include distributional effects and economic resilience (Dwyer and Kim, 2003; Han et al., 2023; Li et al., 2024). Social indicators increasingly incorporate objective measures of well-being such as housing affordability, poverty rates, and crime, alongside subjective assessments of resident perceptions (Boley et al., 2017; Dwyer, 2024). Environmental indicators likewise have become more sophisticated, incorporating both direct tourism impacts and broader ecosystem health measures (Castellani and Sala, 2010).
The TBL framework defines tourism sustainability based on economic, social, and environmental objectives, while Community QoL concepts clarify how these dimensions are experienced by residents, particularly within the social objective. STIs translate these complementary frameworks into measurable outcomes that support longitudinal and comparative analysis. Recent advances in tourism QoL research emphasize that the ultimate success of sustainable tourism depends on its contribution to residents’ well-being (Kim et al., 2013; Ramkissoon et al., 2025; Uysal et al., 2025). Not surprisingly, local residents tend to support tourism development when it promises to enhance their livelihoods, social relationships, and sense of community. In contrast, adverse impacts such as traffic congestion, affordability pressures, and environmental degradation that compromise sustainability of the community over time, reduce resident support and satisfaction (Uysal et al., 2023; Uysal and Sirgy, 2023). Watson and Deller (2022) argue that understanding these dynamics requires comprehensive, multidimensional measurement approaches capable of capturing change over time. However, despite growing interest in such measurement, for example of resilience and recovery following shocks (Calgaro et al., 2014; Han et al., 2023), longitudinal analysis of STIs, especially in the U.S. remains rare.
While broad agreement exists that STIs can simplify, clarify, and summarize information for policymakers, thus enabling evidence-based decisions and more effective actions (United Nations, 2007), there is no consensus on the preferred or dominant approach to measuring sustainability (Miller and Torres-Delgado, 2023). Responding to this need, policymakers have increasingly called for expanded tourism statistics and indicators that explicitly incorporate environmental, social, and economic dimensions at subnational scales. In 2016, the WTO Committee on Statistics initiated the Measuring the Sustainability of Tourism (MST) program, resulting in the Statistical Framework for Measuring the Sustainability of Tourism (SF-MST), which seeks to harmonize data collection and reporting across scales.
Previous research in the U.S. has focused on sustainable tourism and globalization in the U.S. (Sharif et al., 2021), the Global Sustainable Tourism Criteria’s applicability to U.S. National Parks (Bricker et al., 2022), and voluntary statewide sustainable tourism certification programs (Bricker and Schultz, 2011). However, few if any studies address the need for longitudinal and multidimensional approaches that enable consistent measurement and comparison across destinations. Both academics and practitioners recognize that robust data are essential for improving local management of tourism industries and destinations. Despite continued efforts by organizations such as the WTO (2020) to establish a standardized framework, questions remain about who should measure performance, what should be measured and how, and at what scale. In response to these challenges, we propose using readily available secondary data to develop comprehensive STIs. Our approach offers a novel scalable method that enables both longitudinal analysis within communities and cross-sectional comparisons among tourism destinations.
Measures and data sources
This study uses data selected based on their reliability, geographic coverage, and temporal consistency to enable robust analysis of changes in recreation-dependent U.S. counties between 2009 and 2019. We start by considering 16 total potential indicators from which we select a subset of six representative, workable indicators for further analysis. Our selection of these six key indicators across economic, social, and environmental dimensions is guided by both theoretical foundations in sustainability research and practical considerations regarding data availability and relevance to tourism-dependent communities.
The economic dimension is captured through changes in the rent burden index and poverty rates. As documented in the sustainable tourism literature, rent burden is a critical indicator of whether local residents benefit from tourism activities or whether economic gains come at the expense of community displacement (Novy and Colomb, 2017; Wachsmuth and Weisler, 2018). Poverty rate changes complement this by directly reflecting the distributional effects of tourism development on local communities, a key aspect emphasized in recent sustainable tourism frameworks (Khan et al., 2019).
The rent burden represents the share of renter-occupied housing units for which costs exceed 30% of household income, a threshold widely recognized by the U.S. Department of Housing and Urban Development as indicating housing cost stress. The data are from the U.S. Census Bureau’s American Community Survey (ACS) 5-year estimates for 2007–2011 and 2017–2021 (U.S. Census Bureau, 2021a) 3 . We use these periods to ensure that 2009 and 2019 fall in the middle of the estimation windows, providing the most representative data for our analysis period. Poverty rates are from the U.S. Census Bureau’s Small Area Income and Poverty Estimates (SAIPE) program for 2009 and 2019 (U.S. Census Bureau, 2021b). This program provides annual estimates of the share of population living below federal poverty thresholds, which vary by family size, age of members, and are adjusted annually for inflation.
For the social dimension, violent crime rates and life expectancy provide critical insights into community wellbeing and stability. Crime rates are widely recognized as a significant factor in tourism sustainability, with research indicating that increasing crime rates can significantly hamper tourism development (Modica et al., 2023). As noted by the Center for Problem-Oriented Policing, “the most important prerequisite for a successful tourist industry is a reputation for having crime under control and guaranteeing tourists’ safety” (Center for Problem-Oriented Policing, n.d.). Life expectancy serves as a comprehensive indicator of overall community health and wellbeing, reflecting various social determinants including healthcare access, lifestyle factors, and environmental conditions.
Violent crime statistics are from the Federal Bureau of Investigation’s Uniform Crime Reporting (UCR) program for 2009 and 2019 (Federal Bureau of Investigation, 2021). The UCR program collects data on violent crimes including murder, rape, robbery, and aggravated assault, reported per 100,000 population. We focus on violent rather than property crimes as they more directly impact residents’ quality of life and tourists’ safety perceptions. Life expectancy data are from the Institute for Health Metrics and Evaluation (IHME) for 2009 and 2019, calculated at the county level using vital statistics and demographic data (Institute for Health Metrics and Evaluation, 2021). Life expectancy at birth serves as a summary measure capturing the cumulative effects of health care access, environmental conditions, lifestyle factors, and socioeconomic circumstances. Recent studies have established connections between environmental degradation, particularly air pollution, and reduced life expectancy, which links our environmental and social indicators (Rahman et al., 2022).
The environmental indicators -- PM2.5 levels and pollution sites -- were selected based on their direct relevance to tourism sustainability and their established relationships with both environmental quality and human wellbeing. Research has demonstrated that PM2.5 (particles with diameter less than 2.5 μg/m3) exposure is significantly linked to reduced life expectancy, with a global reduction of approximately 1 year in average life expectancy attributed to this pollutant (Lelieveld et al., 2018). Tourism activities can both contribute to and be affected by air quality, making this an essential sustainability metric. Similarly, pollution sites represent a broader measure of environmental degradation that can impact tourism attractiveness and long-term viability of destinations. These environmental indicators are particularly relevant for recreation-dependent counties where natural amenities often serve as primary tourism draws.
The PM2.5 data are from the National Environmental Public Health Tracking Network for 2009 and 2019, measured as annual average concentrations in micrograms per cubic meter (Centers for Disease Control and Prevention, 2021). PM2.5 is a critical air quality indicator as these particles penetrate deep into lungs and bloodstream, causing cardiovascular and respiratory impacts. The data are derived from EPA monitoring stations and modeled to provide county-level estimates. General pollution measures are from the National Neighborhood Data Archive (NANDA) for 2010 and 2020, the closest available years to our study period (National Neighborhood Data Archive, 2021). NANDA aggregates data on various pollution sources including EPA-regulated facilities, Superfund sites, brownfields, and toxic release inventory sites, providing a count of pollution sites per county normalized by area. This comprehensive measure captures the cumulative burden of environmental hazards that can affect both resident health and tourism attractiveness.
As noted earlier, we use the USDA Economic Research Service (ERS) typology for recreation-dependent counties, which identifies recreational counties based on employment and income from recreation-related activities, seasonal housing, and per capita receipts from the hospitality and tourism sectors. This classification ensures our sample consists of, and for purposes of testing the indicators is limited to, areas where tourism plays a significant role in the local economy. For the time series analysis of tourism sector employment shown in Figure 1, we use the enhanced Quarterly Census of Employment and Wages (QCEW) data, which provides estimated data values in cases of non-disclosure to allow complete coverage of employment trends in recreation-dependent counties (Watson and Alward, 2024).
In addition to the six core indicators used to construct the STI, we assembled 10 supplemental indicators to broaden coverage of environmental and social conditions that may be relevant for destination sustainability, while maintaining a consistent county-level, secondary-data structure. These additional measures are presented and mapped in the Appendix and include land-cover change indicators (forest cover and woody land) drawn from NANDA; climate exposure measures (extreme temperature and extreme precipitation) from PRISM weather data; a geocoded greenhouse gas emissions measure from the Vulcan project; and several community-context indicators capturing inequality and demographic change (Gini index and percent nonwhite) and commuting time from the 5-year ACS. We also include population well-being and place-based social infrastructure measures, including poor mental health days from County Health Rankings & Roadmaps and “third places” (e.g., sit-in restaurants, bars, and coffee shops) from NANDA. Consistent with our main indicators, we compute changes over the study period and use these supplemental measures to provide additional descriptive context and exploratory validation (reported in the Appendix), rather than incorporating them into the primary composite STI.
Method
The construction of the composite STI follows established methodological principles for composite indicator development (Joint Research Centre, 2008). Our approach aligns with the European Commission’s guidelines for indicator development, which emphasize the importance of theoretical relevance, data quality, and practical applicability (Saisana and Tarantola, 2002). The selection of six indicators across three sustainability dimensions reflects the widely accepted triple bottom line framework while addressing specific methodological considerations for tourism-dependent communities.
The indicator selection process was guided by several methodological criteria established in the sustainability measurement literature (Blancas et al., 2015; Torres-Delgado and Saarinen, 2014): (1) theoretical relevance to tourism sustainability concepts, (2) data availability and reliability across all recreation-dependent counties, (3) temporal consistency to enable longitudinal analysis, and (4) policy relevance for destination management decisions. This systematic approach ensures that our indicators meet the quality standards outlined by the Joint Research Centre of the European Commission for composite indicator development (Saisana and Tarantola, 2002).
We distinguish between the individual STIs (the underlying indicator components) and the composite STI (the overall index). We retain the six-indicator composite as a parsimonious baseline because it is transparent, consistently measurable across counties and time, and it performs well in the resilience regressions: the composite STI robustly predicts both short-term and longer-horizon Leisure and Hospitality employment rebound. The 10 supplemental indicators are therefore reported descriptively and mapped in the Appendix to demonstrate the extensibility of the framework, but they are not incorporated into the composite index used in the primary resilience tests.
Summary statistics for indicators for recreational counties.
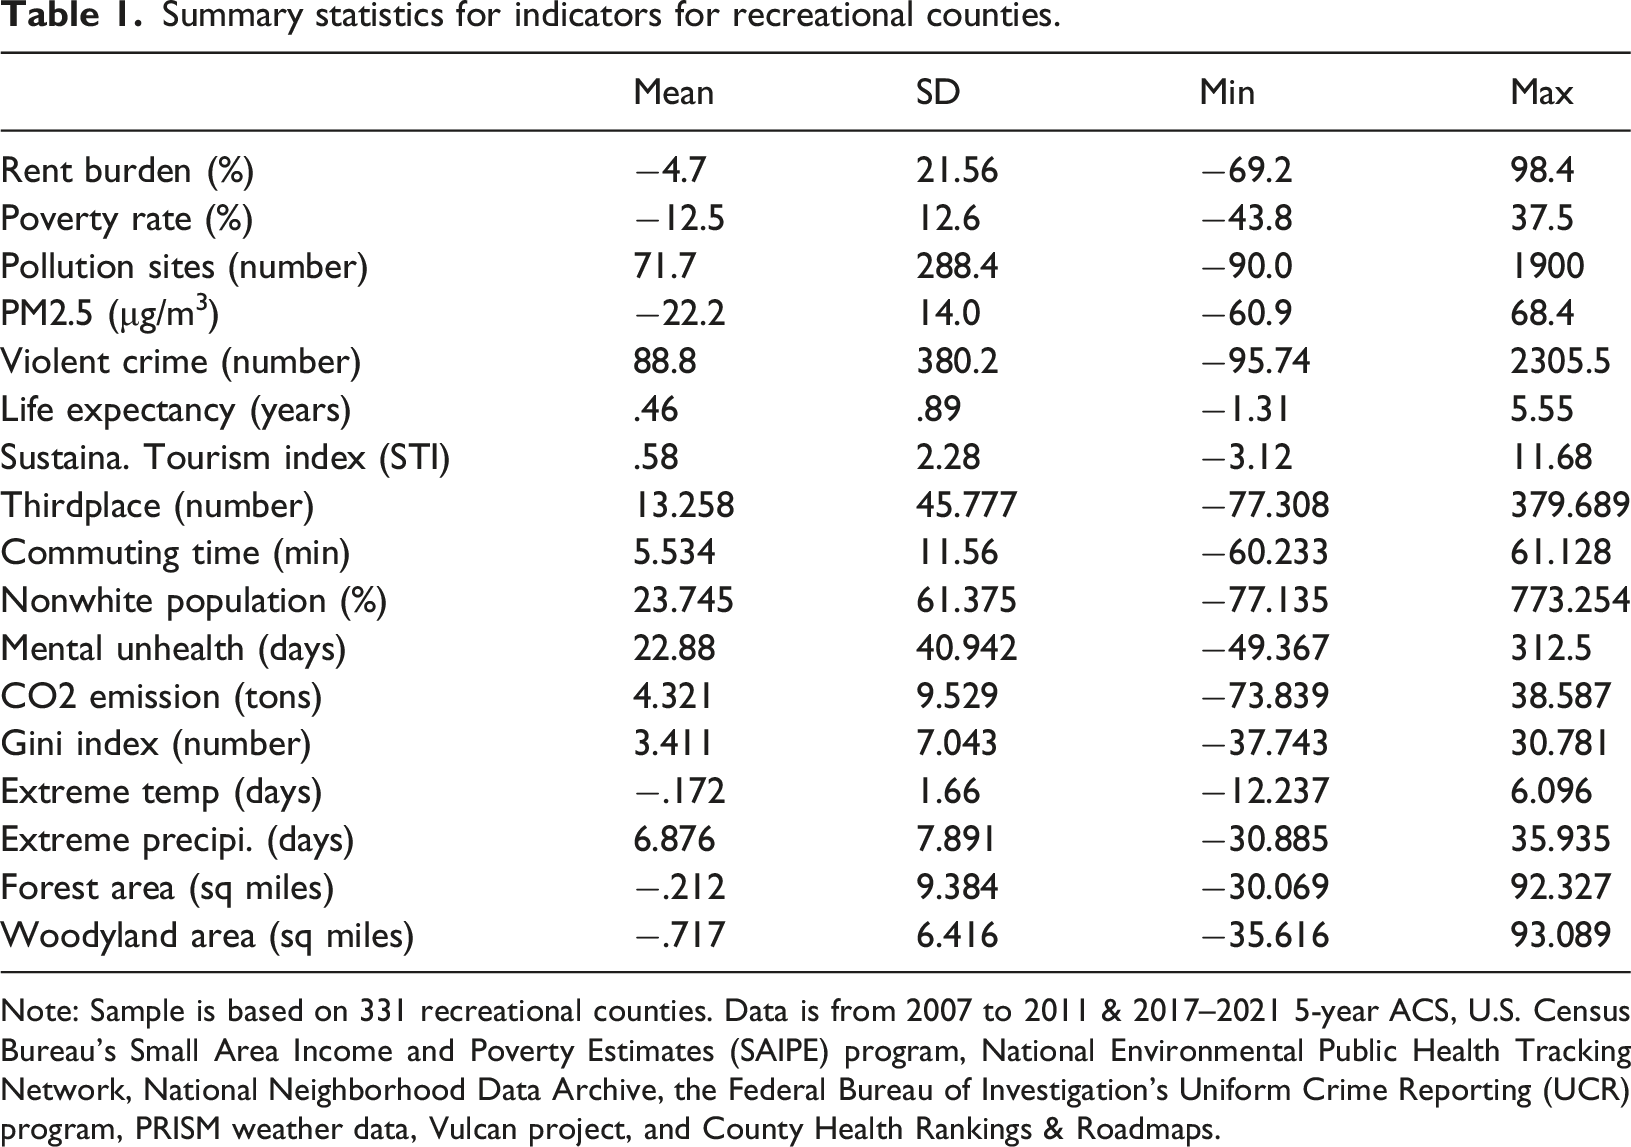
Note: Sample is based on 331 recreational counties. Data is from 2007 to 2011 & 2017–2021 5-year ACS, U.S. Census Bureau’s Small Area Income and Poverty Estimates (SAIPE) program, National Environmental Public Health Tracking Network, National Neighborhood Data Archive, the Federal Bureau of Investigation’s Uniform Crime Reporting (UCR) program, PRISM weather data, Vulcan project, and County Health Rankings & Roadmaps.
Total Leisure and Hospitality (L&H) employment in recreation counties increased steadily from 13.2 million in 2009 to 16.7 million in 2019, for an average annual growth rate of over 2 % (Figure 1). This sustained growth was dramatically disrupted in 2020 by the COVID-19 pandemic, when employment dropped to around 13 million, followed by a strong subsequent recovery (Han et al., 2023). The stable employment increase from 2009 to 2019 supports using this timeframe to analyze STIs, as it represents a period without major external shocks that could distort the relationships among the economic, social, and environmental measures.
We calculate percent changes in each indicator between 2009 and 2019, following established practices in sustainability measurement that emphasize the importance of tracking changes over time rather than static levels (Font et al., 2023; Miller and Torres-Delgado, 2023). This dynamic approach aligns with theoretical frameworks that view sustainability as an ongoing process rather than a fixed state (McCool et al., 2001). The underlying calculation is: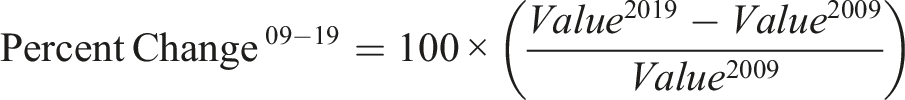
By focusing on the recreation-dependent counties, we can isolate and analyze the relationships between tourism development and various sustainability measures. 4 For each indicator, we consider the direction of change in terms of sustainability (Castellani and Sala, 2010; Dwyer and Kim, 2003). The rent burden component is measured as the share of renter-occupied housing units whose costs exceed 30% of household income. Decreases in this index indicate improved rent burden and are considered beneficial for economic sustainability, as they suggest that tourism development has not priced out local residents. Conversely, increases in the index indicate deteriorating rent burden conditions.
Declining poverty rates also indicate improved economic sustainability. Reductions in PM2.5 levels and pollution measures reflect enhanced environmental sustainability. Reduction in violent crime rates and increases in life expectancy indicate improved social sustainability. It is important to note that stable levels of any of these variables indicate sustainable local conditions, whereas reductions in the variable suggest improvements.
To deal with missing data, we use hierarchical imputation to preserve geographic and urban-rural characteristics, following practices outlined in tourism research methodology (Crouch and Ritchie, 1999). 5 Values missing for individual counties are first replaced with the mean value of counties within the same state and metropolitan status category (metro or non-metro). This ensures that imputed values reflect both the regional economic conditions of the state and the urban-rural context that significantly influences tourism development patterns. 6
In cases where state-level means by metro/non-metro status are unavailable due to insufficient observations, we expand the geographic scope and use means calculated at the U.S. Census division level (e.g., New England, Middle Atlantic, East North Central), still maintaining the metropolitan/non-metropolitan distinction. This hierarchical approach balances the need for localized relevance with statistical reliability, ensuring comprehensive coverage across all recreation-dependent counties while minimizing potential biases from imputation. However, because it relies on regional averaging, this imputation strategy can smooth local extremes and may attenuate spatial variation if missingness is systematic in certain types of counties.
To synthesize these diverse indicators into a comprehensive measure of tourism sustainability, we develop an overall sustainable tourism index that integrates economic, social, and environmental dimensions with equal weighting. 7 This composite index provides a holistic view of sustainability outcomes across recreation-dependent counties, enabling more straightforward comparison and benchmarking.
Our approach to constructing this index involves several methodological steps. First, we address the directional inconsistency in the indicators, where some metrics indicate improvement when values increase (life expectancy) while others show improvement when values decrease (rent burden index, poverty rates, pollution sites, PM2.5 levels, violent crime rates). To create a consistent framework where higher values universally represent better sustainability outcomes, we invert the percentage changes for rent burden, poverty rates, pollution sites, PM2.5 levels, and violent crime rates. This transformation ensures that positive values consistently indicate improvements in sustainability conditions across all dimensions.
Second, we standardize each direction-adjusted indicator using z-scores. This normalization process converts each indicator to a common scale with a mean of zero and a standard deviation of one, thereby accounting for the different units and magnitudes of the original measures. The standardization enables meaningful aggregation across diverse sustainability dimensions while preserving the relative performance differences between counties.
Finally, we calculate the composite sustainable tourism index by summing the six standardized z-scores for each county. This additive approach gives equal weight to each indicator, reflecting the balanced consideration of economic, social, and environmental dimensions central to the concept of sustainable tourism. The resulting index, visualized in Figure 6, provides a comprehensive spatial representation of overall tourism sustainability performance across recreation-dependent counties in the United States.
Testing sustainable tourism index using % L&H employment drop 2019–2020 and rebounds 2020–2021, 2020–2022, 2020–2023, and 2020–2024.
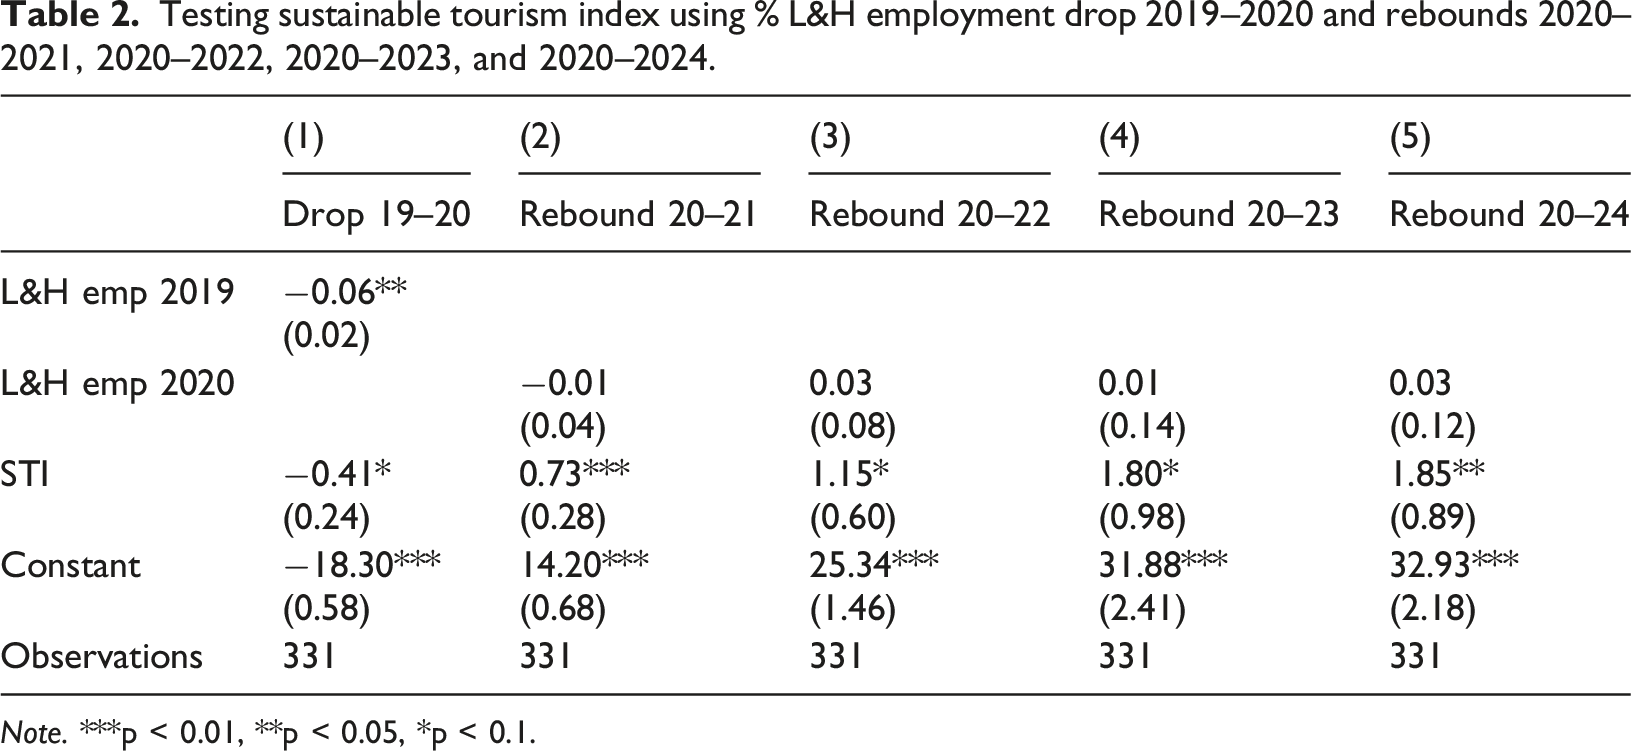
Note. ***p < 0.01, **p < 0.05, *p < 0.1.
Results
The analysis reveals three primary findings. First, sustainability outcomes are highly heterogeneous, with substantial spatial variation and no single county performing well on all metrics. Second, clear regional patterns emerge: Western counties tend to score higher overall, while also facing notable challenges from elevated rent burdens and higher rates of violent crime. Third, the social dimension—especially the rise in violent crime—appears to be the largest and most widespread sustainability challenge for recreation-dependent communities during this period. The following sections present results for each dimension.
The analysis of changes in the individual STIs (indicator components) between 2009 and 2019 shows pronounced spatial variation across the economic, social, and environmental dimensions in recreation-dependent counties. Table 1 provides summary statistics for the key indicators, reporting the mean, standard deviation, minimum, and maximum percentage changes across the 331 counties in our sample.
On the economic dimension, recreation-dependent counties experienced mixed outcomes. Rent burden declined by 4.7% on average but varied widely, from a 69.2% improvement to a 98.4% deterioration, indicating that some tourism-dependent communities saw improved affordability while others faced severe pressures. Poverty rates showed more uniformly positive trends, with a mean reduction of 12.5%, suggesting that most recreation-dependent counties experienced improved economic conditions for residents over this period (Figure 2). Recreation-dependent counties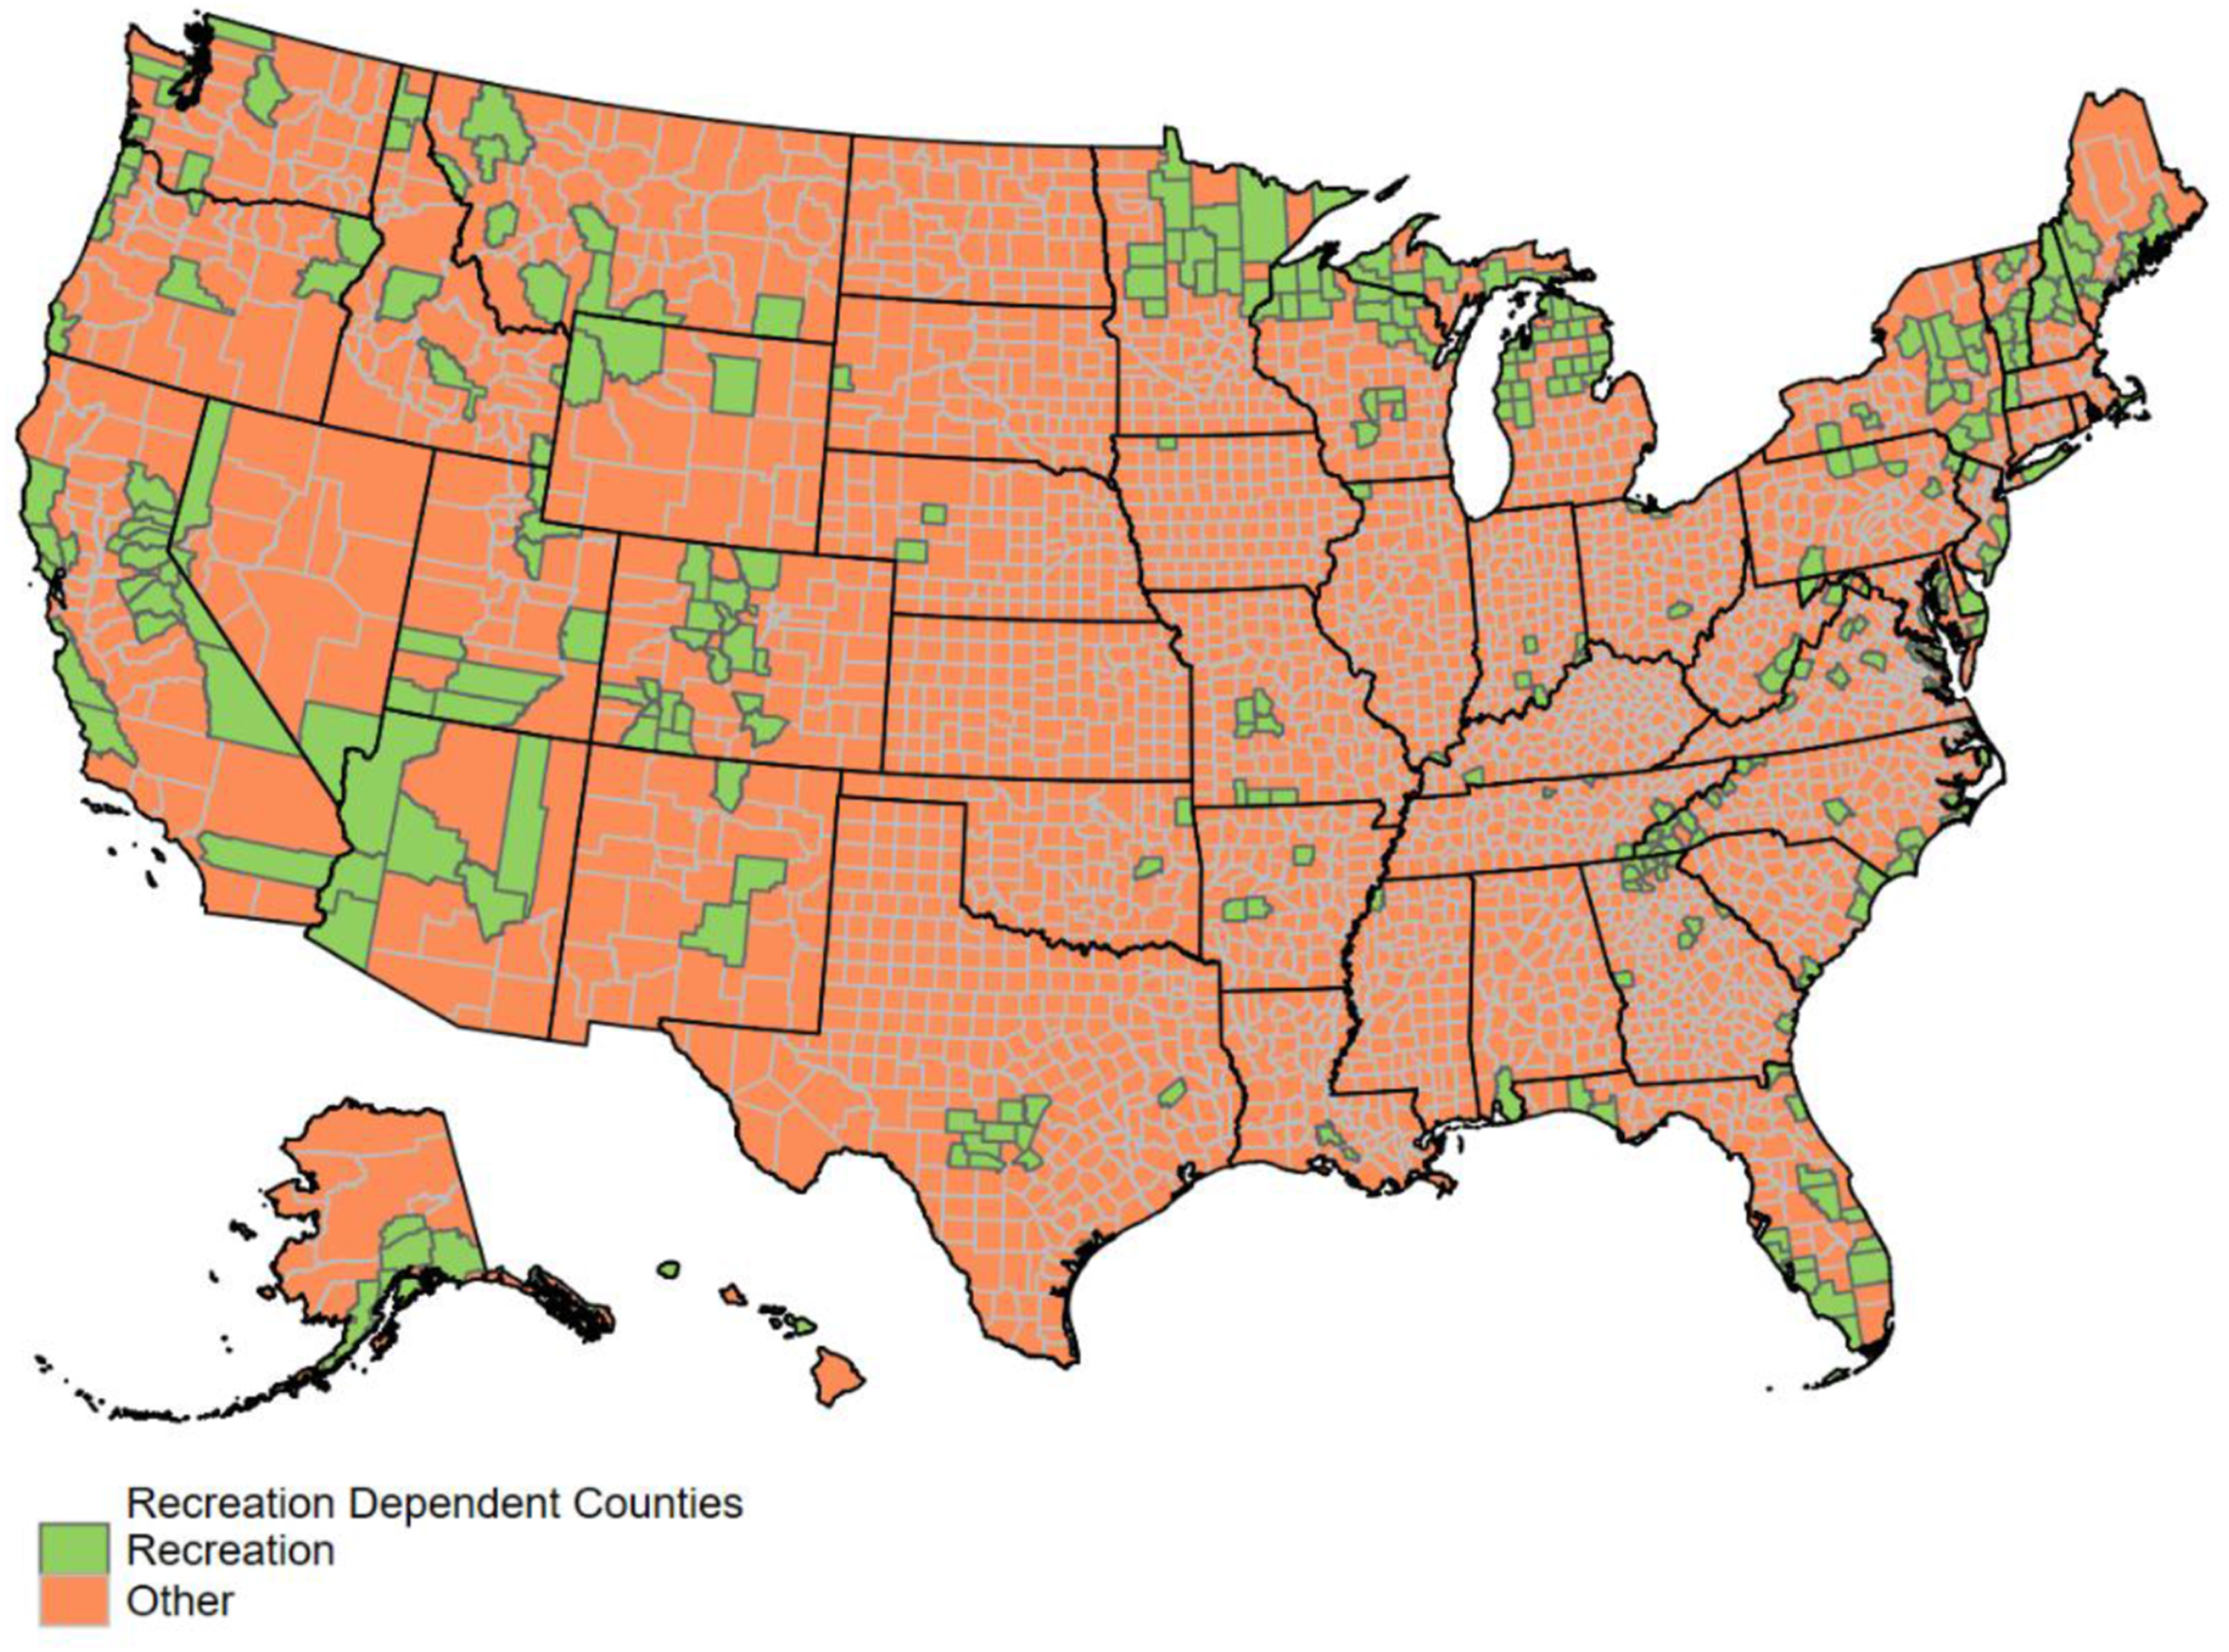
Figure 3 shows the spatial distribution of these economic indicators. The left panel maps changes in rent burden, highlighting the largest increases in housing costs in the western United States—particularly California, Oregon, and parts of Colorado—while many counties in the Midwest and parts of the Southeast improved. The right panel maps changes in poverty rates, showing widespread reductions across much of the West, the northern Plains, and parts of the Mountain West, alongside pockets of increases in portions of the Southeast and Southwest. Percent change for economic indicators, 2009–2019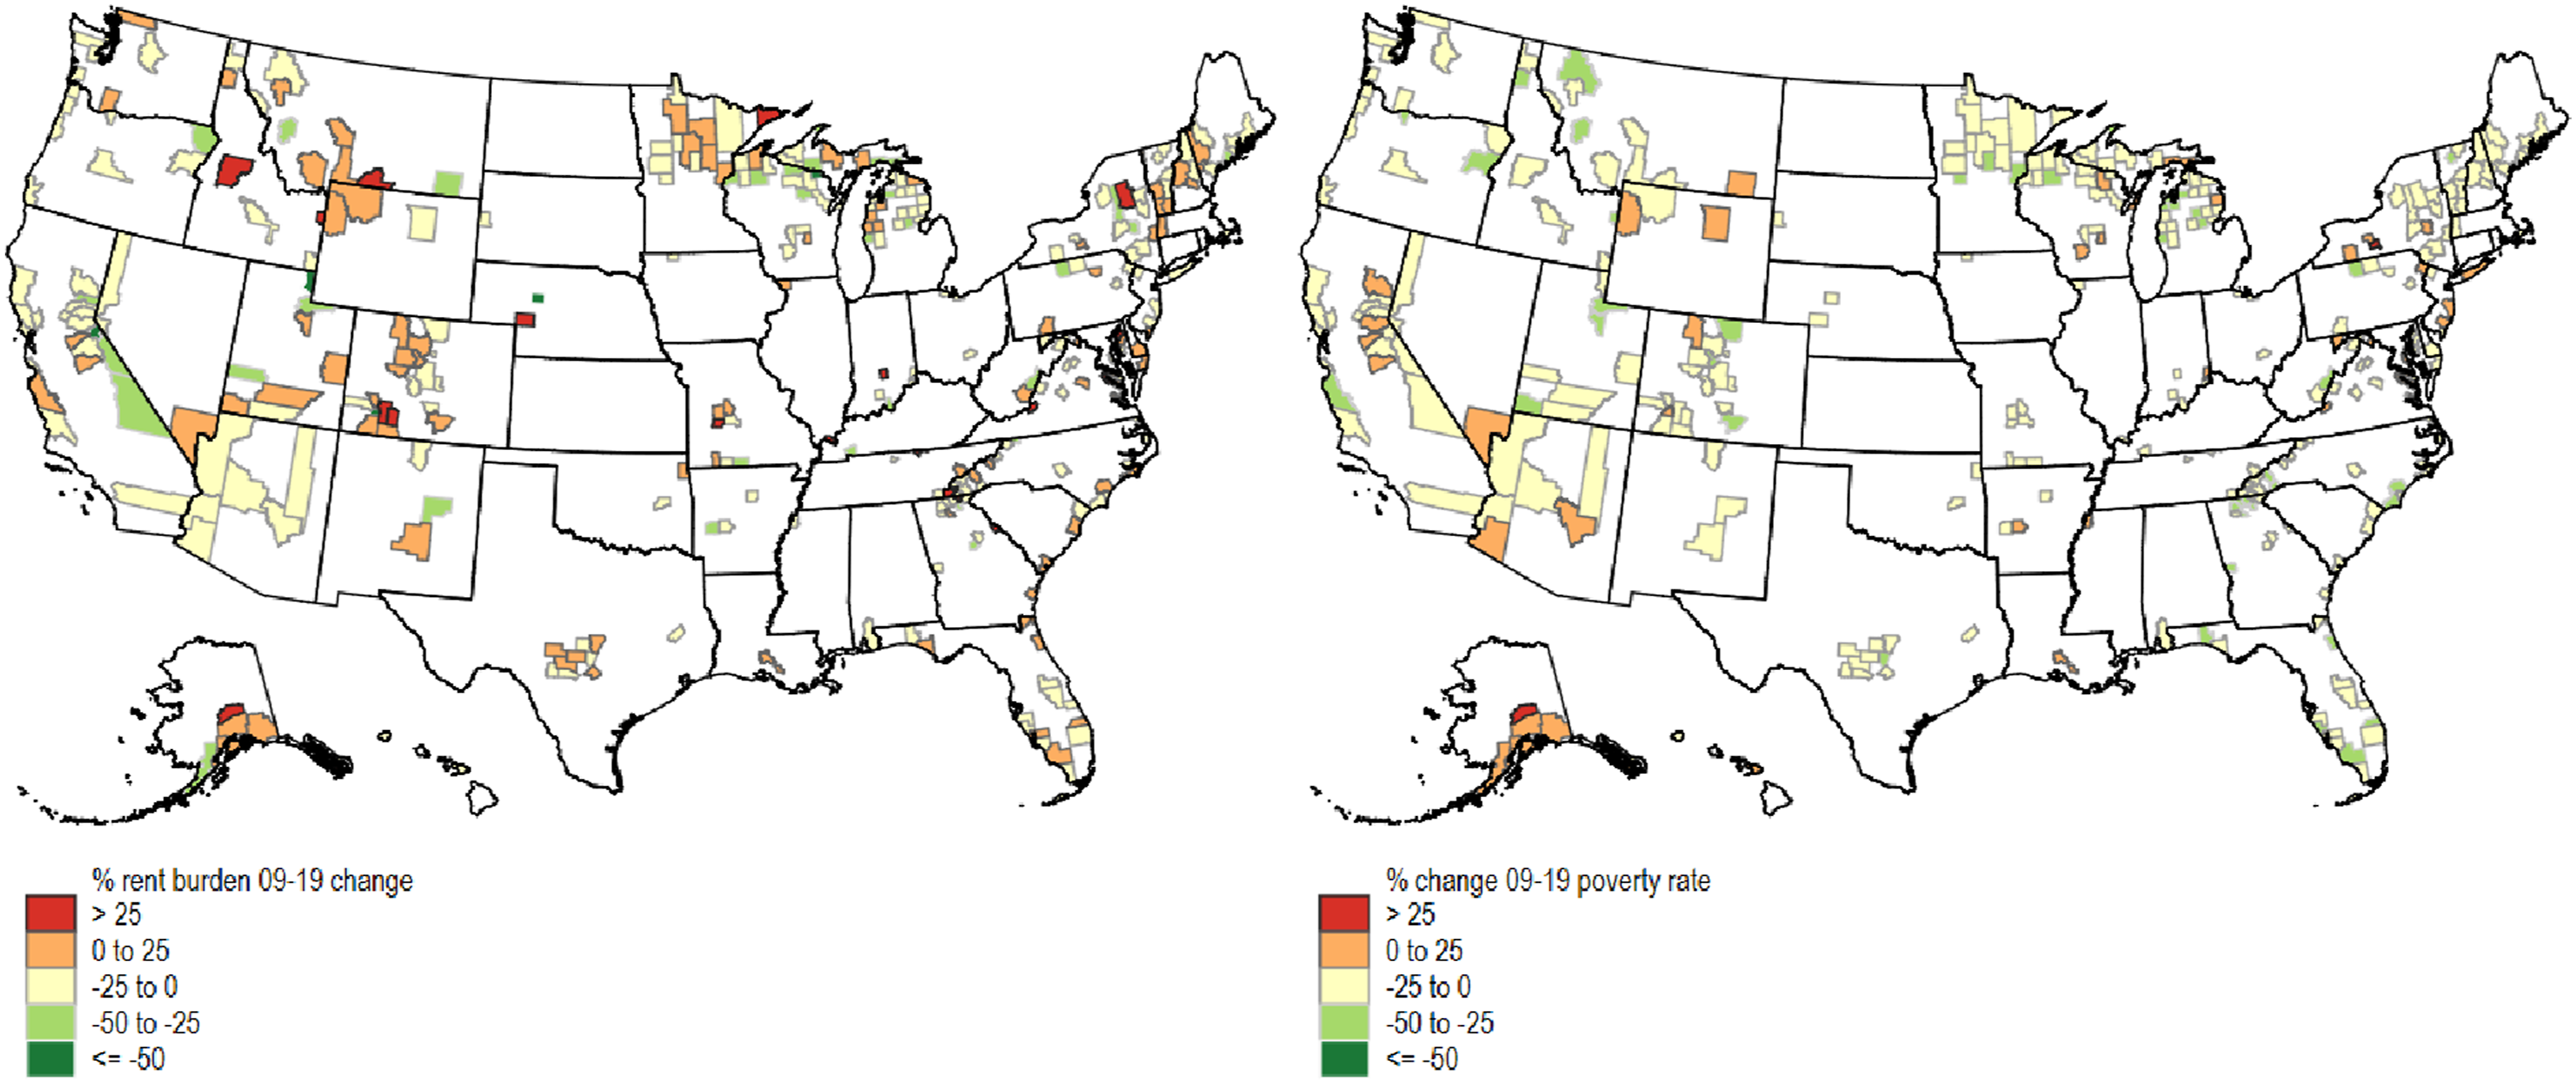
Social indicators display the most concerning trends. Violent crime increased sharply, with a mean rise of 88.79% and substantial dispersion across counties. Life expectancy improved modestly on average (0.46%), ranging from a 1.31% decrease to a 5.55% increase.
Figure 4 visualizes these outcomes. The violent crime map shows widespread increases across recreation-dependent counties, with especially large rises in parts of the Mountain West, the upper Midwest, and scattered counties elsewhere, underscoring that the pattern is not confined to a single region. The life expectancy map is more positive overall, with improvements concentrated in parts of the western United States and declines appearing in some counties in the Southeast and parts of the Midwest. Percent change for social indicators, 2009–2019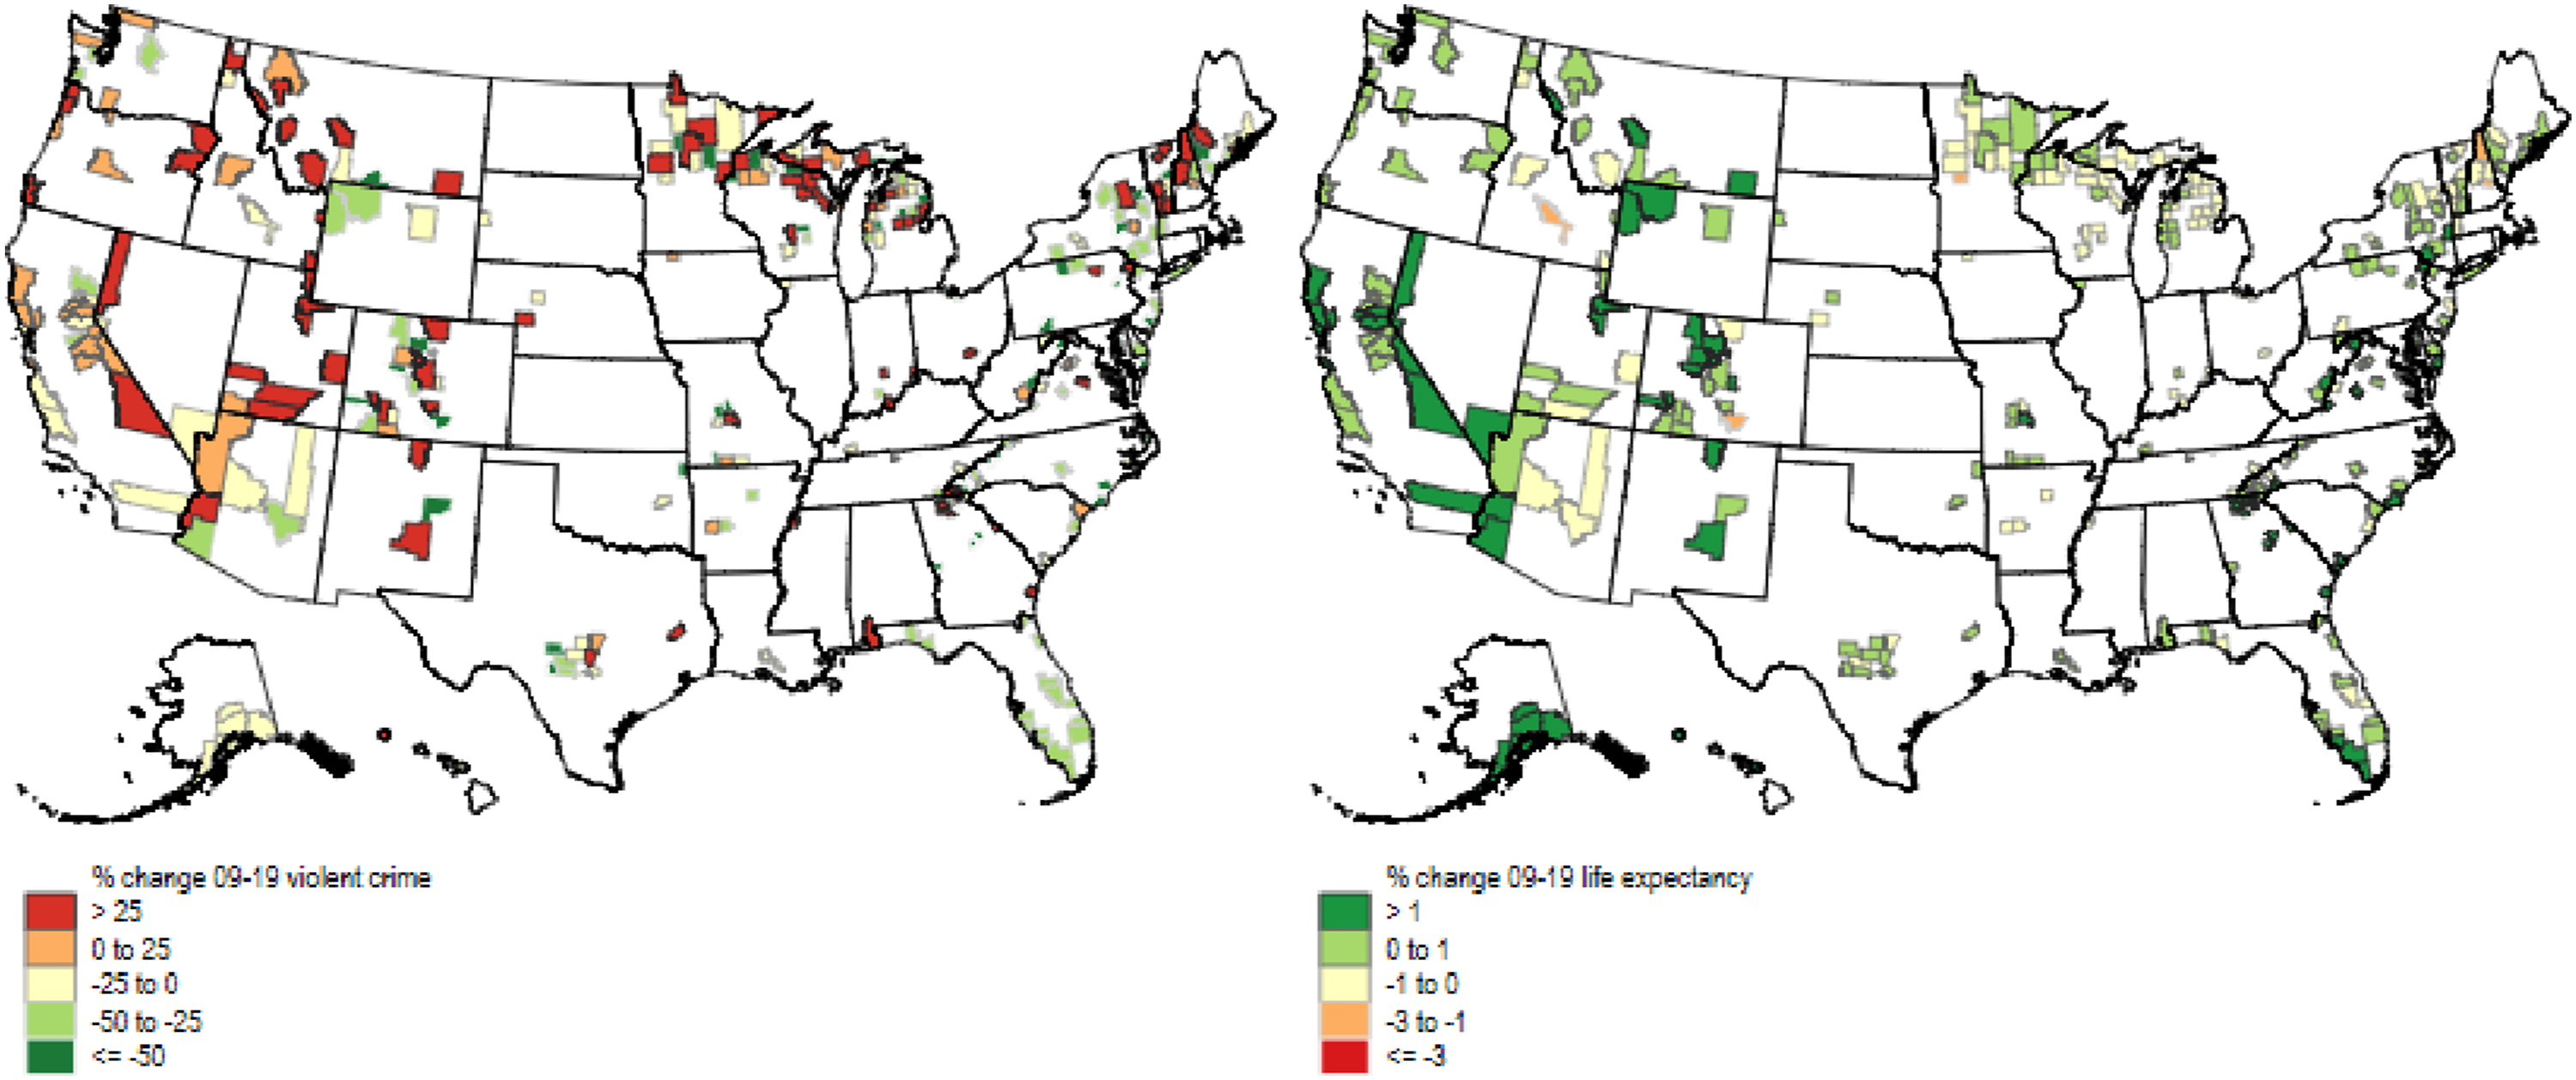
Environmental indicators present a more mixed picture. Pollution sites increased by 71.7% on average, with high variance indicating strong heterogeneity across counties. In contrast, PM2.5 decreased by an average of 22.2%, indicating broad improvements in air quality across recreation-dependent counties.
Figure 5 maps these environmental changes. Changes in pollution sites are localized, with scattered increases across the country and notable concentrations in parts of Florida, the Northeast, and isolated western counties. The PM2.5 panel shows more systematic improvements, with the largest gains in the eastern United States, while some western counties—especially in California and the Southwest—show smaller improvements or slight increases, potentially reflecting traffic growth, wildfire impacts, or both. Percent change for environmental indicators, 2009–2019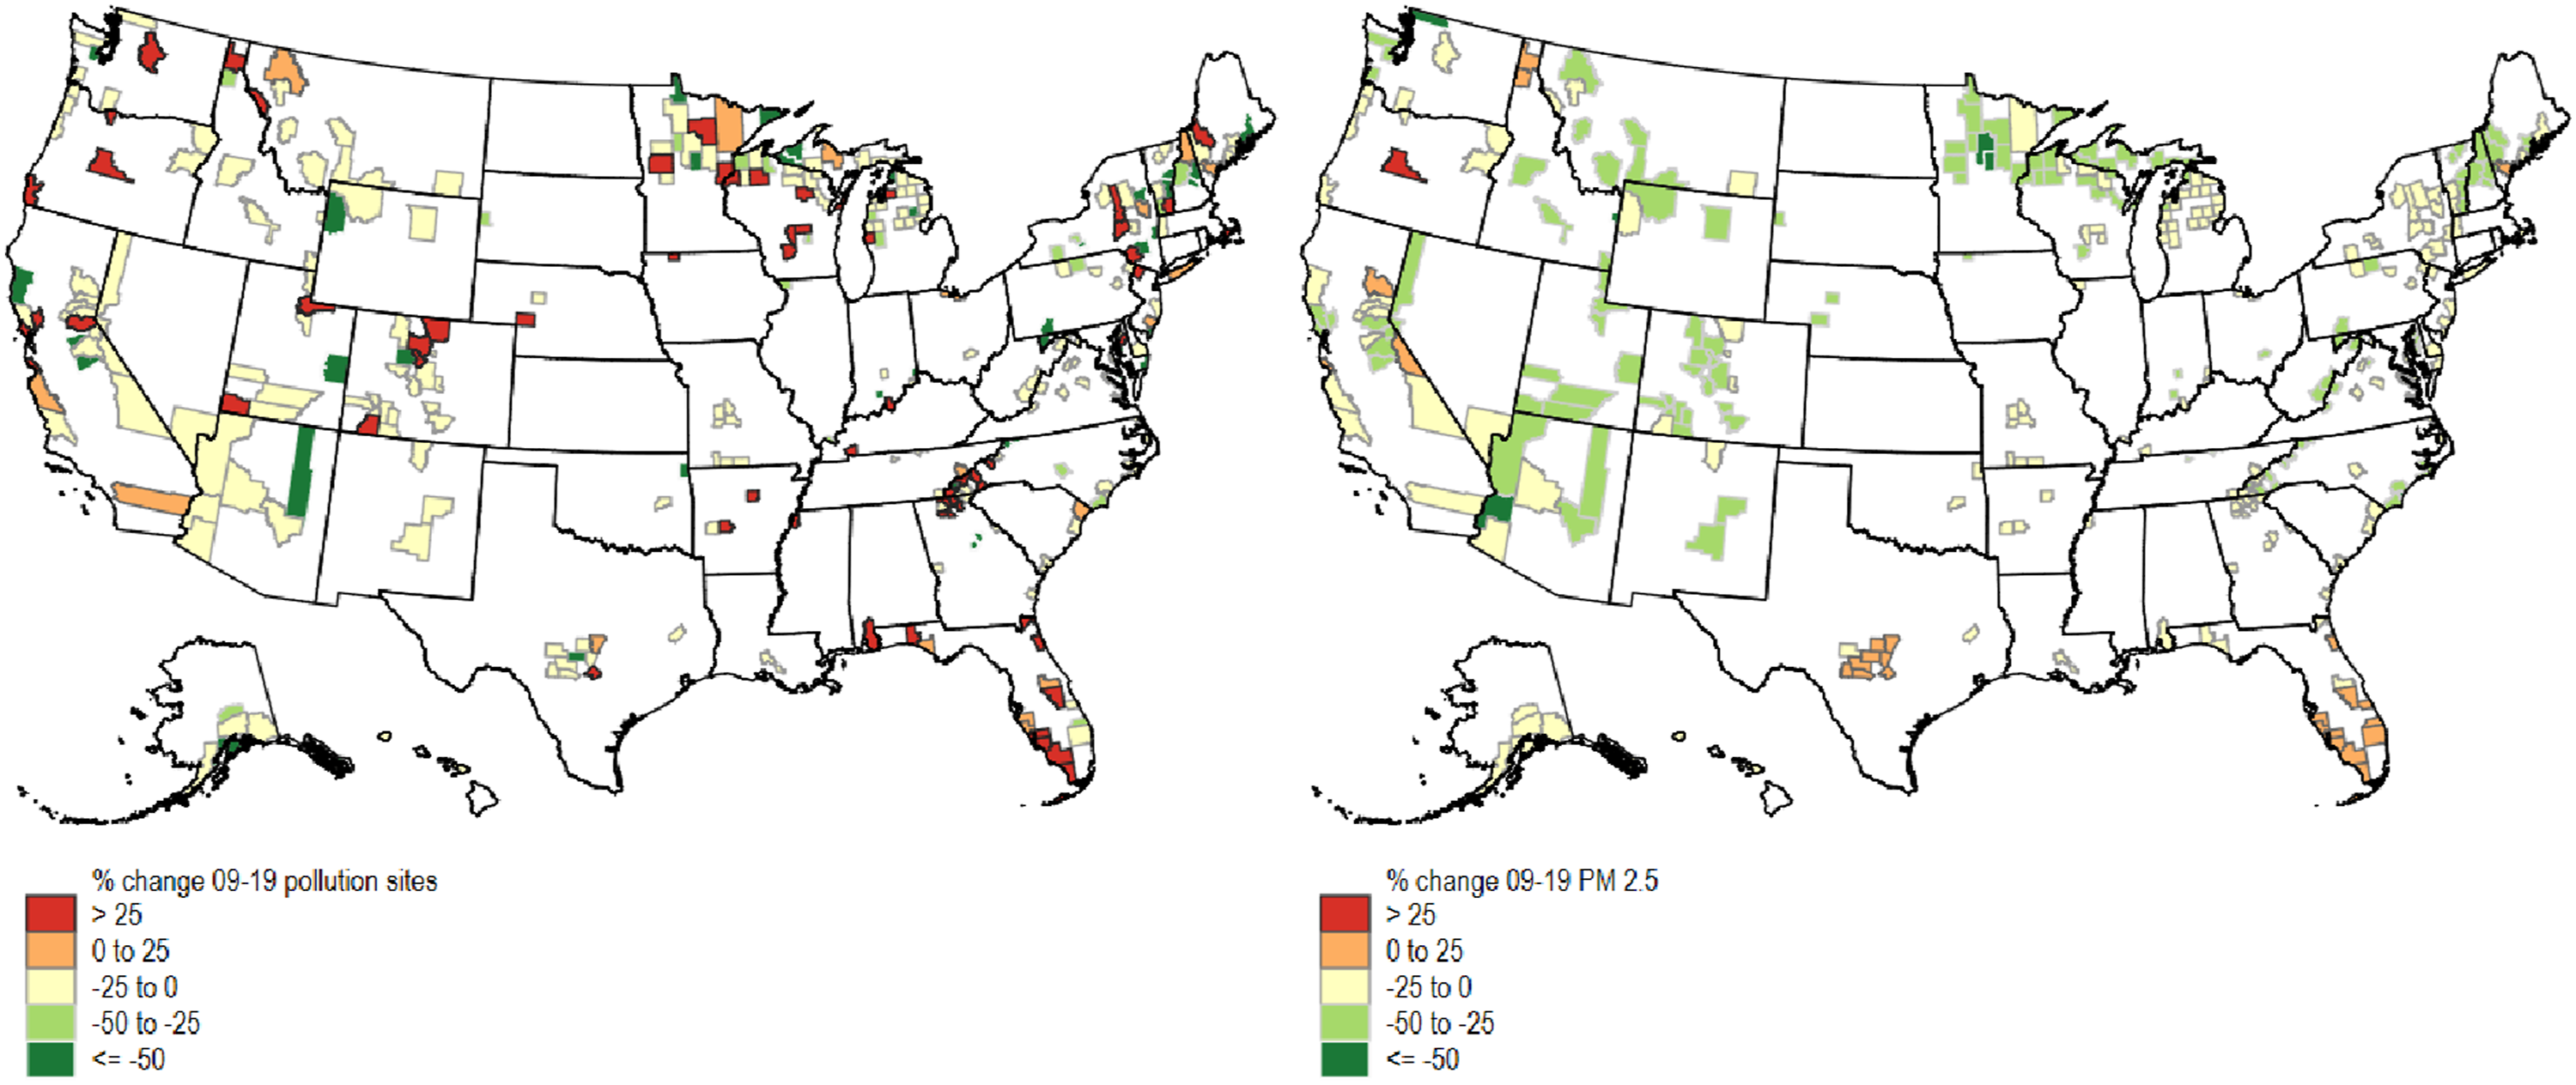
The composite sustainable tourism index, which integrates the six indicators (rent burden, poverty, pollution sites, PM2.5, violent crime, and life expectancy), has a mean of 0.58 and ranges from −3.12 to 11.68. Figure 6 shows clear geographic patterns in overall sustainability performance. The highest-performing counties (index values >2) are concentrated in the Mountain West, Pacific Northwest, and Alaska, with clusters in California, Oregon, Washington, Idaho, Montana, and Wyoming, indicating a stronger balance across economic, social, and environmental dimensions. Lower-performing counties (index values < −2) are more dispersed but appear in clusters in parts of the Southwest, Florida, and several isolated areas across the country. Sustainable tourism index, 2009–2019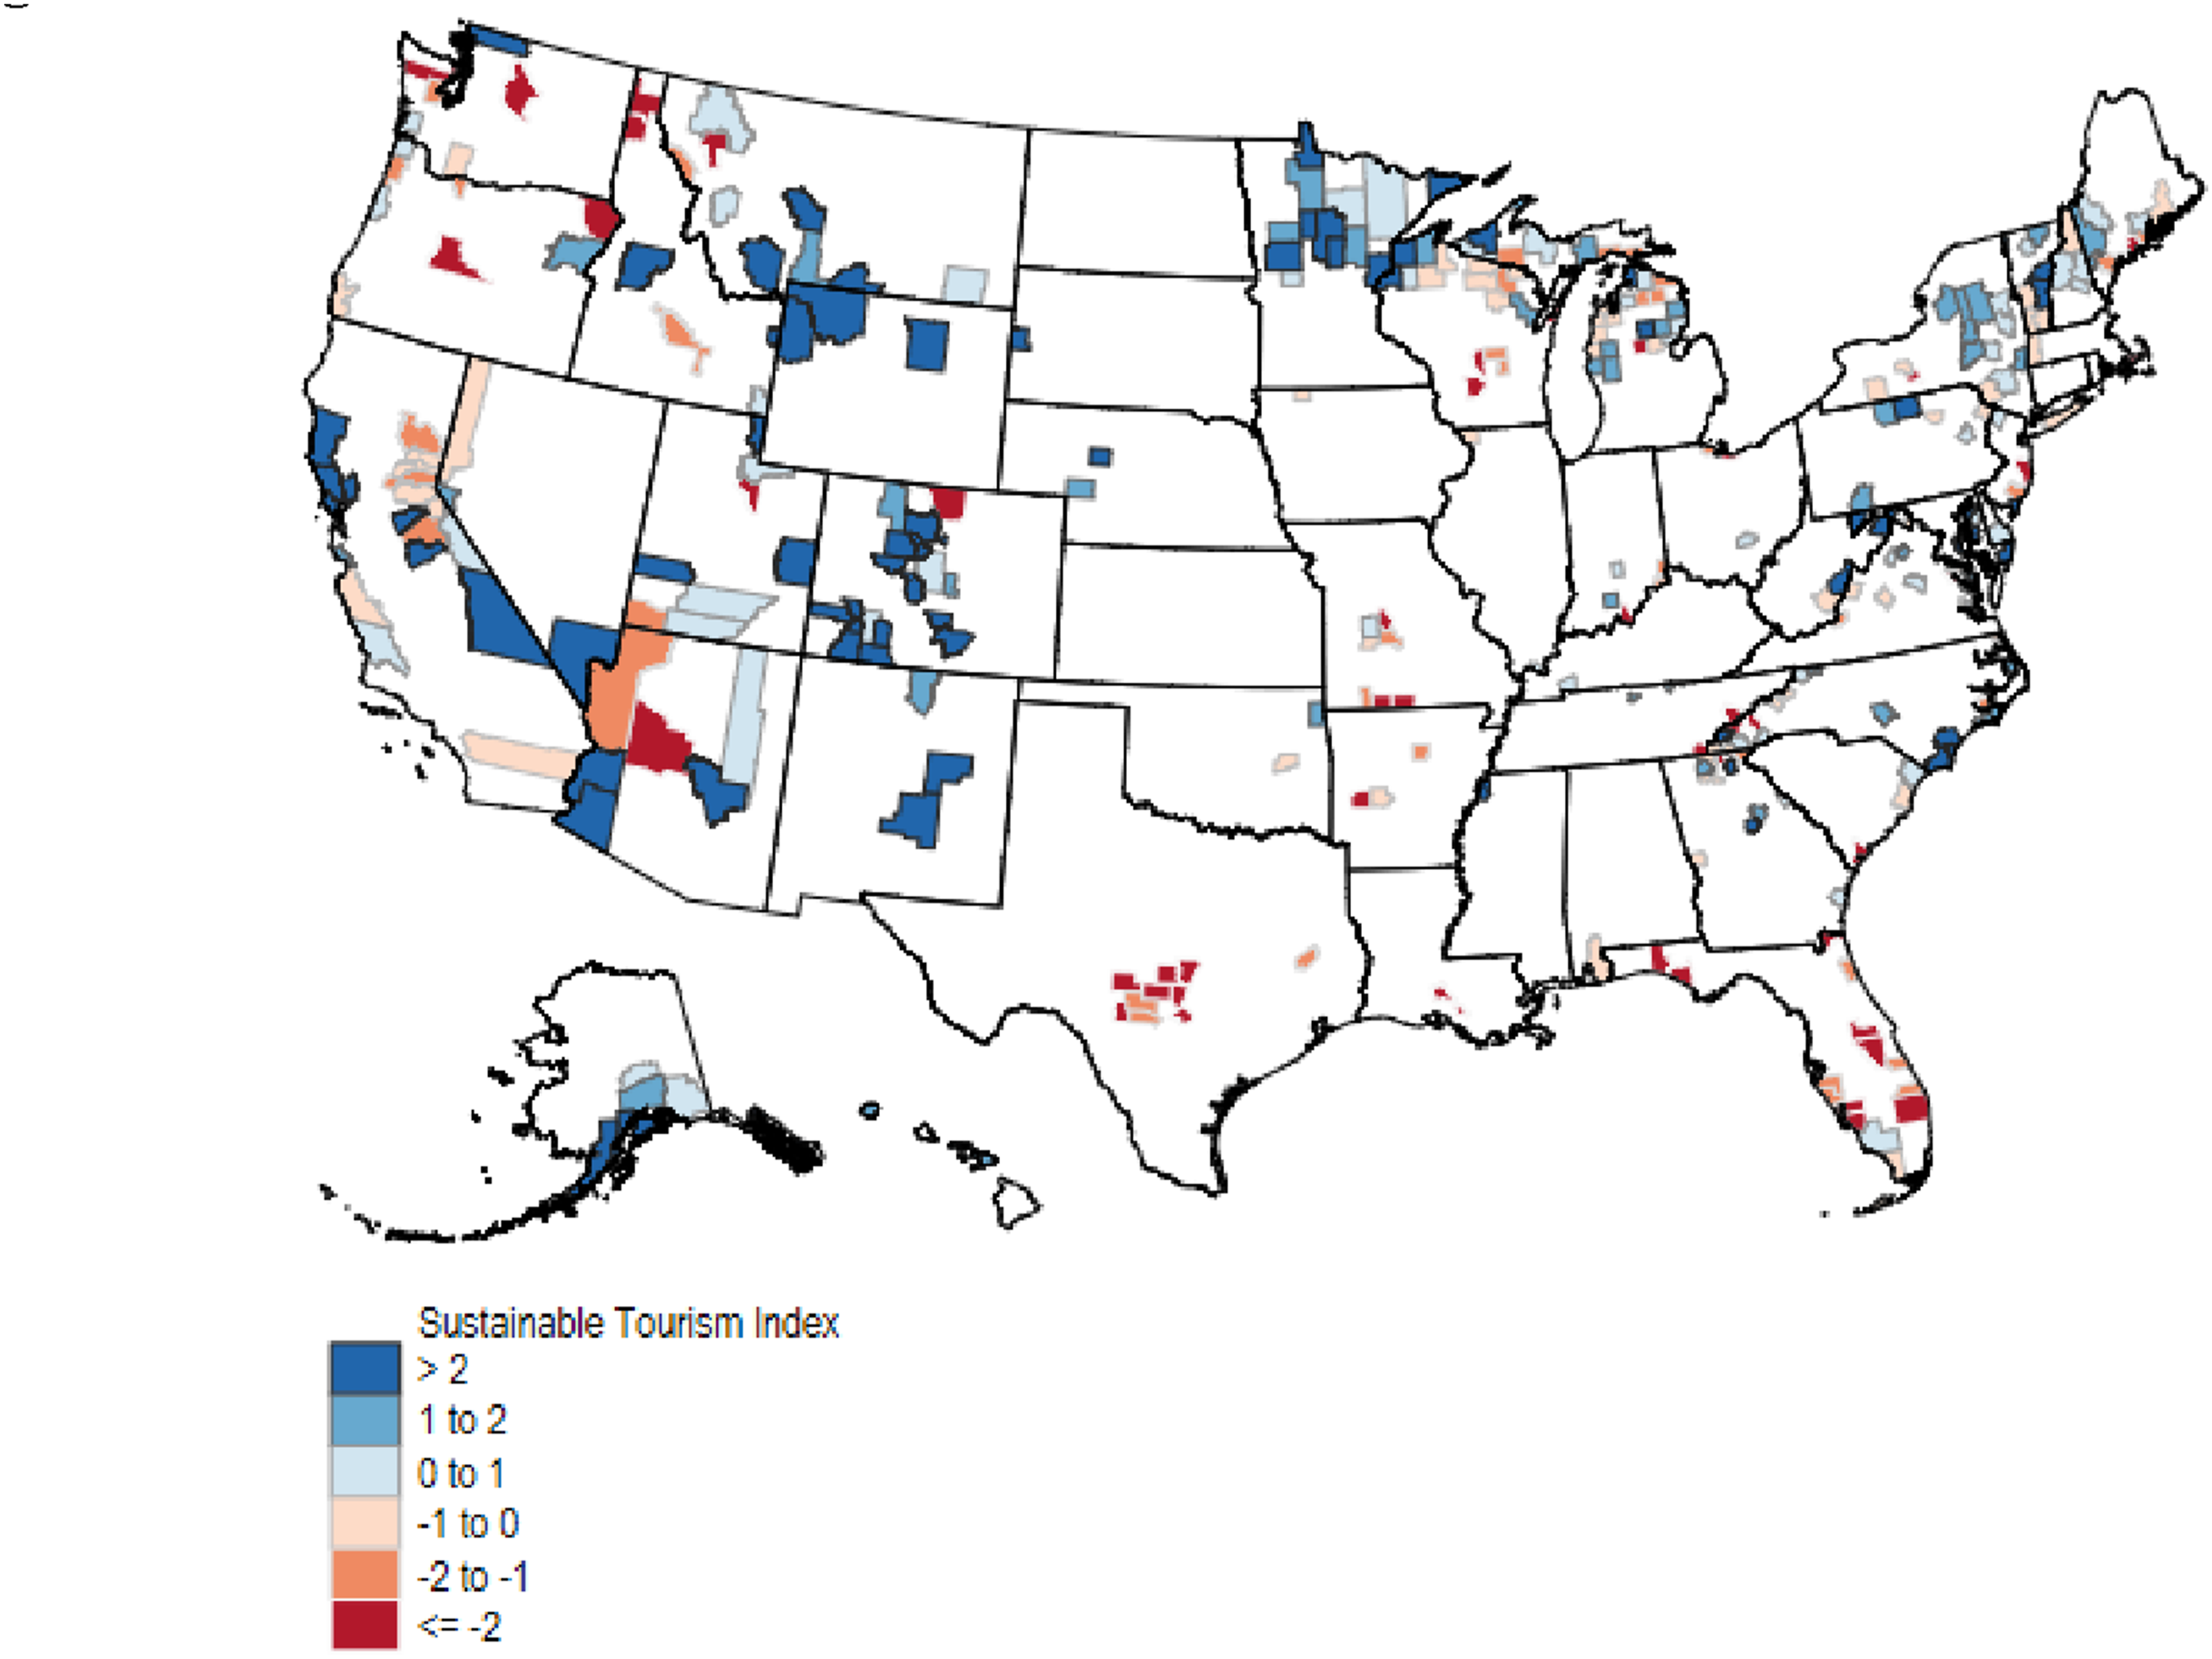
Table 2 examines whether the sustainable tourism index (STI) is associated with tourism-sector resilience during the COVID-19 shock, focusing on both the initial employment decline and subsequent recovery in the Leisure and Hospitality (L&H) sector. Column (1) shows that counties with higher STI values experienced smaller employment drops from 2019 to 2020 (coefficient = −0.41, p < 0.1), consistent with stronger pre-pandemic sustainability conditions buffering the immediate shock. Column (2) indicates that the STI is positively related to the short-term rebound from 2020 to 2021 (coefficient = 0.73, p < 0.01). Importantly, Columns (3)–(5) extend the rebound window to longer horizons (2020–2022, 2020–2023, and 2020–2024), and the STI remains positively associated with recovery across these specifications, suggesting that the resilience relationship is not confined to the one-year rebound but is robust over longer-term recovery periods.
Appendix Figures A1–A5 map the 2009–2019 percentage changes for the 10 supplemental indicators across recreation-dependent counties. Across all five figures, the central message is heterogeneity: changes are highly uneven across space, with clusters of counties experiencing sizable increases or decreases depending on the indicator. The social and distributional measures (e.g., percent nonwhite, mentally unhealthy days, commuting time, and the Gini index) show that many tourism counties experienced meaningful demographic and well-being shifts over the decade, but the direction and magnitude vary substantially by region. The environmental and climate-related measures (CO2 emissions, forest and woody land cover, extreme temperature, and extreme precipitation) similarly exhibit distinct spatial patterns, underscoring that tourism counties faced different types of environmental change and climate exposure rather than a uniform trajectory. Finally, the “third places” indicator (sit-down restaurants, bars, and coffee shops) highlights differences in place-based social infrastructure dynamics across destinations. Taken together, these appendix maps illustrate a broader indicator space that can be used for descriptive benchmarking and future model extensions, while reinforcing that sustainability-related change is context-dependent and unlikely to be captured by any single measure or universal pattern.
These results reveal several important patterns. First, recreation-dependent counties showed considerable heterogeneity in sustainability outcomes, with some achieving improvements across multiple dimensions while others experienced deterioration. The spatial heterogeneity of tourism resilience across regions has been increasingly recognized, with local characteristics playing a crucial role in determining sustainability outcomes (Yang et al., 2025). The high variance in most indicators suggests that local context and management approaches play crucial roles in determining outcomes. Second, the spatial patterns indicate regional clustering of sustainability performance. Western states, particularly those with strong natural amenity-based tourism and potentially better environmental management practices, tended to perform better on the composite index. However, these same areas sometimes faced challenges with housing affordability, suggesting trade-offs between tourism success and local resident welfare. Third, the dramatic increase in violent crime rates across many recreation-dependent counties represents a significant concern that warrants further investigation. The widespread nature of this increase suggests systemic challenges associated with tourism development that transcend regional boundaries. Finally, the pandemic resilience analysis demonstrates that sustainable tourism practices may provide protective benefits during economic shocks. Counties that had achieved better sustainability outcomes prior to COVID-19 showed both greater resilience during the downturn and stronger recovery afterward, suggesting that investments in sustainable tourism development may yield important co-benefits for economic stability. Recent research has demonstrated that pre-crisis conditions, including digital infrastructure and sustainable development practices, can significantly influence tourism destinations’ resilience to economic shocks (Tang, 2024).
These findings highlight the complexity of achieving sustainable tourism development and the need for comprehensive approaches that address economic, social, and environmental dimensions simultaneously. The significant spatial variations and indicator-specific patterns suggest that one-size-fits-all policies are unlikely to be effective, and that local contexts must be carefully considered in tourism planning and management decisions.
Conclusion and implications
This study presents a novel approach to measuring tourism sustainability through a dynamic framework using readily available secondary data sources. By analyzing changes across economic, social, and environmental indicators between 2009 and 2019, we provide insights into how different dimensions of sustainability evolved during a period of economic recovery and growth in recreation-dependent U.S. counties.
Our findings reveal significant geographic variation in tourism-related sustainability outcomes. Economically, while poverty rates declined substantially by 12.5% on average, housing affordability emerged as a critical challenge with extreme variation across counties, highlighting the double-edged nature of tourism development. The social dimension shows violent crime rates increasing dramatically by 88.8% on average, pointing to significant social costs that demand policy attention. Environmental indicators showed positive trends, with PM2.5 levels decreasing by 22.2%, though the number of pollution sites increased substantially with differences across counties.
The composite sustainable tourism index reveals distinct geographic patterns, with high-performing counties concentrated primarily in the Mountain West, Pacific Northwest, and Alaska. This spatial distribution suggests that local context, natural resource endowments, and management approaches significantly influence sustainability outcomes. Importantly, strong performance in one sustainability dimension does not automatically translate to success in others, underscoring the complexity of managing tourism for sustainable community development.
The findings both support and complicate existing research. The prevalence of widespread housing affordability issues—reflected in increases in rent burden—empirically supports concerns about amenity-driven gentrification and “overtourism” documented in U.S. and European case studies (Boley et al., 2017; Wachsmuth and Weisler, 2018). In contrast, the magnitude and consistency of increases in violent crime across these counties challenges assumptions about the social benefits of tourism, suggesting an important and underexplored trade-off in the U.S. context and underscoring the need for further research on tourism’s social impacts beyond resident attitudes and perceptions.
The study’s dynamic perspective aligns with Social-Ecological Systems (SES) concept, where destinations are conceptualized as complex adaptive systems characterized by feedbacks and context dependence (Folke, 2016; Folke et al., 2016). From this perspective, sustainability is not a fixed state or endpoint, but a process that is often uneven and evolving over time, reinforcing the need for continuous monitoring. The proposed STI framework provides a practical tool for this approach, linking observed changes with policy responses, including targeted interventions and deliberate and sustained investment to support community well-being and resilience.
This emphasis on continuous monitoring also highlights an important difference between our approach and international indicator frameworks like the ETIS. While the list of indicators proposed by ETIS is thorough, research on its implementation suggests persistent challenges related to data availability, unclear responsibilities for data collection, and limited capacity for ongoing monitoring and revision (Font et al., 2023). As a result, widespread adoption of the full set of indicators is limited and many ETIS-based applications are not consistently updated. This both complicates and limits opportunities for direct comparisons of indicator values or the severity of observed trade-offs.
Additionally, while systems like the ETIS approach destination performance through a lens of visitor dynamics and carrying capacity, our indicator set provides a community and place-based framework focused on resident outcomes via dimensions such as housing cost burden, inequality, health, and environmental exposure rather than an indicator system weighted toward visitor activity. Moreover, by relying on secondary data that is readily available at the county level, our approach enables consistent, low-cost, and replicable measurement across time and space. While this approach captures fewer tourism-specific changes, around visitor intensity and seasonality, it provides a more operationally feasible framework for routine monitoring, including in destinations that may lack human and fiscal resources necessary for regular data collection.
The secondary data approach presented in this study offers a clear pathway for practical implementation by tourism destinations, policymakers, and researchers. Destination managers can use the framework to establish baseline sustainability assessments, benchmark performance against similar destinations, set improvement targets, and monitor progress through regular tracking. Researchers can use the standardized methodology for comparative studies, impact assessments, and longitudinal analyses. Policymakers, in turn, can apply the indicators to guide local resource allocation decisions, evaluate policy effectiveness, and coordinate regional sustainability planning across jurisdictions, including the establishment of formal mechanisms that connect indicator performance to policy review and intervention.
For example, a sustained increase in rent burden above a defined threshold (e.g. a five percent increase over a 5 year period) could trigger a formal policy review of community comprehensive plans to assess short-term rental regulations, zoning adjustments, or the allocation of tourism-derived tax revenues to workforce housing. Recent policy innovations provide a useful model for this type of response. For example, Colorado’s House Bill 22-1117 expanded the allowable uses of local tourism-related tax revenues to include housing and childcare for the tourism workforce, as well as capital investments that support community needs and visitor experiences (Colorado General Assembly, 2022). Such policies illustrate how tourism-generated revenues can be more directly aligned with community-level sustainability outcomes identified and monitored through indicator systems.
Similarly, significant increases in violent crime rates or declines in key environmental indicators could induce greater cross-agency coordination or targeted intervention strategies. By considering how indicators pair with explicit policy responses destinations could move beyond passive monitoring and toward a responsive management system in which measurement directly informs local decision-making.
Several key policy implications emerge from these findings. First, the housing affordability crisis in many recreation-dependent counties requires targeted interventions such as inclusionary zoning or dedicating tourism tax revenues to affordable housing development. Second, the dramatic increase in violent crime rates requires comprehensive public safety strategies that address the unique challenges of tourism communities. Third, the pandemic resilience findings suggest that investments in sustainable tourism practices may yield important complementary benefits for economic stability, providing additional justification for using comprehensive sustainability initiatives.
Recreation-dependent counties in the United States face complex sustainability challenges that vary significantly by place and by dimension, yet unlike many international contexts, the U.S. lacks a consistent, systems-oriented approach to monitoring the economic, social, and environmental impacts of tourism. While global frameworks such as the ETIS demonstrate the value of integrated sustainability monitoring, the absence of U.S. participation underscores a critical gap in domestic practice. This study offers a practical and replicable first step toward addressing that gap by proposing a secondary data-driven framework that destinations can immediately implement to guide evidence-based decision-making. As tourism continues to grow as an economic development strategy, particularly in rural areas, this framework provides the tools needed to ensure that tourism benefits local communities while preserving the environmental and social resources upon which it depends.
Limitations and future research
While our approach offers advantages through cost-effective monitoring and broad geographic coverage, several limitations need to be recognized. Secondary data may obscure important local nuances, and because county borders do not always align with ecological or community boundaries, county-level aggregation can mask meaningful within-county variation, especially in high-amenity destinations. The findings should therefore be interpreted as identifying broad spatial patterns rather than fully capturing finer-scale local dynamics.
Indicator weighting represents another limitation. Weighting is inherently a normative choice, and different stakeholders (e.g., economic developers vs conservation groups) may prioritize sustainability dimensions differently. While equal weighting provides a neutral and transparent approach, alternative weighting schemes – such as stakeholder-derived or data-driven weights – could help assess the robustness of rankings and illustrate how weighting decisions affect sustainability assessments.
Consistent with concerns raised by Miller and Torres-Delgado (2023) regarding the risks of reductive measurement, our reliance on secondary data may favor what is easily measurable while underrepresenting harder-to-capture social or cultural dimensions. We do not claim that the index captures the full “lived experience” of sustainability. Rather, in a U.S. context lacking consistent tourism sustainability data, the index represents a necessary and scalable first step for identifying trends and trade-offs. The inclusion of proxies such as life expectancy and rent burden reflects an effort to move beyond purely economic or environmental metrics, while acknowledging their limitations.
Future research should explore the mechanisms through which tourism development affects different sustainability dimensions and investigate why some communities achieve more balanced outcomes than others. Integrating objective indicators with subjective measures such as residents’ perceptions of well-being and quality of life (Diener and Suh, 1997) would strengthen interpretation, particularly for social sustainability outcomes. Mixed-methods approaches combining secondary data with surveys or qualitative case studies could provide validation and contextual depth, especially in destinations exhibiting high composite sustainability scores alongside adverse social outcomes. Additional extensions include applying the framework to non-recreation-dependent counties to better isolate tourism impacts, disaggregating indicators to sub-county scales, and developing proxy measures for underrepresented dimensions such as community cohesion, cultural heritage, and institutional capacity.
Supplemental material
Supplemental Material - Exploring sustainable tourism indicators (STIs) for the U.S. with secondary data
Supplemental Material for Exploring sustainable tourism indicators (STIs) for the U.S. with secondary data by Luyi Han, Stephan J Goetz, Daniel Eades, Doug Arbogast in Tourism Economics
Footnotes
Acknowledgement
We thank Muzzo Uysal and two anonymous reviewers for their valuable comments. Earlier versions of this paper were presented at the 2025 64th Annual Meeting of the Southern Regional Science Association (SRSA), Louisville, KY, and the 2025 Northeast Chapter of the Travel & Tourism Research Association conference (NETTRA) in Burlington, VT. We appreciate feedback from discussants and session participants at these meetings.
Funding
The authors disclosed receipt of the following financial support for the research, authorship, and/or publication of this article: This work was supported in part by the United States Department of Agriculture, National Institute of Food and Agriculture (NIFA) under project #2022-68006-36453 & #2023-51150-41113, and by the USDA NIFA and Hatch Multistate Appropriations under Projects #PEN05090 & PEN04806 and Accession #7010745 & 7003410, and by the Pennsylvania State University and NIFA Multistate/Regional Research.
Declaration of conflicting interests
The authors declared no potential conflicts of interest with respect to the research, authorship, and/or publication of this article.
Supplemental material
Supplemental material for this article is available online.
Notes
Author biographies
References
Supplementary Material
Please find the following supplemental material available below.
For Open Access articles published under a Creative Commons License, all supplemental material carries the same license as the article it is associated with.
For non-Open Access articles published, all supplemental material carries a non-exclusive license, and permission requests for re-use of supplemental material or any part of supplemental material shall be sent directly to the copyright owner as specified in the copyright notice associated with the article.