
Abstract
This study examines productivity dynamics in the U.S. casino gaming industry under economic crisis conditions using a double frontier data envelopment analysis framework. While traditional Malmquist productivity index approaches rely on optimistic efficiency frontiers, such methods may overstate resilience during downturns by overlooking inefficiency expansion. Using state-level data from twelve U.S. casino markets between 2006 and 2012, this study integrates both optimistic and pessimistic DEA perspectives to construct a double frontier Malmquist productivity index. The results reveal substantial divergence between optimistic and pessimistic productivity measures, particularly during the Great Recession, with several states exhibiting inefficiency-driven productivity decline that is not captured by conventional methods. By jointly accounting for frontier advancement and inefficiency dynamics, the proposed framework provides a more comprehensive assessment of productivity change. The findings highlight the importance of dual-frontier productivity measurement for evaluating tourism resilience, crisis preparedness, and regulatory stress-testing in gaming and other tourism-related industries.
Keywords
Introduction
Tourism and hospitality industries are among the most crisis-sensitive sectors of the economy, as consumer demand for leisure and entertainment is highly discretionary and responsive to macroeconomic uncertainty. Recent global events, most notably the Coronavirus Disease 2019 (COVID-19) pandemic, have reinforced the importance of crisis preparedness and the need for analytical tools capable of assessing industry performance under extreme disruption (Boto-García and Baños-Pino, 2023). Long before COVID-19, however, the Great Recession of 2008–2009 revealed similar structural vulnerabilities within tourism-related industries, including casino gaming, where productivity outcomes are shaped by labor intensity, regulatory environments, and regional demand heterogeneity (Walker, 2013; Walker and Sobel, 2016).
The casino gaming industry plays a critical role in the U.S. tourism economy by contributing substantially to employment, tax revenues, and regional economic development (Garrett and Nichols, 2008; Lambert et al., 2010). As legalized gaming has expanded across U.S. states, policymakers have increasingly viewed casinos as instruments for fiscal stabilization and tourism promotion, particularly during periods of economic stress (Chhabra and Gursoy, 2007; Walker, 2013). Despite the economic importance of casino gaming, empirical research examining its operational productivity remains limited, largely due to data constraints and the complexity of performance measurement in regulated service industries (Walker, 2009; Zheng and Hung, 2012).
Existing research on casino gaming has focused primarily on economic and fiscal impacts, including employment effects, tax revenues, and broader regional development outcomes (Cotti, 2008; Humphreys and Marchand, 2013; Walker and Jackson, 2011). While these studies provide valuable insights into the macroeconomic consequences of casino operations, they offer limited understanding of how productivity within the casino industry evolves over time, particularly during economic downturns. From a tourism economics perspective, productivity analysis is essential because productivity losses during crises can persist beyond the immediate shock and constrain long-term recovery and competitiveness (Del Mar Alonso-Almeida and Bremser, 2013).
From a theoretical standpoint, this study is grounded in tourism resilience theory (Hall et al., 2018), which emphasizes the capacity of tourism systems to absorb shocks, adapt to disruption, and reorganize without long-term loss of functionality. During economic crises, tourism industries often face a trade-off between short-term efficiency and shock absorption, as firms and regulators may prioritize employment stability and operational continuity over immediate productivity gains. Drawing on regulatory economics (Stiglitz, 2010), this study conceptualizes productivity measurement as a form of stress-testing, where the proposed double frontier data envelopment analysis framework captures both best-practice advancement and inefficiency expansion under conditions of economic stress.
Productivity measurement in tourism and hospitality research has frequently employed data envelopment analysis (DEA) and, in dynamic settings, the Malmquist productivity index (MPI) (Malmquist, 1953). The MPI is widely used because it decomposes productivity change into efficiency change and technical change across time periods (Assaf and Barros, 2011; Barros and Alves, 2004; Färe et al., 1994). Applications of MPI have been documented across various tourism and hospitality contexts, including hotels, travel agencies, and destination performance (Assaf and Josiassen, 2012; Barros and Dieke, 2008; Hwang and Chang, 2003). However, nearly all MPI applications in tourism and hospitality adopt an optimistic DEA framework that evaluates decision-making units relative to best-practice frontiers.
While optimistic DEA-based MPI is appropriate under relatively stable economic conditions, it may be ill-suited for crisis environments. During periods of economic disruption, productivity dynamics are often driven not only by shifts in best-practice performance but also by the expansion of inefficiency among poorly performing units. Crisis conditions such as mandated closures, labor hoarding, regulatory rigidity, and uneven regional recovery, all of which were evident during both the Great Recession and the COVID-19 pandemic, can cause inefficiency frontiers to move in ways that optimistic DEA-based measures fail to capture (Del Mar Alonso-Almeida and Bremser, 2013; Roche et al., 2013). As a result, traditional MPI estimates may systematically overstate productivity resilience or recovery during periods of severe disruption.
To address this limitation, this study applies and extends a double frontier data envelopment analysis (DFDEA) framework to the context of tourism productivity measurement under crisis conditions. DFDEA is particularly suited for evaluating tourism system resilience under asymmetric economic shocks. By jointly considering optimistic and pessimistic DEA perspectives, the proposed framework captures productivity changes arising from frontier advancement as well as inefficiency expansion. The resulting DFDEA-based Malmquist productivity index provides a more comprehensive and crisis-sensitive assessment of productivity dynamics over time.
The empirical analysis focuses on the U.S. casino industry at the state level from 2006 to 2012, encompassing the pre-recession, recession, and post-recession periods, with 2009 treated as the baseline year. State-level aggregation is particularly appropriate in this context, as casino regulation, taxation, and labor policies are largely determined at the state level, making productivity outcomes directly relevant for tourism policy design and crisis response planning (Lambert et al., 2010; Walker and Sobel, 2016).
Recent tourism research emphasizes that productivity assessments under crisis conditions must account for asymmetric shocks, regulatory intervention, and uneven recovery trajectories rather than relying solely on best-practice efficiency measures. Studies published in Tourism Economics show that crisis periods often reveal hidden inefficiencies that conventional productivity metrics fail to capture, particularly in tourism-dependent and regulated industries (Song, 2022; Watson and Deller, 2022). This emerging perspective reinforces the need for productivity frameworks that explicitly incorporate both efficiency advancement and inefficiency expansion when evaluating tourism system resilience.
Although the dataset covers the period 2006–2012, this time frame is deliberately selected to capture the full cycle of the Great Recession, including pre-crisis, crisis, and post-crisis phases within a consistent data environment. Importantly, the objective of this study is not to provide a contemporaneous industry snapshot, but to develop and demonstrate a crisis-sensitive productivity measurement framework. In this sense, the Great Recession serves as a natural experiment for evaluating how productivity measures behave under systemic shocks. The methodological insights derived from this analysis remain highly relevant, particularly considering recent disruptions such as the COVID-19 pandemic, where similar inefficiency dynamics have been observed.
This study contributes to the tourism economics literature in three important ways. First, it advances productivity measurement by proposing a double frontier MPI that is better suited for analyzing performance under economic shocks and crisis conditions. Second, it provides empirical evidence on how U.S. casino productivity evolved during and after the Great Recession, revealing patterns that are obscured by traditional optimistic MPI approaches. Third, by highlighting the limitations of standard productivity measures during downturns, the study offers timely insights for post-COVID tourism research and crisis preparedness, with implications that extend beyond the casino sector to other tourism and hospitality industries. While double frontier DEA approaches have been developed in prior methodological literature, their application in tourism and hospitality research remains extremely limited. This study contributes by operationalizing the DFDEA framework within a tourism economics context and demonstrating its relevance for analyzing productivity dynamics under economic shocks.
The remainder of the paper is organized as follows. Section 2 reviews relevant literature on casino gaming and productivity measurement in tourism and hospitality. Section 3 presents the DFDEA-based MPI methodology. Section 4 describes the data and empirical setting. Section 5 reports and discusses the results. Section 6 concludes with implications for tourism policy, crisis preparedness, and future research.
Literature review
Casino gaming and economic performance
Casino gaming has long been recognized as an important component of the tourism economy in the United States, generating employment, tax revenues, and regional economic activity (Garrett and Nichols, 2008; Lambert et al., 2010; Walker, 2013). As legalized gaming expanded across states, policymakers increasingly viewed casinos as instruments for tourism promotion and fiscal stabilization, particularly in regions seeking alternative sources of economic development (Chhabra and Gursoy, 2007; Walker and Sobel, 2016).
Empirical research on casino gaming has primarily focused on its economic and fiscal impacts, including employment effects, income generation, tax revenues, and regional development outcomes (Cotti, 2008; Humphreys and Marchand, 2013; Walker and Jackson, 2011). Some studies report modest short-run employment gains and positive tax effects, while others highlight potential displacement and cannibalization of existing hospitality and entertainment activities (Koo et al., 2007; Walker and Sobel, 2016; Walker and Jackson, 2008). Although these studies provide valuable insights into the macroeconomic consequences of casino operations, they offer limited understanding of how efficiently casino industries transform inputs into outputs over time.
From a tourism economics perspective, operational productivity is particularly important because productivity losses during downturns can persist beyond the initial shock and constrain long-term recovery and competitiveness (Del Mar Alonso-Almeida and Bremser, 2013). Despite this importance, relatively few studies have examined casino performance using formal productivity measurement frameworks, largely due to data limitations and the complexity of evaluating regulated service industries (Walker, 2009; Zheng and Hung, 2012). As a result, the productivity dynamics of the casino industry, especially during periods of economic stress, remain underexplored.
Productivity measurement in tourism and hospitality
Productivity measurement in tourism and hospitality research has frequently employed data envelopment analysis (DEA), a nonparametric technique that evaluates the relative efficiency of decision-making units using multiple inputs and outputs (Charnes et al., 1978). DEA has been widely applied across hospitality contexts, including hotels, restaurants, travel agencies, and destination performance, due to its flexibility and minimal distributional assumptions (Barros and Alves, 2004; Barros and Dieke, 2008; Hwang and Chang, 2003).
To capture productivity dynamics over time, many studies have adopted the Malmquist productivity index (MPI), which decomposes productivity change into efficiency change and technical change across periods (Färe et al., 1994). MPI has been applied extensively in hospitality and tourism research, including hotel productivity analysis, travel agency performance, and destination-level efficiency assessments (Assaf and Barros, 2011; Assaf and Josiassen, 2012; Barros and Dieke, 2008; Hwang and Chang, 2003). These studies demonstrate the usefulness of MPI in tracking performance changes and benchmarking tourism-related industries across time.
In the context of casino gaming, applications of DEA and MPI remain comparatively limited. Existing studies have primarily focused on specific markets or regions and have emphasized cross-sectional efficiency comparisons rather than dynamic productivity analysis (Huang et al., 2012; Lambert et al., 2010). More recently, Bandyopadhayay et al. (2026) applied data envelopment analysis to examine operational efficiency in U.S. casinos, demonstrating the usefulness of efficiency-based approaches in evaluating gaming performance. However, existing studies remain largely focused on static efficiency assessment, with limited attention to productivity dynamics over time, particularly under crisis conditions. Appendix A summarizes representative applications of DEA and MPI in hospitality and casino management, illustrating the dominance of optimistic DEA-based approaches in productivity measurement across tourism-related industries.
Limitations of existing MPI approaches under crisis conditions
Although the Malmquist productivity index is widely accepted in tourism and hospitality research, existing applications overwhelmingly rely on optimistic DEA formulations that evaluate performance relative to best-practice frontiers (Assaf and Barros, 2011; Färe et al., 1994). While this approach is appropriate under relatively stable economic conditions, it implicitly assumes symmetric productivity adjustment across firms, regions, and time periods.
During periods of economic disruption, however, productivity dynamics are often driven not only by shifts in best-practice performance but also by the expansion of inefficiency among poorly performing units. Crisis conditions such as demand collapse, labor hoarding, regulatory rigidity, and uneven regional recovery can cause inefficiency frontiers to move in ways that optimistic DEA-based MPI fails to capture (Del Mar Alonso-Almeida and Bremser, 2013; Roche et al., 2013). As a result, productivity measures based solely on optimistic frontiers may overstate resilience or recovery in tourism-related industries during downturns.
Recent systemic disruptions, most notably the COVID-19 pandemic, have further underscored the importance of productivity measurement frameworks that account for asymmetric inefficiency dynamics under crisis conditions. Although most tourism productivity studies predate COVID-19, the pandemic revealed similar structural features observed during earlier downturns, including the Great Recession, such as uneven market recovery and persistent inefficiencies across regions and firms.
Despite these challenges, no study to date has systematically integrated both optimistic and pessimistic DEA perspectives into MPI-based productivity measurement within the tourism and casino literature. Addressing this gap is essential for improving crisis preparedness and developing more accurate tools for evaluating productivity under conditions of severe disruption. While recent post-COVID tourism productivity studies increasingly recognize the role of resilience and adaptive capacity, most continue to rely on single-frontier efficiency models that prioritize optimistic performance benchmarks (Assaf et al., 2022). As a result, inefficiency dynamics that emerge during periods of regulatory constraint and demand volatility remain underexplored, particularly in tourism industries characterized by high labor intensity and policy oversight. This methodological gap motivates the adoption of a double frontier approach to productivity measurement. A detailed DEA-based productivity measurement literature review table is provided in the supplementary materials (Appendix A).
Research gap and contribution
In response to the limitations identified above, this study proposes a double frontier data envelopment analysis approach to productivity measurement. By integrating optimistic and pessimistic DEA perspectives, the proposed framework captures productivity changes arising from both frontier advancement and inefficiency expansion. This approach provides a more comprehensive and crisis-sensitive assessment of productivity dynamics over time.
By applying the proposed framework to the U.S. casino industry during the Great Recession, this study contributes to the tourism economics literature by advancing productivity measurement under economic shocks and offering insights relevant for post-crisis and post-COVID tourism policy and planning.
Although a substantial body of research has examined productivity and efficiency in hospitality and tourism, applications of the Malmquist productivity index remain relatively limited and are largely confined to hotel and travel agency contexts (Assaf and Barros, 2011; Barros and Alves, 2004; Barros and Dieke, 2008; Hwang and Chang, 2003). Research on the operational productivity of casino gaming is particularly sparse, despite the industry’s economic significance and regulatory complexity. Moreover, existing tourism productivity studies have overwhelmingly relied on optimistic DEA-based MPI formulations, with no prior work systematically incorporating pessimistic DEA perspectives. As a result, productivity dynamics driven by inefficiency expansion during economic downturns, such as the Great Recession, remain insufficiently explored in the casino gaming literature. Addressing this gap is essential for developing productivity measurement frameworks that are suitable for crisis analysis and policy-relevant decision-making.
Methodology
Overview of the DFDEA-based Malmquist productivity index
The objective of this study is to measure productivity dynamics under crisis conditions by capturing changes in both best-practice performance and inefficiency expansion. Traditional Malmquist productivity index formulations rely exclusively on optimistic data envelopment analysis frontiers and therefore evaluate productivity change relative to best-performing units only (Assaf and Barros, 2011; Färe et al., 1994). While suitable under stable economic conditions, this approach may be insufficient during periods of severe disruption, when productivity dynamics are often driven by inefficiency growth among poorly performing units.
To address this limitation, this study adopts a double frontier data envelopment analysis approach that integrates productivity measurement from both optimistic and pessimistic DEA perspectives. The proposed DFDEA-based Malmquist productivity index captures productivity change arising from frontier advancement as well as inefficiency expansion, thereby providing a more comprehensive and crisis-sensitive assessment of time-based productivity change.
The empirical analysis focuses on longitudinal productivity measurement, making MPI particularly suitable because it allows production frontiers to shift over time (Caves et al., 1982; Färe et al., 1994). Productivity change is decomposed into efficiency change and technical change under both optimistic and pessimistic DEA perspectives and subsequently aggregated using a geometric mean to obtain an integrated productivity index.
Optimistic DEA-based Malmquist productivity index
Data envelopment analysis was originally developed by Charnes et al. (1978) based on earlier efficiency concepts proposed by Farrell (1957). DEA is a nonparametric linear programming technique used to evaluate the relative efficiency of decision-making units that transform multiple inputs into multiple outputs.
Let there be n decision-making units evaluated using m inputs and p outputs. At time periods t and (t + 1), the inputs and outputs of the DMUs are represented by
Following Färe et al. (1994), the optimistic DEA-based MPI is computed using distance functions that measure the efficiency of a DMU relative to best-practice frontiers at different time periods. The input-oriented constant returns to scale assumption is adopted, as MPI estimation under variable returns to scale may produce biased productivity measures in intertemporal analysis (Grifell-Tatjé and Lovell, 1995).
The optimistic DEA models estimate four distance functions corresponding to evaluations of DMU performance at time t and (t + 1) using both contemporaneous and intertemporal technologies. Based on these distance functions, the optimistic Malmquist productivity index for DMUo is defined as:
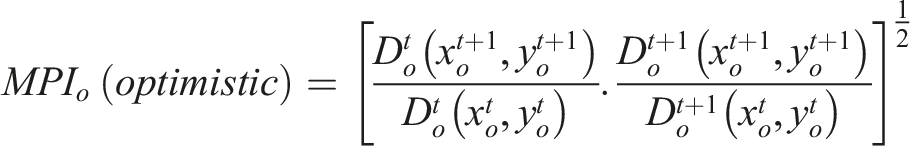
The optimistic MPI can be decomposed into optimistic efficiency change and optimistic technical change components, which respectively capture movement toward the best-practice frontier and shifts in the frontier itself.
Pessimistic DEA-based Malmquist productivity index
In contrast to optimistic DEA, pessimistic DEA evaluates DMUs relative to worst-practice frontiers and measures inefficiency rather than efficiency (Wang and Chin, 2009; Wang et al., 2007). This perspective is particularly relevant under crisis conditions, where productivity deterioration is often driven by inefficiency expansion among poorly performing units.
The pessimistic DEA model estimates distance functions by maximizing outputs relative to a worst-practice reference set. Using a structure parallel to the optimistic DEA framework, pessimistic efficiency scores are computed for each DMU at time t and (t + 1) under both contemporaneous and intertemporal technologies.
Based on these pessimistic distance functions, the pessimistic Malmquist productivity index for DMUo is defined as:
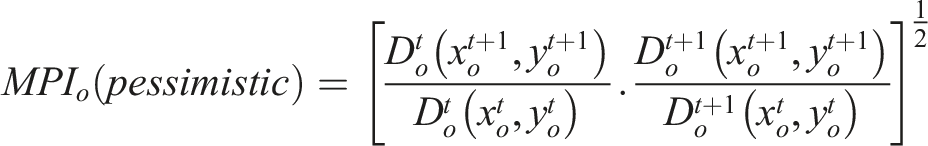
Similar to the optimistic case, values greater than one indicate productivity improvement, values equal to one indicate no change, and values less than one indicate productivity decline.
The pessimistic MPI can also be decomposed into pessimistic efficiency change and pessimistic technical change components, reflecting inefficiency contraction or expansion and shifts in the worst-practice frontier over time.
Aggregation and decomposition of the DFDEA-based MPI
Productivity measures obtained from optimistic and pessimistic DEA perspectives are not equivalent and may yield substantially different conclusions. Relying on a single perspective may therefore provide an incomplete view of productivity dynamics, particularly during periods of economic disruption.
To obtain an integrated productivity measure, this study aggregates the optimistic and pessimistic MPI values using a geometric mean, following prior methodological work emphasizing the suitability of geometric aggregation for multiplicative indices (Chen and Ali, 2004; Wang and Lan, 2011). The DFDEA-based MPI is defined as:

This integrated index represents the typical productivity change of DMUo by jointly accounting for best-practice advancement and inefficiency expansion.
The DFDEA-based MPI can be further decomposed into average efficiency change and average technical change components:

By incorporating both optimistic and pessimistic DEA perspectives, the DFDEA-based MPI provides a more inclusive and pragmatic assessment of time-based productivity change. This framework is particularly suitable for analyzing productivity dynamics during economic downturns, when asymmetric adjustments and inefficiency expansion play a central role in shaping performance outcomes.
Data and results
Data description
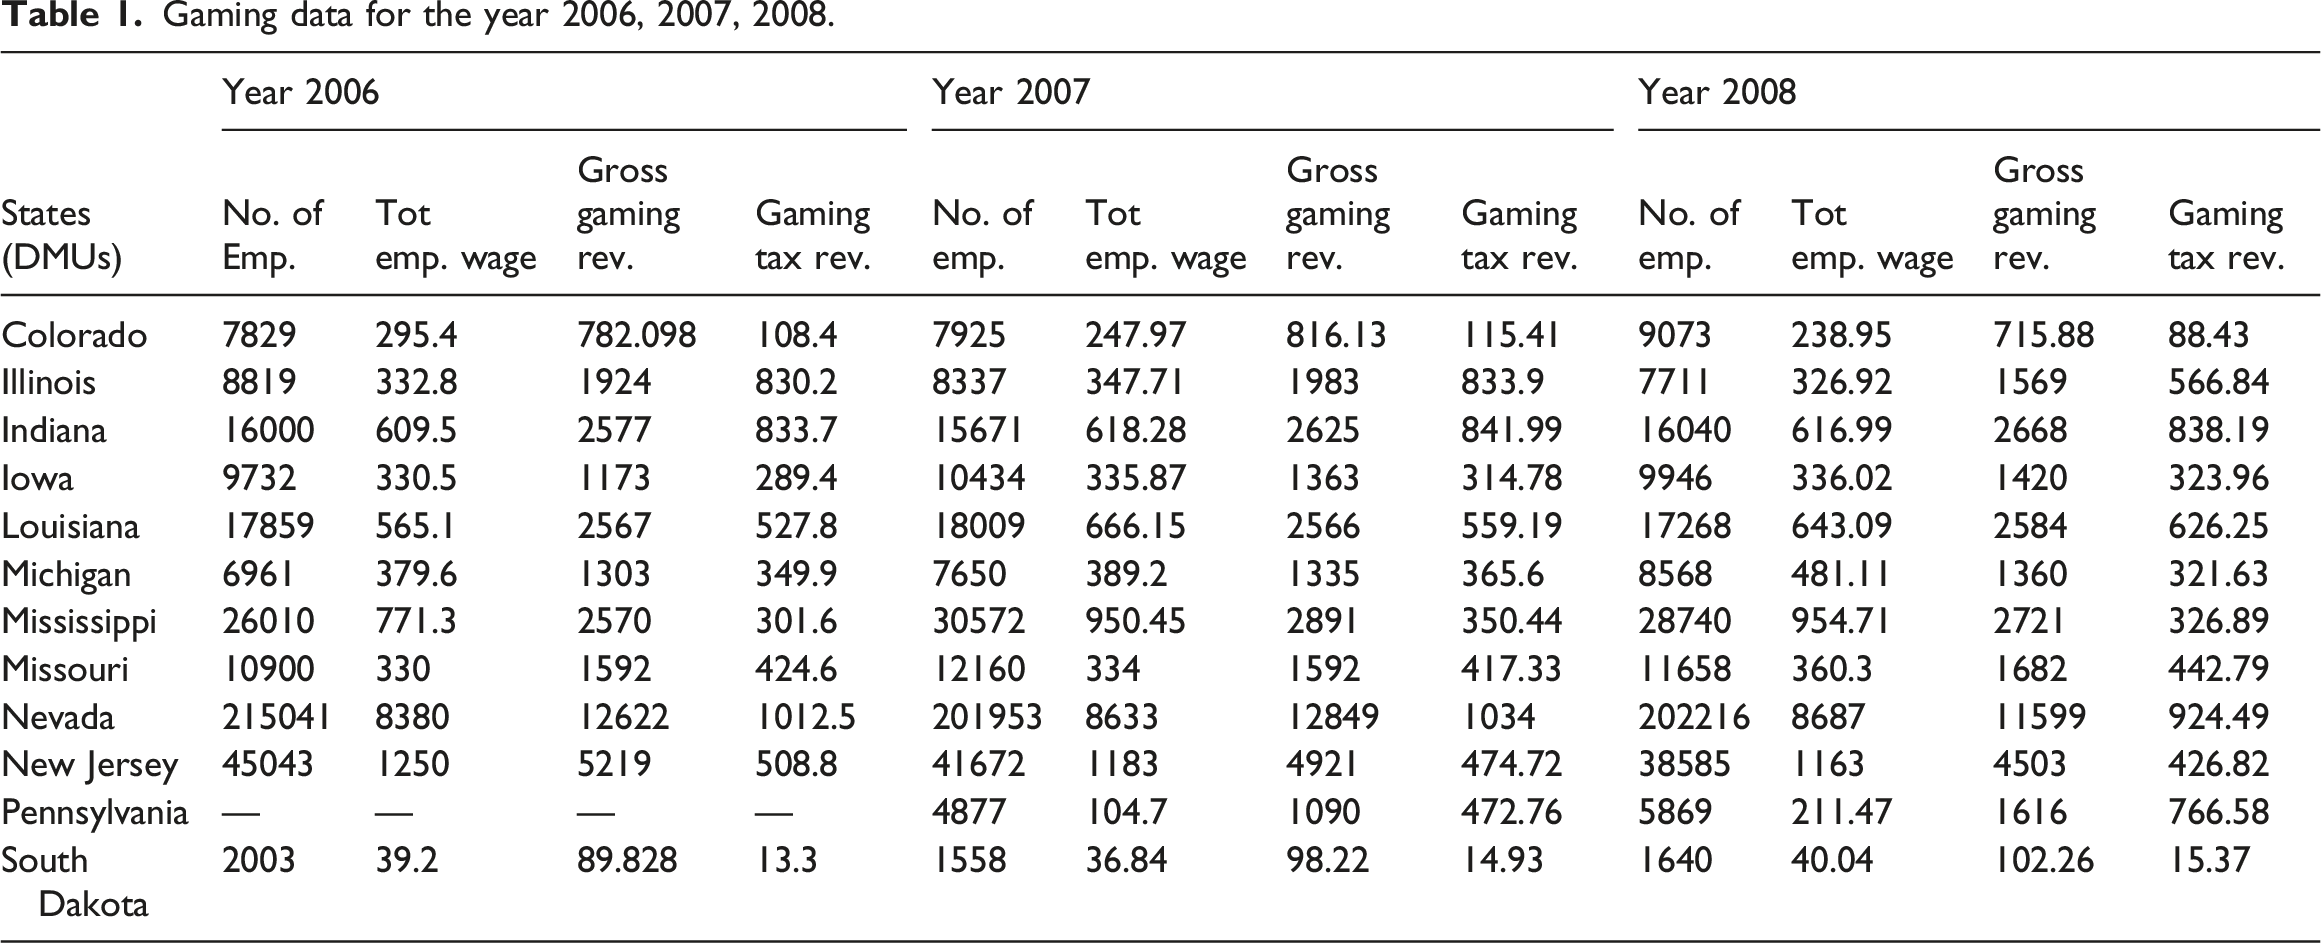
This study uses state-level aggregated data from U.S. states where commercial casino gaming is legalized. Each state-level casino industry is treated as a decision-making unit. Information on casino operations was obtained from the American Gaming Association (2016) and individual state Gaming Commission websites. Based on data availability between 2006 and 2012, twelve states were included in the analysis. While firm-level data would provide a more granular assessment of casino performance, such data are not publicly available for the study period. As a result, state-level aggregation is adopted as the most consistent and policy-relevant unit of analysis. This approach reflects the institutional structure of the U.S. casino industry, where regulatory frameworks, taxation policies, and operational constraints are determined at the state level. Accordingly, the results should be interpreted as capturing industry-level productivity dynamics rather than firm-level efficiency differences.
An important consideration in DEA-based analysis is the comparability of decision-making units. In the present context, state-level casino industries may differ in terms of the number of establishments, market size, and competitive structure. These differences may influence observed productivity scores and reflect variations in market conditions rather than pure efficiency differences. While the DEA framework remains appropriate for relative benchmarking, the results should be interpreted with caution as reflecting a combination of efficiency and structural heterogeneity across states.
Gaming data for the year 2006, 2007, 2008.
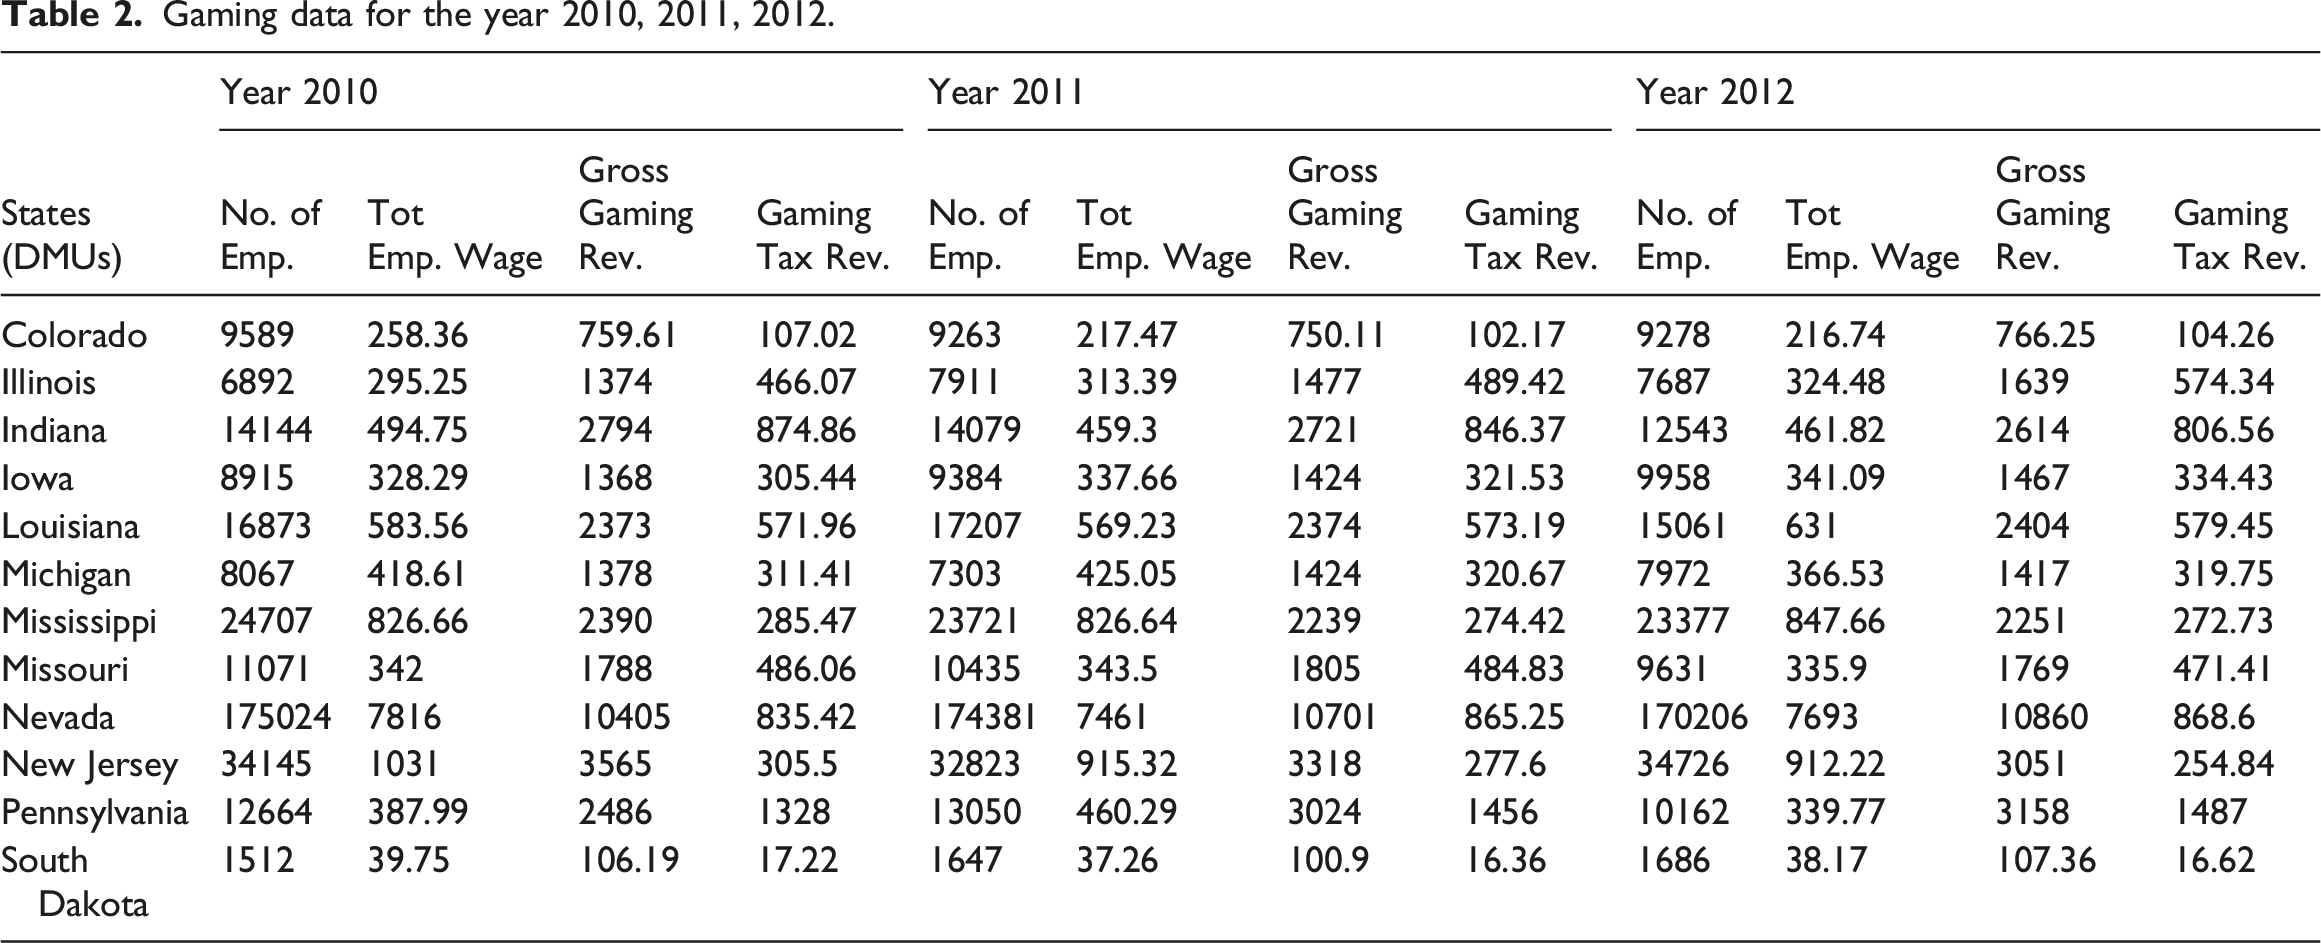
Gaming data for the year 2010, 2011, 2012.
The constant returns to scale assumption was adopted in estimating productivity change, consistent with prior Malmquist productivity index applications that emphasize intertemporal comparability (Grifell-Tatjé and Lovell, 1995). The size of decision-making units was proxied using the number of employees, following Johnes (2006). However, it is recognized that employment may not fully capture differences in operational scale and complexity across state-level casino industries, particularly given variation in non-gaming activities. The correlation between employment and efficiency scores, which ranges between −0.1 and 0.1, suggests that size effects may not dominate efficiency variation, although this evidence should be interpreted as suggestive rather than conclusive. Given data limitations and the aggregated nature of the analysis, formal testing of returns to scale is not feasible. Accordingly, the CRS specification is maintained for methodological consistency, while acknowledging potential scale heterogeneity across states.
The study period is limited to 2006–2012 due to the discontinuation of consistent state-level reporting of casino employment and wage data by the American Gaming Association after 2012. While revenue data remain partially available, the absence of harmonized labor input data prevents the construction of a consistent multi-input productivity framework beyond this period. All DEA and MPI computations were performed using the R programming language.
Input and output specification
To examine state-level casino productivity, two input variables and two output variables were employed. Inputs included the total number of employees and total employee wages paid by casinos within each state. Outputs consisted of gross gaming revenue and gaming tax revenue collected at the state level.
Casino gaming is a labor-intensive service industry, with labor costs accounting for a substantial share of operating expenses in hospitality-related businesses (Jones & Lockwood, 2002). Consistent with prior hospitality productivity studies, labor was therefore included as a primary input (Assaf and Barros, 2011). The selected output measures reflect both operational performance and fiscal contribution and are commonly used in casino and hospitality productivity research (Barros, 2005; Barros and Dieke, 2008). All input and output values represent state-level aggregates across casino properties.
The inclusion of both the number of employees and total wages as input variables may introduce overlap, as both variables capture aspects of labor input. However, they reflect distinct dimensions of production, with employment representing labor quantity and wages capturing labor cost and, indirectly, skill or productivity differences across states. To assess the robustness of the results, alternative normalizations and input specifications were examined as sensitivity checks, yielding qualitatively consistent productivity patterns and relative state rankings. This supports the stability of the empirical results despite potential overlap in labor measures.
Optimistic and pessimistic MPI results
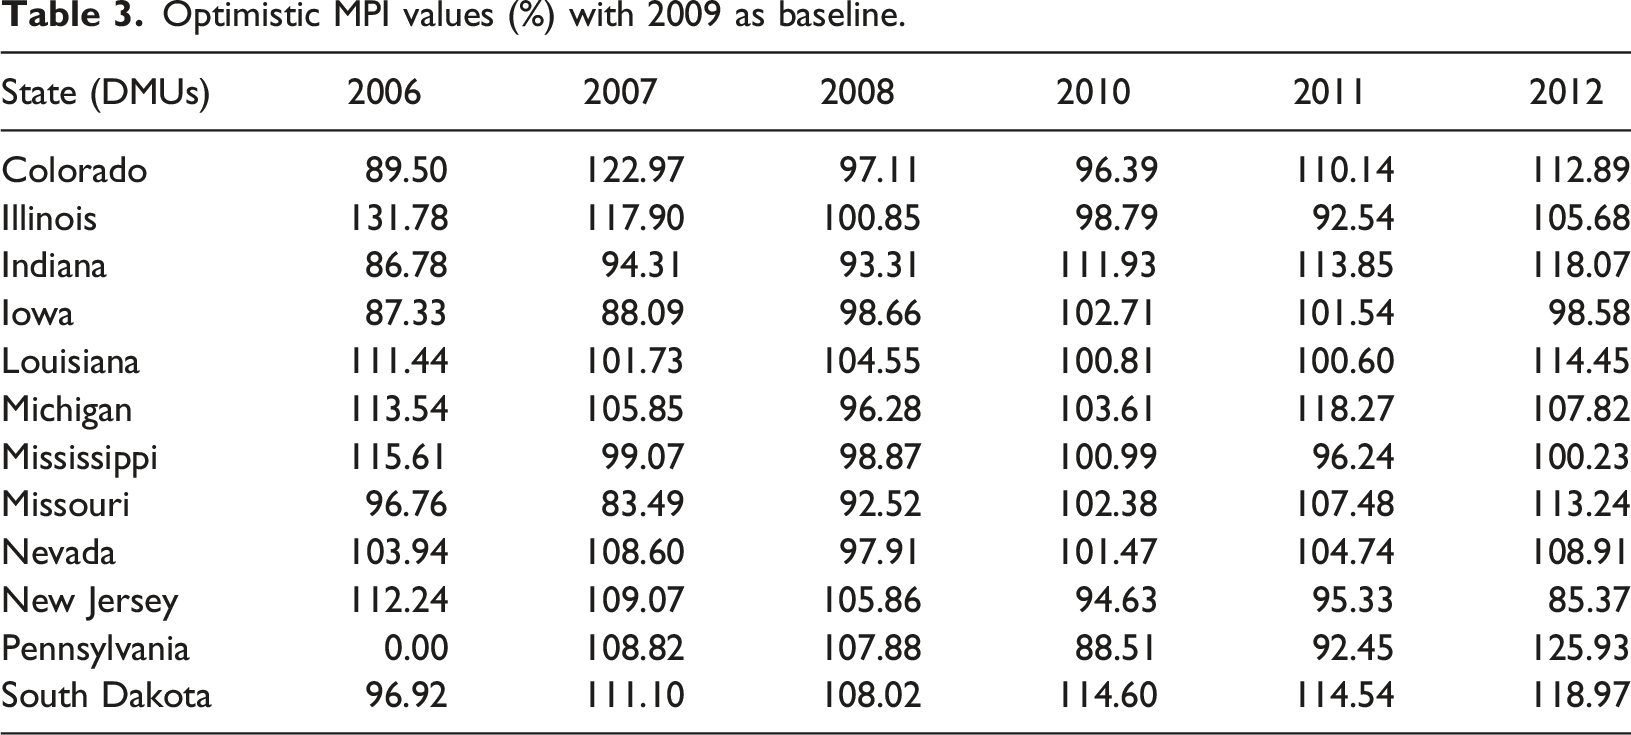
Optimistic MPI values (%) with 2009 as baseline.
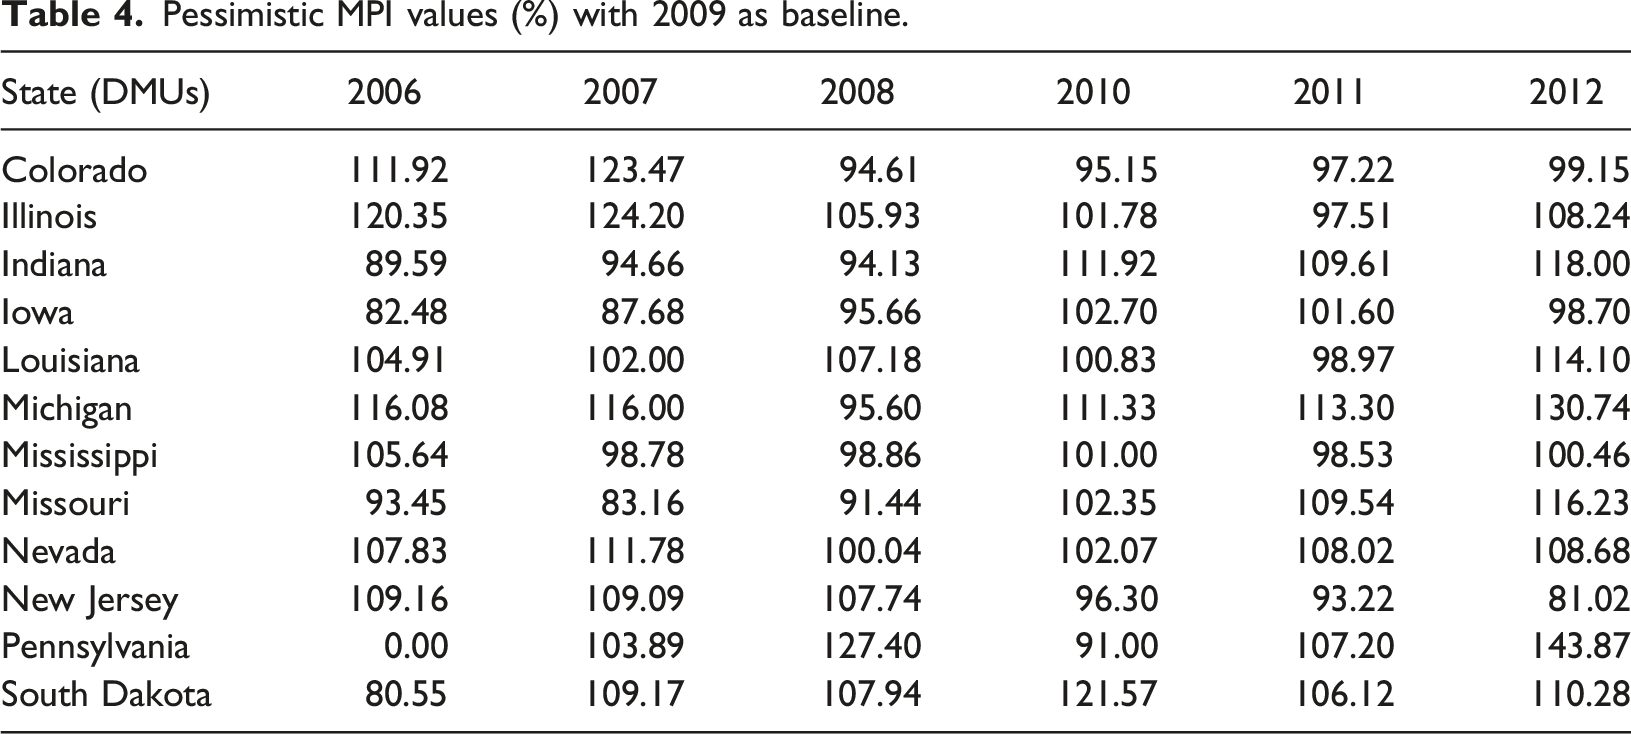
Pessimistic MPI values (%) with 2009 as baseline.
The case of Louisiana (DMU5) illustrates these contrasts clearly. From the optimistic DEA perspective, Louisiana exhibited productivity growth throughout the study period. During the pre-recession years, productivity growth rates were 11.44% in 2006, 1.73% in 2007, and 4.55% in 2008. In the post-recession period, productivity growth remained positive at 0.81% in 2010, 0.60% in 2011, and 14.45% in 2012. On average, Louisiana’s gaming economy recorded annual productivity growth rates of 5.91% before the recession and 5.29% after the recession.
In contrast, pessimistic DEA-based MPI results indicate a different pattern for Louisiana during the post-recession period. Specifically, productivity declined by 1.03% in 2011, suggesting an expansion of inefficiency that is not captured by the optimistic DEA framework. This finding directly contradicts the optimistic MPI estimate, which indicates productivity growth of 0.60% in the same year. Both results are internally consistent but reflect different dimensions of productivity change. The divergence highlights the importance of jointly considering best-practice performance and inefficiency dynamics when assessing productivity under economic stress.
DFDEA-based MPI results
Double frontier MPI values (%) with 2009 as baseline.
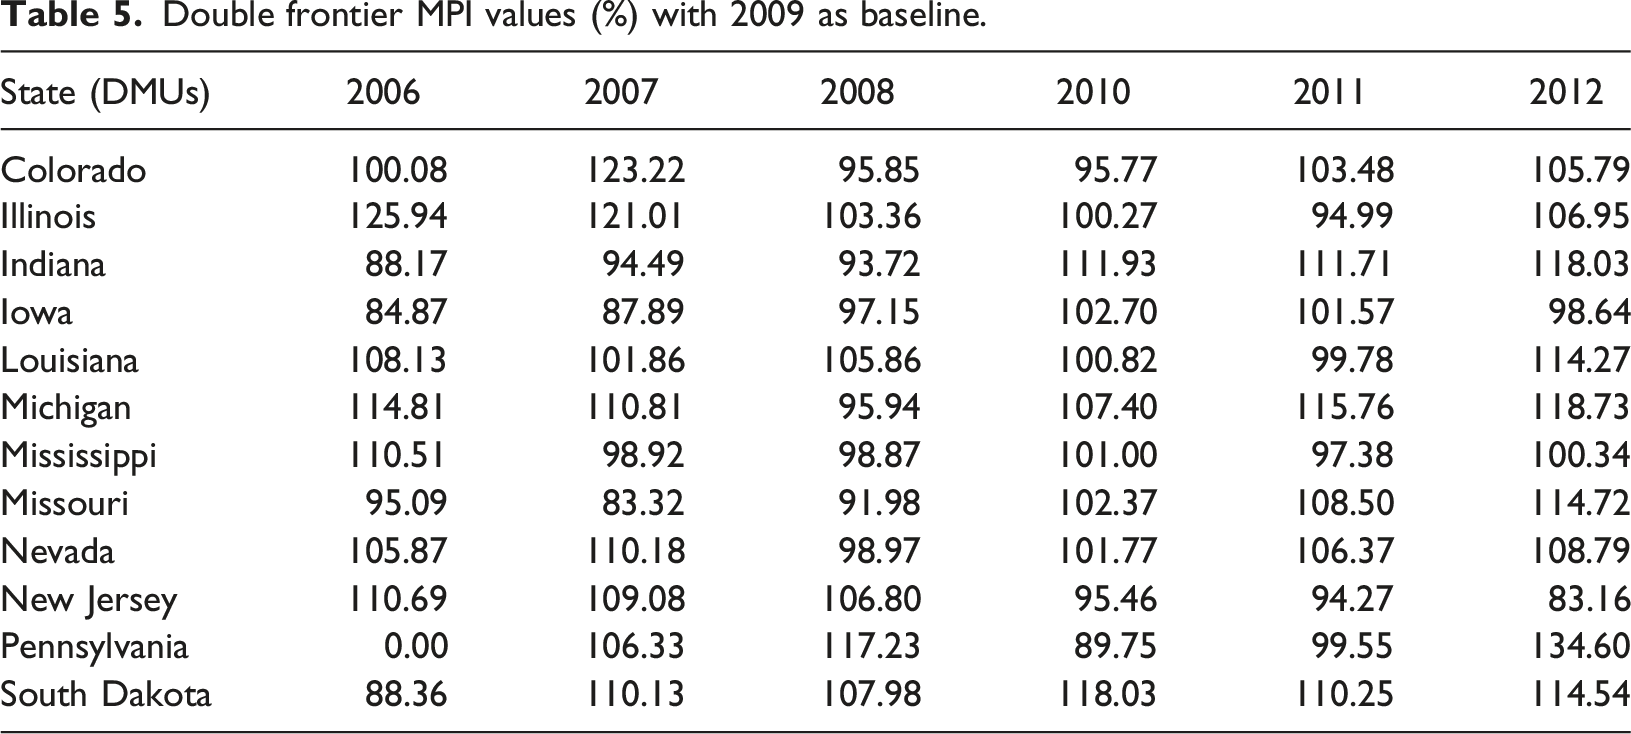
The DFDEA-based MPI reveals that Louisiana experienced a productivity decline of 0.22% in 2011, a result that contrasts with the positive productivity growth suggested by the optimistic MPI alone. For Louisiana, average DFDEA-based productivity growth rates were 8.13% in 2006, 1.87% in 2007, and 5.86% in 2008 during the pre-recession period, and 0.82%, −0.22%, and 14.27% in 2010, 2011, and 2012 respectively during the post-recession period. These findings demonstrate that DFDEA-based MPI captures productivity deterioration that would otherwise be masked under a single-frontier approach.
Across the full sample of twelve states, the DFDEA results reveal substantial heterogeneity in productivity dynamics. In 2008, the year immediately preceding the recession baseline, seven states exhibited negative productivity growth. By 2010, only three states, Colorado, New Jersey, and Pennsylvania, continued to experience productivity decline, while the remaining states showed positive growth. Illinois recorded the highest average productivity growth during the pre-recession period at 16.77%, whereas South Dakota exhibited the highest post-recession average growth rate at 14.27%.
Conversely, Iowa experienced the largest productivity decline during the pre-recession years, with an average annual decline of 10.03%, while New Jersey recorded the greatest post-recession productivity contraction, with an average decline of 9.04%. The productivity patterns illustrated in Figure 1 further confirm that DFDEA-based MPI results differ meaningfully from traditional optimistic DEA-based estimates. State-wise gaming productivity changes over time.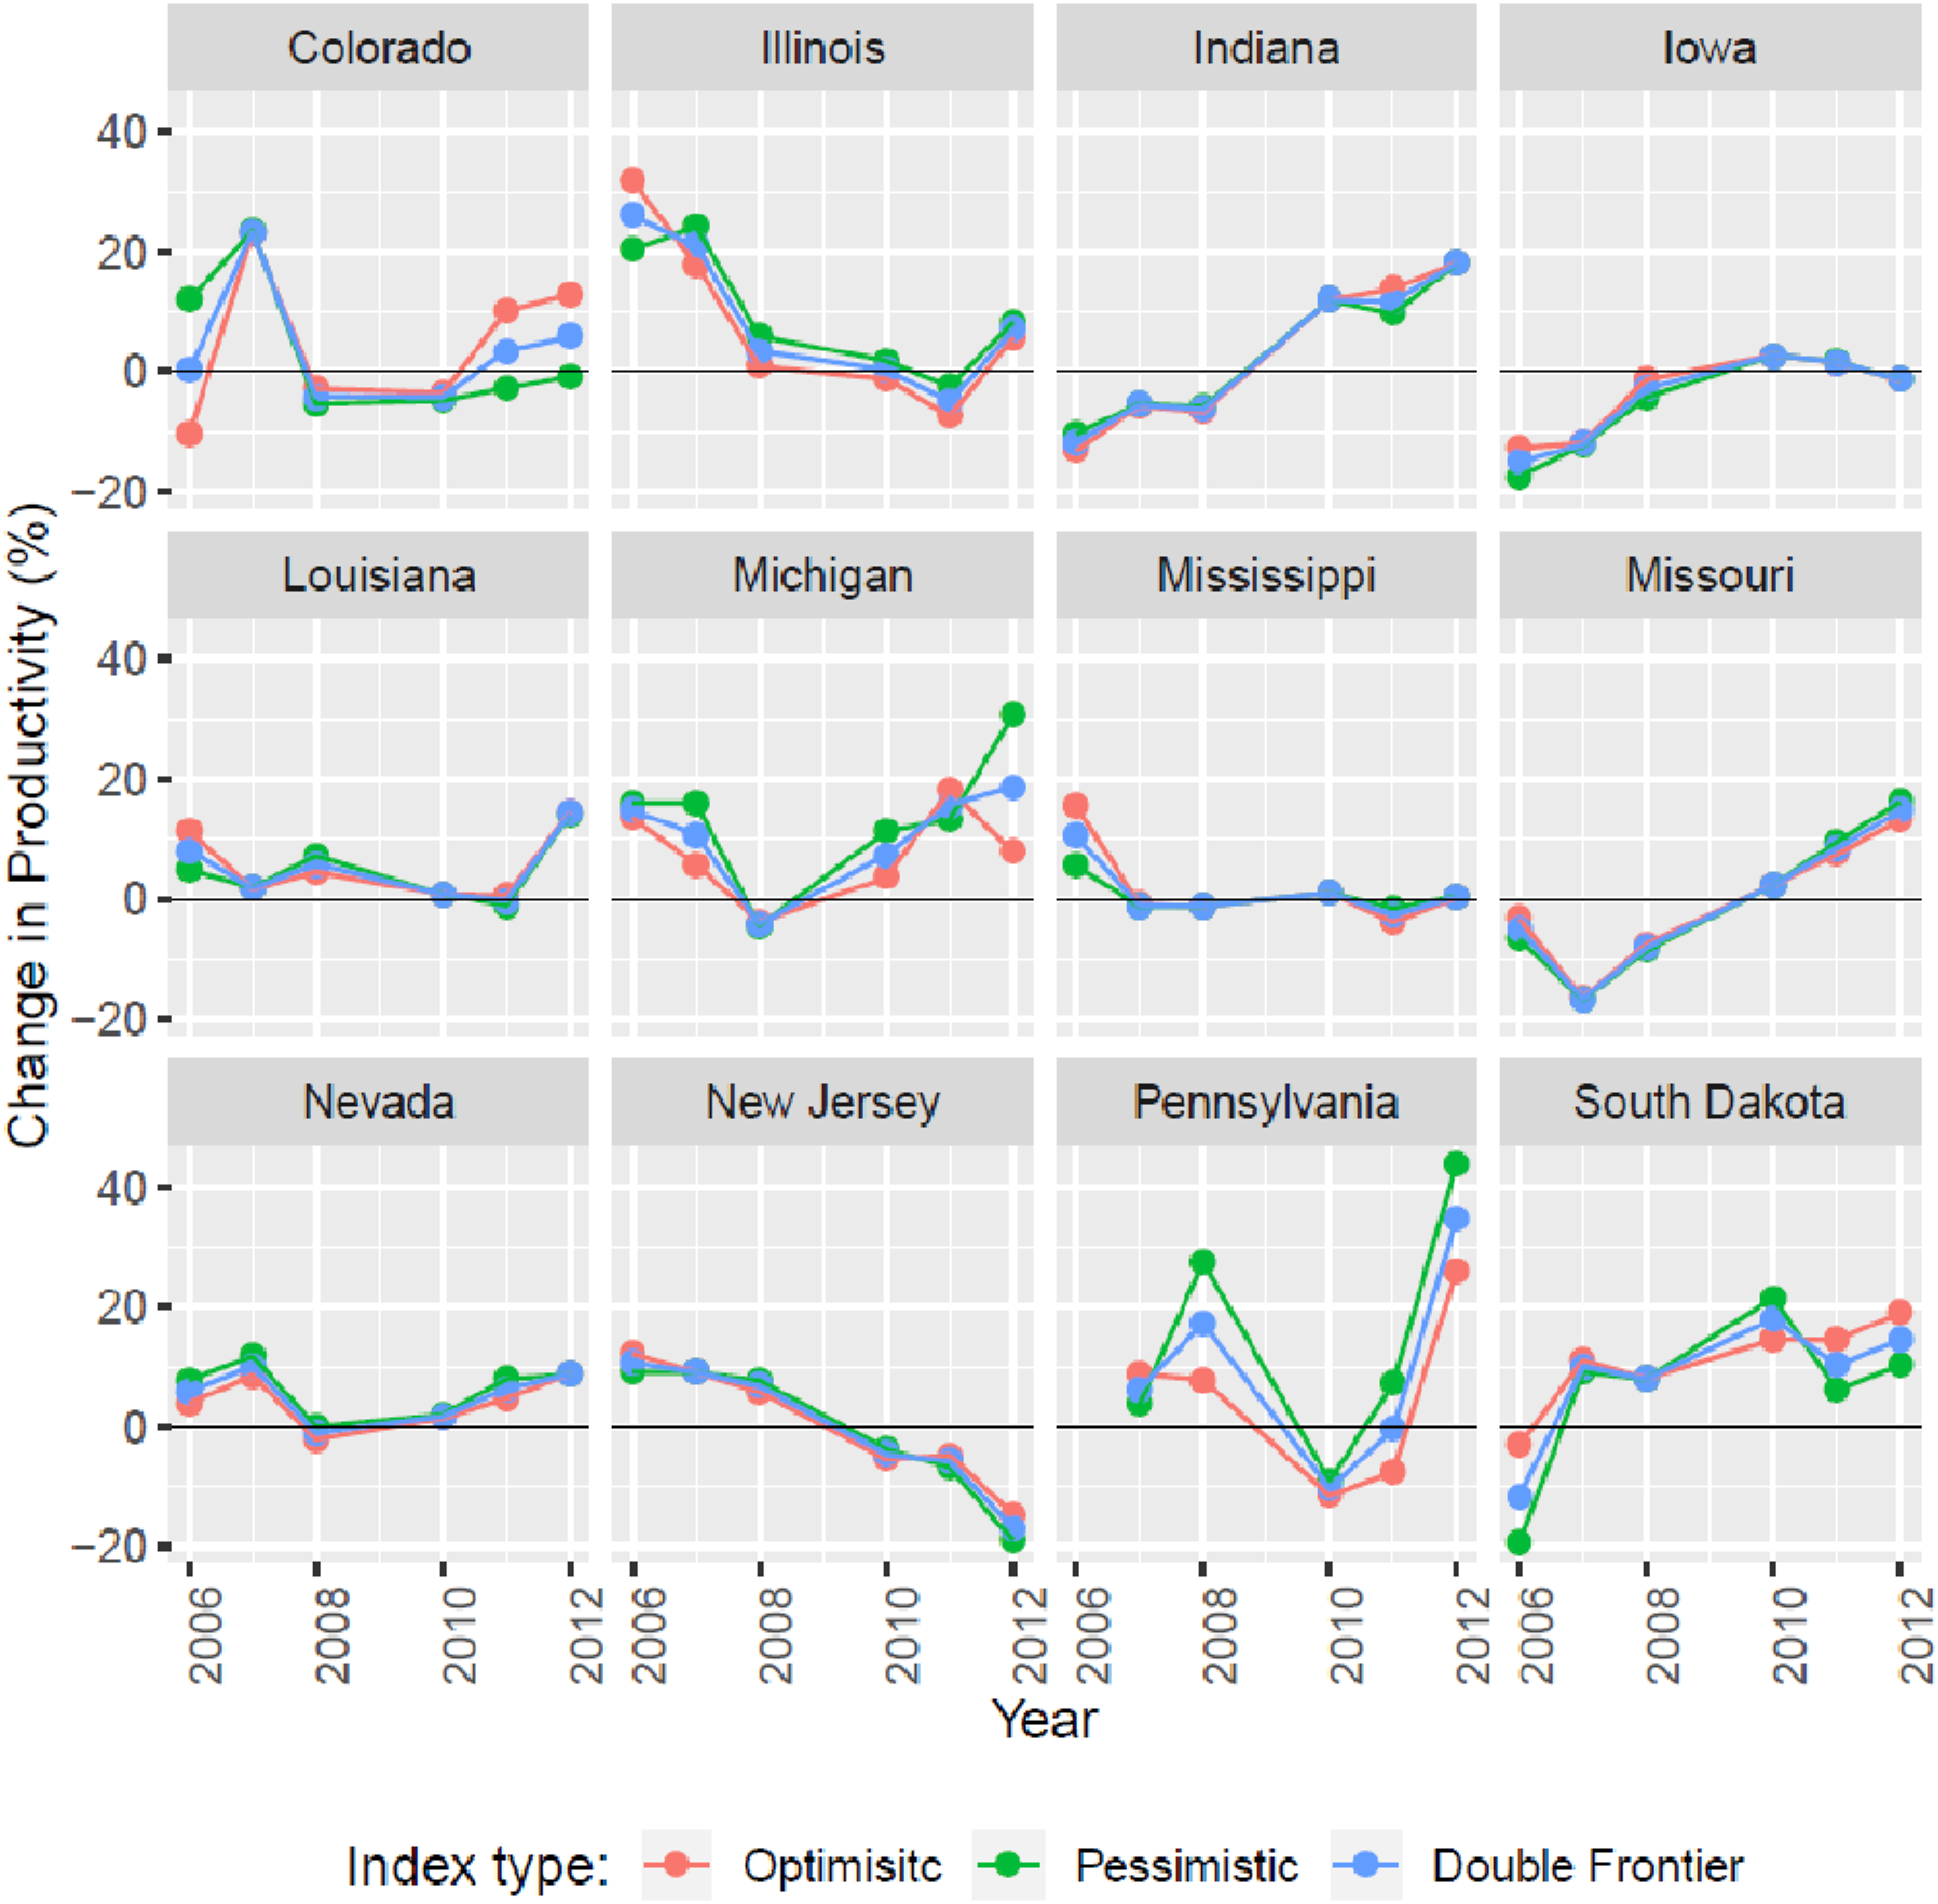
Overall, the DFDEA-based results indicate that productivity growth was negative for five of the twelve states in 2006. By 2008, seven states, representing 58.33% of the sample, experienced negative productivity growth, reflecting widespread productivity deterioration during the recession period. These findings underscore the importance of incorporating both optimistic and pessimistic perspectives to obtain an accurate and crisis-sensitive assessment of productivity dynamics in the casino gaming industry.
Discussion
This study advances productivity measurement in tourism-related industries by introducing a double frontier data envelopment analysis framework for estimating the Malmquist productivity index. Unlike traditional DEA-based MPI approaches that rely exclusively on optimistic frontiers, the proposed DFDEA-based MPI integrates both optimistic and pessimistic perspectives to capture productivity dynamics arising from best-practice advancement as well as inefficiency expansion. By accounting for movements in both efficiency and inefficiency frontiers, the DFDEA approach provides a more inclusive and accurate assessment of productivity change over time.
The observed divergence between optimistic and pessimistic productivity measures aligns with emerging evidence in tourism economics suggesting that crisis periods expose latent inefficiencies that remain undetected under conventional efficiency frameworks (Song, 2022; Watson and Deller, 2022). In particular, the DFDEA-based results highlight that productivity dynamics during downturns are not solely driven by technological change but also by the expansion of inefficiency among underperforming units. This finding reinforces recent arguments that tourism resilience should be evaluated through frameworks capable of distinguishing between efficiency preservation and inefficiency accumulation under stress conditions.
The empirical results demonstrate that productivity estimates derived from pessimistic DEA perspectives can differ substantially from those obtained using optimistic DEA alone. In several cases, pessimistic productivity dynamics exert a stronger influence on overall productivity outcomes. The case of Pennsylvania illustrates this clearly, where pessimistic MPI values exceeded optimistic estimates and materially affected the state’s overall productivity assessment. This divergence highlights the risk of relying solely on optimistic productivity measures, particularly during periods of economic disruption when inefficiency dynamics become more pronounced.
It is also important to recognize that during economic downturns, inputs and outputs may adjust simultaneously in response to a common demand shock. In the context of the Great Recession, changes in employment, wages, and gaming revenues may reflect coordinated responses to declining demand rather than purely independent efficiency adjustments. As a result, observed productivity changes may capture both efficiency dynamics and synchronized input-output contraction. While the DEA-based framework provides valuable relative performance measures under these conditions, it does not fully disentangle these effects, and the results should be interpreted accordingly.
The results further reveal heterogeneous productivity responses across U.S. states during the pre-recession and post-recession periods. States such as Indiana, Michigan, Missouri, Nevada, and South Dakota maintained relatively stable productivity growth in the post-recession period, whereas other states exhibited fluctuating or declining productivity patterns. These differences suggest that state-level policy choices, labor management strategies, and regulatory environments play a critical role in shaping productivity outcomes during economic downturns.
Consistent with prior research, the findings indicate that some states appear to have prioritized employment stability over short-term productivity during the recession period, potentially accepting lower revenue growth to avoid workforce reductions (Del Mar Alonso-Almeida and Bremser, 2013; Roche et al., 2013). However, it is important to note that such mechanisms are not directly tested within the empirical framework. Rather, these explanations are interpretive and grounded in established industry characteristics, including labor intensity and regulatory constraints. As such, the observed productivity patterns should be understood as consistent with, but not causal evidence of, labor retention or regulatory behavior.
Figure 1 indicates that most states experienced an upward productivity trend in the post-recession period, with notable exceptions such as Iowa and New Jersey. In Iowa’s case, productivity decline appears to be driven by continued employment growth without commensurate increases in gaming revenue, suggesting inefficiency expansion rather than technological stagnation. These findings reinforce the value of DFDEA-based MPI in distinguishing between productivity changes driven by frontier shifts and those driven by inefficiency dynamics.
The results also provide insights that may be described as a gaming tourism paradox within the U.S. hospitality sector. States such as Illinois and South Dakota emerged as relatively efficient in the post-recession period despite generating lower absolute gaming revenues. This pattern suggests that gaming tourists, whose expenditures constitute discretionary spending, may substitute toward lower-cost destinations during and after economic downturns rather than abandoning gaming consumption altogether (Zheng et al., 2013). From a managerial perspective, this implies that non-destination casinos may benefit from intensified local and regional marketing strategies aimed at retaining cost-conscious consumers.
Although the empirical analysis focuses on the Great Recession, the methodological insights gained from this study are particularly relevant in the post-COVID context. The COVID-19 pandemic represented an unprecedented systemic shock characterized by mandated closures, uneven regional recovery, labor constraints, and regulatory interventions across tourism and gaming markets. These conditions mirror, and in many cases amplify, the inefficiency dynamics observed during earlier economic crises. The divergence between optimistic and pessimistic productivity measures observed in this study validates the need for dual-frontier productivity assessment frameworks when evaluating tourism resilience and crisis preparedness. These findings are consistent with recent tourism economics evidence showing that post-COVID recovery trajectories are shaped not only by technological efficiency but also by institutional rigidity, labor retention strategies, and regulatory environments (Watson and Deller, 2022). In this sense, the divergence between optimistic and pessimistic productivity measures observed in this study mirrors patterns reported in post-pandemic tourism systems, where short-term inefficiency may coexist with longer-term resilience.
More broadly, these findings suggest that productivity assessments in tourism industries during crisis periods should not be interpreted solely as indicators of technological efficiency, but also as reflections of institutional rigidity and adaptive constraints. The divergence between optimistic and pessimistic measures highlights the importance of distinguishing between apparent recovery and underlying inefficiency persistence when evaluating tourism system resilience.
From a production theory perspective, the results suggest that productivity adjustments during economic crises may reflect both movement along the production frontier and shifts in the frontier itself. This dual dynamic is consistent with theoretical expectations from production frontier literature, where external shocks can induce both technical regress and efficiency loss simultaneously. By incorporating both optimistic and pessimistic perspectives, the DFDEA framework provides a more nuanced representation of these dynamics compared to traditional single-frontier approaches. From a policy perspective, the DFDEA-based MPI can serve as a regulatory stress-testing tool, enabling policymakers to assess how gaming and tourism industries respond to extreme disruptions. By identifying states where inefficiency expansion dominates productivity outcomes, regulators can design targeted interventions aimed at improving operational flexibility, labor productivity, and long-term resilience.
Conclusion
This study proposes a double frontier data envelopment analysis framework for measuring the Malmquist productivity index and applies it to evaluate productivity dynamics in the U.S. casino gaming industry. By integrating optimistic and pessimistic DEA perspectives, the DFDEA-based MPI offers a more comprehensive and objective assessment of productivity change than traditional optimistic-only approaches. The method captures both efficiency improvements and inefficiency expansion, providing a panoramic view of productivity dynamics over time.
Unlike static productivity frameworks, the proposed approach enables dynamic benchmarking by comparing each state’s casino industry not only to its own historical performance but also to the performance of other states. Treating each state-level casino industry as a decision-making unit allows for the identification of relative benchmarks and highlights policy-relevant differences in productivity trajectories. The results demonstrate that productivity assessments based solely on optimistic DEA may overstate resilience during downturns by overlooking inefficiency dynamics that materially affect performance.
The DFDEA-based MPI has important practical implications for policymakers, regulators, and industry stakeholders. For policymakers, the framework provides a robust tool for evaluating the economic impact and operational resilience of casino industries, particularly during periods of economic stress. For underperforming states, the results highlight the strategic practices of higher-performing states, offering guidance for policy reform and operational improvement. For investors and operators, the findings provide insights into state-level productivity trends that are not readily observable through conventional financial metrics.
Beyond the casino sector, the methodological contribution of this study extends to tourism and hospitality industries more broadly. The COVID-19 pandemic has underscored the importance of crisis preparedness, tourism resilience, and regulatory adaptability. The DFDEA-based MPI offers a valuable analytical framework for assessing productivity under asymmetric shocks, making it well suited for post-COVID tourism research and policy evaluation.
Future research may extend this framework by incorporating longer time horizons, additional tourism-related sectors, or alternative regulatory environments. Further studies could also explore the integration of environmental, social, and governance indicators into dual-frontier productivity assessment to enhance the evaluation of sustainable tourism development. Overall, this study contributes to tourism economics by advancing productivity measurement in ways that are directly relevant for crisis analysis, resilience planning, and evidence-based policymaking.
Theoretical implications
From the perspective of tourism resilience theory (Hall et al., 2018), the DFDEA-based productivity framework captures how tourism-related industries absorb shocks, adapt operationally, and sustain functionality under severe disruption. The findings highlight the inherent trade-off between shock absorption and short-term efficiency, as policies that preserve employment and operational continuity may temporarily expand inefficiency while strengthening longer-term resilience (Del Mar Alonso-Almeida and Bremser, 2013). Recent contributions in Tourism Economics emphasize that tourism resilience should be evaluated through frameworks capable of distinguishing shock absorption from short-term efficiency outcomes, particularly in regulated tourism industries (Song, 2022; Ampountolas et al., 2024, Legg et al., 2025). By operationalizing this distinction through a double frontier productivity framework, the present study contributes to an emerging methodological direction in tourism economics that supports regulatory stress-testing and crisis-informed policy evaluation. Viewed through the lens of regulatory economics (Stiglitz, 2010), the proposed DFDEA framework functions as a stress-testing mechanism that enables policymakers to evaluate how regulatory environments and institutional constraints shape productivity outcomes during systemic crises.
Limitations and future research
Study limitations
This study relies on secondary data obtained from the American Gaming Association and individual state Gaming Commission websites. As a result, the analysis is limited to states and casino operations for which consistent and publicly available data exist. Information on non-surviving casinos is not reported systematically by the American Gaming Association, which restricts the ability to incorporate entry and exit dynamics explicitly into the analysis. While this data limitation constrains the temporal and cross-sectional scope of the study, it does not undermine the validity of the productivity measures derived at the state level. More recent data would allow for additional validation, however, consistent state-level labor input data required for DEA-based productivity analysis are not available beyond 2012. This limitation reflects broader data constraints in the casino industry rather than a shortcoming of the empirical design.
A further limitation inherent in the use of secondary data is that the data were not originally collected to address the specific research questions examined in this study. Consequently, the selection of input and output variables is constrained by data availability rather than theoretical completeness. Although labor and revenue measures are widely used and appropriate for analyzing productivity in labor-intensive hospitality industries (Assaf and Barros, 2011), access to more granular operational data could provide additional managerial insights. For example, information on coin-in values, table-drop revenue, or property-level operational metrics could enhance the precision of productivity assessment if such data were made publicly available across states.
The analysis is also limited by the availability of data for the study period from 2006 to 2012. While this time frame captures the pre-recession, recession, and post-recession phases of the Great Recession, extending the analysis to more recent periods would allow for further validation of the proposed methodology under different economic conditions.
Concerns related to survivorship bias warrant clarification. Survivorship bias typically arises when analyses focus exclusively on entities that persist over time while excluding those that exit the market, potentially skewing results. In the present study, survivorship bias is not a primary concern because the unit of analysis is the state-level aggregated casino industry rather than individual casino properties. The focus is on long-term productivity trends at the aggregate level, incorporating all available casino activity within each state over time. As such, productivity measures reflect overall industry performance rather than outcomes of specific firms or properties. While researchers should remain attentive to other potential sources of bias, such as reporting bias or data aggregation effects, survivorship bias does not materially affect the interpretation of the results presented here.
Future research directions
The findings of this study suggest several promising avenues for future research. First, the DFDEA-based Malmquist productivity index framework can be extended to other segments of the tourism and hospitality industry, including hotels, restaurants, and tourism-related real estate investment trusts. Prior studies have applied traditional DEA-based productivity analysis to post-crisis real estate investment trust (REIT) performance, hotel productivity growth, and hospitality life cycle dynamics (Ampountolas, 2022; Chatzimichael and Liasidou, 2019; Yin et al., 2015). Incorporating dual-frontier productivity measurement into these contexts could provide deeper insights into inefficiency dynamics and resilience under economic stress.
Second, future research could enhance the DFDEA framework by incorporating additional sources of heterogeneity, such as geographic location, ownership structure, management type, and regulatory regimes. Accounting for such factors would allow for more nuanced comparisons across decision-making units and improve the policy relevance of productivity assessments. Integrating environmental, social, and governance considerations into the dual-frontier productivity framework may also contribute to the growing literature on sustainable tourism and responsible gaming.
Third, extending the DFDEA-based MPI to more recent data would provide an opportunity to evaluate productivity dynamics during and after the COVID-19 pandemic. Although this study does not analyze COVID-era data directly, the methodological insights developed here are well suited for examining asymmetric shocks, regulatory disruptions, and uneven recovery patterns characteristic of the pandemic period. Applying the DFDEA framework in a post-COVID setting would further validate its usefulness for crisis preparedness, tourism resilience analysis, and regulatory stress-testing.
Finally, future research may explore hybrid modeling approaches that combine DFDEA with stochastic frontier analysis or panel econometric techniques to address noise and measurement error explicitly. Such extensions could strengthen inference and broaden the applicability of dual-frontier productivity measurement across tourism and hospitality industries.
Supplemental material
Supplemental material - Tourism productivity under crisis conditions: A double frontier Malmquist analysis of the U.S. casino gaming industry
Supplemental material for Tourism productivity under crisis conditions: A double frontier Malmquist analysis of the U.S. casino gaming industry by Asit Bandyopadhayay, Somak Dutta and Tianshu Zheng in Tourism Economics.
Footnotes
Acknowledgements
The authors acknowledge the support of their respective institutions. No external funding was received for this research.
Ethical considerations
This study did not involve human participants, animals, or any primary data collection; therefore, ethical clearance was not required. All data used in this research are secondary in nature and were obtained from publicly available sources on the American Gaming Association website.
Funding
The authors received no financial support for the research, authorship, and/or publication of this article.
Declaration of conflicting interests
The authors declared no potential conflicts of interest with respect to the research, authorship, and/or publication of this article.
Data Availability Statement
All data used in this study are secondary in nature and publicly available through the American Gaming Association website (https://www.americangaming.org). The complete dataset used for analysis is also included in Table 1–![]() . No additional datasets were generated.
. No additional datasets were generated.
Supplemental material
Supplemental material for this article is available online.
Author biographies
References
Supplementary Material
Please find the following supplemental material available below.
For Open Access articles published under a Creative Commons License, all supplemental material carries the same license as the article it is associated with.
For non-Open Access articles published, all supplemental material carries a non-exclusive license, and permission requests for re-use of supplemental material or any part of supplemental material shall be sent directly to the copyright owner as specified in the copyright notice associated with the article.