
Abstract
The Travel and Leisure (T&L) sector and the airline industry are deeply interconnected parts of global financial markets. Understanding how T&L conditions shape airline stock returns across different market phases is essential for sound investment and risk management decisions. We hypothesize a bidirectional and asymmetric relationship that intensifies under extreme market conditions and over shorter time horizons. Using 1193 synchronized daily observations from 2 January 2015 to 26 June 2025, airline returns across Europe, North America, and Asia-Pacific are analyzed against regional and global STOXX T&L indices via the cross-quantilogram framework. Results confirm asymmetric dependence concentrated in joint extreme states, particularly during downturns and over the short term. Regional indices capture local market characteristics more effectively, while the global index suits internationally active airlines. Overall, airline and T&L interdependence is dynamic, driven by market regime and time horizon, with implications for risk assessment, portfolio construction, and broader tourism industry resilience.
Introduction
Air transport lies at the core of the Travel and Leisure sector because, in practice, it turns disposable income and people’s desire to travel into actual tourist movements and revenue for businesse. The long-term demand for leisure air travel has received considerable attention in the literature, both as a factor that strengthens tourism development and as an activity constrained by structural factors such as capacity, prices, and broader macroeconomic conditions (Assaf, 2011; Gil-Alana et al., 2013; Graham, 2000; Kilincarslan and Demiralay, 2021). The factors that influence the performance of leisure airlines do not remain constant over time. Changes in income, ticket prices, network structure, and the intensity of competition affect the way economic shocks are translated into passenger demand and, ultimately, into airline profitability and stock valuations (Graham, 2006). From this perspective, demand for leisure air travel is particularly sensitive to both prices and income, which means that earnings and stock prices can respond quickly to demand-related news (Alamdari, 2002). At the same time, the heterogeneity of the sector itself also matters greatly. In Europe, for example, the coexistence of network airlines and low-cost carriers shows that there are different cost structures, different route strategies, and different degrees of exposure to demand cycles, all of which affect the way their stocks move in relation to broader travel sentiment (Papatheodorou et al., 2012; Papatheodorou and Lei, 2006).
Research on airlines and travel has already made some important points, but the evidence is still spread out across different parts of the literature. One strand examines the real-economy determinants of leisure air travel and airline performance, indicating that demand is influenced by income, pricing, network configuration, and variations in business models among carriers (Alamdari, 2002; Graham, 2006; Papatheodorou et al., 2012; Papatheodorou and Lei, 2006). These studies elucidate the rationale behind the responsiveness of airline profitability and valuation to fluctuations in broader travel conditions. But their main purpose is not to look at how airline stocks and the Travel and Leisure sector as a whole interact in financial markets, or whether this interaction changes depending on the state of the market.
A second strand looks more closely at how travel and leisure stocks behave. It shows that the sector is marked by volatility, persistence, and sensitivity to macro-financial shocks. For instance, earlier research has recorded long-memory and enduring volatility in travel and leisure indices (Andraz et al., 2018; Lim and Chan, 2013), alongside significant influences from exchange rates, oil prices, economic sentiment, and uncertainty (Hadi, 2023; Hadood and Irani, 2021; Jalkh et al., 2021; Mollick and Amin, 2021). The main thing this literature adds is that travel-related stocks don’t react to shocks in a straightforward or consistent way. Most of these studies, on the other hand, use regressions, correlations, volatility models, or other mean-oriented frameworks. Consequently, they provide insights into average comovement and general risk transmission, but they are less effective in determining whether airline-sector linkages vary across downside, median, and upside market conditions.
A third strand concentrates on crisis periods and negative shocks, demonstrating that travel-related assets are particularly susceptible during instances such as COVID-19, geopolitical tensions, and general uncertainty shocks (Assaf et al., 2022; Demiralay and Kilincarslan, 2019; Kaczmarek et al., 2021; Sun et al., 2025; Wang et al., 2023). This literature is particularly significant as it indicates that the most substantial spillovers may occur specifically during periods of stress rather than under typical circumstances. Nonetheless, the evidence remains insufficient in three significant aspects. First, it is still not clear if the dependence between airlines and Travel and Leisure is systematically different across the whole range of returns. Second, the literature offers insufficient evidence regarding the bidirectionality of this relationship, specifically whether sector conditions influence airline returns and whether airline-specific shocks impact broader sector pricing. Third, there is limited knowledge regarding the variations in these dependence patterns across regions and between regional and global Travel and Leisure benchmarks.
A related but different area of recent research has started to link tourism economics more closely with sustainability, technology, and structural uncertainty. For instance, recent research investigates the alignment of growth with ESG factors in Asia, the interaction of artificial intelligence with ESG-oriented sustainable tourism, and the relationship between renewable energy and tourism demand with the Sustainable Development Goals (Işık et al., 2024, 2025, 2026). These studies are significant as they expand the economic analysis of tourism development beyond immediate market performance and underscore the increasing relevance of sustainability-focused and policy-oriented frameworks. Simultaneously, they do not directly tackle the inquiry investigated in the current study, specifically whether airline stock returns and conditions within the Travel and Leisure sector demonstrate asymmetric, bidirectional, and quantile-dependent financial linkages across various regions and time horizons. Consequently, they assist in contextualizing the broader significance of the subject, while simultaneously highlighting the unique contribution of the current paper.
These constraints delineate the research gap that this study aims to address. The question is not whether airline stocks and the larger Travel and Leisure sector are connected, since earlier research has already shown that they are, but whether this connection is state-dependent, directional, and horizon-specific in ways that methods based on means cannot fully capture. Consequently, this study investigates whether airline stock returns and conditions in the Travel and Leisure sector exhibit quantile-dependent spillovers that fluctuate across market extremes, directions, horizons, and regions. In this way, the paper adds to the tourism-finance literature by moving from a focus on average connectedness to a more distribution-sensitive look at how airlines and sectors depend on each other.
Consequently, the primary research question of this study is whether the relationship between airline stock returns and conditions in the Travel and Leisure sector is asymmetric, bidirectional, and dependent on the time horizon across various market states, regions, and benchmark definitions. To address this question, the study investigates whether airline–sector dependence fluctuates across the quantiles of the return distribution, whether it varies by direction—from sector indices to airline returns and from airline returns to sector indices—whether the intensity and pattern of dependence shift across short-, medium-, and long-term horizons, and whether regional and global Travel and Leisure benchmarks reflect distinct forms of airline–sector interconnectedness. To capture the conditions prevailing in the Travel and Leisure sector, we use STOXX Travel and Leisure price indices as market-based indicators that can serve as investable benchmarks at both the regional and global level. Specifically, the analysis focuses on the STOXX Asia Pacific 600 Travel and Leisure, STOXX Europe 600 Travel and Leisure, STOXX North America 600 Travel and Leisure, and STOXX Global 3000 Travel and Leisure indices. These indices bring together listed companies operating in the broader Travel and Leisure sector, such as airlines, hospitality businesses, and other leisure-related activities, and are designed to reflect investable market movements (Sun et al., 2025). Previous research based on these indices has shown that distribution-sensitive approaches can identify weaknesses and vulnerabilities that do not become visible through analyses based only on the average, particularly under adverse market conditions (Demiralay and Kilincarslan, 2019). For this reason, these indices provide an appropriate benchmark for assessing the comovement of airlines with the broader travel economy and for separating region-specific dynamics from global common sentiment and shocks.
The airline sample has been organized geographically so that there is alignment between company characteristics, investor attention, and the corresponding STOXX Travel and Leisure indices. In Europe, the sample includes Air France KLM, easyJet, International Airlines Group, Lufthansa, and Ryanair. In North America, it includes American Airlines Group, Delta Air Lines, Southwest Airlines, and United Airlines Holdings. In Asia, it includes Air China, China Eastern Airlines, and China Southern Airlines. Turkish Airlines is included in the sample as a distinctive, geographically and operationally hybrid case, as it connects regional and international flows and thus offers a useful example for examining whether global Travel and Leisure conditions outweigh a purely regional perspective. Based on 1193 aligned daily observations from 2 January 2015 to 26 June 2025, we examine the relationship of each airline with both the corresponding regional STOXX Travel and Leisure index and the STOXX Global 3000 Travel and Leisure index, in order to compare local and global dependence in a structured way.
This sample is a useful case for the present study because it brings together major listed airlines from Europe, North America, and Asia-Pacific, and therefore reflects differences in market structure, business models, and international exposure across the broader Travel and Leisure sector. The inclusion of both more regionally focused carriers and more internationally oriented network airlines makes it possible to examine whether airline–sector dependence is better explained by local benchmark conditions or by broader global travel sentiment. At the same time, the findings are most directly relevant to large listed airlines operating in relatively liquid and internationally connected equity markets. For that reason, some caution is needed when extending the results to smaller carriers, unlisted firms, or markets with very different institutional, regulatory, or liquidity characteristics (Figure 1). Theoretical and empirical framework of airline–Travel and Leisure interdependence.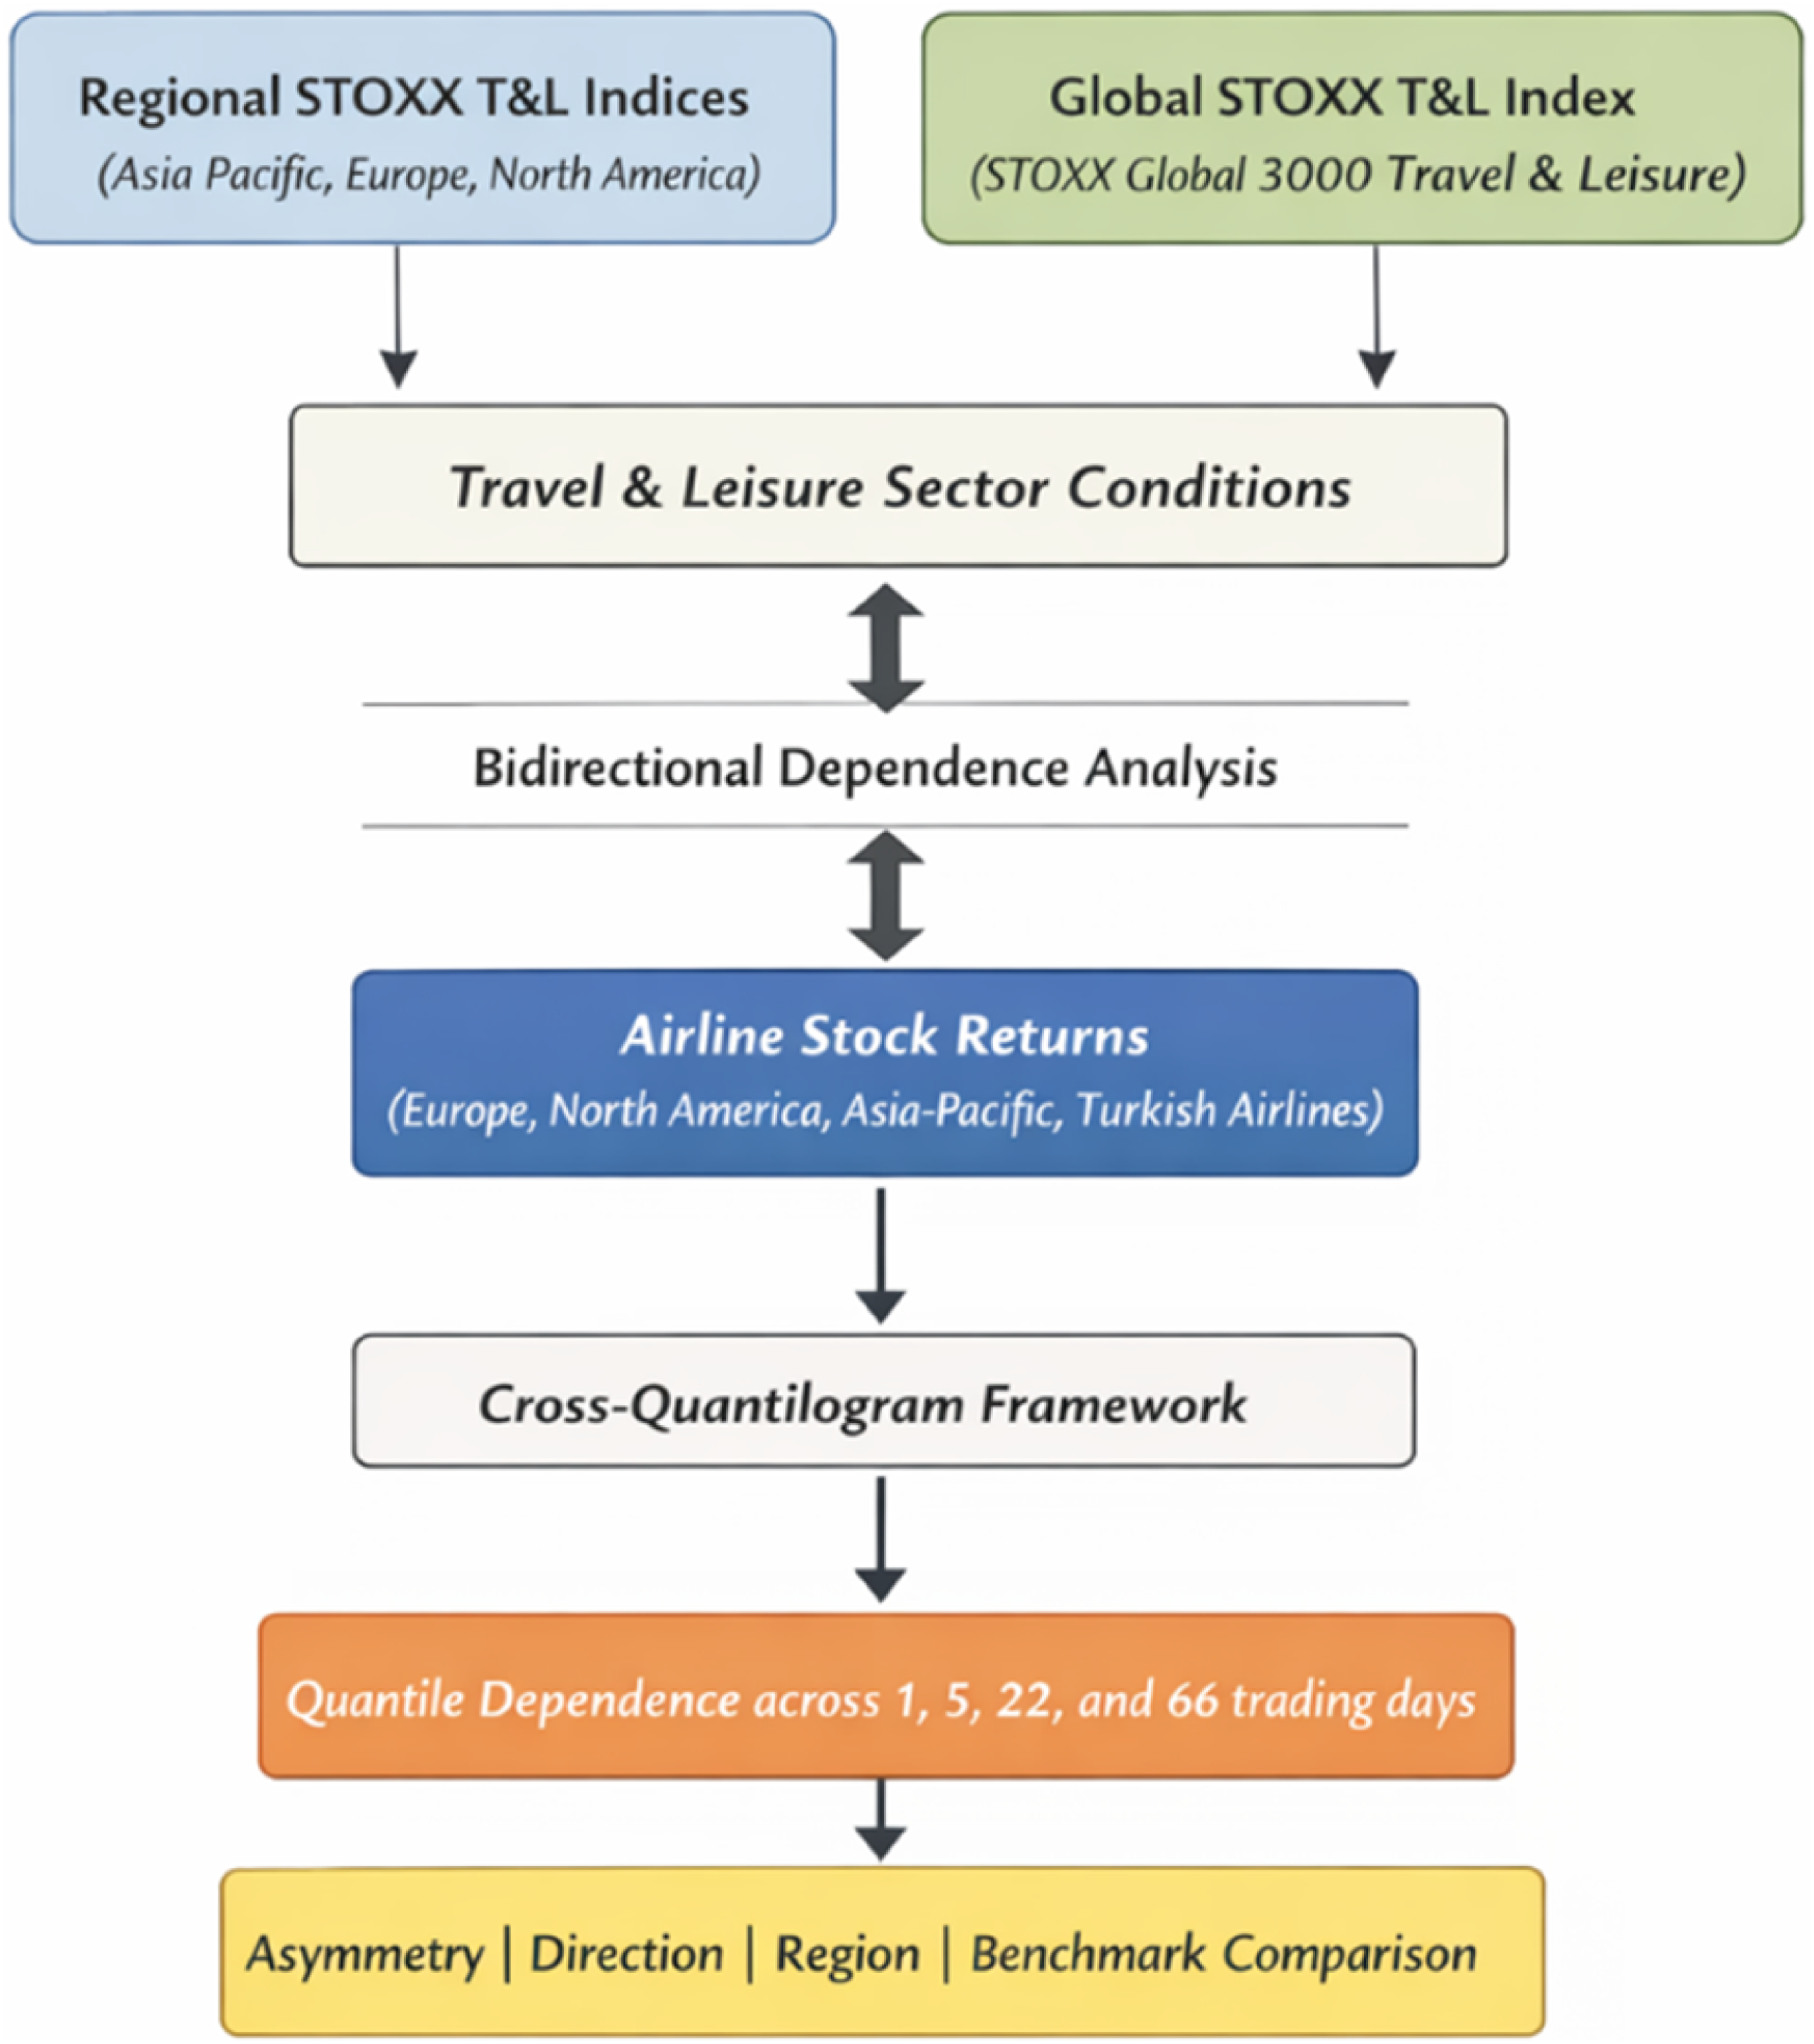
At the methodological level, we use dependence heatmaps based on quantile intervals and examine them across multiple time horizons: 1, 5, 22, and 66 trading days, as well as in both directions of the relationship. The empirical analysis is based on the cross-quantilogram framework of Han et al. (2016), which measures directional quantile dependence across different time horizons and is particularly suitable for detecting lag relationships that mainly appear in the tails of the distribution and may not be captured by tools based on the average (Naeem et al., 2022). This framework allows the relationship between Travel and Leisure sector conditions and airline returns to change depending on market conditions and the time horizon, thereby providing a richer and more accurate picture of spillovers and interactions than conventional measures of average dependence.
The study’s results indicate that the relationship between airlines and the Travel and Leisure sector is significantly influenced by market conditions and the time horizon, characterized primarily by asymmetry. Extreme market states tend to have stronger comovements than the median, and the strongest signals are usually found over short-term time frames. In contrast, over longer periods of time, the patterns of dependence tend to get weaker or spread out. The regional STOXX Travel and Leisure indices seem to reflect local trends for airlines that focus on a specific region, while the global Travel and Leisure index works better as a common factor for network carriers that have strong international ties. Turkish Airlines is an interesting case because it seems to fit the global standard better than a purely regional one. This is probably because its network is international. The paper adds to the tourism-finance literature by showing that the connection between airlines and the tourism sector should not be seen as a single average relationship. Instead, it should be seen as a process that depends on the state, direction, and horizon, and that changes depending on the tails, regions, and benchmark definitions. From this perspective, there are also practical contributions, because the results have useful implications for building portfolios, managing risk during crises, planning for airline resilience, and making policies in economies that depend on tourism.
After presenting the study’s main research question, the relevant literature, and its conceptual background, the next section turns to the data, the way the variables are constructed, and the empirical framework used to examine the relationships between airline returns and Travel and Leisure sector conditions, which vary depending on market conditions and the time horizon.
Data and methodology
This section provides the sample construction and cross-quantilogram methodology used in the analysis to investigate these connections in a real-world way. In particular, this study uses daily data from 2 January 2015 to 26 June 2025. After synchronizing trading days across markets and retaining only common trading dates, the sample comprises 1193 aligned observations. All price series are obtained from LSEG Workspace (Refinitiv) and converted into daily log returns. Sector conditions are proxied by four STOXX Travel and Leisure price indices with different geographic scopes, namely the STOXX Asia Pacific 600 Travel and Leisure, the STOXX Europe 600 Travel and Leisure, the STOXX North America 600 Travel and Leisure, and the STOXX Global 3000 Travel and Leisure. The airline sample is organized by continent to facilitate cross regional interpretation. Europe includes Air France KLM, easyJet, International Airlines Group, Lufthansa, and Ryanair. North America includes American Airlines Group, Delta Air Lines, Southwest Airlines, and United Airlines Holdings. Asia includes Air China, China Eastern Airlines, and China Southern Airlines. Turkish Airlines is treated as a Eurasian carrier and is discussed separately when interpreting regional spillovers, given Turkey’s economic and market linkages to both Europe and Asia.
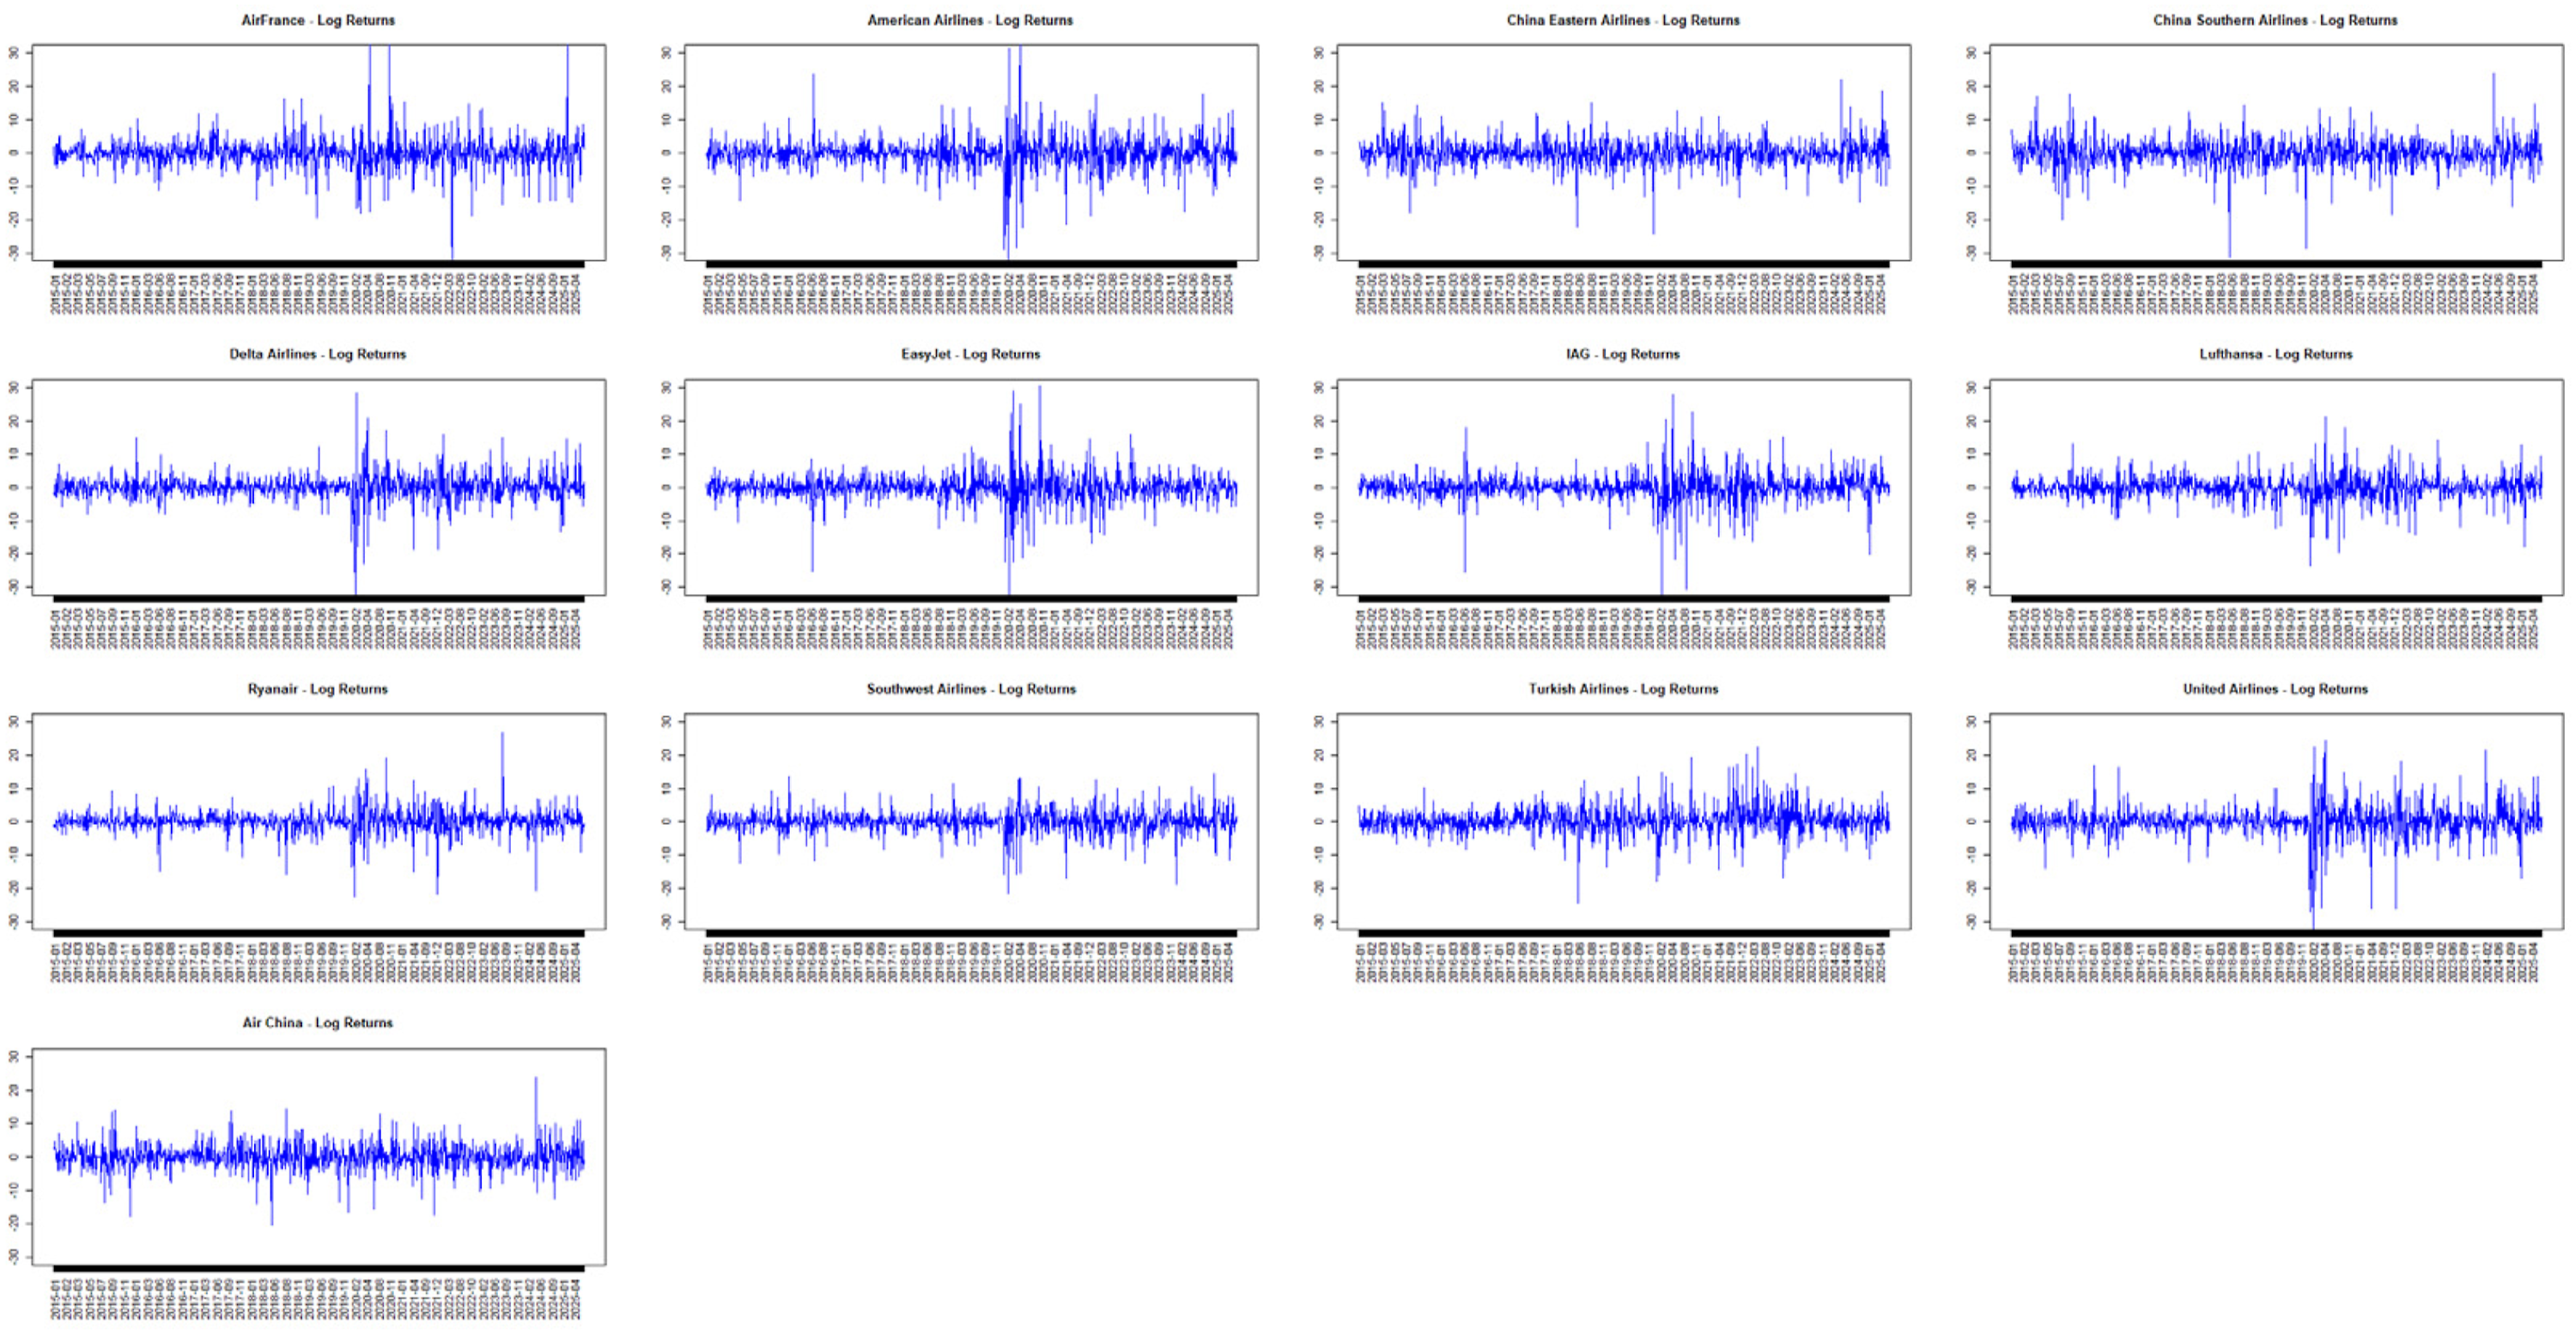
Figures 2 and 3 plot index and airline stock price levels highlight common turning points over the sample period. Figures 4 and 5 report daily log returns and illustrate volatility clustering and extreme observations across both sector indices and airline equities. Figure 2 shows pronounced co-movement during major stress episodes, most notably the synchronized drawdown around early 2020, followed by a gradual recovery, while regional trajectories diverge outside this common episode. STOXX Travel and Leisure indices. Airline sample. Daily log returns of STOXX Travel and Leisure indices. Daily log returns of airline equities.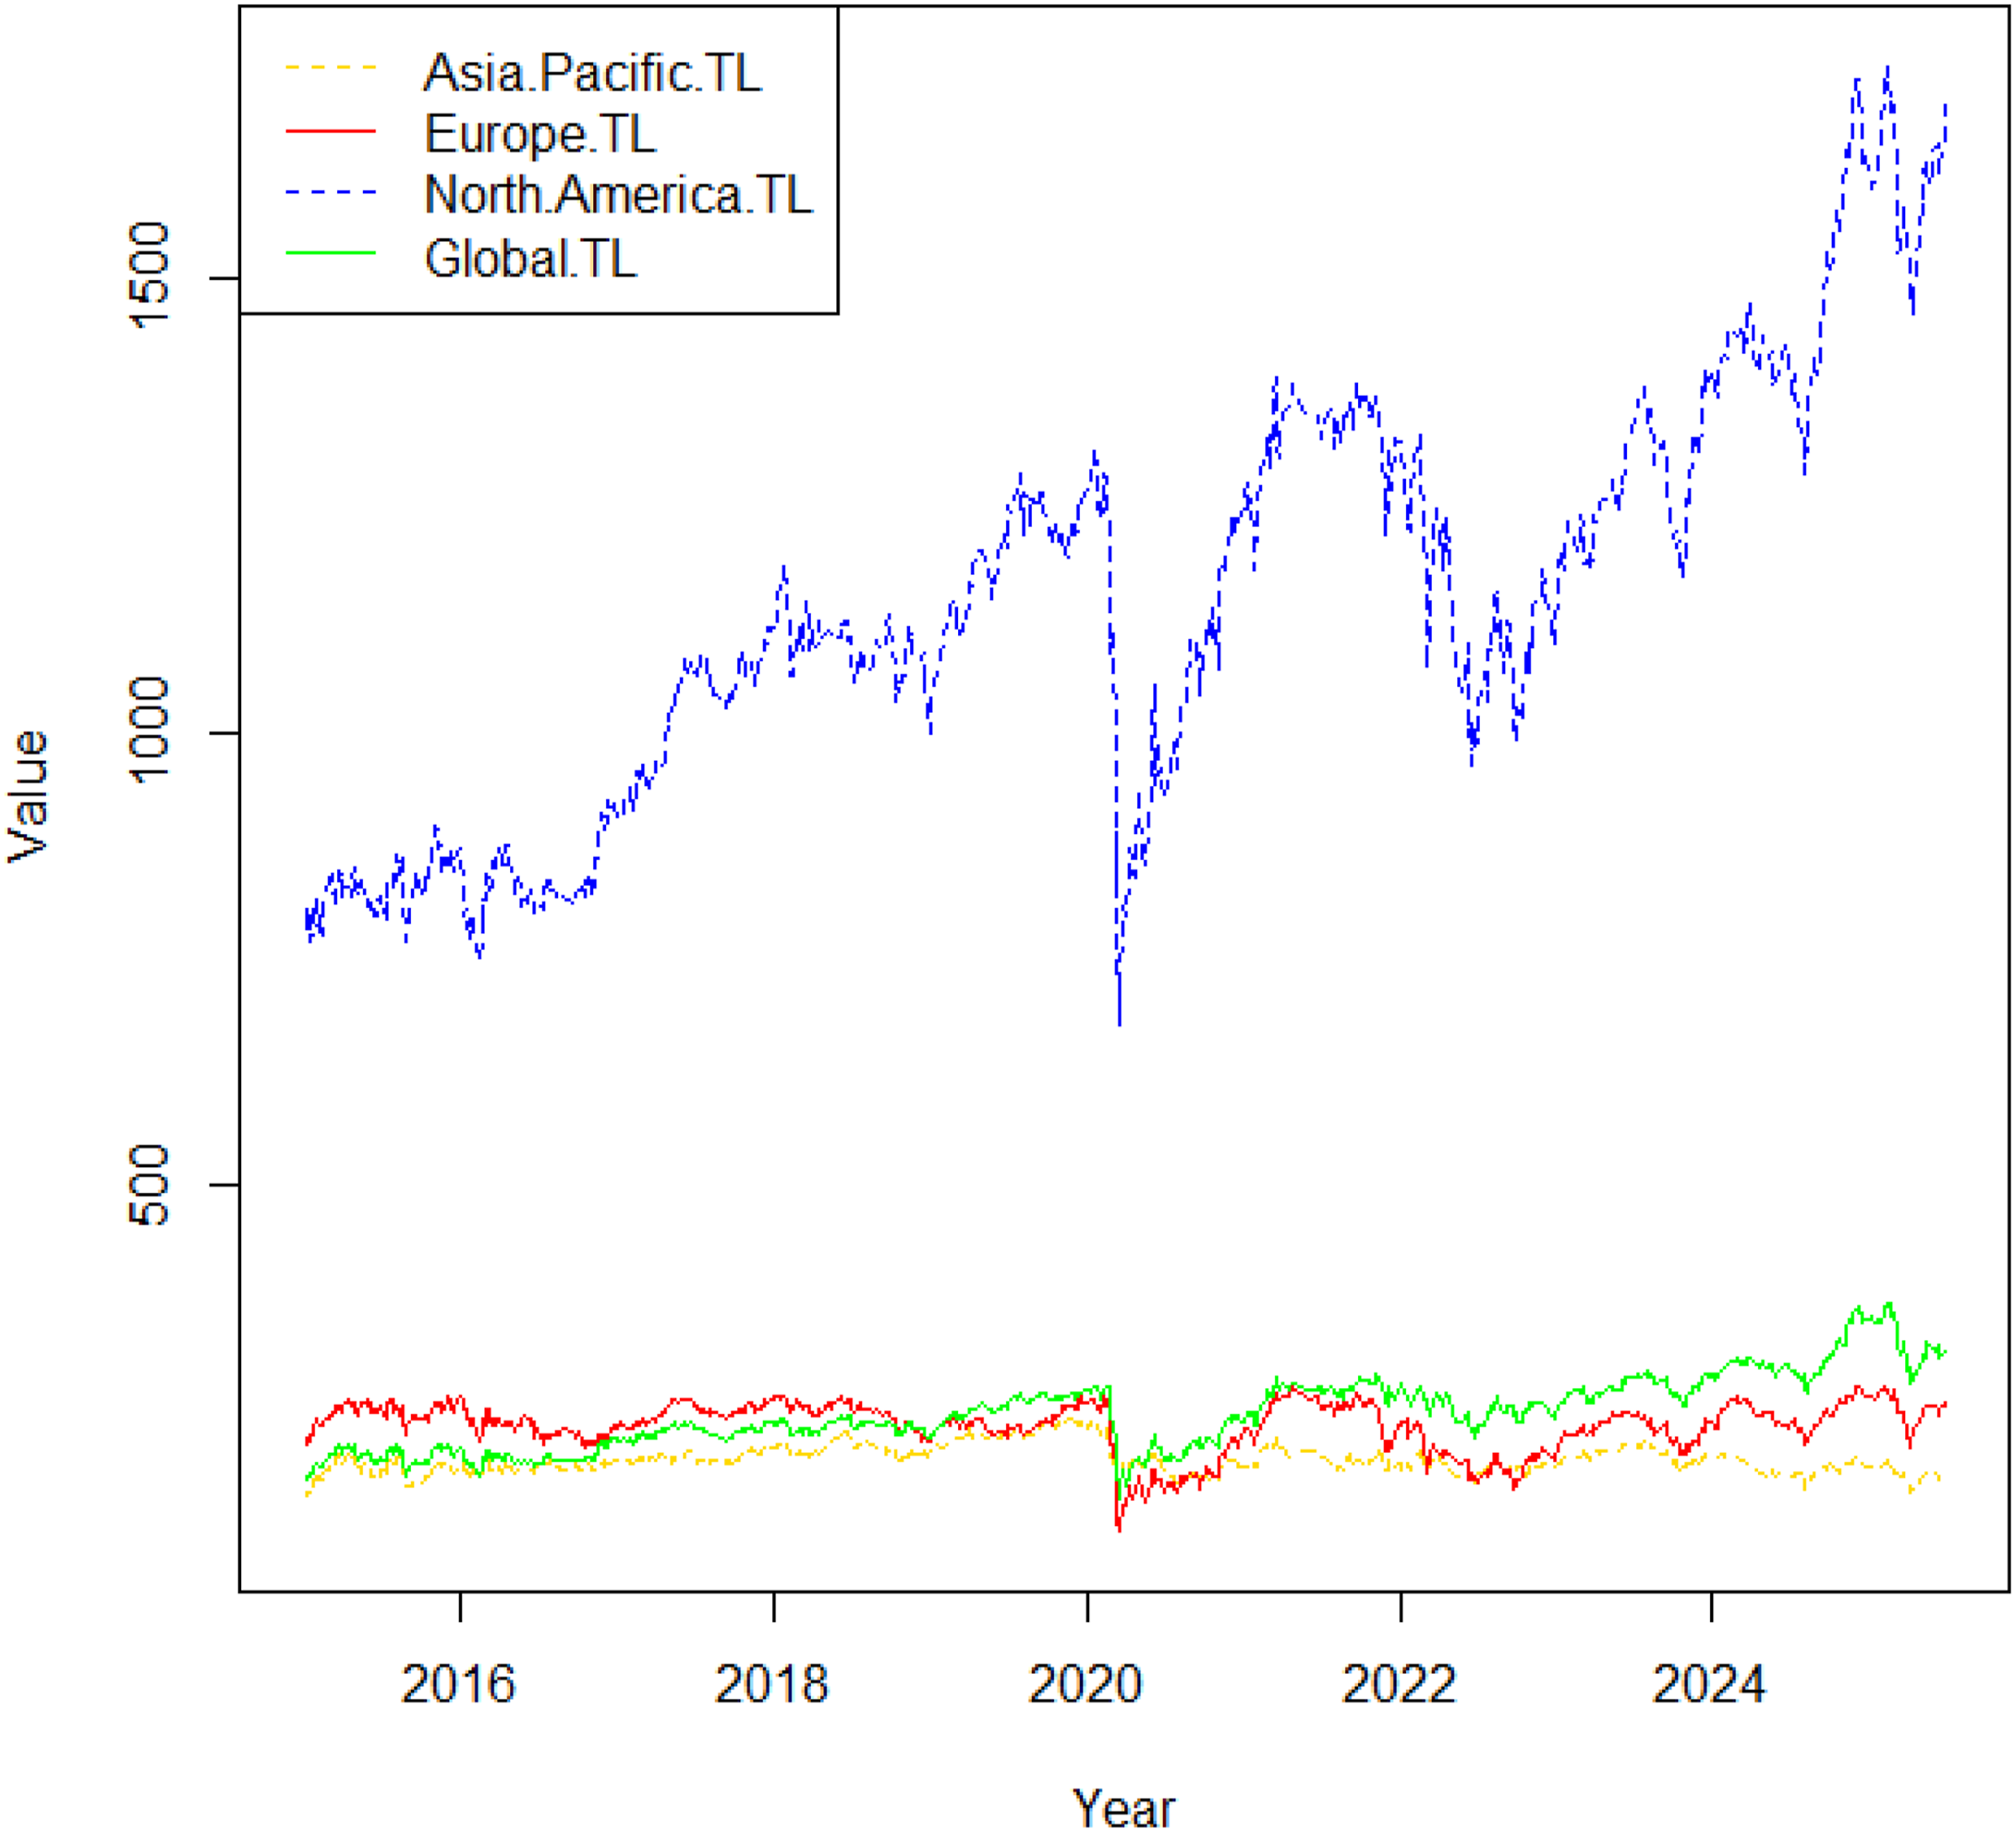
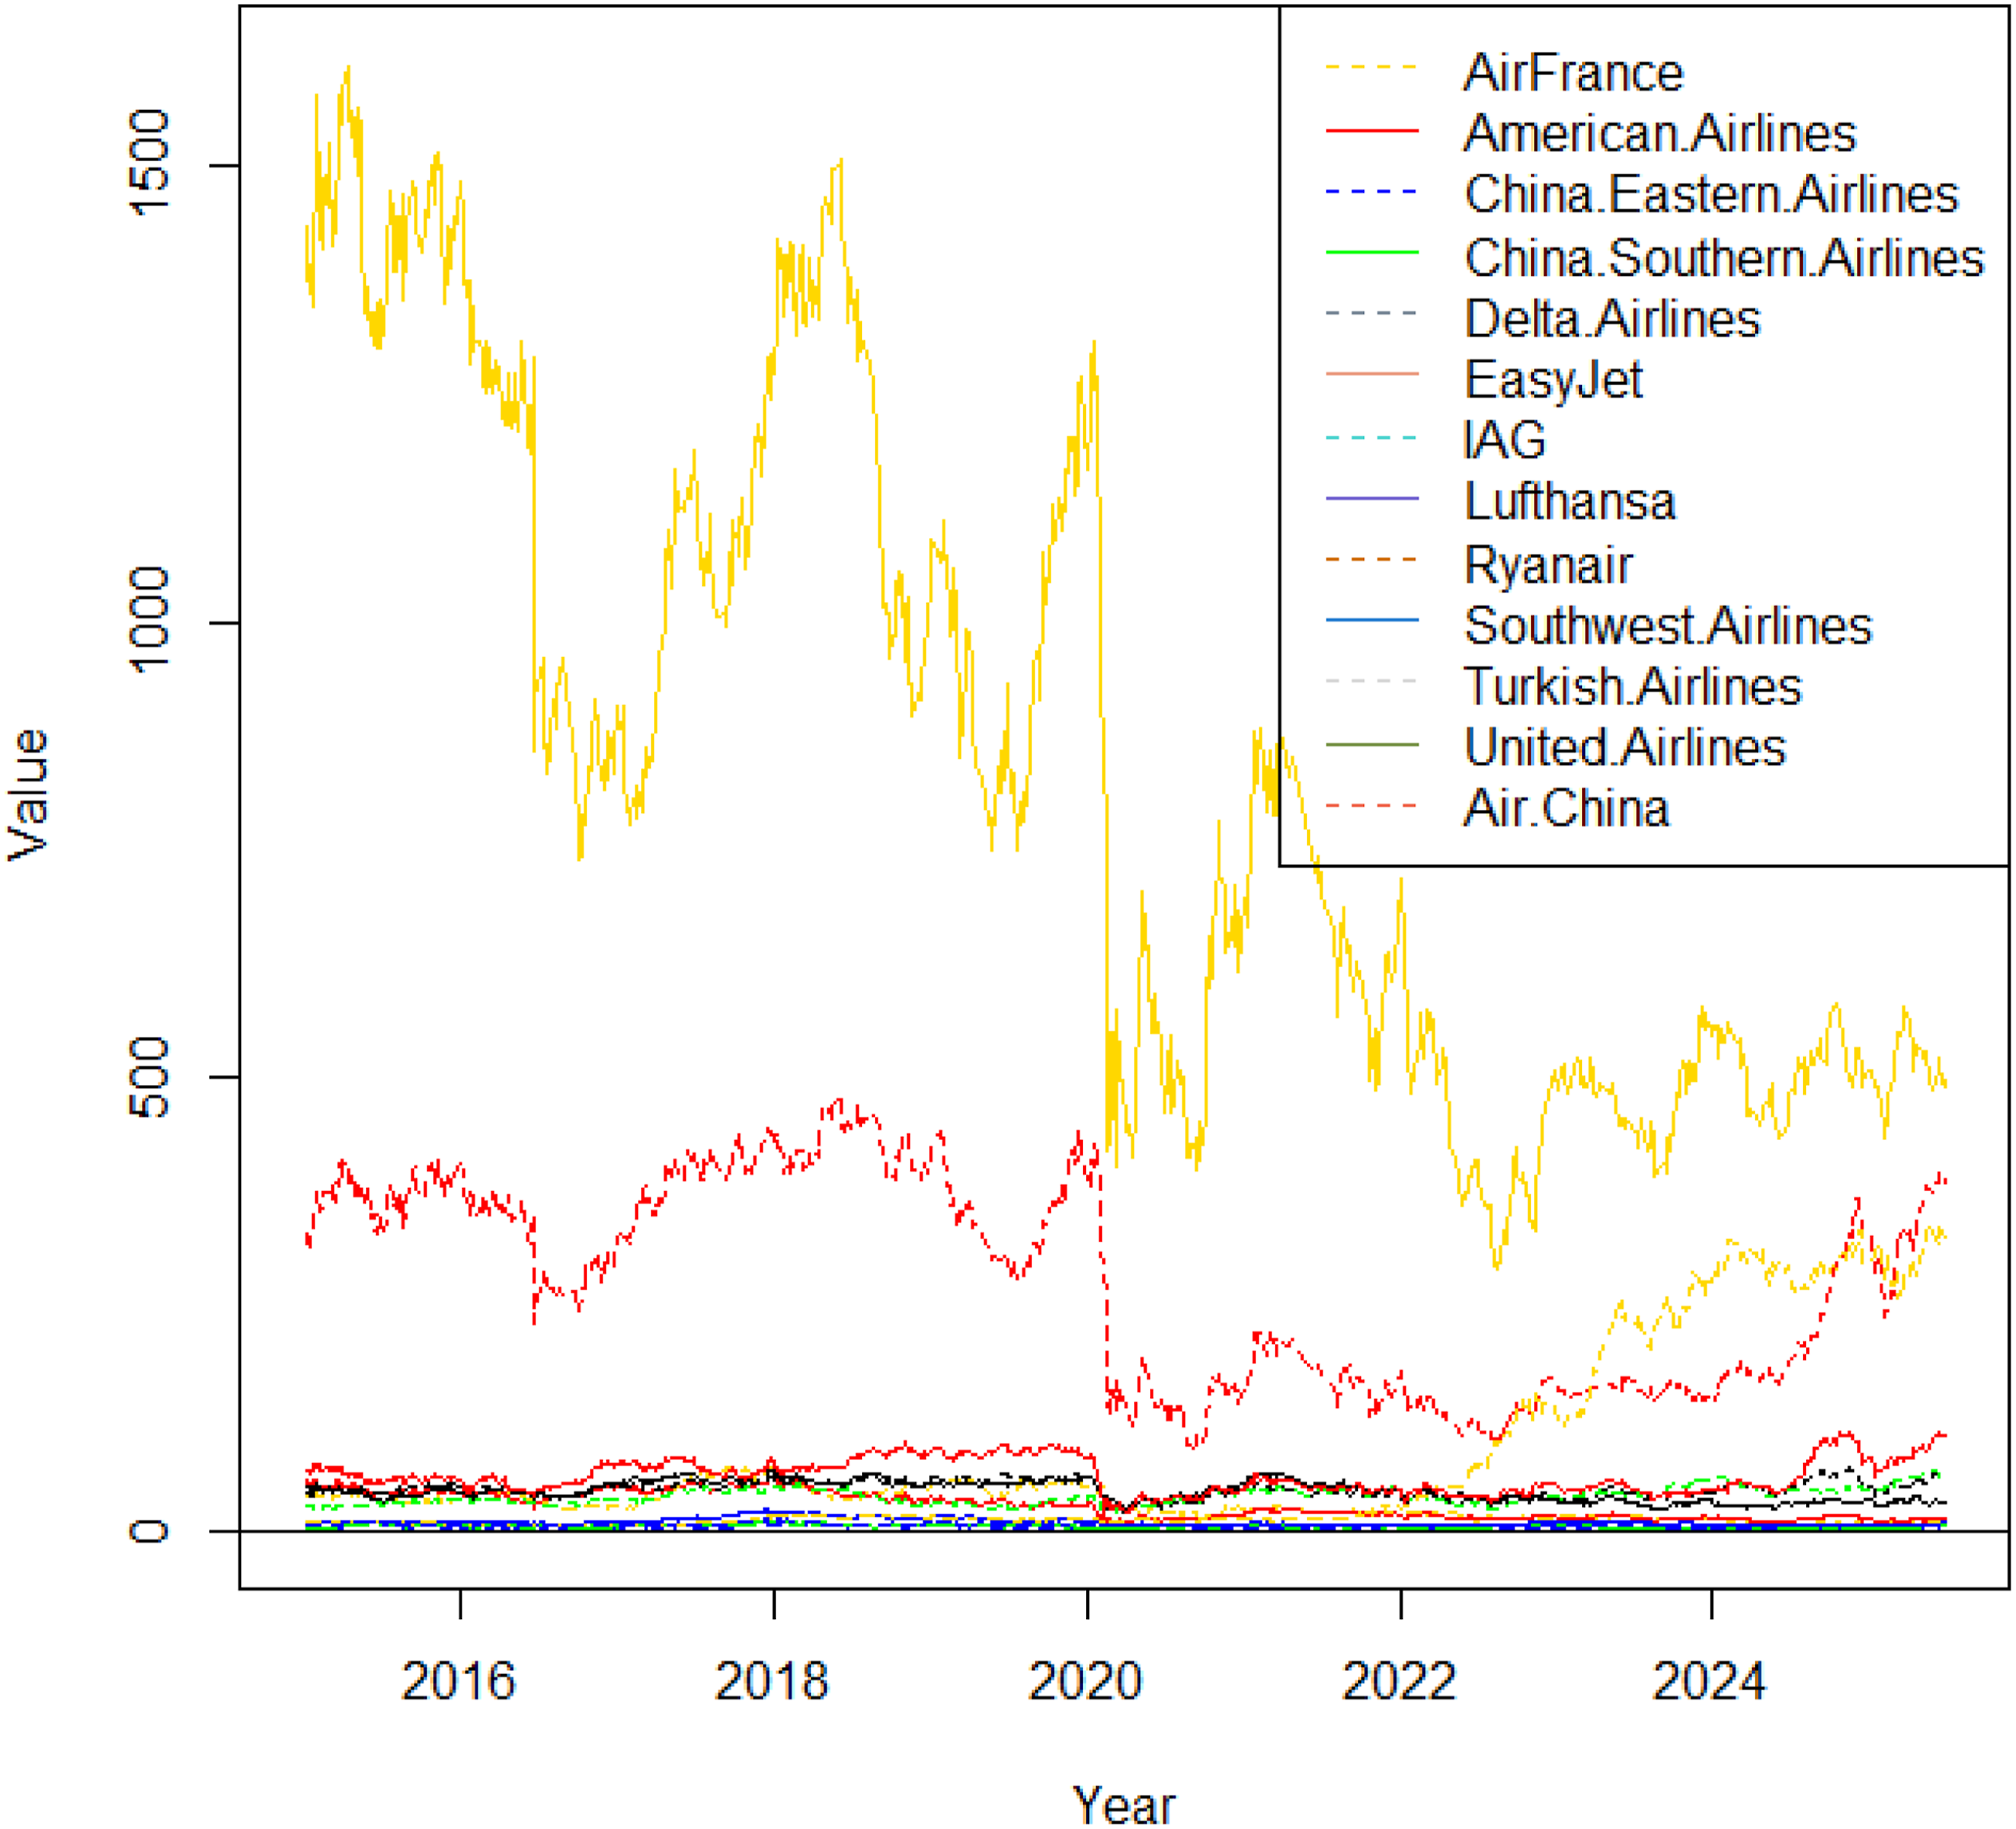
While the sector indices capture broad co-movements and common turning points, Figure 3 plots the raw closing price levels of the airline equities to provide a descriptive view of common shocks and heterogeneous recovery patterns across carriers and regions. Airline equities exhibit pronounced co-movement during major stress episodes alongside substantial cross-sectional heterogeneity in longer-run trajectories. Because raw price levels are not directly comparable across firms due to differences in currencies, share denominations, and corporate actions, the figure is intended to illustrate turning points and broad co-movements rather than to rank airlines by nominal price levels.
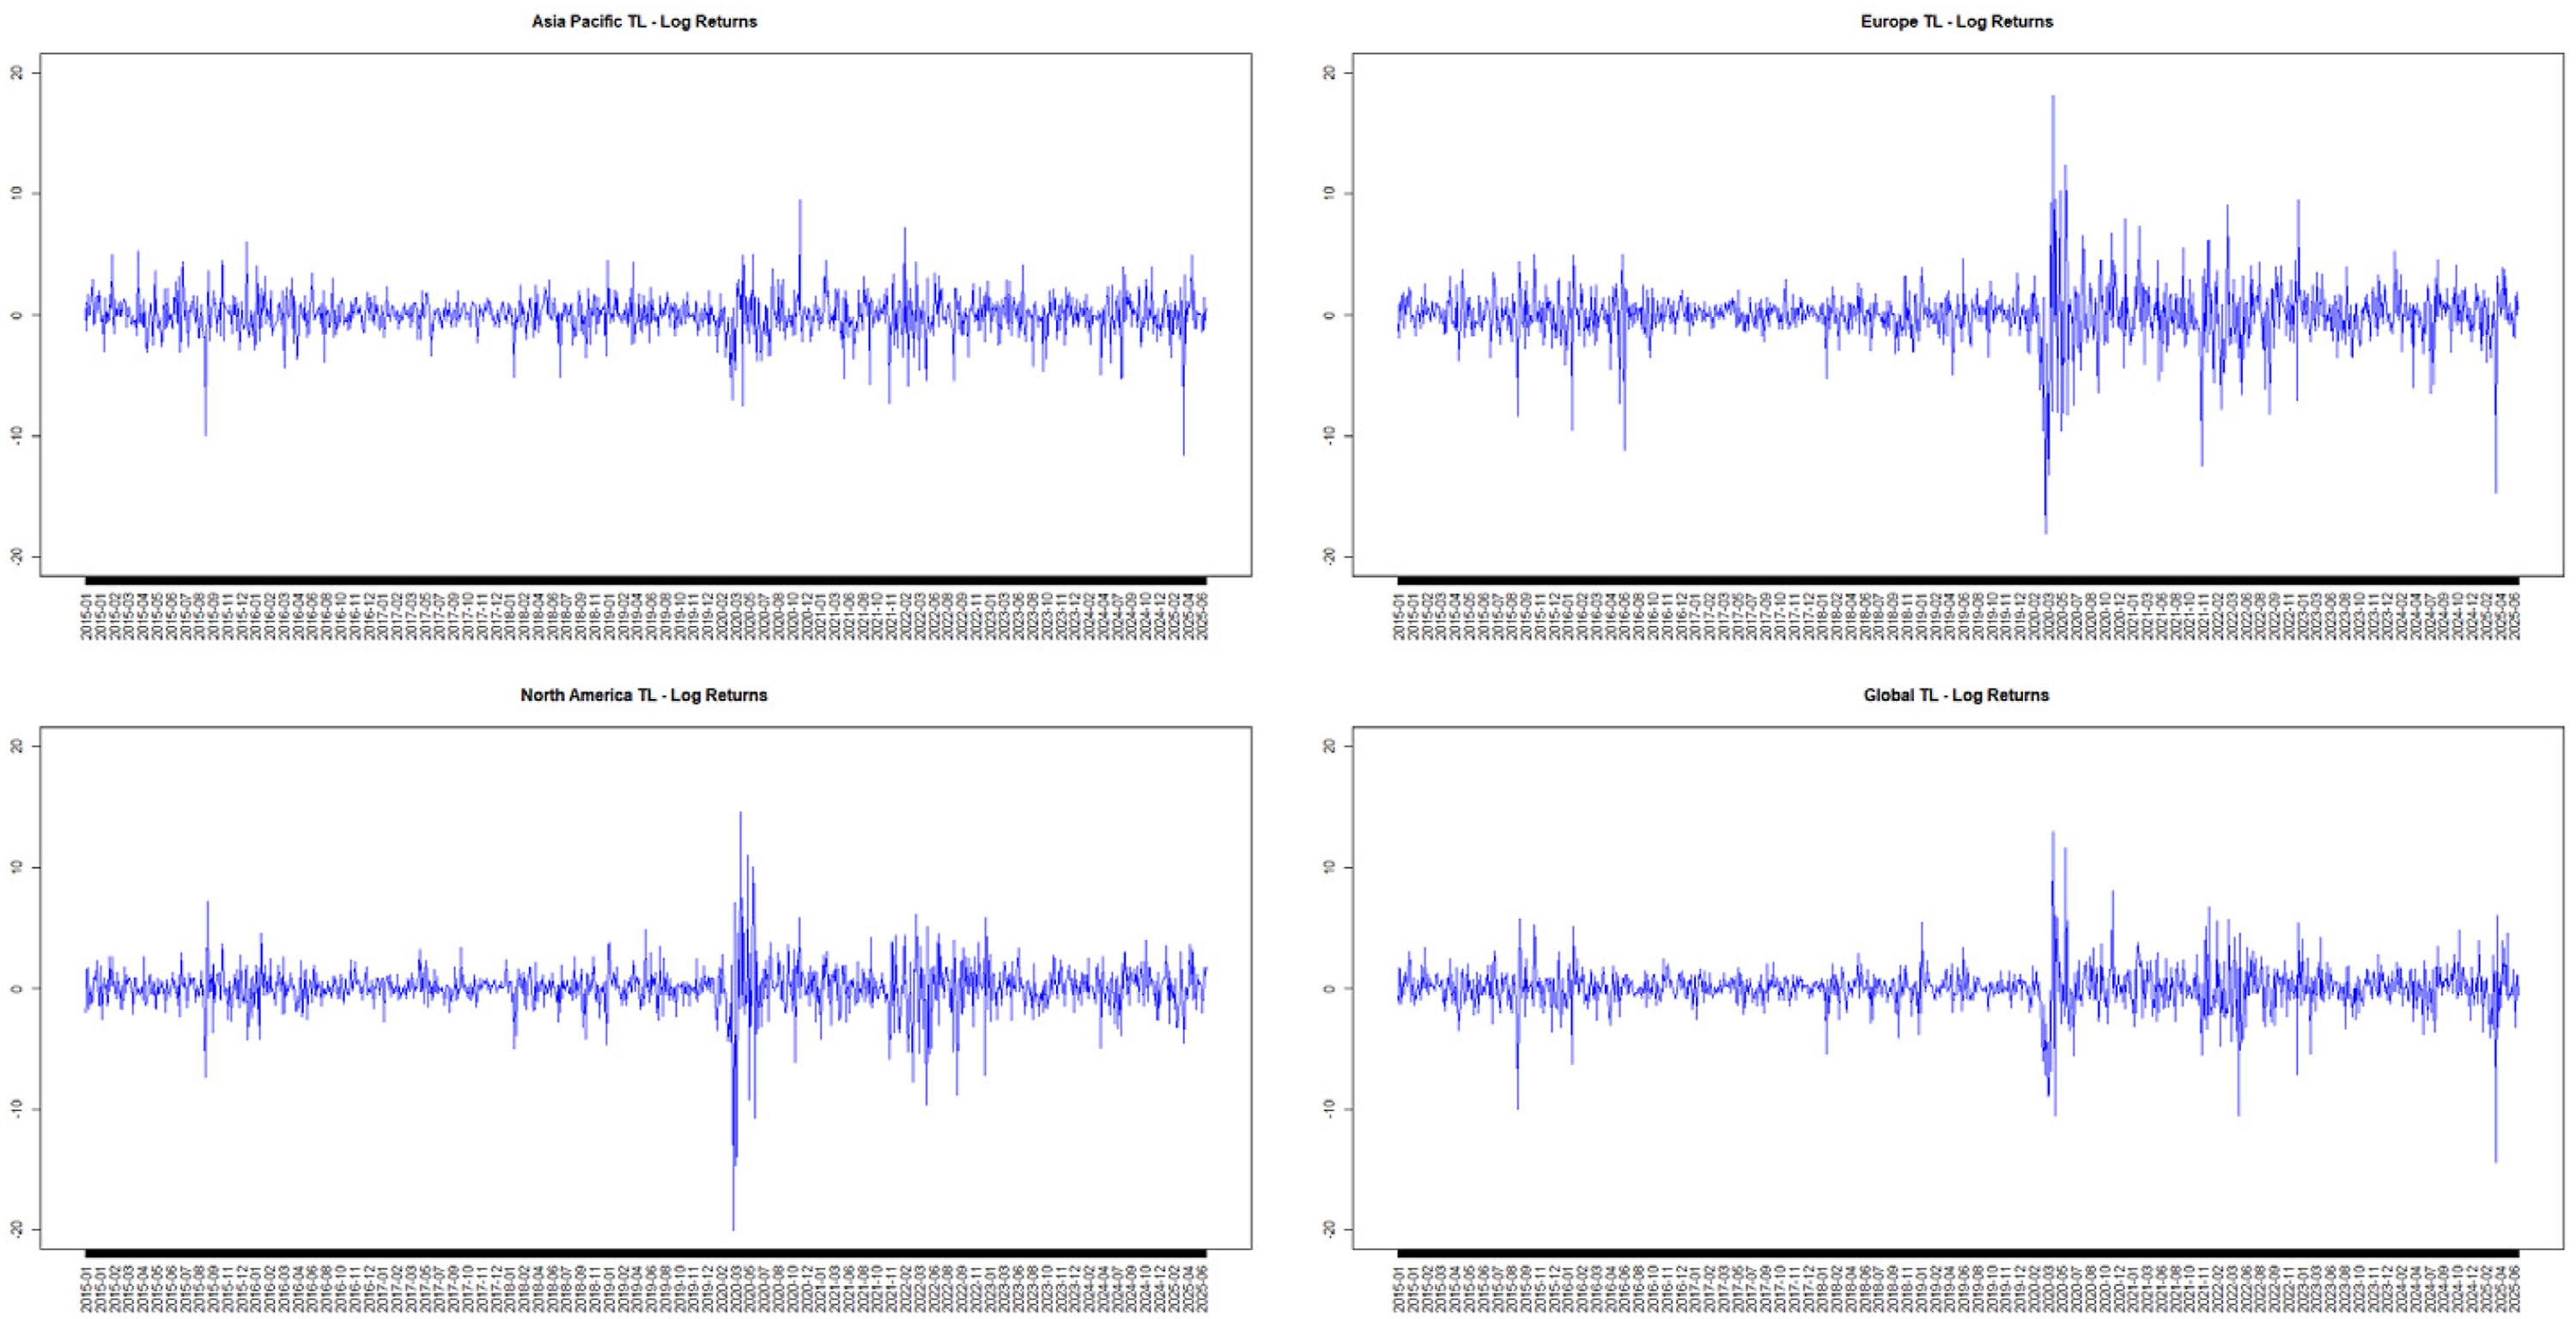
Because index and stock price levels are not directly comparable across regions and firms, the empirical analysis is conducted using daily log returns. Figure 4 plots the daily log returns of the four STOXX Travel and Leisure indices and highlights volatility clustering and extreme movements. Returns fluctuate around zero with pronounced time variation in volatility, indicating heavy tails and non-Gaussian features. These characteristics suggest that dependence may be asymmetric and concentrated in the tails, motivating methods that go beyond average correlation.
Τo assess whether sector-level tail events are mirrored in airline equities, Figure 5 plots daily log returns for each airline. Airline returns exhibit higher volatility and more frequent extreme observations than the sector indices, alongside notable heterogeneity across carriers. Taken together, the descriptive evidence from Figures 2–5 indicates that dependence is likely to be state-dependent and concentrated in the tails, motivating the use of the cross quantilogram framework of Han et al. (2016) to examine directional predictability across quantiles.
Descriptive statistics for daily log returns.
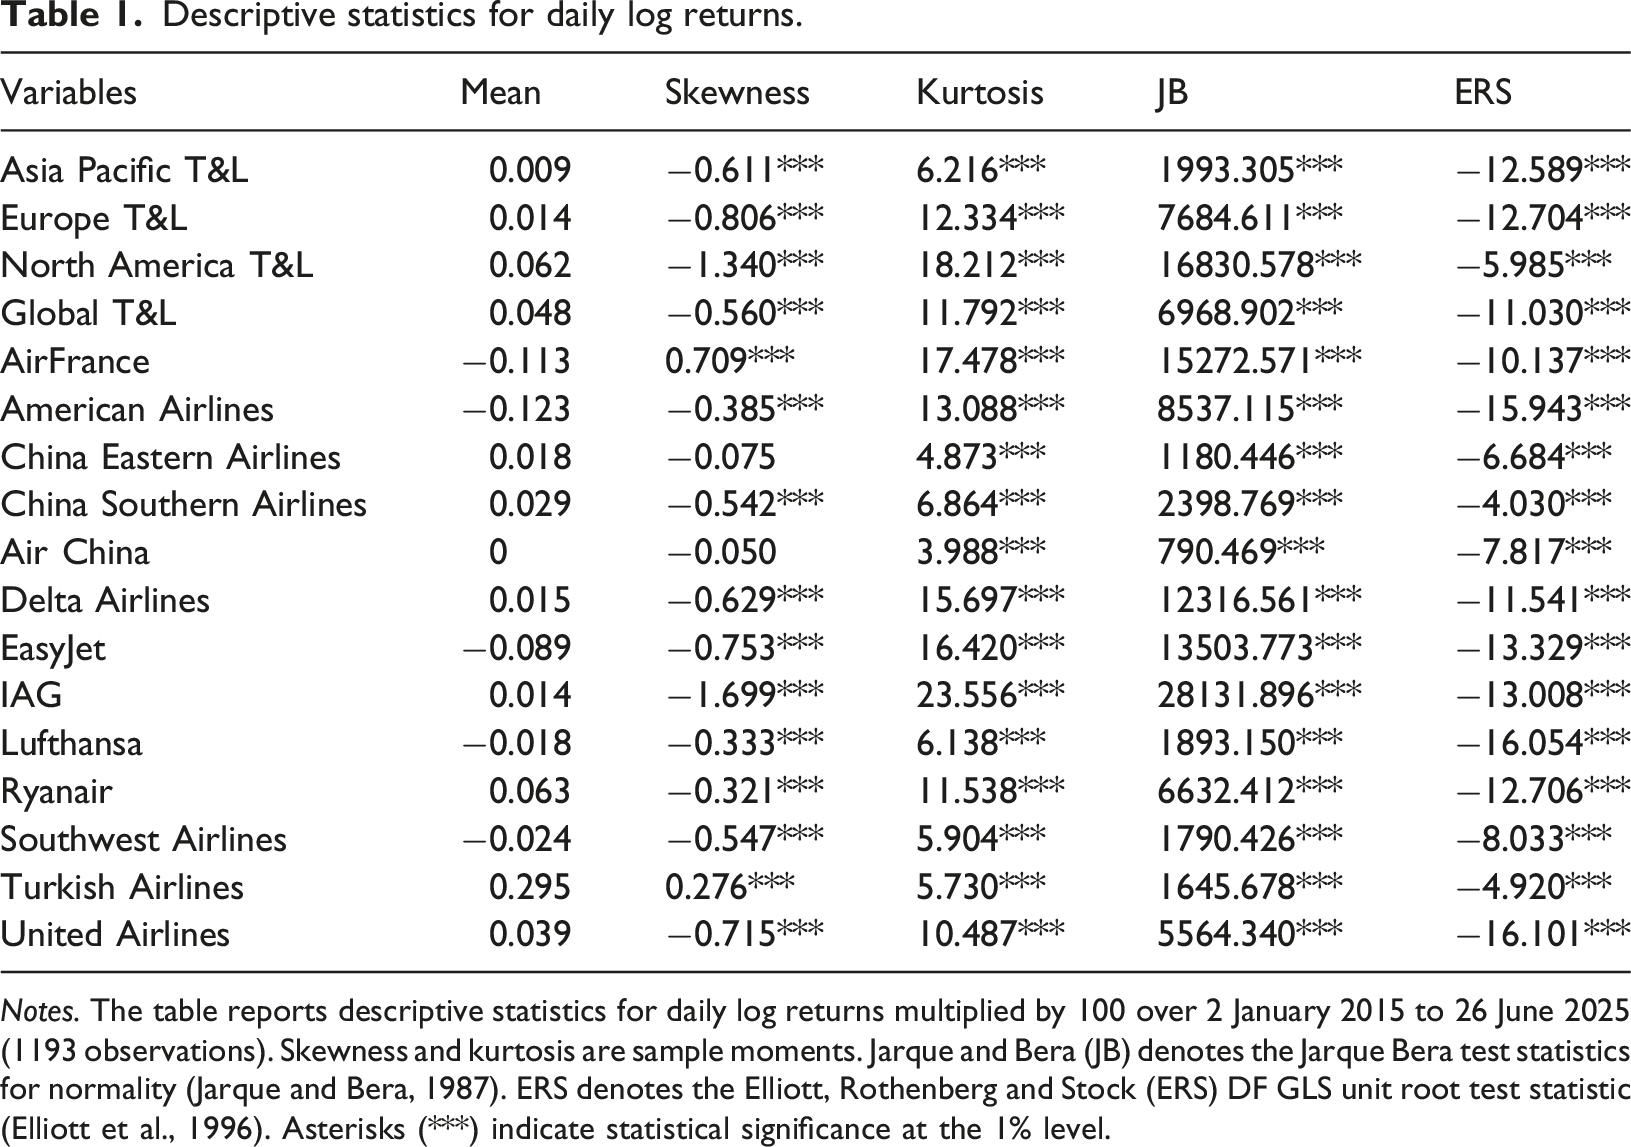
Notes. The table reports descriptive statistics for daily log returns multiplied by 100 over 2 January 2015 to 26 June 2025 (1193 observations). Skewness and kurtosis are sample moments. Jarque and Bera (JB) denotes the Jarque Bera test statistics for normality (Jarque and Bera, 1987). ERS denotes the Elliott, Rothenberg and Stock (ERS) DF GLS unit root test statistic (Elliott et al., 1996). Asterisks (***) indicate statistical significance at the 1% level.
From a methodological perspective, this study investigates asymmetric and directional dependence between Travel and Leisure sector conditions and airline equity returns using the cross quantilogram framework of Han et al. (2016). The main appeal of the cross-quantilogram is that it measures dependence at specific parts of the joint distribution, allowing transmission mechanisms to differ across downside conditions (stress), typical conditions (median), and upside conditions (booms). Conventional approaches such as VAR and DCC-GARCH (Engle, 2002; Engle and Sheppard, 2001) are useful for examining dynamic interdependence, volatility transmission, and time-varying conditional correlations among financial variables, but they remain focused mainly on mean-based or second-moment dependence and may therefore overlook patterns that arise only under extreme market conditions. Copula models (Patton, 2006) are better suited to capturing nonlinear and tail dependence, yet they typically emphasize the joint dependence structure rather than lagged directional predictability across horizons. Quantile VAR models (Koenker and Xiao, 2006) extend analysis beyond the mean and allow dependence to differ across quantiles, but they do not directly provide the full quantile-to-quantile dependence surface that is central to our research question. By contrast, the cross-quantilogram (Han et al., 2016) directly measures directional dependence between specific quantiles of two series over different lags. This makes it especially suitable for identifying tail dependence, asymmetry, and feedback effects between airline returns and Travel and Leisure sector conditions that may remain hidden in conventional mean-based frameworks. This is particularly relevant for financial returns, which are commonly non-Gaussian and may exhibit state-dependent spillovers that are not captured by mean-based or correlation-based measures.
Quantiles are estimated as conditional quantiles via quantile regression following Han et al. (2016). Let 

We interpret
Let
Inference follows Han et al. (2016) and is implemented using a dependence-robust bootstrap with 1000 replications to account for serial dependence and time-varying volatility
1
. Finally, we complement the static heatmaps with recursive (expanding-window) cross-quantilograms using an initial window of 240 trading days and representative quantiles
Empirical results
Building on the methodological framework outlined above, this section reports the empirical findings from the cross-quantilogram analysis and compares dependence patterns across regions, directions, and horizons. We begin with static heatmaps that summarize quantile-to-quantile dependence across horizons k∈{1,5,22,66}, focusing primarily on the direction from Travel and Leisure sector indices to airline equities. We then examine the reverse direction to assess potential feedback effects and information leadership. In each heatmap, rows correspond to quantiles of the response series and columns correspond to quantiles of the predictor series. Cells on the lower-tail diagonal (e.g.,
Figure 6 reports cross quantilogram heatmaps for the STOXX Asia Pacific Travel and Leisure index and three Chinese airlines, Air China, China Eastern Airlines, and China Southern Airlines, across four horizons (k = 1, 5, 22, 66) and in both directions. A common feature across panels is strong condition dependence. Dependence is not evenly distributed across the joint distribution but concentrates mainly in the central and upper quantiles, while lower tail co movements (for example 0.05 to 0.05) are generally weaker. This indicates that connectedness for these pairs is driven primarily by normal to good market conditions rather than by systematic joint downside extremes. Cross quantilogram results for the Asia Pacific Travel and Leisure index and Asian airlines.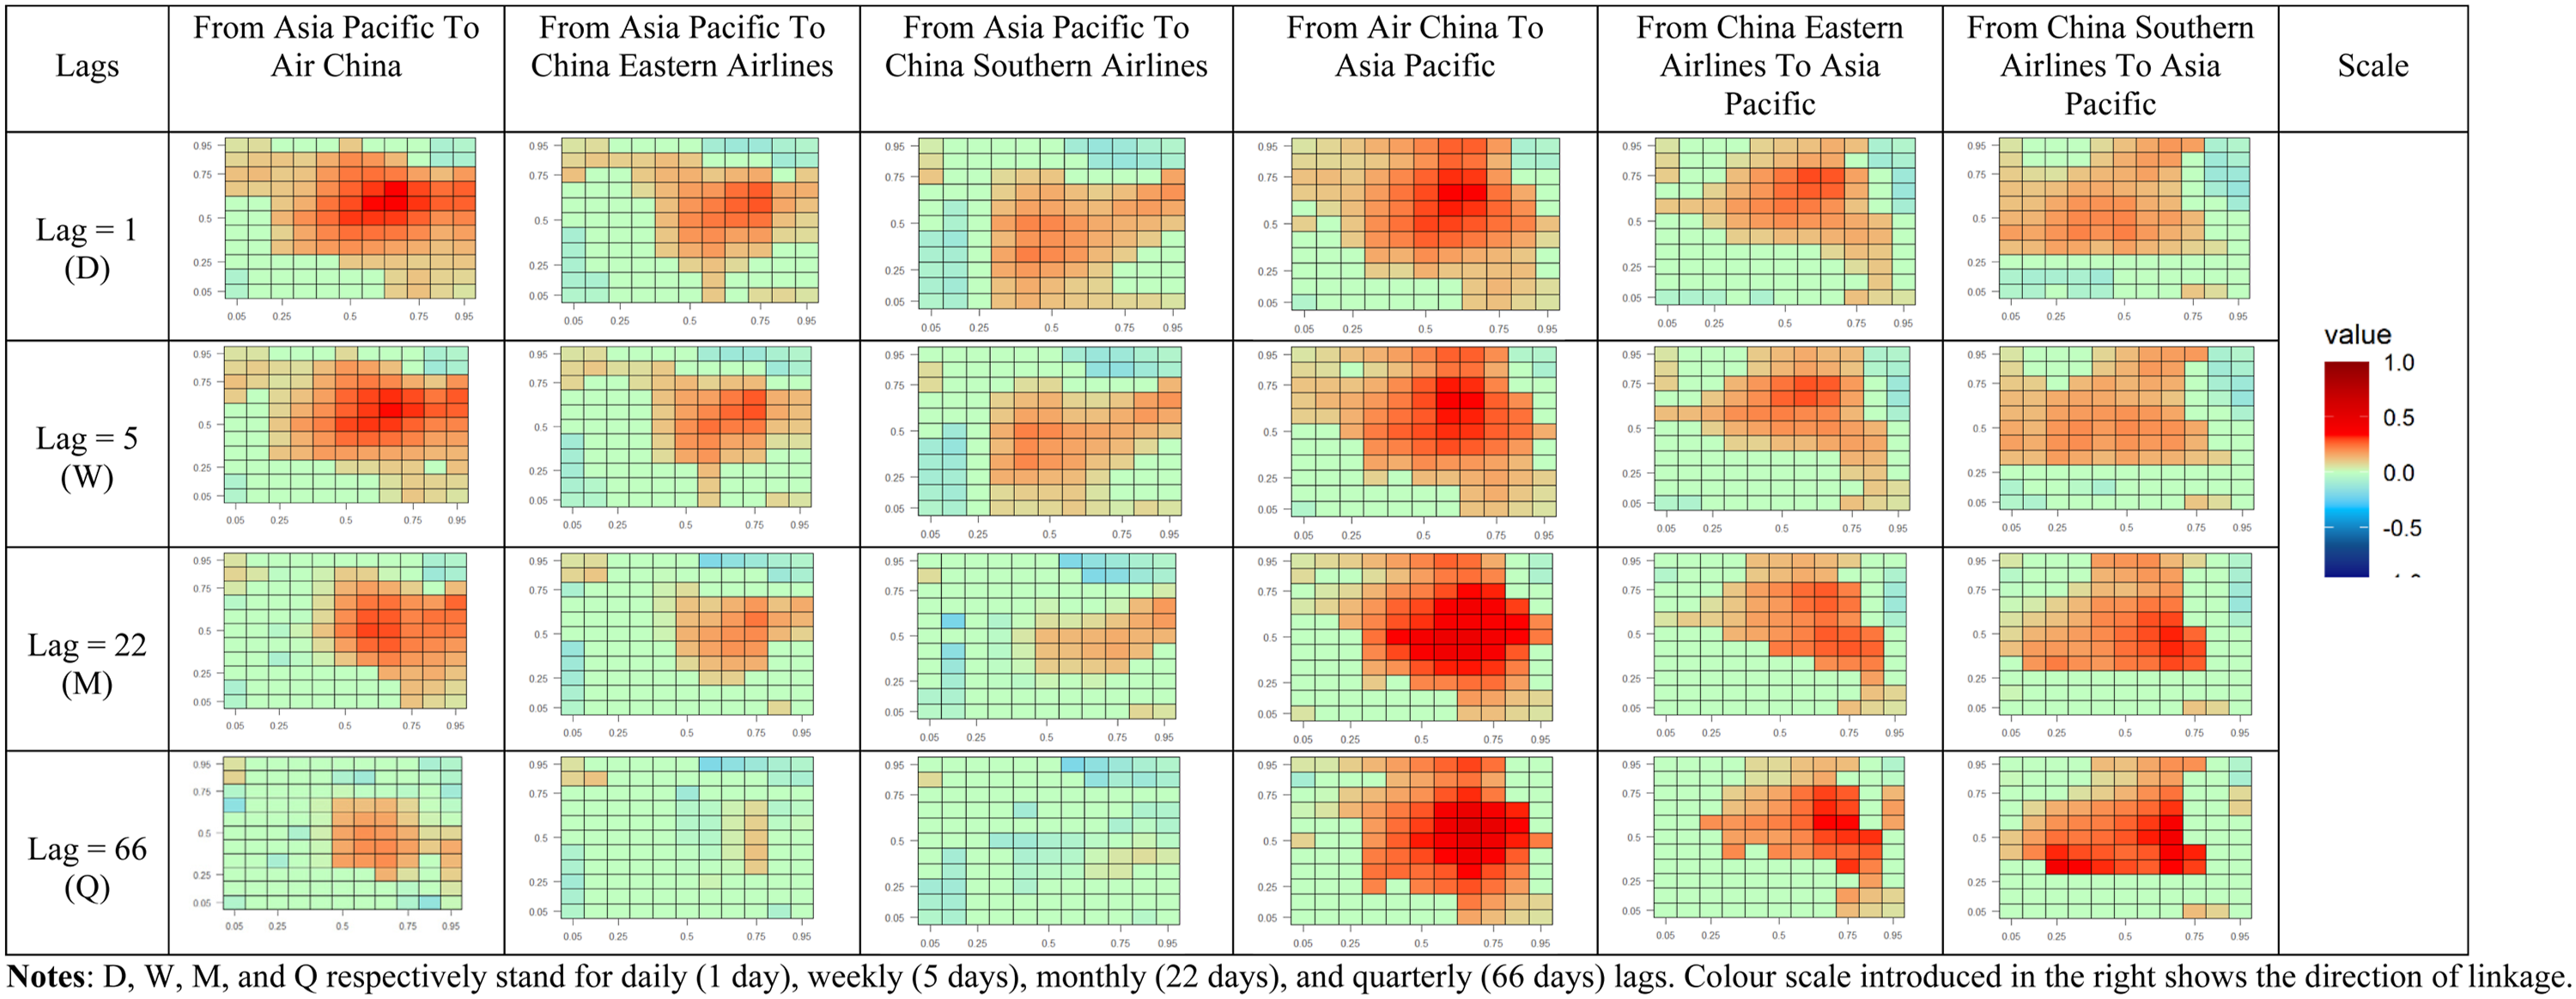
For Air China, the direction from the Asia Pacific Travel and Leisure index to the airline shows a clear concentration of positive dependence at k = 1 in the middle and upper quantiles of both the predictor and the response. This suggests that when the sector index realizes median to upper quantile outcomes, Air China is more likely to move into comparable quantile conditions on the next trading day. The corresponding lower tail region is relatively weak, implying limited evidence of strong next day downside comovement in the extreme tail. As the horizon increases, the dependence becomes more selective and weaker. At k = 5, the mid to upper quantile signal remains visible but less diffuse. At k = 22, positive dependence is concentrated more toward upper predictor quantiles. At k = 66, the positive region is smaller and less intense, consistent with short to medium run transmission from the index to the airline.
The reverse direction from Air China to the Asia Pacific index is at least as strong at short horizons and appears more persistent at longer horizons. At k = 1 and k = 5, dependence again concentrates in the central and upper quantiles, indicating that airline return states contain information about subsequent sector index quantile outcomes in typical to good conditions. At k = 22 and k = 66, a broader positive region remains visible across median to upper quantiles, suggesting more persistent directional predictability from airline returns to the sector index. This pattern is consistent with information leadership by airlines within the regional travel equity space, although it may also reflect shared fundamentals and gradual diffusion of sector wide information rather than a causal mechanism.
China Eastern Airlines exhibits a similar but somewhat sharper pattern. From the index to the airline, positive dependence is most visible at short horizons and concentrated in mid to upper quantiles, while the signal weakens markedly at k = 66. In the reverse direction, dependence is stronger and more durable across a wider quantile range, indicating that China Eastern returns contain leading information for subsequent sector index outcomes over short and medium horizons.
China Southern Airlines shows weaker and less persistent dependence from the index to the airline, concentrated mainly around the middle quantiles at k = 1 and k = 5 and fading at longer horizons. In contrast, the reverse direction is stronger and becomes more pronounced at longer horizons, with a broad positive region spanning median to upper quantiles. Taken together, the evidence for all three airlines supports the inclusion of both directions in the empirical design, as directional asymmetries provide information about how shocks and information are incorporated across airline equities and the broader Travel and Leisure sector in the Asia Pacific region.
Figure 7 reports cross quantilogram heatmaps for the Europe Travel and Leisure index and European airlines, Air France KLM, EasyJet, IAG, Lufthansa, Ryanair, and Turkish Airlines, across four horizons (k = 1, 5, 22, 66) and in both directions. Relative to the Asia Pacific results, dependence within Europe appears more coherent and generally stronger, consistent with closer alignment between the regional sector benchmark and major European carriers. Across airlines, the most prominent regularity is that dependence is strongest at short horizons and weakens as the horizon increases, indicating that predictability is primarily short to medium run. Cross quantilogram results for the Europe Travel and Leisure index and European airlines.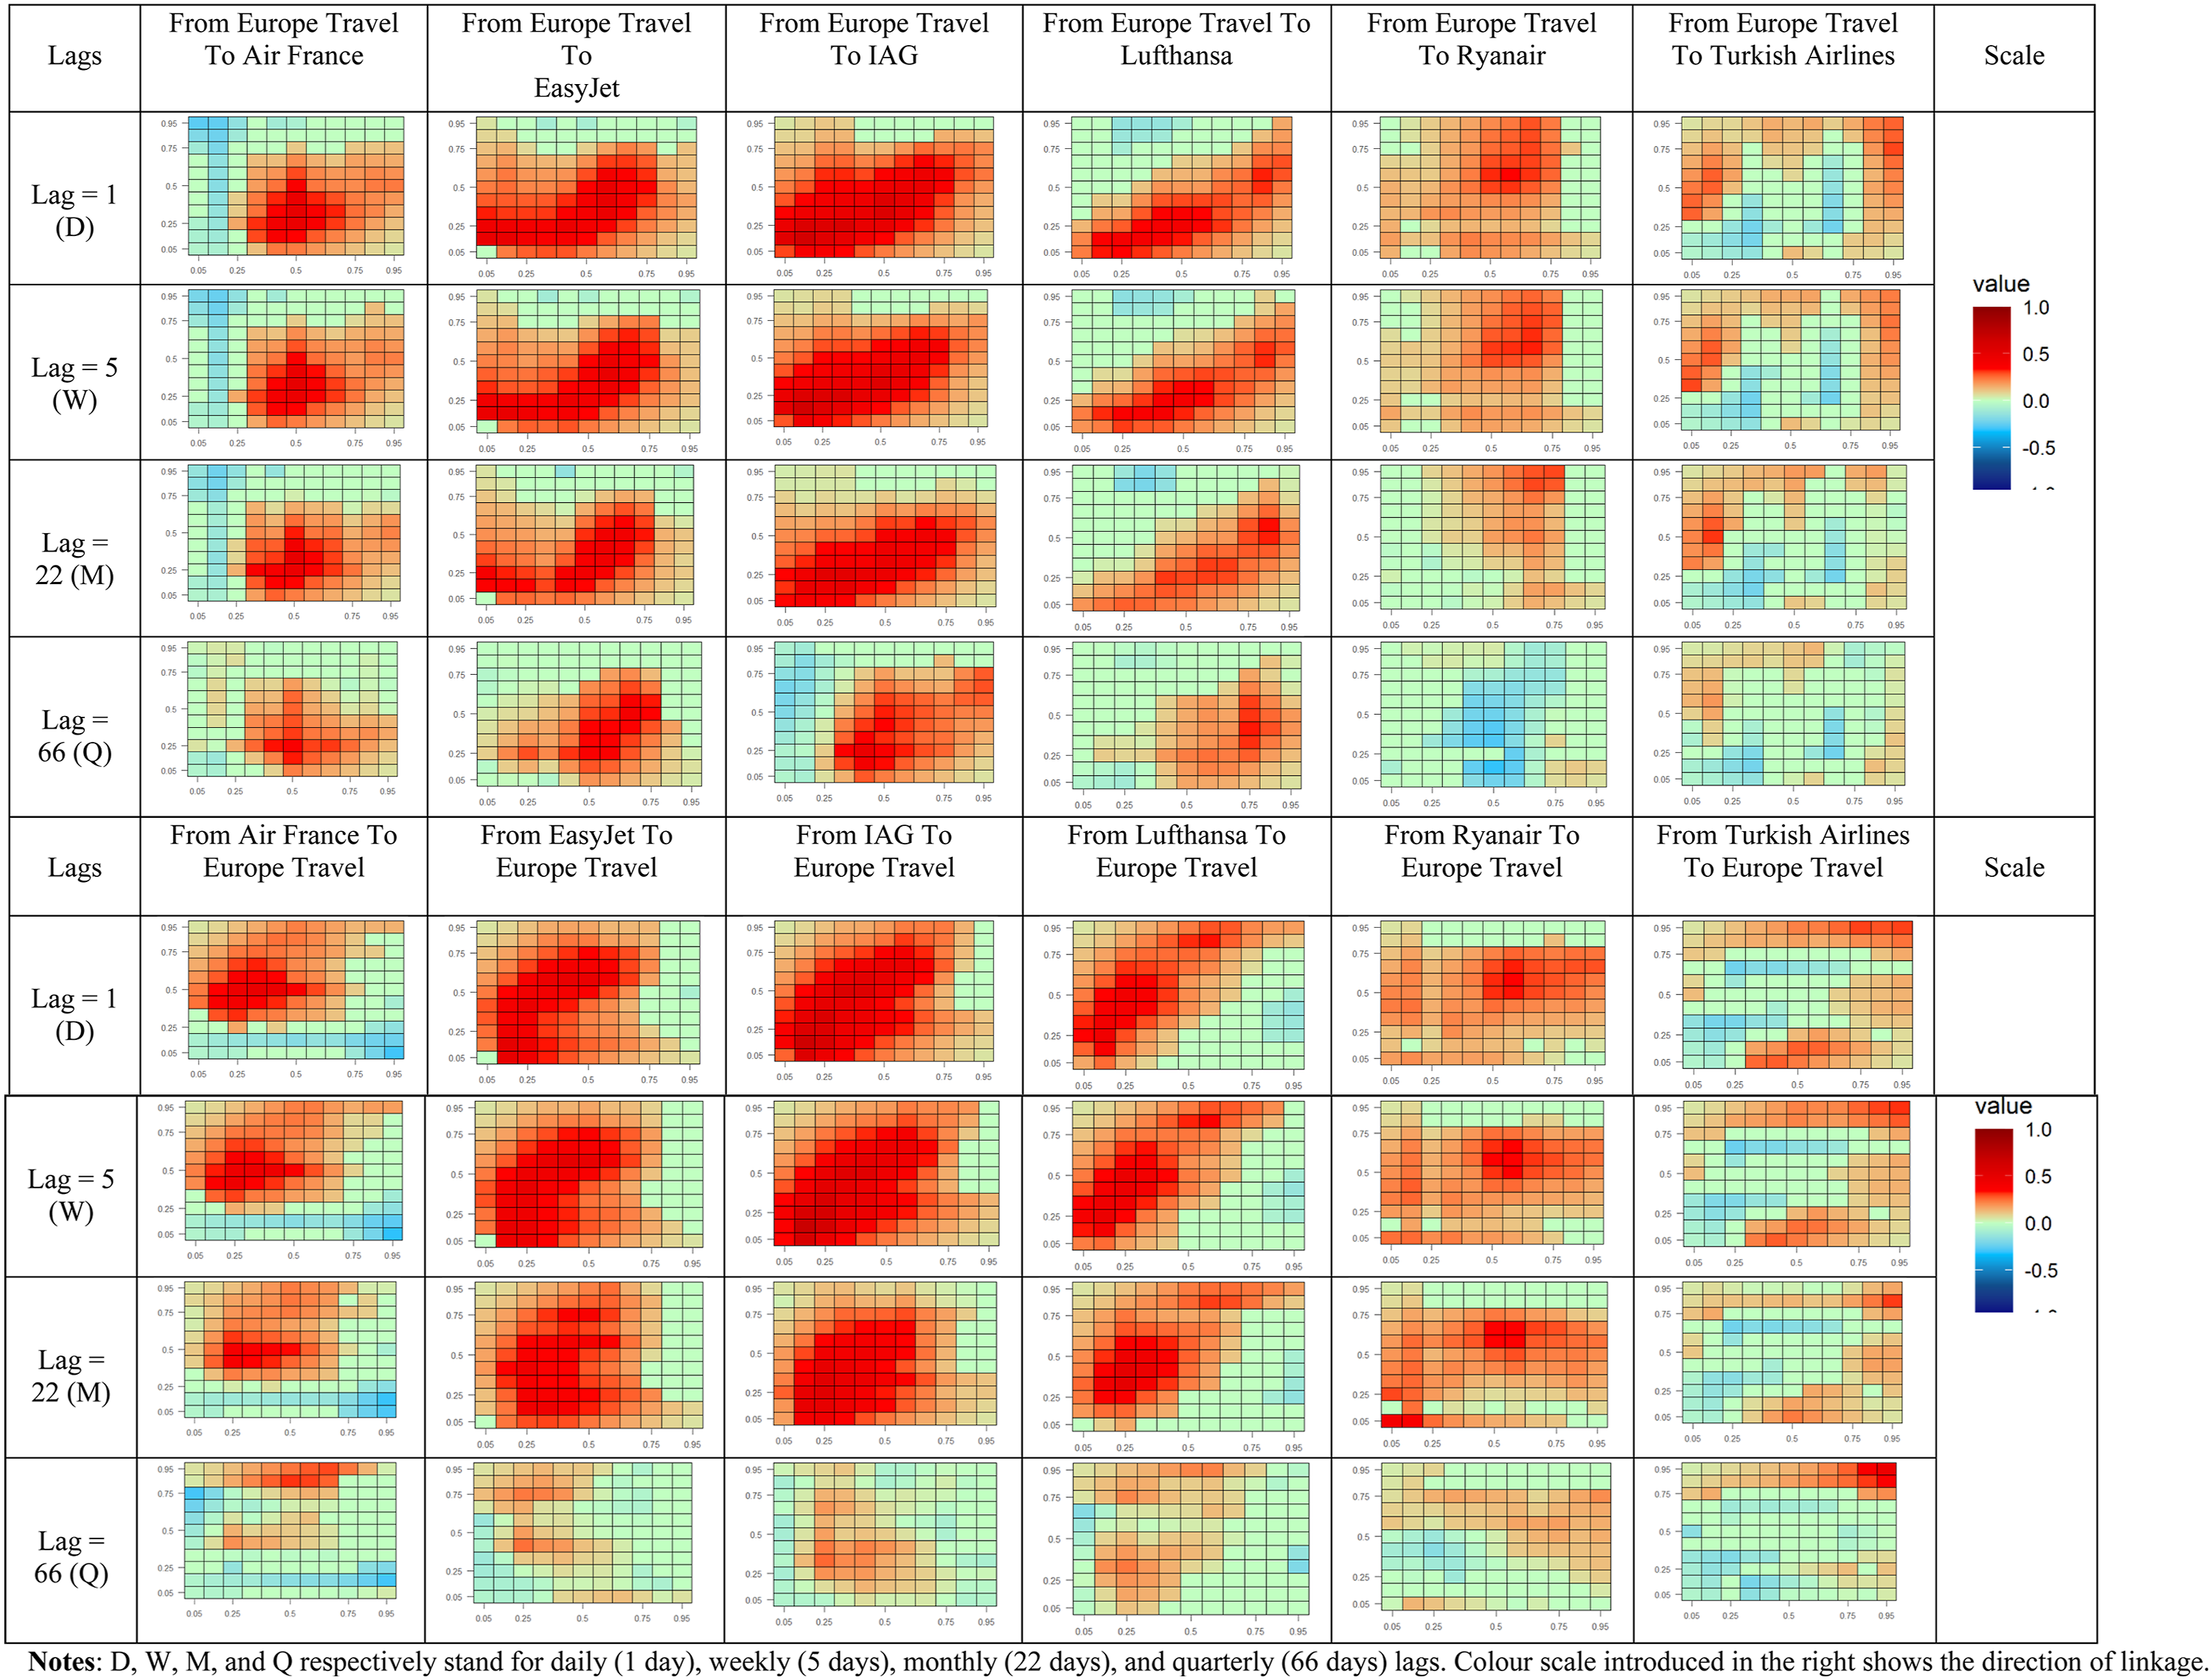
For Air France KLM, the direction from the Europe index to the airline shows broad positive dependence at k = 1 and k = 5, with the strongest signal concentrated in the central region of the quantile grid. This suggests that typical sector conditions are informative for near-term airline return states. The signal becomes less intense at k = 22 and is more limited by k = 66. In the reverse direction, the airline to index heatmaps also show positive dependence at short horizons, consistent with bidirectional predictability that can arise when both series incorporate common information with slightly different timing.
The easyJet and IAG panels display some of the most pervasive positive dependence in the European block. For both airlines, index to airline dependence is visible across a wide range of quantiles at k = 1, k = 5, and in several cases k = 22, implying that connectedness is not confined to extreme tail conditions. Reverse direction heatmaps remain positive at short horizons, while longer horizon panels become more muted, suggesting that feedback effects are concentrated in the short run.
Lufthansa exhibits a dependence structure that is more clearly aligned along matched market conditions. Positive dependence is particularly visible along regions corresponding to similar downside states and similar upside conditions, indicating that unfavorable sector conditions tend to coincide with unfavorable airline outcomes, and favorable sector conditions tend to coincide with favorable airline outcomes, especially at short horizons. While the strength declines with horizon, the overall pattern remains visible in both directions, supporting the presence of state dependent connectedness within the European travel equity space.
Ryanair shows meaningful dependence at short horizons, but the pattern is less uniform and becomes more selective as the horizon increases. Positive dependence is concentrated mainly in central to upper quantiles at k = 1 and k = 5, consistent with stronger linkage in normal and favorable conditions. On longer horizons the heatmaps weaken and become less stable, suggesting more limited persistence and greater scope for divergence from the benchmark sector across states.
Turkish Airlines stands out as the most nonlinear case within this block. Both directions display mixed warm and cool regions, indicating that the sign and strength of dependence vary across quantile pairs. This reinforces the value of quantile-based methods in this context, since average correlation can mask offsetting patterns that differ across market states and horizons.
We next consider North America, where market structure and a USD denominated benchmark provide a useful comparison with Europe. Figure 8 reports cross quantilogram heatmaps for the North America Travel and Leisure index and four US airlines, American Airlines, Delta, Southwest, and United, across horizons k = 1, 5, 22, and 66 and in both directions. Relative to Europe, dependence is generally weaker and more heterogeneous, with many panels dominated by cooler colors, indicating weak or negative dependence across a wide range of quantile combinations. As in the other regions, dependence is typically strongest at short horizons and becomes more muted as the horizon increases. Cross quantilogram results for the North America Travel and Leisure index and US airlines.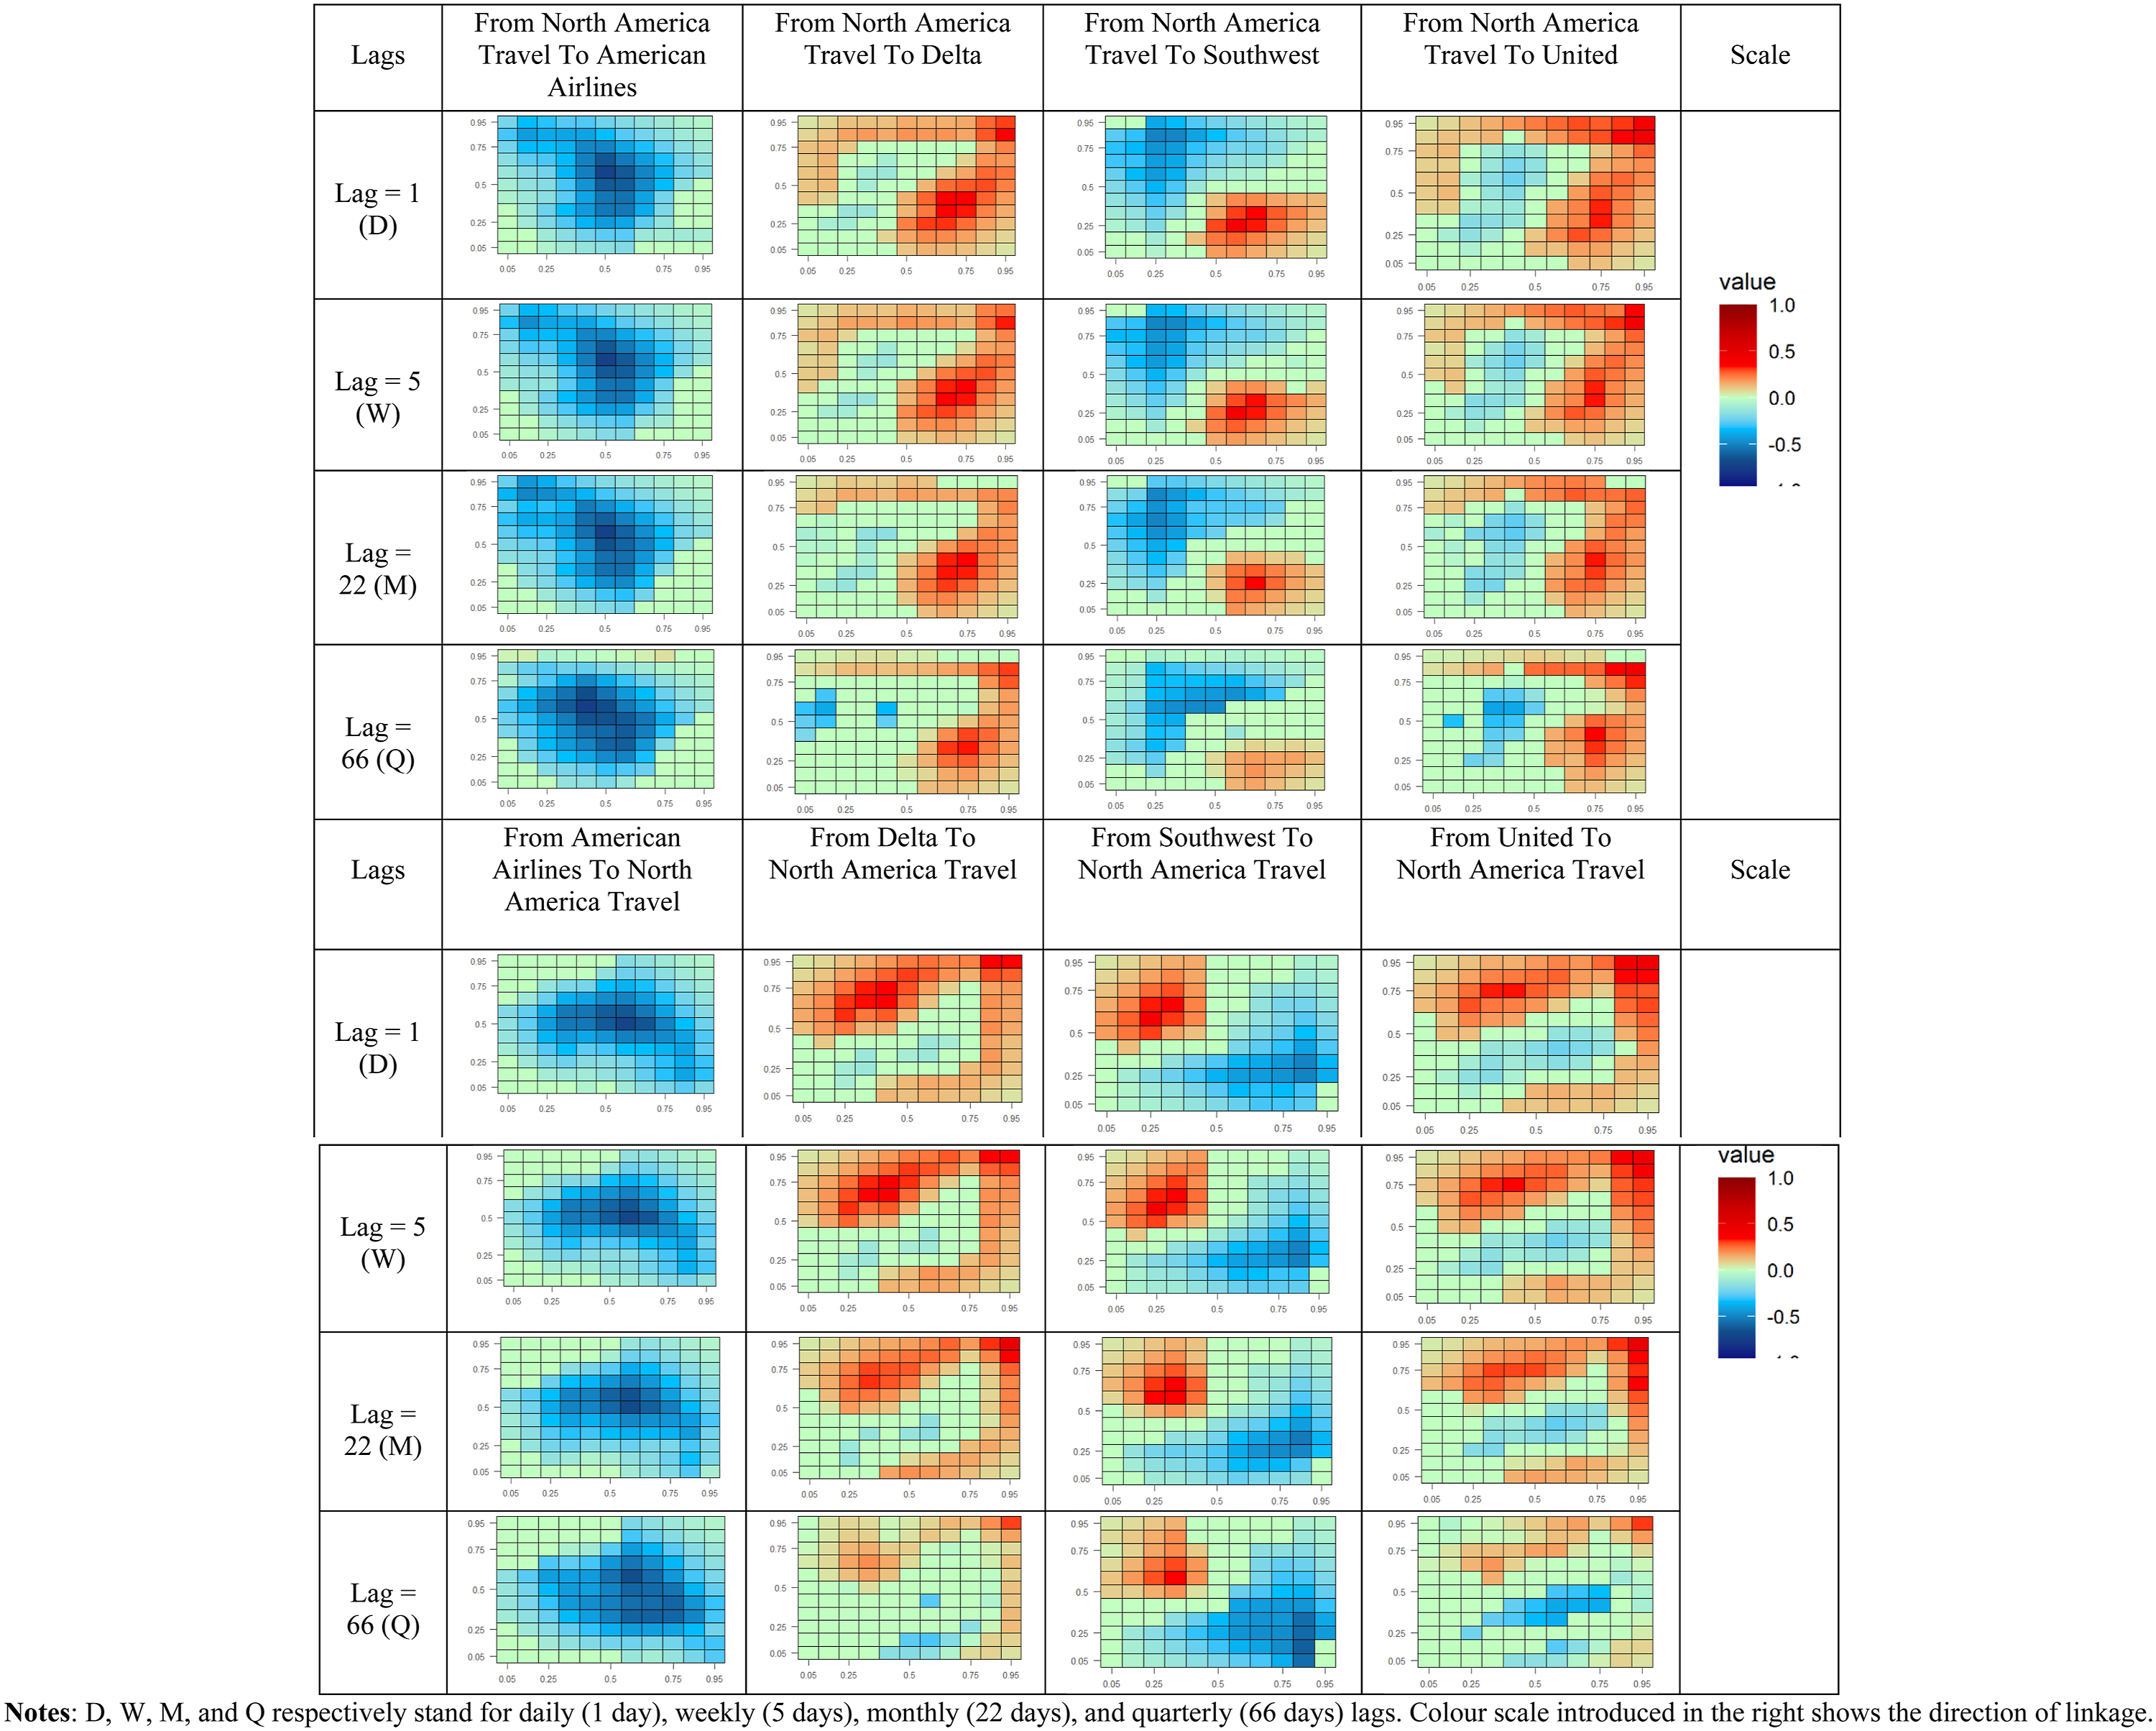
American Airlines stands out for predominantly negative dependence across much of the grid and across horizons. This pattern indicates that quantile conditions in American Airlines returns are often associated with opposite side quantile conditions in the sector index rather than with matched comovement. The finding highlights meaningful firm level heterogeneity within the regional Travel and Leisure space, suggesting that idiosyncratic risk and airline specific exposures can dominate the sector linkage for some carriers.
Delta exhibits a more mixed and state dependent structure. In the index to airline direction, short horizons show pockets of positive dependence in matched favorable states alongside negative regions around central quantiles, implying selective alignment with the sector benchmark. In the reverse direction, Delta also displays short horizon dependence that fades with the horizon, consistent with limited persistence of directional predictability.
Southwest shows the clearest evidence of asymmetric dependence patterns that are not concentrated along the main diagonal. In the index to airline direction, dependence is weak in symmetric tail regions but more visible in mixed state combinations, and the overall segmentation of the grid remains broadly similar from k = 1 to k = 5 before attenuating at longer horizons. In the reverse direction, the heatmaps show even sharper sign differences across quantile regions, with dependence remaining visible through k = 22 and, to a lesser extent, k = 66. This suggests that Southwest returns contain information about subsequent sector index quantile outcomes in an asymmetric manner that is strongest in mixed state configurations rather than in symmetric tail comovement.
United shows a more upside oriented link with the sector benchmark. In the index to airline direction, positive dependence is concentrated in the upper quantiles at short horizons, indicating that unusually strong sector conditions are associated with unusually strong subsequent United outcomes. The signal weakens and becomes more localized as the horizon increases. In the reverse direction, dependence is also concentrated in the upper quantiles, suggesting that strong United return conditions can precede strong sector index outcomes at short horizons, with limited persistence at longer horizons. Altogether, Figure 8 indicates that North America exhibits weaker and less uniform airline sector connectedness than Europe, with several cases of negative or mixed sign dependence and strong evidence of state dependence. These patterns reinforce the value of quantile-based methods for identifying regional heterogeneity and directional asymmetries that are not captured by average correlation.
Collectively, the regional evidence from Figures 6 through 8 highlights substantial heterogeneity in the nature, strength, and direction of dependence between Travel and Leisure sector conditions and airline equity returns. Europe exhibits the most coherent and broadly positive regional linkage, with strong short horizon dependence across a wide range of market conditions and attenuation at longer horizons. Asia Pacific displays pronounced state dependence and directional asymmetry, with airline to index predictability often as strong as, or stronger than, the reverse channel. North America, by contrast, shows weaker and more fragmented dependence, with several airlines exhibiting mixed sign or predominantly negative relationships across quantiles and horizons. These cross-continental differences suggest that regional sector indices capture important local narratives but do not fully reflect the common international sentiment and shared shocks faced by globally integrated airlines. This motivates extending the analysis to a global Travel and Leisure benchmark to assess whether dependence structures become more uniform and persistent when airlines are related to a worldwide sector index that aggregates cross regional travel dynamics.
After we first examine the regional relationships, we then turn to the global Travel and Leisure index to see whether the relationship becomes more stable and more common when sector conditions are measured at the global level (Figure 9). The global index includes travel company stocks from many regions and therefore works as a good indicator of international investor sentiment and of common shocks that may not appear clearly in regional indices. This is especially important for airlines with international networks, because their performance and valuations are affected by international demand, cross-border mobility, and global risk factors. For this reason, we present cross-quantilogram heatmaps for each airline in relation to the global index, for horizons k = 1, 5, 22, and 66 days, and in both directions: from the global index to the airline and from the airline to the global index. In this way, we can compare the global results with the regional ones and see whether global sector conditions work as a common factor for airline returns. Cross-quantilogram results for the Global Travel and Leisure index and airline equities.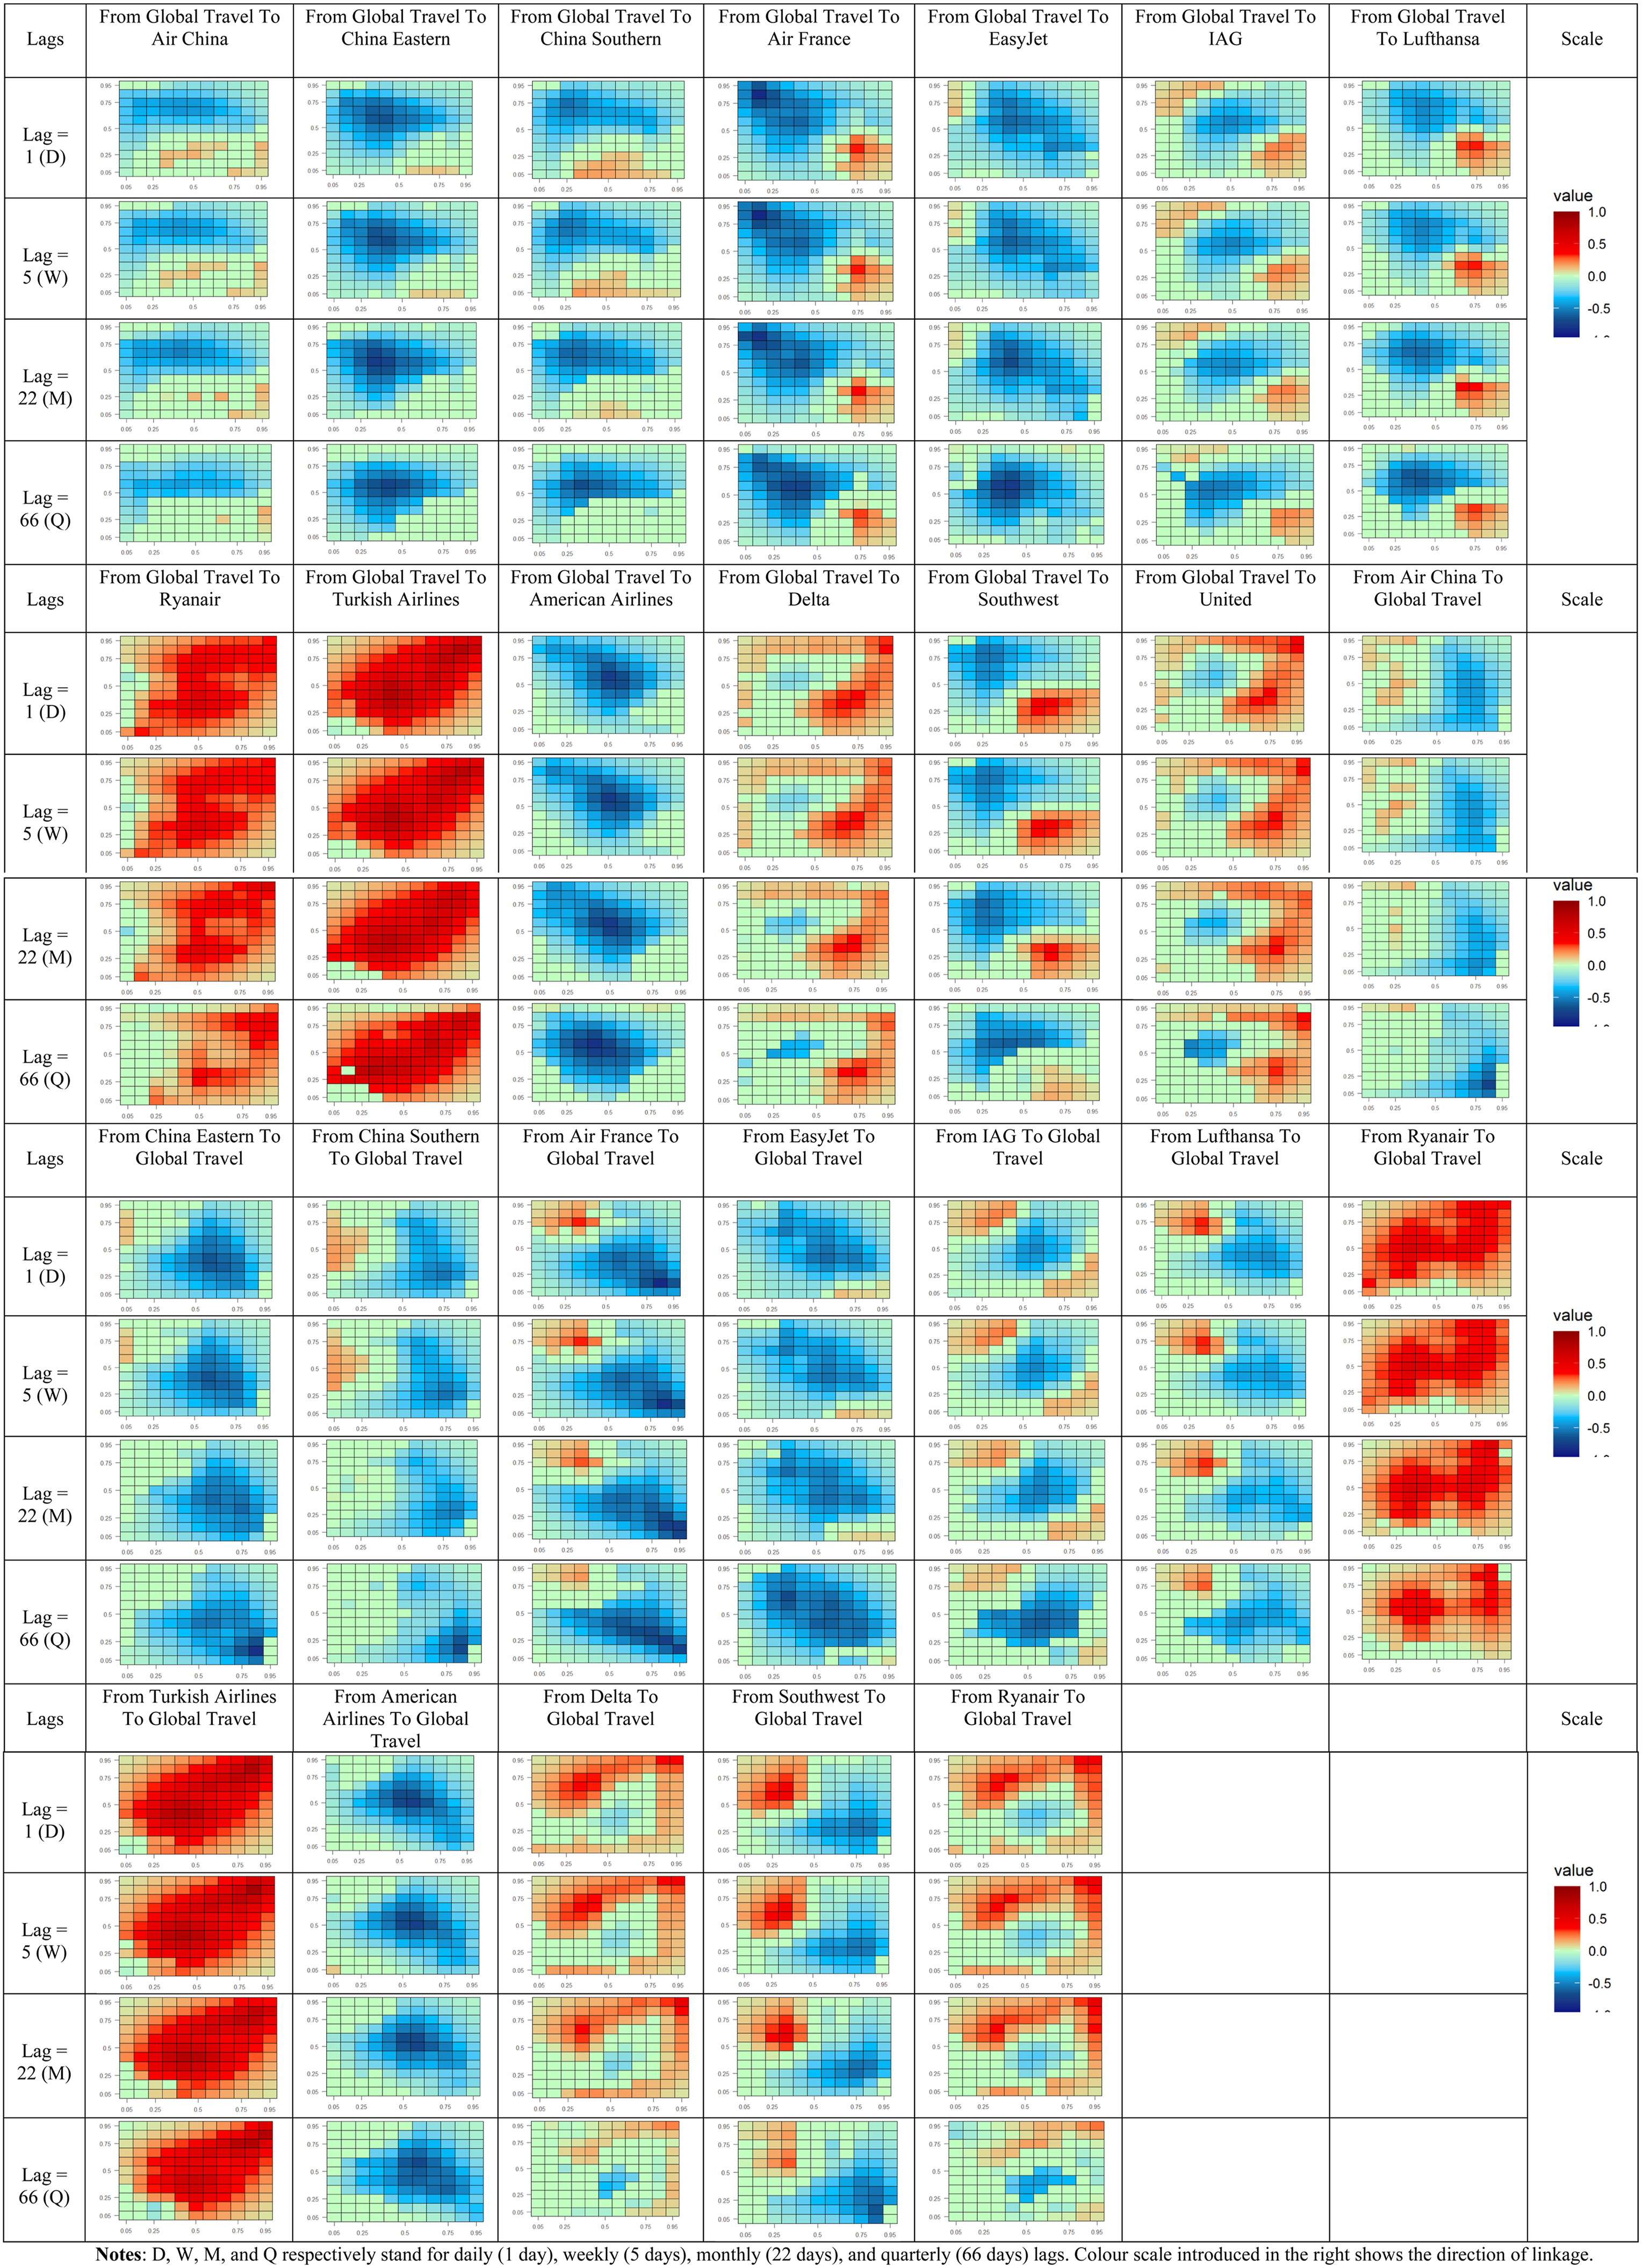
When we use the global index, Asian airlines show strong asymmetries, and in many cases negative dependence dominates. For Air China, in both directions, the relationship is mainly negative and appears more in the middle and upper quantiles, while there is little evidence of strong joint decline in the lower tail. The same pattern appears in China Eastern, where the relationship with the global index is generally weak and mainly negative, especially over short-term horizons. China Southern also shows a mainly negative relationship, especially at monthly and quarterly horizons. Overall, the global index does not work as a consistently positive common factor for Asian airlines. Instead, the relationship remains asymmetrical and often negative.
For European airlines, the picture is more mixed and more complex compared with the regional European index. Air France KLM shows a clearer positive relationship with the global index mainly over short-term horizons and mainly in the upper tail, which shows that when global sector conditions are very strong, the company also tends to have very strong returns. However, this relationship is not equally strong under normal conditions. easyJet and IAG show mainly negative dependence in the middle quantiles and in both directions, which means that their connection with the global factor is weaker than with the European index. Lufthansa also shows a relationship that depends greatly on market conditions, without a stable pattern. By contrast, Ryanair shows a more stable positive relationship over short-term horizons, mainly from the middle to the upper quantiles. Turkish Airlines stands out more than all the others, because it shows the clearest and most stable connection with the global index. Its relationship is generally positive in both directions and remains relatively strong across different time horizons. This shows that the global index is more useful for airlines with a more international orientation.
For North American airlines, the global index again gives a mixed picture. American Airlines shows mainly negative dependence in the middle and upper quantiles, both over short-term and medium-term horizons. Delta shows a more complex relationship: in some cases, there is positive dependence, mainly when the global index is at high levels, while in other cases the relationship is negative, especially in the middle quantiles. Southwest shows strong nonlinearity, because the relationship changes depending on market conditions. United shows a clearer positive connection in the upper quantiles, which shows that the relationship is stronger when global sector conditions are especially good. Even so, here too the relationship becomes weaker as the time horizon gets longer.
Overall, the results from the global index show that moving from a regional index to a global one does not automatically lead to stronger or more symmetric dependence. Instead, the relationship remains strongly dependent on market conditions and is often asymmetric. For some airlines with more international exposure, the global index captures a common factor better. For others, however, regional conditions, institutional differences, and the characteristics of the company itself remain more important. At the same time, the reverse direction often shows that airline stocks contain information that can help predict the future path of the broader travel sector, even when the relationship is not always positive. So, the global results add to the regional analysis and show that the relationships between airlines and the Travel and Leisure sector are not explained by one single common factor, but change depending on market conditions, the time horizon, and the direction of the relationship.
These findings show overall that there are important differences between regions and between benchmark indices, which requires a more careful interpretation of the relationship between tourism, finance, and the special characteristics of each sector. The next part examines these effects in more detail.
Discussion
The discussion highlights three main findings: the relationship of airlines with the T&L sector changes depending on conditions, the time horizon, and the region, while it also shows strong asymmetry. This dependence differs significantly across different levels and changes as the time lag increases, which shows that the connection of the airline sector cannot be described only by an average correlation. The most stable characteristic across regions is precisely this asymmetry. Comovement is rarely strong around the median; instead, it appears mainly during periods of joint decline or joint increase. This shows that airline valuations and travel sentiment adjust more when markets are under pressure or in excess, which is consistent with the view that travel sector stocks are strongly affected by the prevailing market regime (Andraz et al., 2018). Therefore, the results confirm the importance of methods that consider the entire distribution in tourism finance, especially because factors such as macroeconomic shocks, energy prices, and geopolitical uncertainty often cause nonlinear reactions (Lee and Chen, 2022; Salisu and Tchankam, 2022).
Europe shows the clearest and most coherent regional connection between airlines and the European Travel and Leisure index, but here too the structure of the relationship depends strongly on market conditions. Dependence is stronger in extreme periods, which supports the view that travel sentiment in the region matters more during phases of sharp revaluations than under normal market conditions (Assaf and Josiassen, 2012; Hadood and Irani, 2021). An additional dimension of heterogeneity appears in the business models of the companies. Low-cost carriers show stronger but short-lived forms of dependence, something that is linked to the fact that European leisure markets are highly price-sensitive and are directly affected by travel decisions that change quickly according to the news and market sentiment (Graham, 2006; Papatheodorou and Lei, 2006). In contrast, network carriers show a broader and more persistent dependence, which also extends to medium-term horizons. This is consistent with the fact that their valuation is influenced by slower and more structural factors, such as capacity planning, exposure to long-haul flights, and the broader conditions of the travel cycle (Kumar, 2023; Papatheodorou and Lei, 2006). Turkish Airlines constitutes a useful intermediate case within the European sample. The structure of its dependence is not explained as well only through a regional perspective and becomes more understandable when a global benchmark is used, which is reasonable given the position of its network, which connects regional and international flows.
North America shows a more diverse picture, with less clear and often mixed signs of dependence between airlines and the North American Travel and Leisure index. This difference from Europe suggests that regional sector indices do not always align with the performance conditions of airlines when the competitive structure, firms’ risk profiles, and investor positioning differ. In this context, the dependence surface often highlights regime separation, where alignment intensifies under certain conditions while it weakens or reverses under others. One interpretation argues that airline-specific financial and operational disclosures significantly influence return dynamics, with these idiosyncratic factors potentially overshadowing sectoral linkages outside specific regimes. This interpretation aligns with the broader tourism finance literature, which shows that travel-related stocks are affected by macro-financial factors, whose impacts vary with market conditions, such as exchange rate fluctuations and energy market volatility. This suggests that dependence structures may change in sign and intensity across regimes, rather than remaining stable over time (Demiralay and Kilincarslan, 2019; Jalkh et al., 2021).
In the Asia-Pacific region, dependence appears to be smoother and more long-term oriented, with dependence regions remaining visible over longer time periods. This pattern is consistent with valuation channels that adjust more slowly, such as policies and macroeconomic factors that can influence airline performance and travel demand over the long run. The crisis-period literature on travel-related equity markets emphasizes the persistence of shocks and regime behavior, offering a compelling explanation for the sustained economic significance of dependence at monthly and quarterly horizons, rather than merely reflecting transitory noise (Andraz et al., 2018; Jalkh et al., 2021). More generally, the results are consistent with evidence showing that adverse conditions have a stronger impact on travel-related stocks than on other types of equities. For example, the effects of geopolitical risk are more pronounced during recession periods and may vary depending on the region and market conditions. This indicates that tail-focused dependence measures remain important in this sector (Demiralay and Kilincarslan, 2019; Sun et al., 2025).
The comparison between regional and global indices provides an important way to understand these dynamics. Moving from continental indices to the Global Travel and Leisure index does not automatically make all airlines more dependent. Instead, the global index appears to be more relevant for network airlines operating internationally. This is consistent with the idea that a significant part of co-movement in the airline sector is driven by common information related to travel demand, financing conditions, energy markets, and geopolitical uncertainty. When looked at from a wider angle, these patterns can be understood through two different but related theoretical lenses. First, they fit with a model of how information is shared, in which news that affects the whole sector and how investors feel about it are both taken into account when valuing airlines, but at different times for different companies and market conditions. Second, the greater dependence seen during times of crisis and in downside tail conditions is also in line with a financial contagion view, which says that shocks are passed on more closely between related assets when stress levels rise. At the same time, low-cost carriers or those focused on domestic markets continue to exhibit more localized and proportionate dependence, even relative to the global benchmark. This suggests that pricing dynamics, capacity adjustments, and rapid booking behavior still have a strong impact on their valuations. Finally, the directional results are informative for the study’s research question. In many cases, the Travel and Leisure index to airline channel is most evident at short horizons, consistent with a top-down sentiment mechanism in which broad travel equity conditions are incorporated rapidly into airline valuations. Feedback from airlines to sector indices also appears in several cases, but it is more selective across market conditions and horizons, indicating that airline specific information is not uniformly impounded into sector pricing and is most likely to matter during regimes (Lin and Falk, 2022). The findings imply that airline sector links are conditional and regime dependent, shaped jointly by business model differences, geographic exposure, and the dominant risk channels affecting tourism related equities.
Conclusions and policy implications
This study examines state- and horizon-dependent co-movements between airline stock returns and Travel and Leisure sector indices across Europe, North America, and Asia-Pacific using 1193 aligned daily observations from 2 January 2015 to 26 June 2025 and the cross-quantilogram framework of Han et al. (2016). The main empirical message is that airline–T&L dependence is strongly regime dependent. Linkages intensify in the tails of the joint distribution, particularly in downside conditions, and weaken around the median, implying that average correlations can understate interconnectedness when market conditions deteriorate (Andraz et al., 2018; Jalkh et al., 2021). Dependence is also horizon dependent, with the strongest alignment typically emerging at short horizons following major shocks and attenuating as horizons lengthen. The bidirectional design further indicates that T&L sector conditions tend to lead to airline returns at short horizons, while feedback from airlines to the broader sector is more selective and concentrated in specific market states. While regional patterns differ, the cross-regional conclusion is consistent: extreme events and uncertainty are the primary environments in which airlines and the broader travel equity space move most tightly together, in line with evidence that tourism-related assets exhibit state-dependent responses to geopolitical risk and crisis news (Demiralay and Kilincarslan, 2019; Sun et al., 2025; Wang et al., 2023).
These results have implications for theory, practice, and policy. Theoretically, they bolster the perspective that airline–Travel and Leisure dependence is more accurately characterized as state-dependent, directional, and horizon-specific, rather than as a stable average relationship. For investors and financial risk managers, the results suggest that diversification across airlines and broader travel and leisure exposures may become ineffective during crisis regimes, characterized by increased joint downside dependence and more synchronized return distributions. Standard risk systems that rely on constant correlations or normality assumptions probably don’t consider joint tail risk, which is why stress tests and scenario analysis that explicitly include regime dependence and tail co-movement are needed (Jalkh et al., 2021; Sun et al., 2025). In practice, this means setting risk limits and hedges based on how sensitive they are to crises instead of how calm they are on average and keeping an eye on signs that the travel sector is under stress, like sudden changes in travel policy, spikes in uncertainty, or big changes in travel-demand expectations. The evidence also shows that the choice of benchmark is important for building a portfolio. Global T&L indices may be more useful for carriers that do business all over the world, while regional benchmarks may be better for airlines that only do business in one area and get most of their money from investors in that area. Adding both regional and global travel indicators can make risk attribution and scenario design better.
For airline management, the results highlight that market-based financing conditions can tighten rapidly during travel-system stress, because airline equities co-move more strongly with travel-sector sentiment in downside regimes. This strengthens the case for resilience planning that is explicitly oriented toward tail events. For network carriers with broader and more persistent dependence patterns, higher liquidity buffers, committed credit lines, and disciplined balance-sheet management can reduce vulnerability to sudden sentiment collapses and prolonged risk-off periods. For carriers whose dependence appears sharper but more short-lived, operational flexibility becomes especially valuable (Assaf, 2009; Pearce, 2012). Rapid capacity adjustment, dynamic scheduling, and cost structures that allow fast scaling down and scaling up can reduce the duration and depth of stress episodes. Across business models, the results also support the importance of timely, credible communication with investors during shocks, since uncertainty and information frictions are precisely the conditions under which tail dependence and repricing intensify. Clear guidance on demand conditions, capacity responses, and liquidity positions may help shorten the window in which markets extrapolate worst-case outcomes.
The findings also have implications for regulators and sector-wide policy, particularly where aviation is viewed as system-relevant infrastructure for tourism economies. Because co-movements spike in crisis regimes, stress in airlines can coincide with stress in the broader travel and leisure sector, amplifying macroeconomic fallout through confidence channels and financial constraints. This suggests that crisis preparedness frameworks should treat aviation not only as an operational node but also as a financial transmission channel within the tourism system. In practical terms, authorities and industry bodies can improve resilience by institutionalizing ex ante contingency planning for extreme travel disruptions, including protocols for rapid policy coordination, transparent criteria for temporary support mechanisms, and stress-testing exercises that simulate severe demand collapses and policy shocks. The quantile-dependent patterns documented here also imply that prudential and supervisory assessments based on normal-state risk metrics may understate the capital and liquidity needed under worst-case scenarios. Incorporating stress tests that reflect state-dependent co-movement, rather than relying on average correlations, can provide a more realistic assessment of sector vulnerability during tail events (Sun et al., 2025). For internationally exposed carriers, the stronger relevance of global benchmarks further underscores the value of cross-border coordination in managing travel disruptions, since unilateral policy changes can transmit rapidly into global travel sentiment and financing conditions.
One useful direction for future research is to add indicators and implementation settings that are specific to uncertainty to the framework. In particular, future research could investigate whether economic policy uncertainty, climate policy uncertainty, geopolitical risk, war-related shocks, and pandemic-policy interventions can help explain when airline–Travel and Leisure dependence is at its highest. This would be in line with earlier research that shows that uncertainty about economic policy predicts tourism demand in the USMCA (Işık et al., 2020), that uncertainty about policy affects travel and leisure stock returns (Qin et al., 2021), that uncertainty about climate policy matters for airline stocks (Marobhe and Kansheba, 2024), and that COVID-related policy responses affected U.S. travel and leisure returns (Chen et al., 2020). From an implementation point of view, these kinds of indicators could also be used as early warning signs for investors, local businesses, and policymakers when they are planning stress tests, liquidity, and backup plans in times of high uncertainty.
It is important to note some restrictions. The sample encompasses significant disruptions, such as COVID-19 and intervals of increased geopolitical uncertainty, which may affect the intensity of tail dependence; subsequent research could thus facilitate a more explicit comparison between crisis and non-crisis subsamples. Also, some airlines may be part of the sector indices that are used as benchmarks, which can cause co-movement. Exclusion-based benchmarks would make it easier to find the right ones.
Footnotes
Acknowledgements
We would like to thank the referees for the useful comments made on a previous version of our manuscript. All remaining errors are solely the authors’ responsibility.
Funding
The authors received no financial support for the research, authorship, and/or publication of this article.
Declaration of conflicting interests
The authors declared no potential conflicts of interest with respect to the research, authorship, and/or publication of this article.