






Abstract
Analyzing and forecasting visitor flows has significant potential to enhance policy decisions, facilitate long- and short-term planning of local resources, and optimize tourism offerings. Leveraging Big Data in this context provides distinct advantages, particularly regarding real-time predictions. This paper proposes an econometric approach to account for uncertainty in the prediction model, a key source of forecasting errors. A description and prediction of daily visits in Shanghai City are provided using models commonly employed in tourist flows analysis. We show that model combination and selection procedures can serve as valuable tools for policymakers, equipping them with accurate forecasts to support tourist flow management.
Introduction
Managing the volatility of tourism dynamics has become increasingly important as destinations experience greater variability in visitor numbers across regions and over time. These oscillations, whether a spike that exceeds a destination’s capacity or a rapid decline in visitor numbers, can trigger multidimensional socio-economic and environmental impacts. For example, when visitation exceeds acceptable sustainability limits, overtourism can detract from the tourism experience, overstress infrastructure and public services, and threaten environmental sustainability (Lin, 2024; Mussoni and Vici, 2025). However, prolonged low visitation can lead to weakened local economies, diminished corporate profit, and inefficient use of public resources (Bisht et al. 2025; Blázquez-Salom et al., 2023). Both extremes expose the structural fragility of tourism systems, exacerbate regional disparities, and threaten balanced and equitable development (Song et al., 2019; Zheng et al., 2024).
In this context, accurate demand forecasting is essential for anticipating demand fluctuations and supporting evidence-based policy-making. Reliable projections provide government officials and key tourism stakeholders with a basis for balancing the economic advantages of tourism against the destination’s environmental and infrastructural conditions, thereby minimizing risk from either excessive or insufficient demand for tourism space. Forecasting insights also support strategic planning by helping decision-makers and policymakers determine how and when to allocate limited resources, adjust operational capacities, and, if needed, use adaptive management processes to enhance resilience and sustainability in the long term (Duan et al., 2022; Fan et al. 2025; Prayag et al., 2024).
The integration of real-time big data into forecasting is a new area of research in tourism and hospitality. Using Big Data in policy-making offers numerous advantages, particularly in providing real-time predictive insights. Access to real-time data enables the identification of daily patterns in urban systems and facilitates optimal data processing to formulate fundamental responses for policymakers, as highlighted by Kandt and Batty (2021). The extensive collection of big data enables the analysis of tourists’ preferences and characteristics, empowering decision-makers in tourism planning. The advantages of leveraging big data can help mitigate risks associated with extreme scenarios, as discussed in studies by Ardito et al. (2019) and Li et al. (2018). In this paper, we use a Big Data dataset provided by Shanghai Unicom, the second-largest mobile phone provider in Shanghai. This dataset contains real-time tourists’ positions in the Shanghai metropolis from 1 December 2020 to 17 January 2022. It has been successfully used in Camatti et al. (2024) to study tourism spillover effects within the Shanghai districts. We consider a period during which a significant event, namely the Chinese New Year, occurs and study the forecasting ability of standard models in periods with an extremely large number of visits. Some strategies for addressing forecasting errors and model uncertainty are proposed.
Although the growing availability of high-frequency and behaviorally rich data has significantly enhanced the empirical basis of tourism forecasting, improved data alone do not automatically translate into more reliable predictions. Even with detailed real-time information on visitor movements, researchers and policymakers must still decide how to model these dynamics, which variables to include, how to specify temporal structures, and which assumptions to impose on the data-generating process. In this sense, a fundamental methodological challenge persists in the form of model uncertainty. Tourism demand forecasting has evolved from classical time-series approaches – such as Autoregressive Integrated Moving Average (ARIMA) and Seasonal ARIMA (SARIMA), designed to capture seasonality and persistence – to more flexible systems that integrate statistical and computational techniques (Chu, 2009; Önder and Gunter, 2016; Song and Li, 2008; Song and Zhang, 2025). However, empirical evidence consistently shows that no single model systematically outperforms others across destinations, time horizons, or data environments. Forecast accuracy in tourism analysis depends not only on the richness of the available data, but also on model specification, parameterization, and the structural assumptions underlying the forecasting framework. Tourism systems are inherently dynamic and volatile, and forecasting errors may arise as much from specification risk as from stochastic variability in the data itself. This challenge has become increasingly relevant as the diversity of forecasting methodologies available to researchers and practitioners has grown. Traditional econometric approaches now coexist alongside machine learning techniques and hybrid frameworks that combine statistical rigor with computational flexibility. Each approach captures different dimensions of tourism dynamics, and is characterized by distinct assumptions, strengths, and limitations. Consequently, no single model can be expected to consistently outperform others across all destinations, time periods, or forecasting horizons. These considerations underscore the importance of forecasting frameworks that explicitly recognize and manage model uncertainty rather than implicitly ignoring it. By acknowledging that different models may provide complementary insights, researchers can develop more adaptive and robust forecasting systems that better capture the evolving nature of tourism demand.
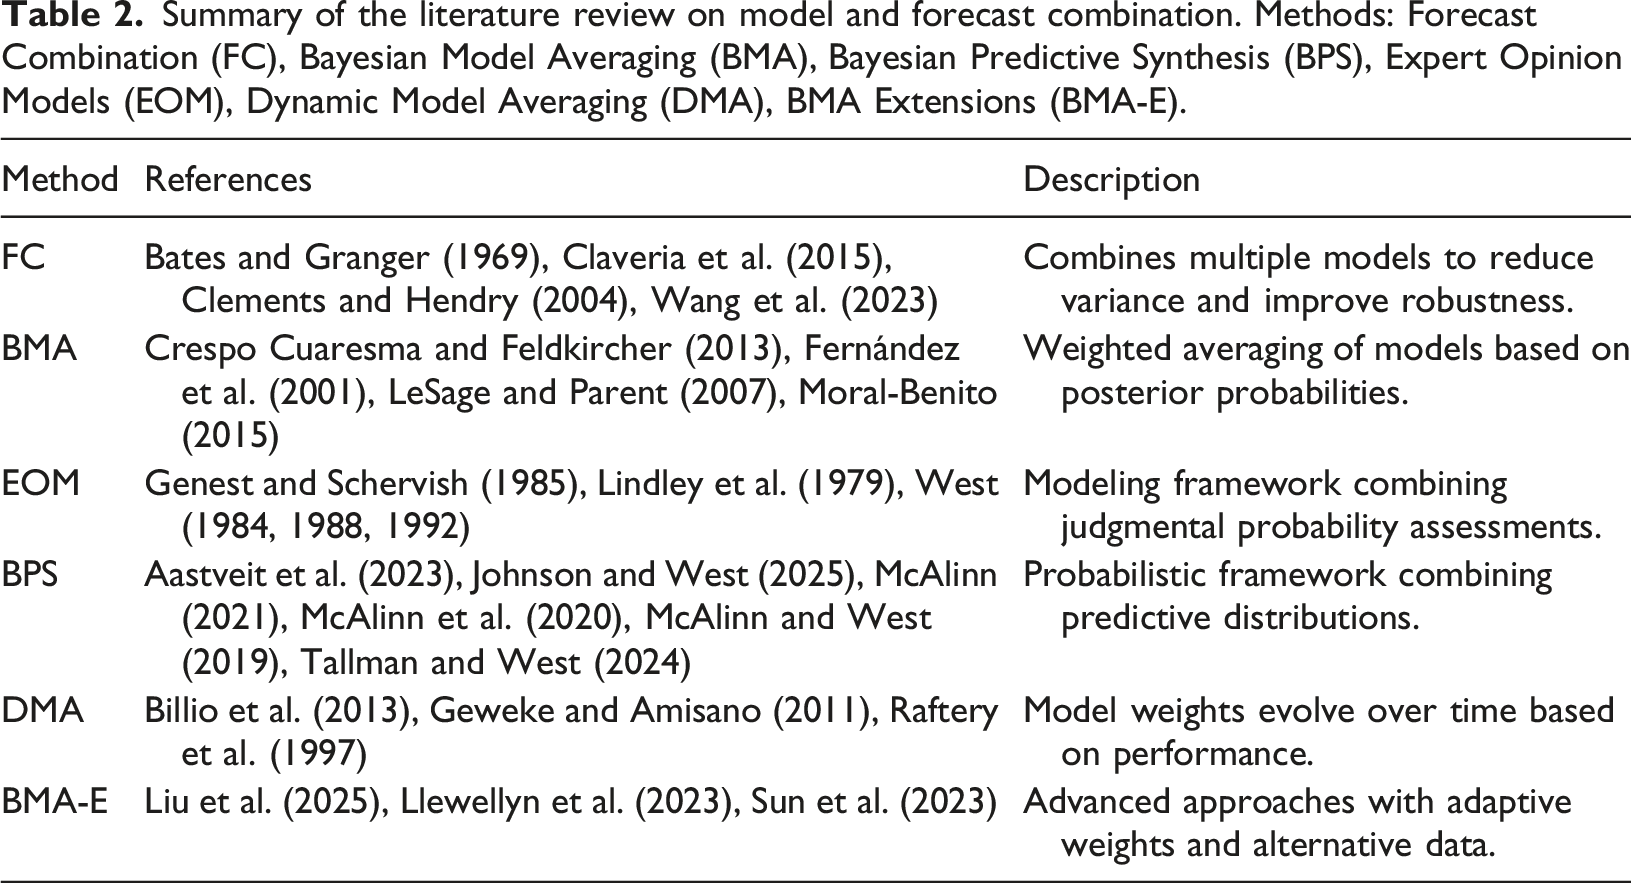
An original contribution of this paper is to address model uncertainty through forecast combination. Instead of selecting a single preferred specification, we implement a Bayesian Model Averaging (BMA) framework that combines predictions from alternative models estimated on the same dataset. In the seminal work of Bates and Granger (1969) and its subsequent extensions (Billio et al., 2013; Fawcett et al., 2015; Geweke and Amisano, 2011; Gneiting and Ranjan, 2011; McAlinn and West, 2019), BMA assigns dynamic weights to competing models based on predictive performance. In our application, SARIMA-type models serve as structured and interpretable core specifications, and their forecasts are combined probabilistically to account for time variation in model performance. Following Billio et al. (2013) and Costantini et al. (2016), we use common forecast performance metrics to guide model dynamics and also incorporate economic evaluation to illustrate how model selection can be aligned with specific policy objectives. By integrating high-frequency mobile positioning data on Shanghai’s tourist flows into a coherent probabilistic averaging framework, our study demonstrates how forecast robustness can be enhanced, specification uncertainty explicitly quantified, and predictive performance improved in periods of extreme demand. The resulting approach provides a scalable, decision-oriented tool for managing tourism volatility in complex urban environments such as Shanghai.
The remainder of the paper is organized as follows. Section 3 introduces the forecasting models and the model combination strategy. Section 4 presents the empirical application to forecasting visits to Shanghai. Section 5 concludes and outlines future research directions.
Literature review
Tourism has become a key driver of economic growth in many countries and regions, stimulating the development of a wide range of related sectors such as transportation, hospitality, and culture (Lin, 2024). While tourism generates significant development opportunities, its strong interdependence with other industries increases the complexity of its management and planning processes (Chen et al., 2025; Duan et al., 2022; Mussoni and Vici, 2025). These structural characteristics require forward-looking strategies to ensure balanced and sustainable growth.
In recent years, evolving behavioral changes and market conditions in response to major events, such as the COVID-19 pandemic, naturally called for flexible, resilient, and sustainable tourism management and governance (Fan et al., 2025; Prayag et al., 2024). Rather than focusing solely on recovery from shocks, emerging paradigms feature structural strengthening of tourism systems and their ability to adapt to demand changes and long-term sustainability challenges. Within this framework, reliable demand forecasts are crucial for effective data-driven policymaking and tourism governance. Accurate forecasting enables public authorities to anticipate fluctuations in visitor flows and align medium- and long-term investments with expected demand, thereby strengthening transport systems, optimizing environmental carrying capacity, and improving service provision (Ghalehkhondabi et al., 2019; Guizzardi et al., 2021; Wang et al., 2019). Linking infrastructure planning and resource allocation to tourism dynamics predictions enhances policy coherence and reduces the risks of over- and under-investment at the aggregate and regional levels. Forecasting provides a critical foundation for informed decision-making in budgeting, staffing, and destination development (Jakovlev and Kitanov, 2024; Zhou, 2021), while also guiding marketing and promotional strategies through alignment with anticipated demand trends (He and Qian, 2025). Beyond these operational applications, demand forecasting serves a dual role as both a management tool and a strategic instrument for driving tourism toward a more sustainable path (Liang et al., 2025). Accurate projections favor balancing economic gains with environmental and operational limits, risk mitigation, efficient resource use, and sustainable development (Song et al., 2019; Zheng et al., 2024). They further support the identification of ecological carrying capacities and the design interventions to safeguard fragile ecosystems (Lu and Chen, 2023; Sejati et al., 2025). Finally, by anticipating variations in visitor flows, destination managers can improve efficiency, resilience, and competitiveness (Hewapathirana, 2025; Zheng et al., 2024).
Many forecasting approaches have been developed over the last few decades, ranging from traditional time-series and econometric models to state-of-the-art artificial intelligence (AI) and hybrid approaches, with the aim of improving predictive accuracy (Bi et al., 2022; Song et al., 2019). Although many of these methods perform well in specific empirical contexts, no single forecasting approach consistently demonstrates superior accuracy across all settings (Höpken et al., 2021; Pan et al., 2025). Consequently, enhancing the generalizability, robustness, and adaptability of forecasting models has become a central focus of contemporary research. The historical evolution of tourism demand forecasting reflects a broader methodological and epistemological shift: from static, theory-driven econometric models to adaptive, data-integrated systems. Advances in computational power and the increasing availability of high-frequency and behaviorally rich data have fostered the convergence of statistical inference, economic reasoning, and machine learning techniques, fundamentally reshaping how researchers analyze the complexity of tourism dynamics (Song and Li, 2008; Song and Zhang, 2025).
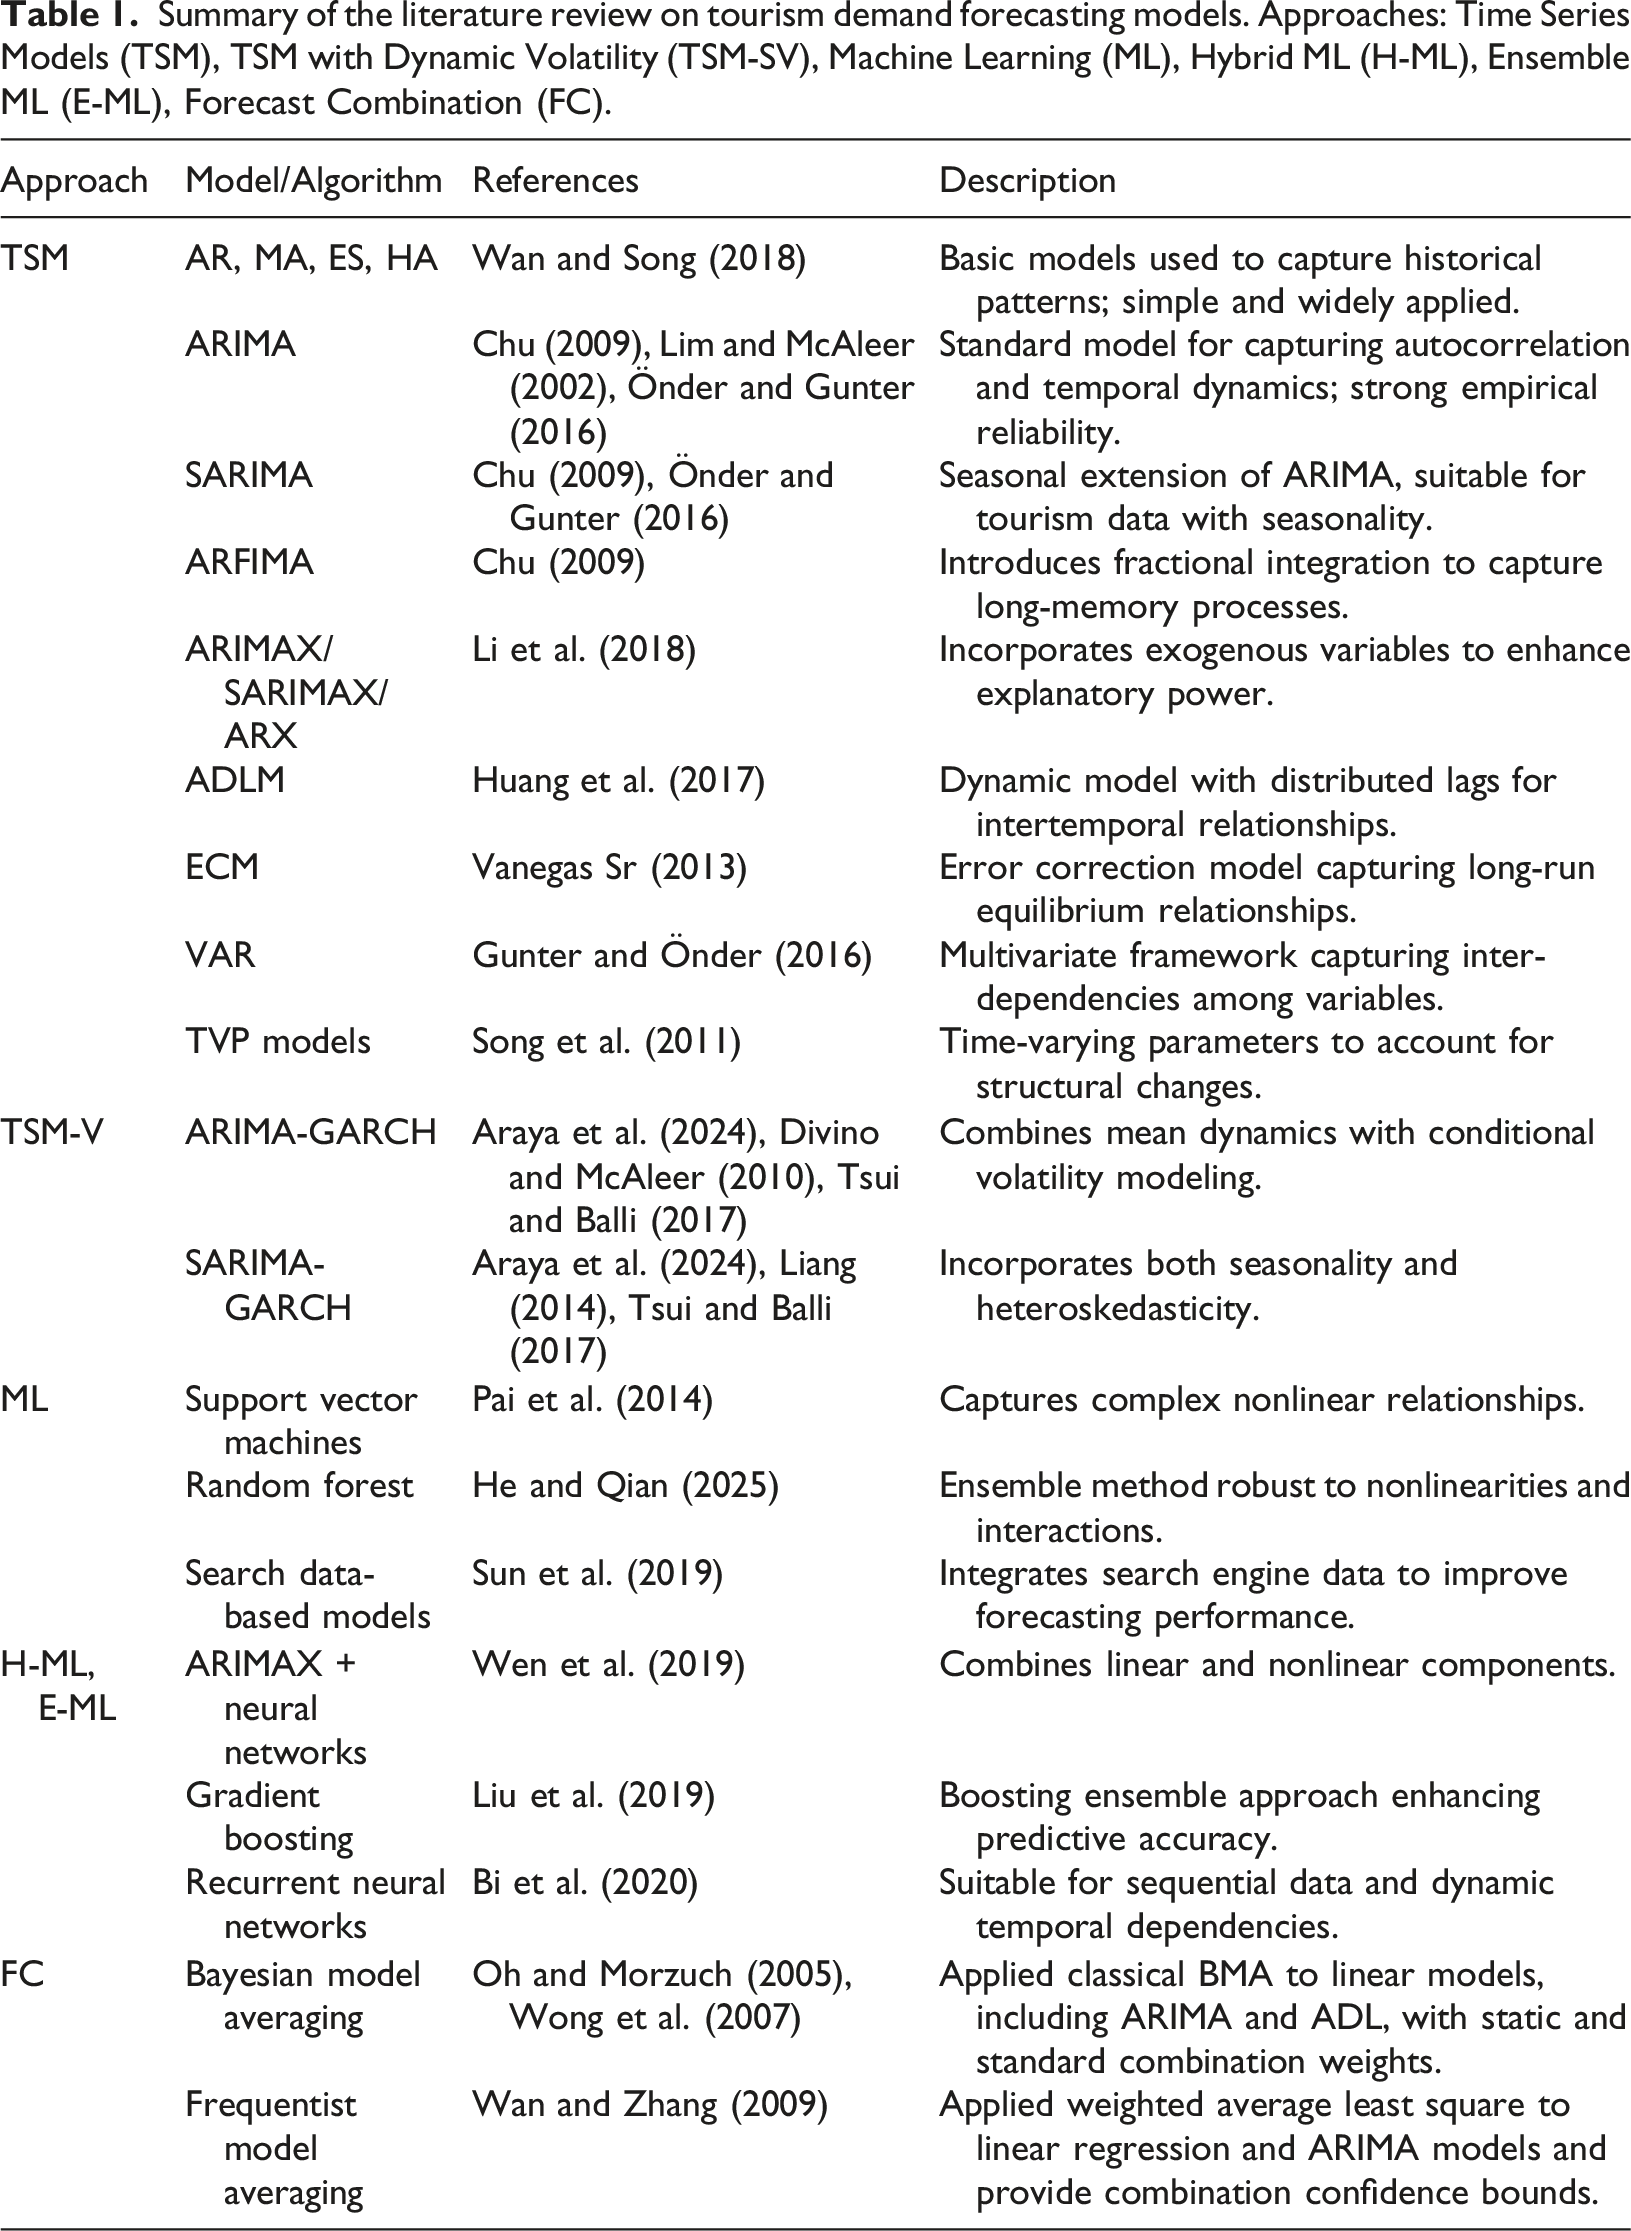
Time-series models, particularly within the Box–Jenkins framework (Box and Jenkins, 1976; Box et al., 2015), have long dominated tourism demand forecasting. Basic time-series approaches include autoregressive (AR), moving average (MA), single exponential smoothing (ES), and historical average (HA) models (Wan and Song, 2018). These models have been widely employed over the past five decades due to their straightforward implementation and their capacity to capture historical patterns effectively. Among them, ARIMA models are frequently applied (Lim and McAleer, 2002), and their seasonal extension, SARIMA, is extensively used in tourism time-series analysis (Chu, 2009). Early forecasting studies relied heavily on ARIMA and SARIMA models to capture persistence, cyclicality, and temporal dependence in tourism demand, and the empirical evidence has consistently confirmed their predictive reliability (Chu, 2009; Önder and Gunter, 2016). Nevertheless, the linear structure of ARIMA-type models limits their ability to account for structural variability, nonlinear patterns, and volatility clustering that increasingly characterize tourism demand. Despite these limitations, ARIMA and SARIMA remain essential and frequently serve as interpretable cores within more flexible hybrid frameworks (Gil-Alana et al., 2004; Koc and Altinay, 2007). They have been extended along several directions. For example, the ARFIMA model introduces fractional integration (Chu, 2009), while ARIMAX and SARIMAX incorporate exogenous variables to increase explanatory power. For example, Li et al., 2018 used an ARX model to explore the impact of relative climate variability on tourism demand. Beyond ARIMA-type specifications, additional econometric frameworks have been developed to capture inter-temporal relationships and structural dynamics in tourism demand. These include the Autoregressive Distributed Lag Model (ADLM) (Huang et al., 2017; Huang et al., 2017), the Error Correction Model (ECM) (Vanegas Sr, 2013), the Vector Autoregressive (VAR) model (Gunter and Önder, 2016), and Time-Varying Parameter (TVP) models (Song et al, 2011). Moreover, time-varying volatility has been incorporated into tourism forecasting by assuming Generalized Autoregressive Conditional Heteroskedasticity (GARCH) models for the error variance. ARIMA-GARCH and SARIMA-GARCH specifications are particularly appropriate when tourism demand exhibits conditional heteroskedasticity, allowing for seasonality and time-varying variance (Araya et al., 2024; Tsui and Balli, 2017), and have been shown to be well-suited for forecasting high-frequency flows (Chan et al., 2005). Divino and McAleer, 2010 applied ARIMA-GARCH to model and forecast daily tourist arrivals in Peru, while Liang (2014) employed SARIMA-GARCH to forecast tourism demand in Taiwan. In this paper, we build on this literature and provide a suitable framework for incorporating uncertainty in SARIMA-GARCH specifications into tourism forecasts.
In parallel with these developments, the extensive use of large-scale, high-frequency, and behaviorally rich datasets has accelerated the need for adaptive forecasting techniques in tourism studies that combine econometric rigor with machine-learning flexibility (e.g., see Camatti et al., 2024). Machine learning techniques such as support vector machines (Pai et al., 2014), random forests (He and Qian, 2025), and hybrid systems that incorporate search engine data (Sun et al., 2019) have shown strong potential for capturing nonlinear relationships and complex dependencies (Li et al., 2018). Ensemble and hybrid frameworks, including ARIMAX artificial neural networks (NN) (Wen et al., 2019), gradient boosting (Liu et al., 2019), and recurrent NN (Bi et al., 2020), combine linear and nonlinear components to improve predictive performance. However, empirical evidence shows that these approaches do not consistently outperform traditional models across all settings (Volchek et al., 2019), and their increasing complexity raises concerns about interpretability, overfitting, and parameter sensitivity (He and Qian, 2025; Wei and Mukherjee, 2024). Thus, standard ARIMA and SARIMA models continue to play a central role, often providing an interpretable baseline for hybrid and ensemble mechanisms (Coshall and Charlesworth, 2011; Hassani et al., 2017; Shen et al., 2011).
Summary of the literature review on tourism demand forecasting models. Approaches: Time Series Models (TSM), TSM with Dynamic Volatility (TSM-SV), Machine Learning (ML), Hybrid ML (H-ML), Ensemble ML (E-ML), Forecast Combination (FC).
Summary of the literature review on model and forecast combination. Methods: Forecast Combination (FC), Bayesian Model Averaging (BMA), Bayesian Predictive Synthesis (BPS), Expert Opinion Models (EOM), Dynamic Model Averaging (DMA), BMA Extensions (BMA-E).
In this paper, we apply BMA to a set of alternative SARIMA specifications with and without GARCH errors. Within our BMA framework, we assume that the combination weights depend on the model’s predictive performance. Standard predictive performance metrics are considered (e.g., see Costantini et al., 2016) together with cost functions in order to account for the economic evaluation of the forecast and to align statistical relevance and policy and tourism management objectives (Geweke and Amisano, 2011; Gneiting and Ranjan, 2011, 2013; McAlinn and West, 2019).
Expanding on this methodological rationale, the empirical phase of this research utilizes mobile positioning data to implement the proposed forecasting framework. These data, obtained from mobile network capabilities, provide detailed, real-time data on tourist presence and mobility behaviors (Chen et al., 2025; Metulini and Carpita, 2024). Mobile data provide dynamic measures of how people move through space and time, mitigating some of the limitations of conventional surveys and administrative data sources. In addition, mobile data have been used to understand the spatial and temporal impacts of social and cultural events, thereby further expanding their relevance to tourism research. More recently, the development of big data—high-frequency, complex information from mobile devices, social media, and digital transactions—has transformed our understanding of tourist behavior (Wu et al., 2025). These data sources can identify travel pathways, peak engagement periods, and popular attractions, yielding useful insights for destination and infrastructure management. Predictive analytics will further extend this capacity to understand mobility patterns and data-informed tourism policymaking (Ramos et al., 2021).
Nevertheless, predicting mobility is inherently challenging due to nonlinear interactions among behavioral, environmental, and demographic variables. Classic models (ARIMA models) rely on linearity and stationarity assumptions, while machine learning models (methods) can better handle (model nonlinearity) nonlinear functions but frequently do not capture temporal dependence. To address these issues, recent studies have employed ensemble frameworks to combine existing models, leveraging the strengths of both traditional and machine-learning approaches, thereby improving flexibility and predictive performance while remaining cautious about overfitting and parameter selection (Punia and Shankar, 2022; Wei and Mukherjee, 2024). The current study put forward the combination of mobile positioning data within a BMA framework – a probabilistic approach that weights multiple model specifications dynamically based on predictive performance. This controls for uncertainty while also capturing the temporal and structural variability of tourist mobility. With the addition of mobile data, the new approach improves forecasting accuracy and resilience while leveraging BMA’s flexibility to produce predictive outcomes, offering a scalable, generalizable tool for adaptive and sustainable tourism management.
Methodology
The temporal evolution of visitation rates across statistical areas reflects the inherently dynamic nature of tourism demand. The temporal patterns in observed visitation rates across statistical areas exhibit both periodicity and trend. Understanding these temporal dynamics is essential for tourism planning, destination management, and the efficient allocation of resources and services. Rather than fluctuating randomly, visitation counts exhibit clear periodic behavior alongside persistent changes over time, highlighting the need for modeling approaches that capture both regular cycles and stochastic variation. To capture these complex patterns, this study adopts dynamic stochastic models that represent the persistent, cyclical, and irregular components embedded in tourism visitation counts. Such models are particularly valuable in tourism analytics because they not only provide accurate forecasts of future demand but also help identify underlying temporal structures critical to policy design, infrastructure planning, and market responsiveness. Their flexibility and robustness have made them widely applicable in tourism forecasting research, and they can be readily implemented using modern analytical environments such as Python, MATLAB, and R. In this study, the empirical analysis was conducted in MATLAB using the Econometrics Toolbox. Specifically, we used the
Bayesian predictive synthesis
Bayesian predictive synthesis (BPS) and various generalizations of the framework have been introduced in particular for forecasting in economics and finance by Aastveit et al. (2023), Bassetti et al. (2018), McAlinn (2021), McAlinn et al. (2020), Johnson and West (2025) and McAlinn and West (2019) introduced the mixture-BPS, which includes Bayesian Model Averaging as a special case.
Let 


Bayesian Model Averaging is a special case of the mixture BPS when π0 = 0 and α
j
(
Model classes
The stochastic model, coupled with an inference procedure, facilitates generating daily predictions of the variable of interest over a specified time horizon. In the subsequent section, we illustrate a 60-day forecast for Shanghai City, using the aggregated statistical area. This methodology is versatile and can be extended to provide disaggregated forecasting analyses, including area-specific predictions for various statistical areas of interest. Furthermore, it enables predictions of visitor origin and type, as well as forecasts of flows between and within statistical areas.
Empirical tourism analysis must explicitly model trend and seasonal behaviour and ignoring these components can lead to biased conclusions. Beyond weather conditions – particularly extremes such as humid summers that shape leisure demand – seasonal patterns in Shanghai visits are also influenced by pronounced domestic tourism peaks and recurring business travel cycles. We employ SARIMA models, initially proposed by Box and Jenkins (1976), which are particularly well suited to our dataset. Differencing is used to address the trend, while seasonal differencing captures seasonal dynamics. Let us introduce the lag polynomials ϕ(L) = 1 − ϕ1L − … − ϕ
p
L
p
and θ(L) = 1 − θ1L − … − θ
q
L
q
for the non-seasonal dynamics and Φ(L
s
) = 1 − Φ1L
s
− … − Φ
P
L
sP
and Θ(L
s
) = 1 − Θ1L
s
− … − Θ
Q
L
sQ
for the seasonal dynamics, with (1 − L)
d
z
t
the dth order differencing operator, 
Time–varying volatility, that is heteroschedasticity, in tourist visits arises from the persistence or clustering of exogenous shocks, such as pandemics, exchange rate movements, or global income fluctuations. Other factors, such as mega-events, expos, and sudden travel booms, can generate bursts of variability that are not constant over time. These features are well–captured by GARCH models. In the GARCH(p, q) specification Bollerslev (1987), it is assumed that 
Combination weight specification
We consider Bayesian model averaging (e.g., see Bates and Granger, 1969) and assume time-varying combination weights. Following Costantini et al. (2016), we consider some of the most used forecasting performance measures to build the combination weights. The weights are specified based on a rolling estimate of the model’s performance measures (e.g., see Billio et al., 2013). Three groups of measures are considered: i) point forecast ability, ii) density forecast ability, and iii) economic evaluation. In the following,
The first group of measures includes: Mean Squared Forecast Error (MSFE), Exponential Mean Squared Forecast Error (EMSFE), Mean Squared Root Forecast Error (MSRFE), Discount Mean Squared Forecast Error (DMSFE), Mean Absolute Error (MAE), the Mean Absolute Percentage Error (MAPE), Hit/Success Rates (HR), and Exponential of Hit/Success Rates (EHR). The MSFE and EMSFE weights are:





HR and EHR are built using the DA measure:

The second group comprises measures of density-forecast ability, such as Log-Score (LS), Continuous Ranked Probability Score (CRPS), and Frequentist Model Averaging (FMA). Let ICℓ,s be the predictive information criterion of model 


The third group comprises two measures of the economic impact of forecast errors: the Economic Evaluation of Directional Forecasts (EEDF) and the Weighted MSFE (WMSFE). The EEDF is built on the Directional Value (DV) measure

Empirical analysis
Data description
The dataset comprises daily tourist visits to Shanghai from 1 December 2020 to 17 January 2022, covering all 16 administrative districts—Huangpu, Xuhui, Changning, Jing’an, Putuo, Hongkou, Yangpu, Minhang, Baoshan, Jiading, Pudong, Jinshan, Songjiang, Qingpu, Fengxian, and Chongming. It is derived from real-time positional data of mobile phone signals provided by Shanghai Unicom, the city’s second-largest mobile service provider. The dataset encompasses users from diverse telephone companies in proportions reflecting their market shares, and it is relied upon by the Shanghai municipal government for tourism flow prediction, underscoring its accuracy, inclusiveness, and institutional relevance. The final panel contains 409 daily observations per district (e.g., see Camatti et al., 2024). The target population comprises tourists visiting Shanghai’s districts during the study period. Operationally, a “tourist” is defined as a mobile phone user who records an overnight stay in a district either on the night prior to or following the visit, and whose activity is not attributable to other categories of users. China Unicom provided pre-filtered data to exclude residents, hikers, workers, students, and commuters. Under the intra-destination flow framework, a tourist is counted once per district per day, although multiple districts may be visited on the same day. Based on SIM card activation records, tourists are classified as either Shanghai locals or tourists from outside Shanghai. These clearly defined behavioral criteria ensure that the analytical population closely corresponds to visitors engaging with districts across Shanghai, thereby supporting data representativeness and comprehensive coverage of the defined tourist population.
The top plot in Figure 1 represents the trends in visits to Shanghai during the period from December 1, 2020, to January 16, 2022. We conducted a preliminary analysis of the dataset by examining the temporal dependence structure. The autocorrelation functions in Panel (b) allow for identifying persistence and seasonal effects. In addition, Phillips–Perron and augmented Dickey–Fuller tests reject the null hypothesis of a unit root at the 5% level for all series. Together, these results provide a compelling rationale for employing seasonal ARMA models to capture the dynamic structure of tourism flows across Shanghai’s districts. Shanghai visits data. Top: Millions of visits to Shanghai in the period from 1
st
December 2020 to 16
th
January 2022. The vertical dashed line highlights an outlier. Bottom: Autocorrelation (left) and partial autocorrelation functions (right), which are two measures of dependence of the current number of visits on the numbers in the days before (from 1 to 50).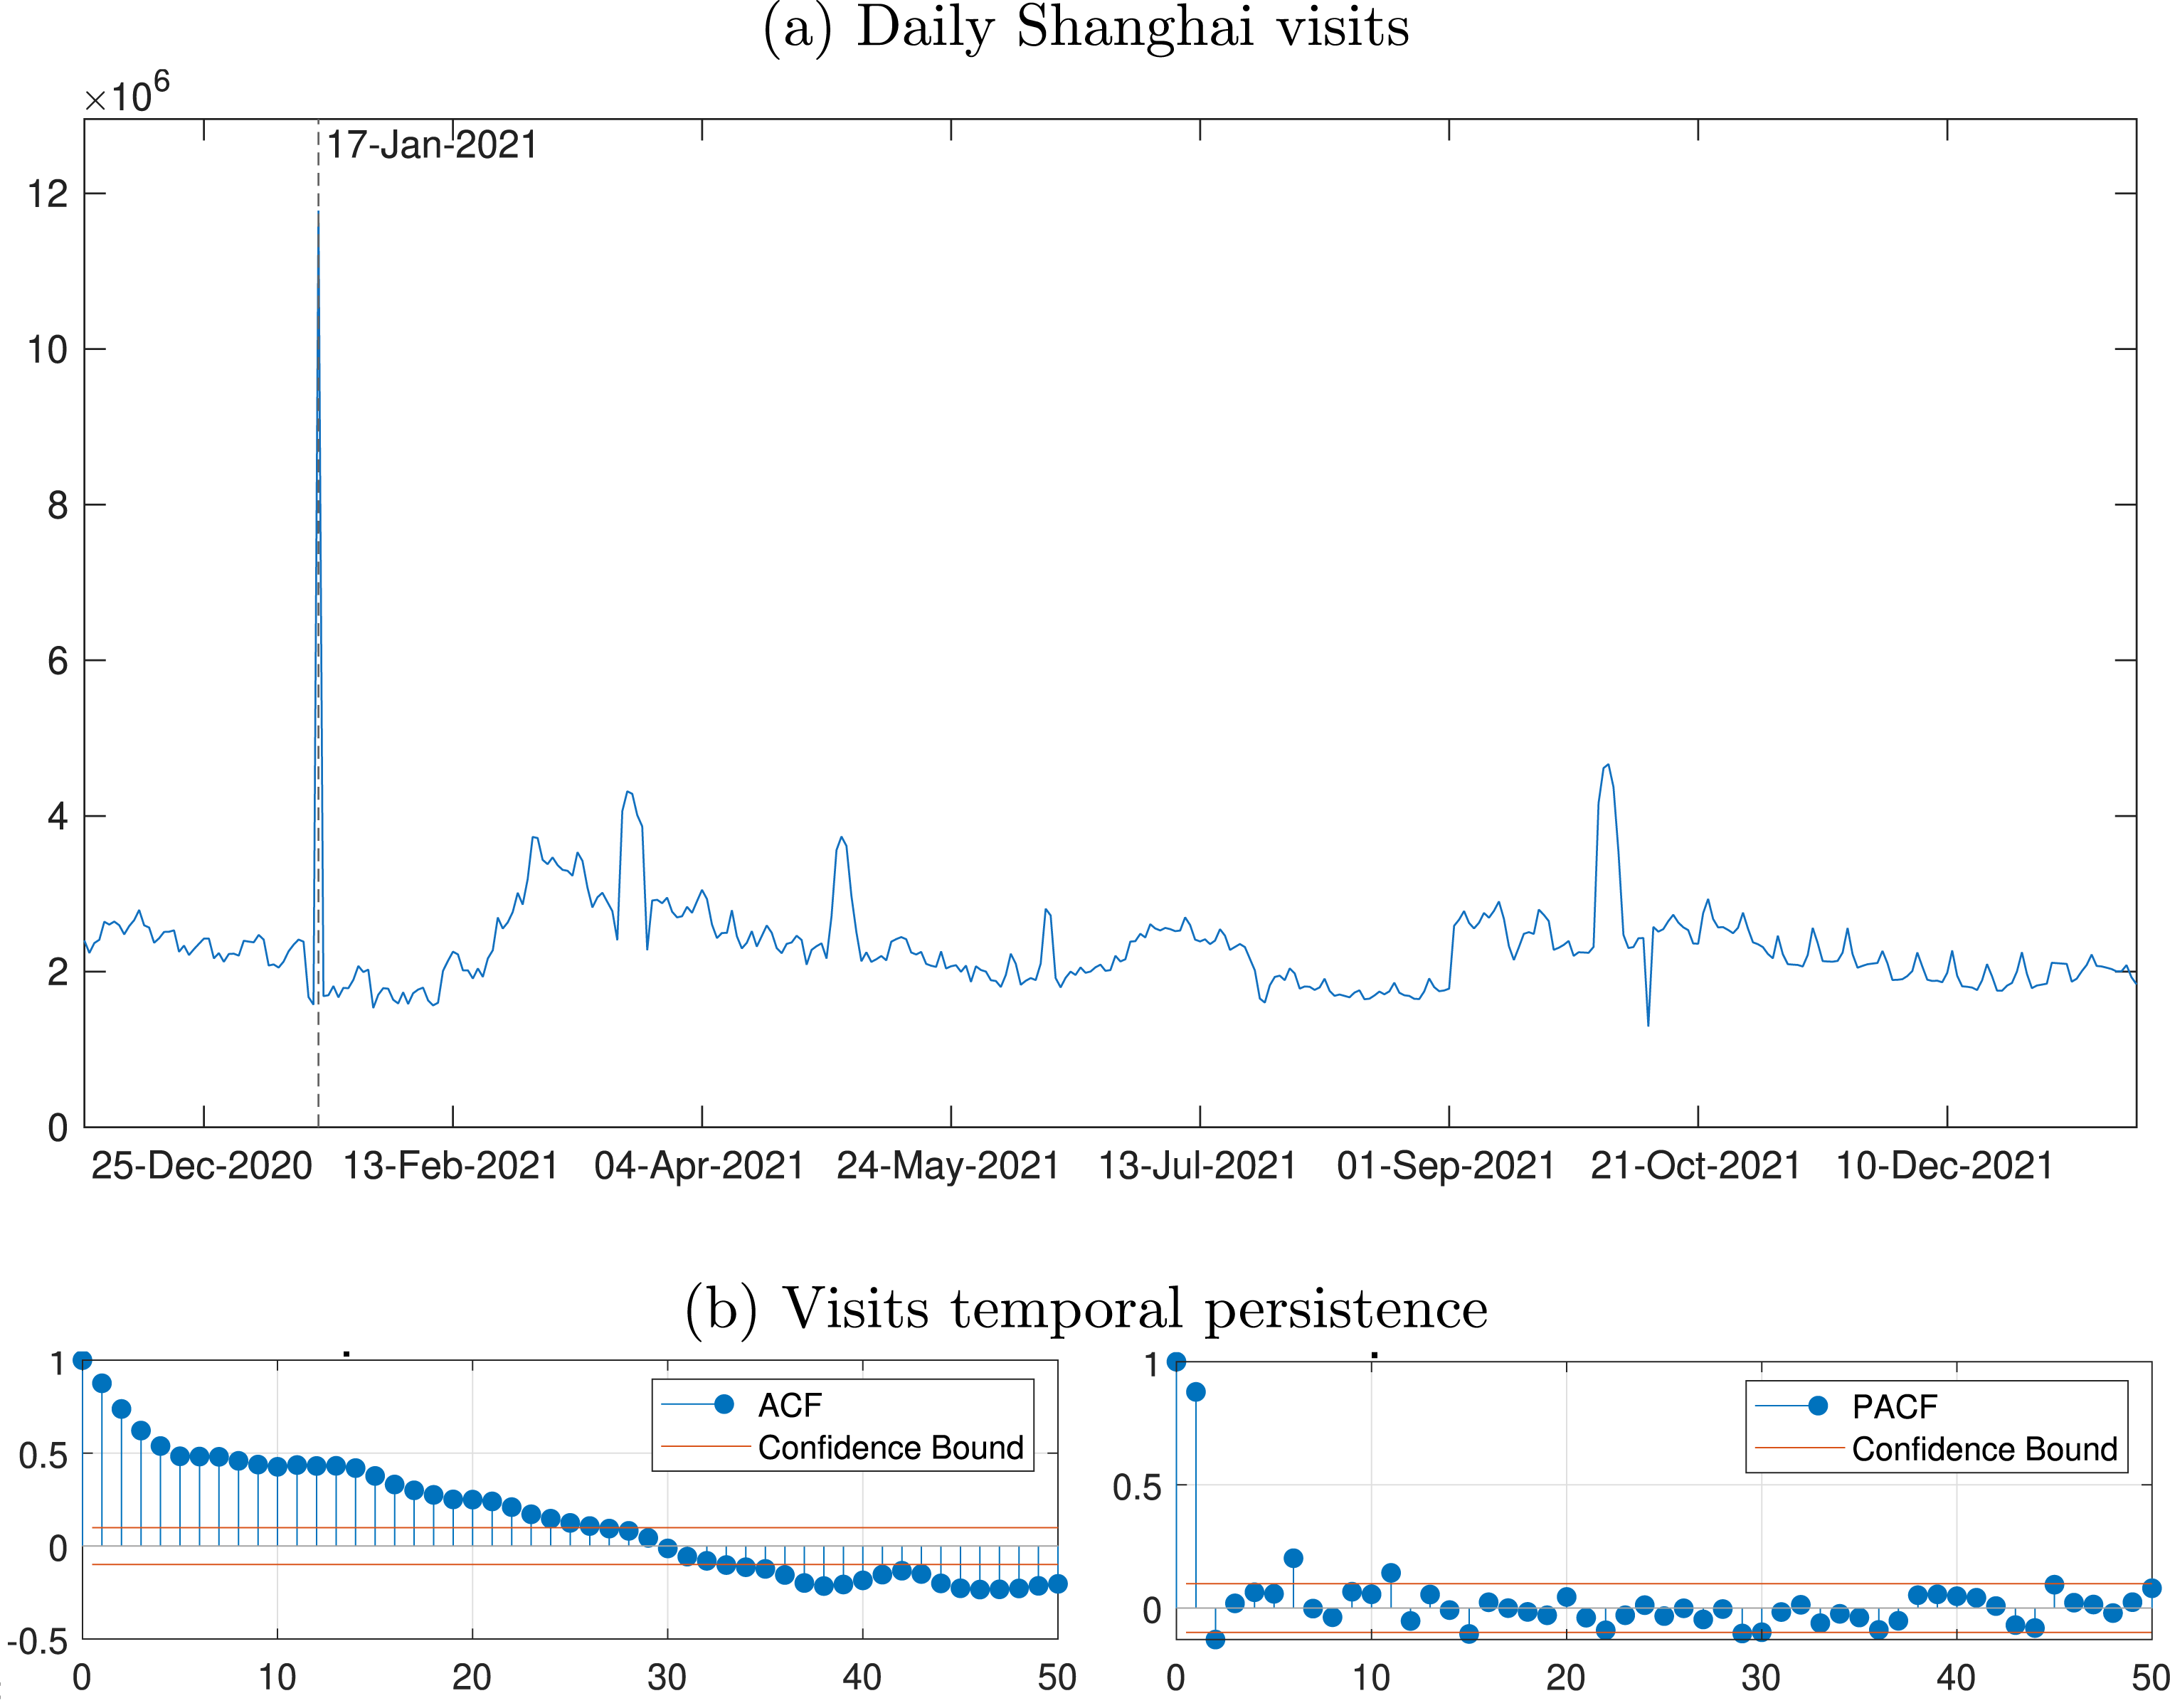
Model selection
We estimate the following 10 different SARIMA specifications. Following the literature, low-order AR and MA terms are adopted for the non-seasonal component, with first-order integration (e.g., Song et al., 2019; Wan and Zhang, 2009), while the seasonal specification is selected after a preliminary AIC-based analysis. Of the 20 models initially specified, we report results for the eight with the lowest AIC. GARCH components with lags of 1 and 2 are specified in line with the standard tourism time-series literature (e.g., Chan et al., 2005; Divino and McAleer, 2010; Tsui and Balli, 2017). Of the 7 GARCH models initially specified, we report results for the 2 with the lowest AIC.
The first three models in our set are two SARIMA(2, 0, 2)(24,0,0)5 without and with restrictions and a SARIMA(2, 0, 2)(24,0,0)5 without intercept: • • •
The second block of models includes a SARIMA(2, 1, 0)(16,0,0)5 and a SARIMA(0,1, 2)(16,0,0)5: • •
The third block includes three models without MA components, that are a SARIMA(1,1, 0)(16,0,0)5, a SARIMA(2,0, 0)(16,0,0)5 and a SARIMA(2,0,0)(24,0,0)5: • • •
The last block includes heteroskedasticity in the different model specifications. Namely, a SARIMA(2,0,2)(24,0,0)5 with GARCH(2,2) errors model and a SARIMA(2,0,0)(24,0,0)5 with GARCH(2,2) errors model: • •
Where for both models the GARCH(2,2) component writes as
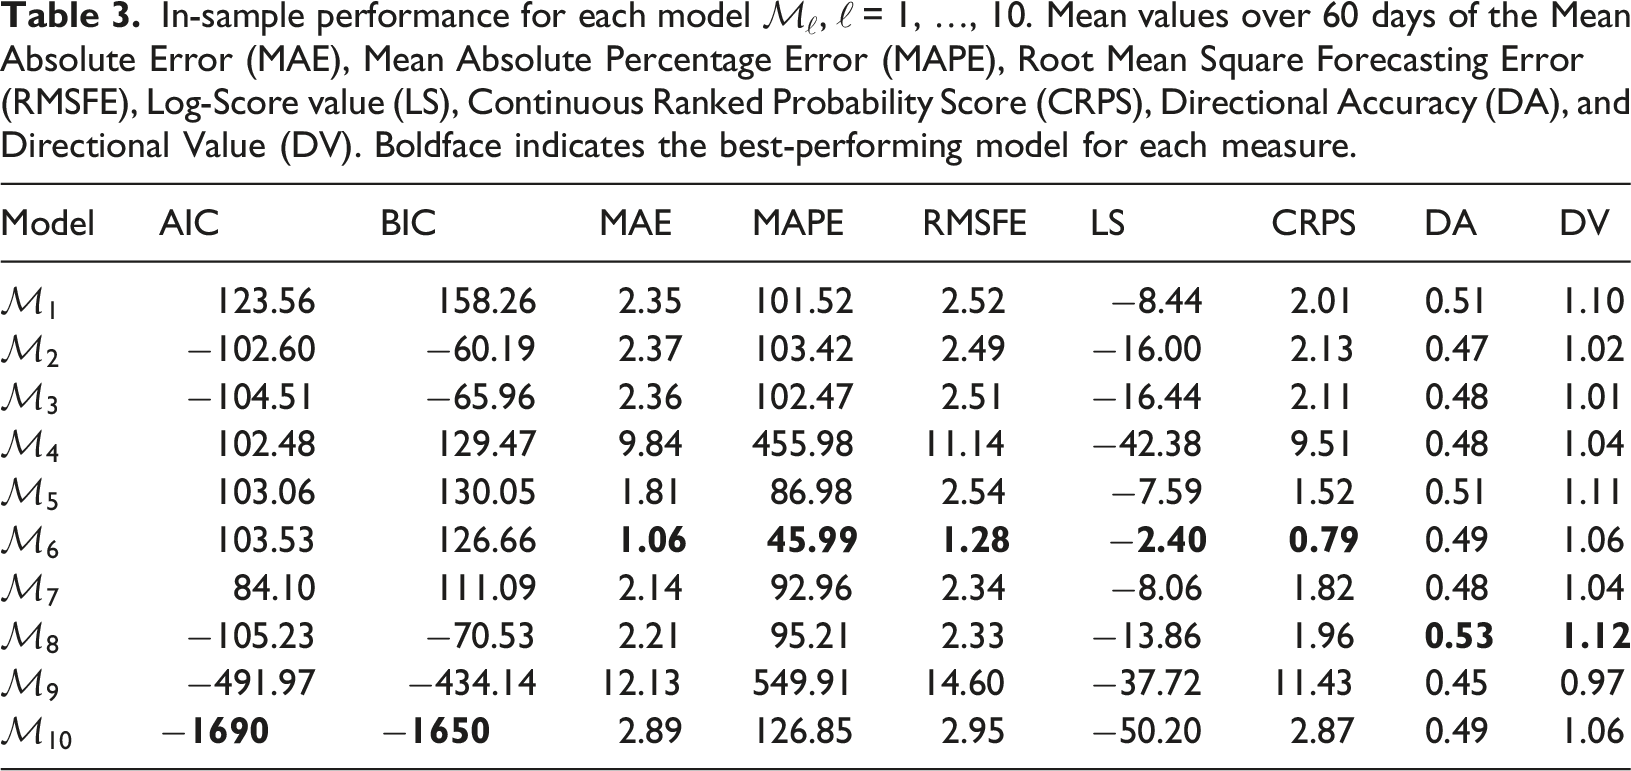
In-sample performance for each model
Prediction and combination
Panel (a) of Figure 2 shows the number of visits for the statistical area of Shanghai City from 01-Dec-2020 to 17-Jan-2022 (black solid line). In the same picture, the red dashed line shows the predicted daily number of visits (in Millions) from 18-Jan-2021 to 18-Mar-2022. The top plot shows forecasts for the model with the best in-sample and out-of-sample performance, that is, SARIMA(2,0,0)(24,0,0)5-GARCH(2,2) Panel (a): Forecasted visits (dashed red) using the best model 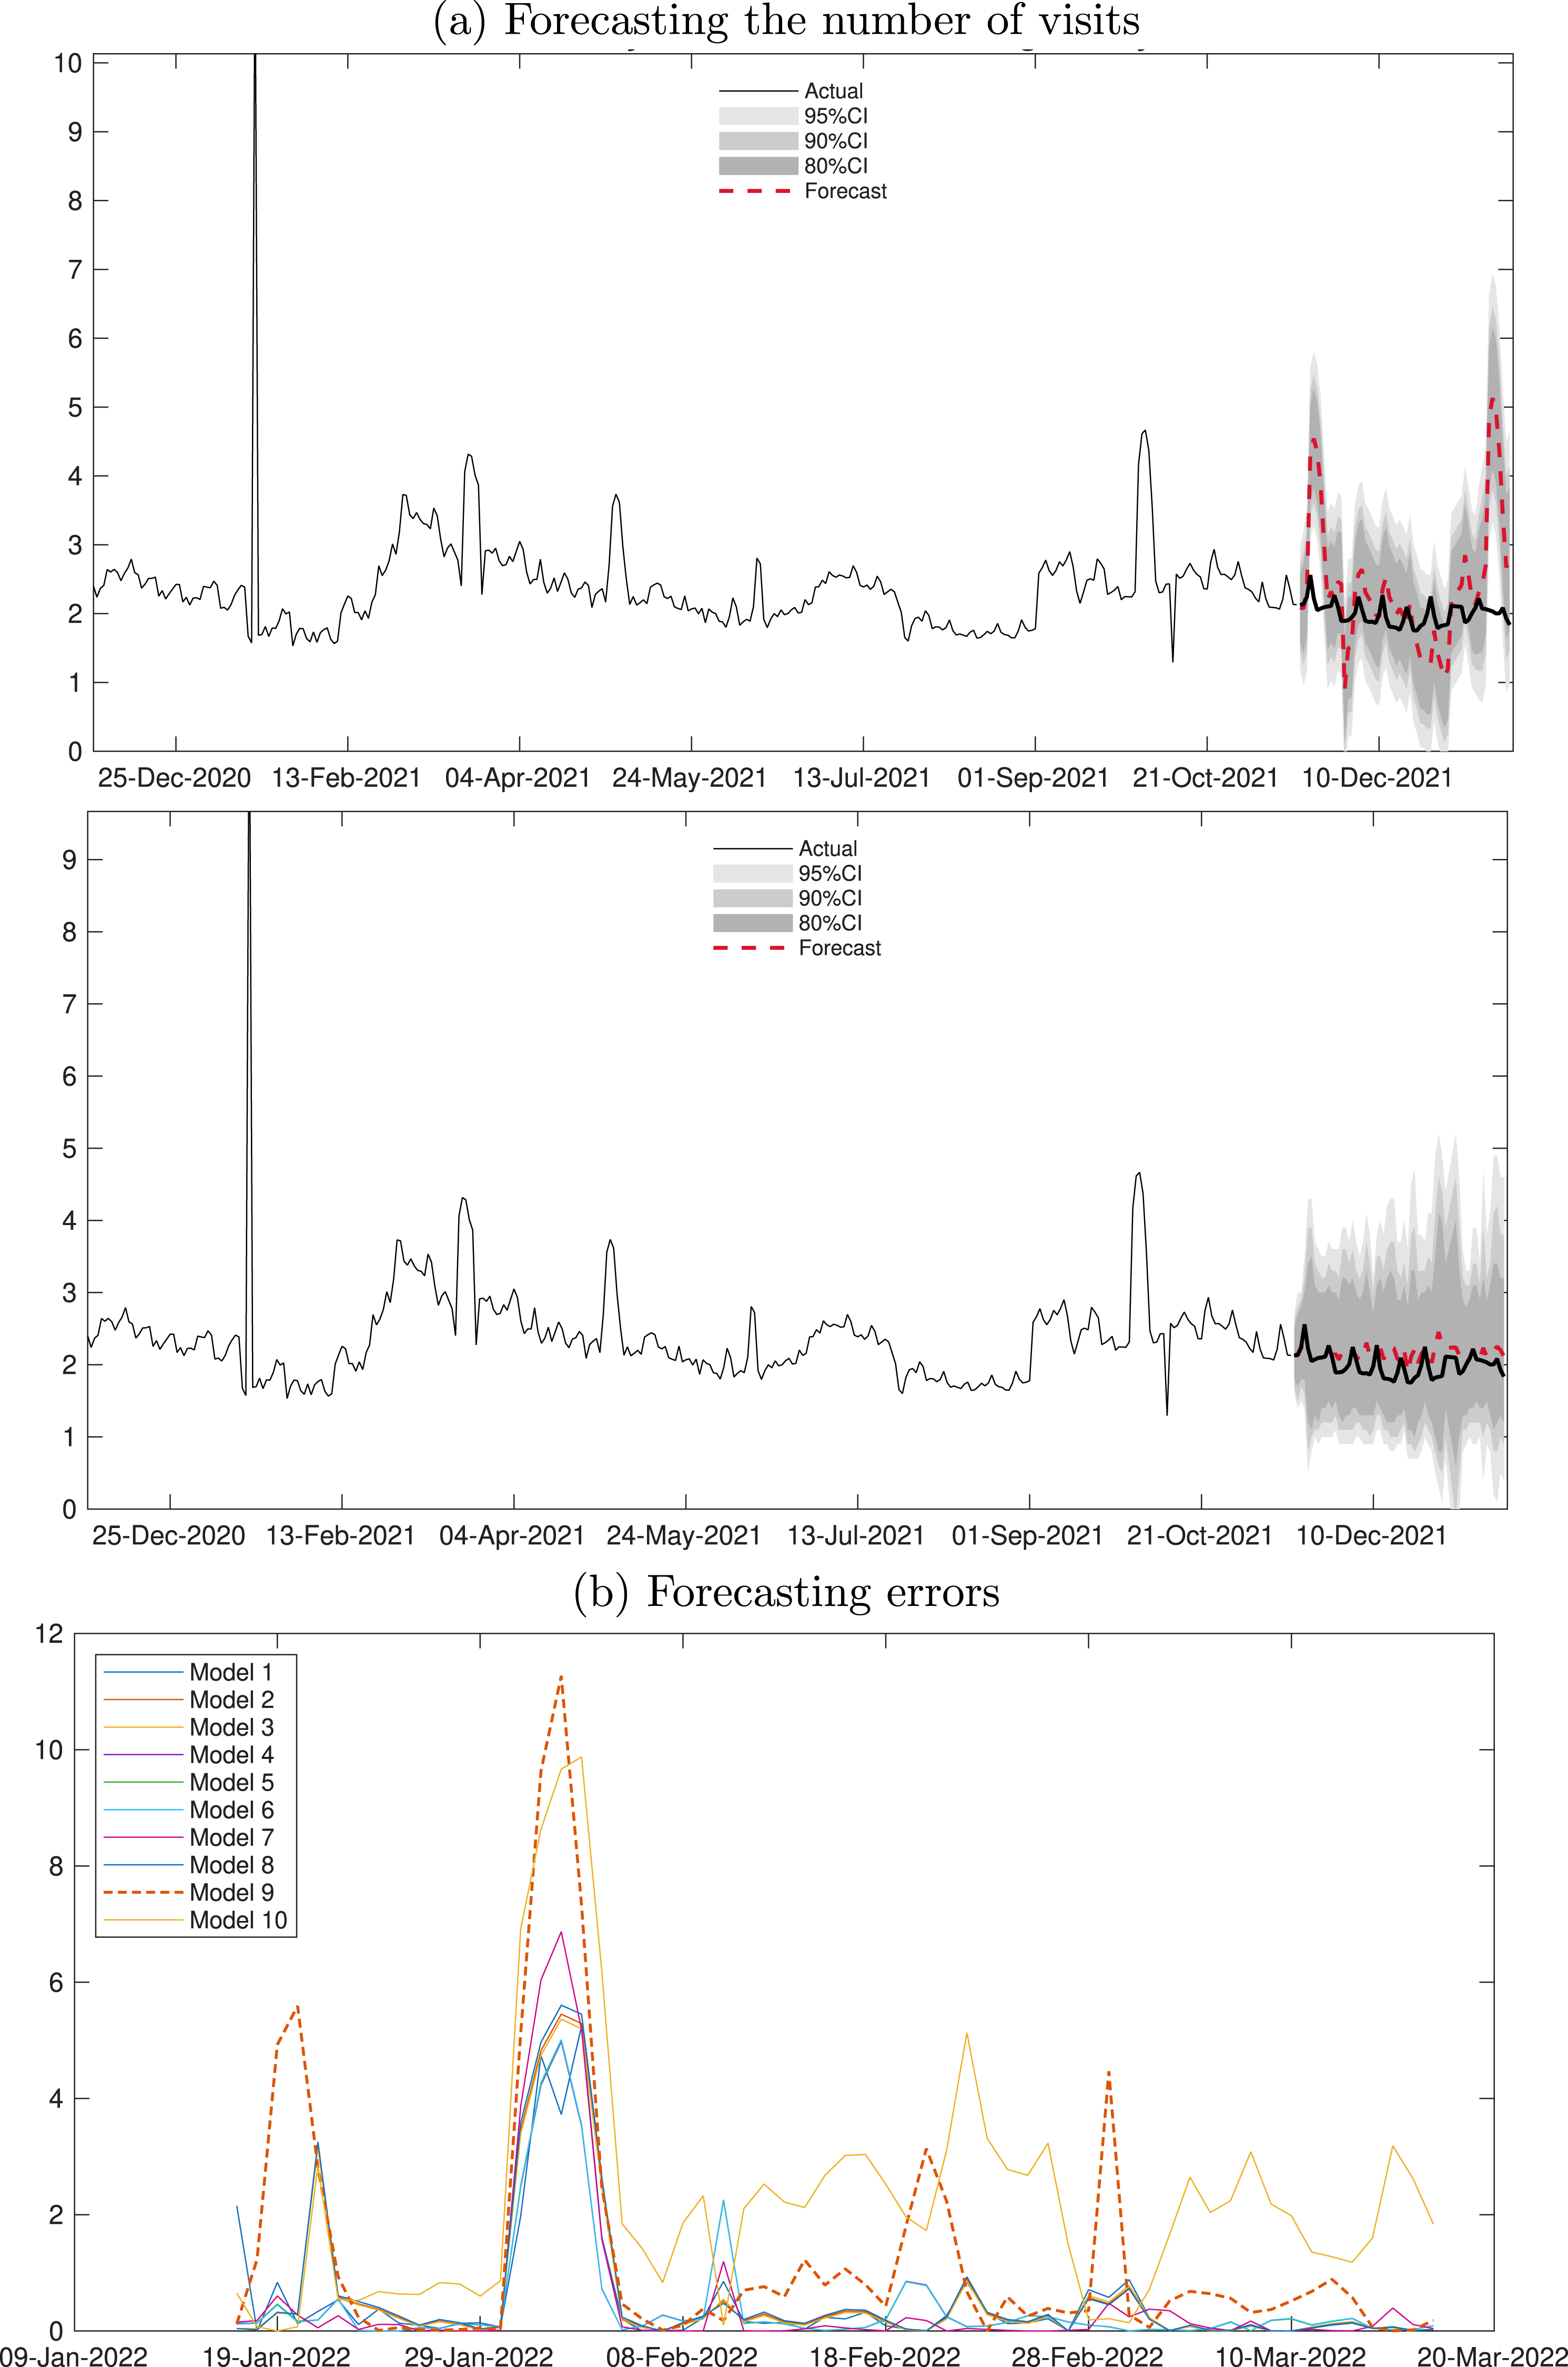
When integrating predicted values into a city management process, careful consideration of various scenarios and acknowledgment of prediction uncertainty are paramount. Recognizing the dynamic nature of visits, it is imperative to address potential variations in anticipated outcomes. To address this, our approach goes beyond mere point prediction based on a single model. We propose two strategies to deal with model uncertainty. The first one is based on using density prediction, where the density incorporates the uncertainty around the point prediction. The second strategy is based on dynamically combining predictions from different models, thus accounting for both possible model specifications and temporal variation in the data-generating process.
Regarding forecast uncertainty, we provide a more comprehensive depiction by including confidence intervals at different levels. For each model
Out-of-sample forecast accuracy evaluated sequentially for each model
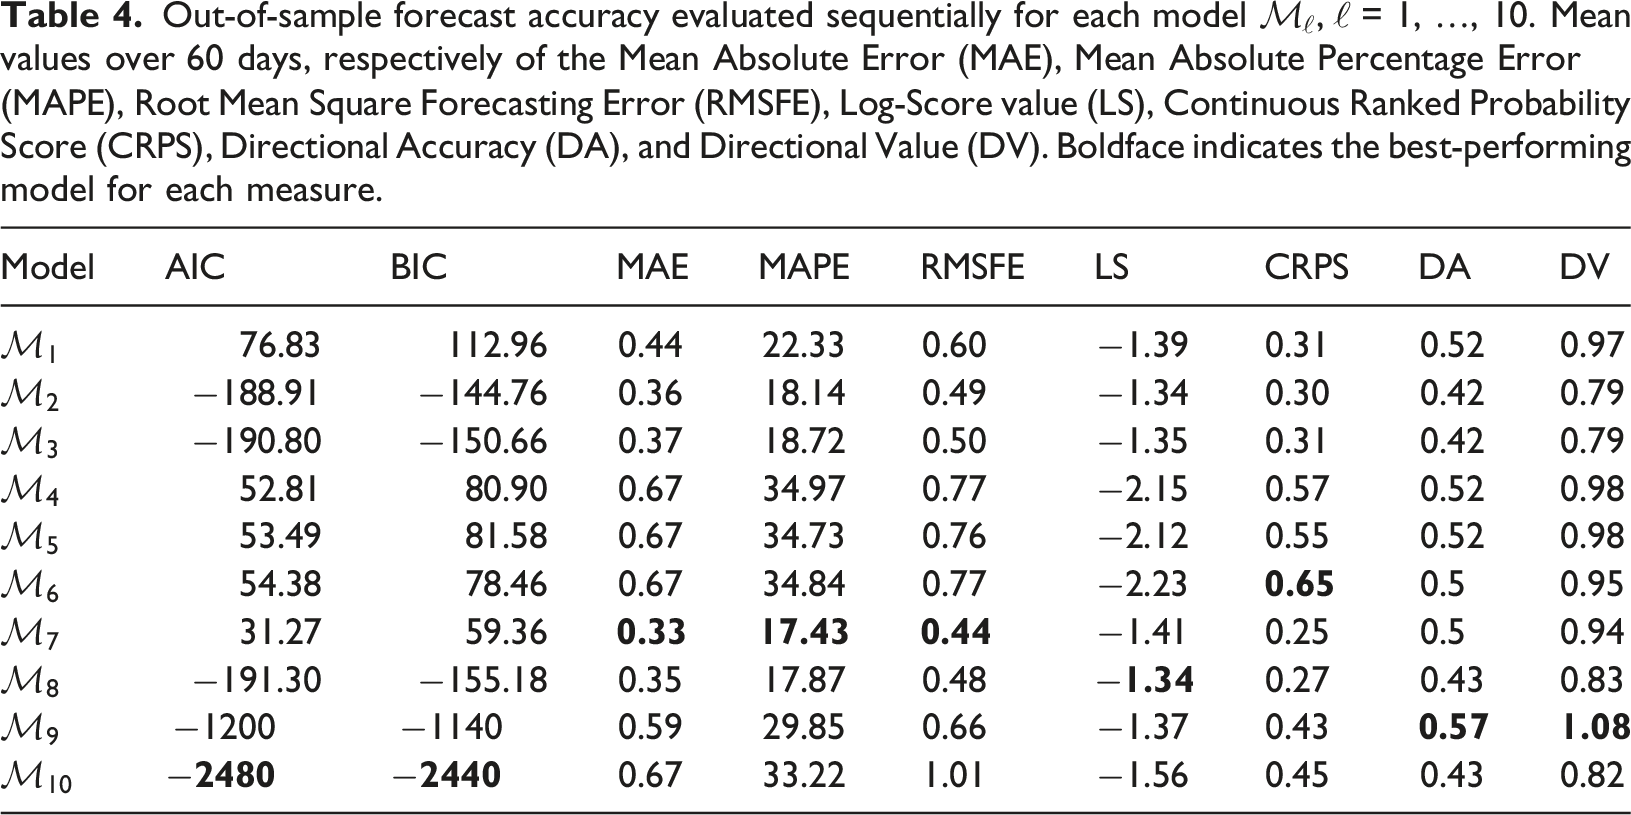
Combination weights
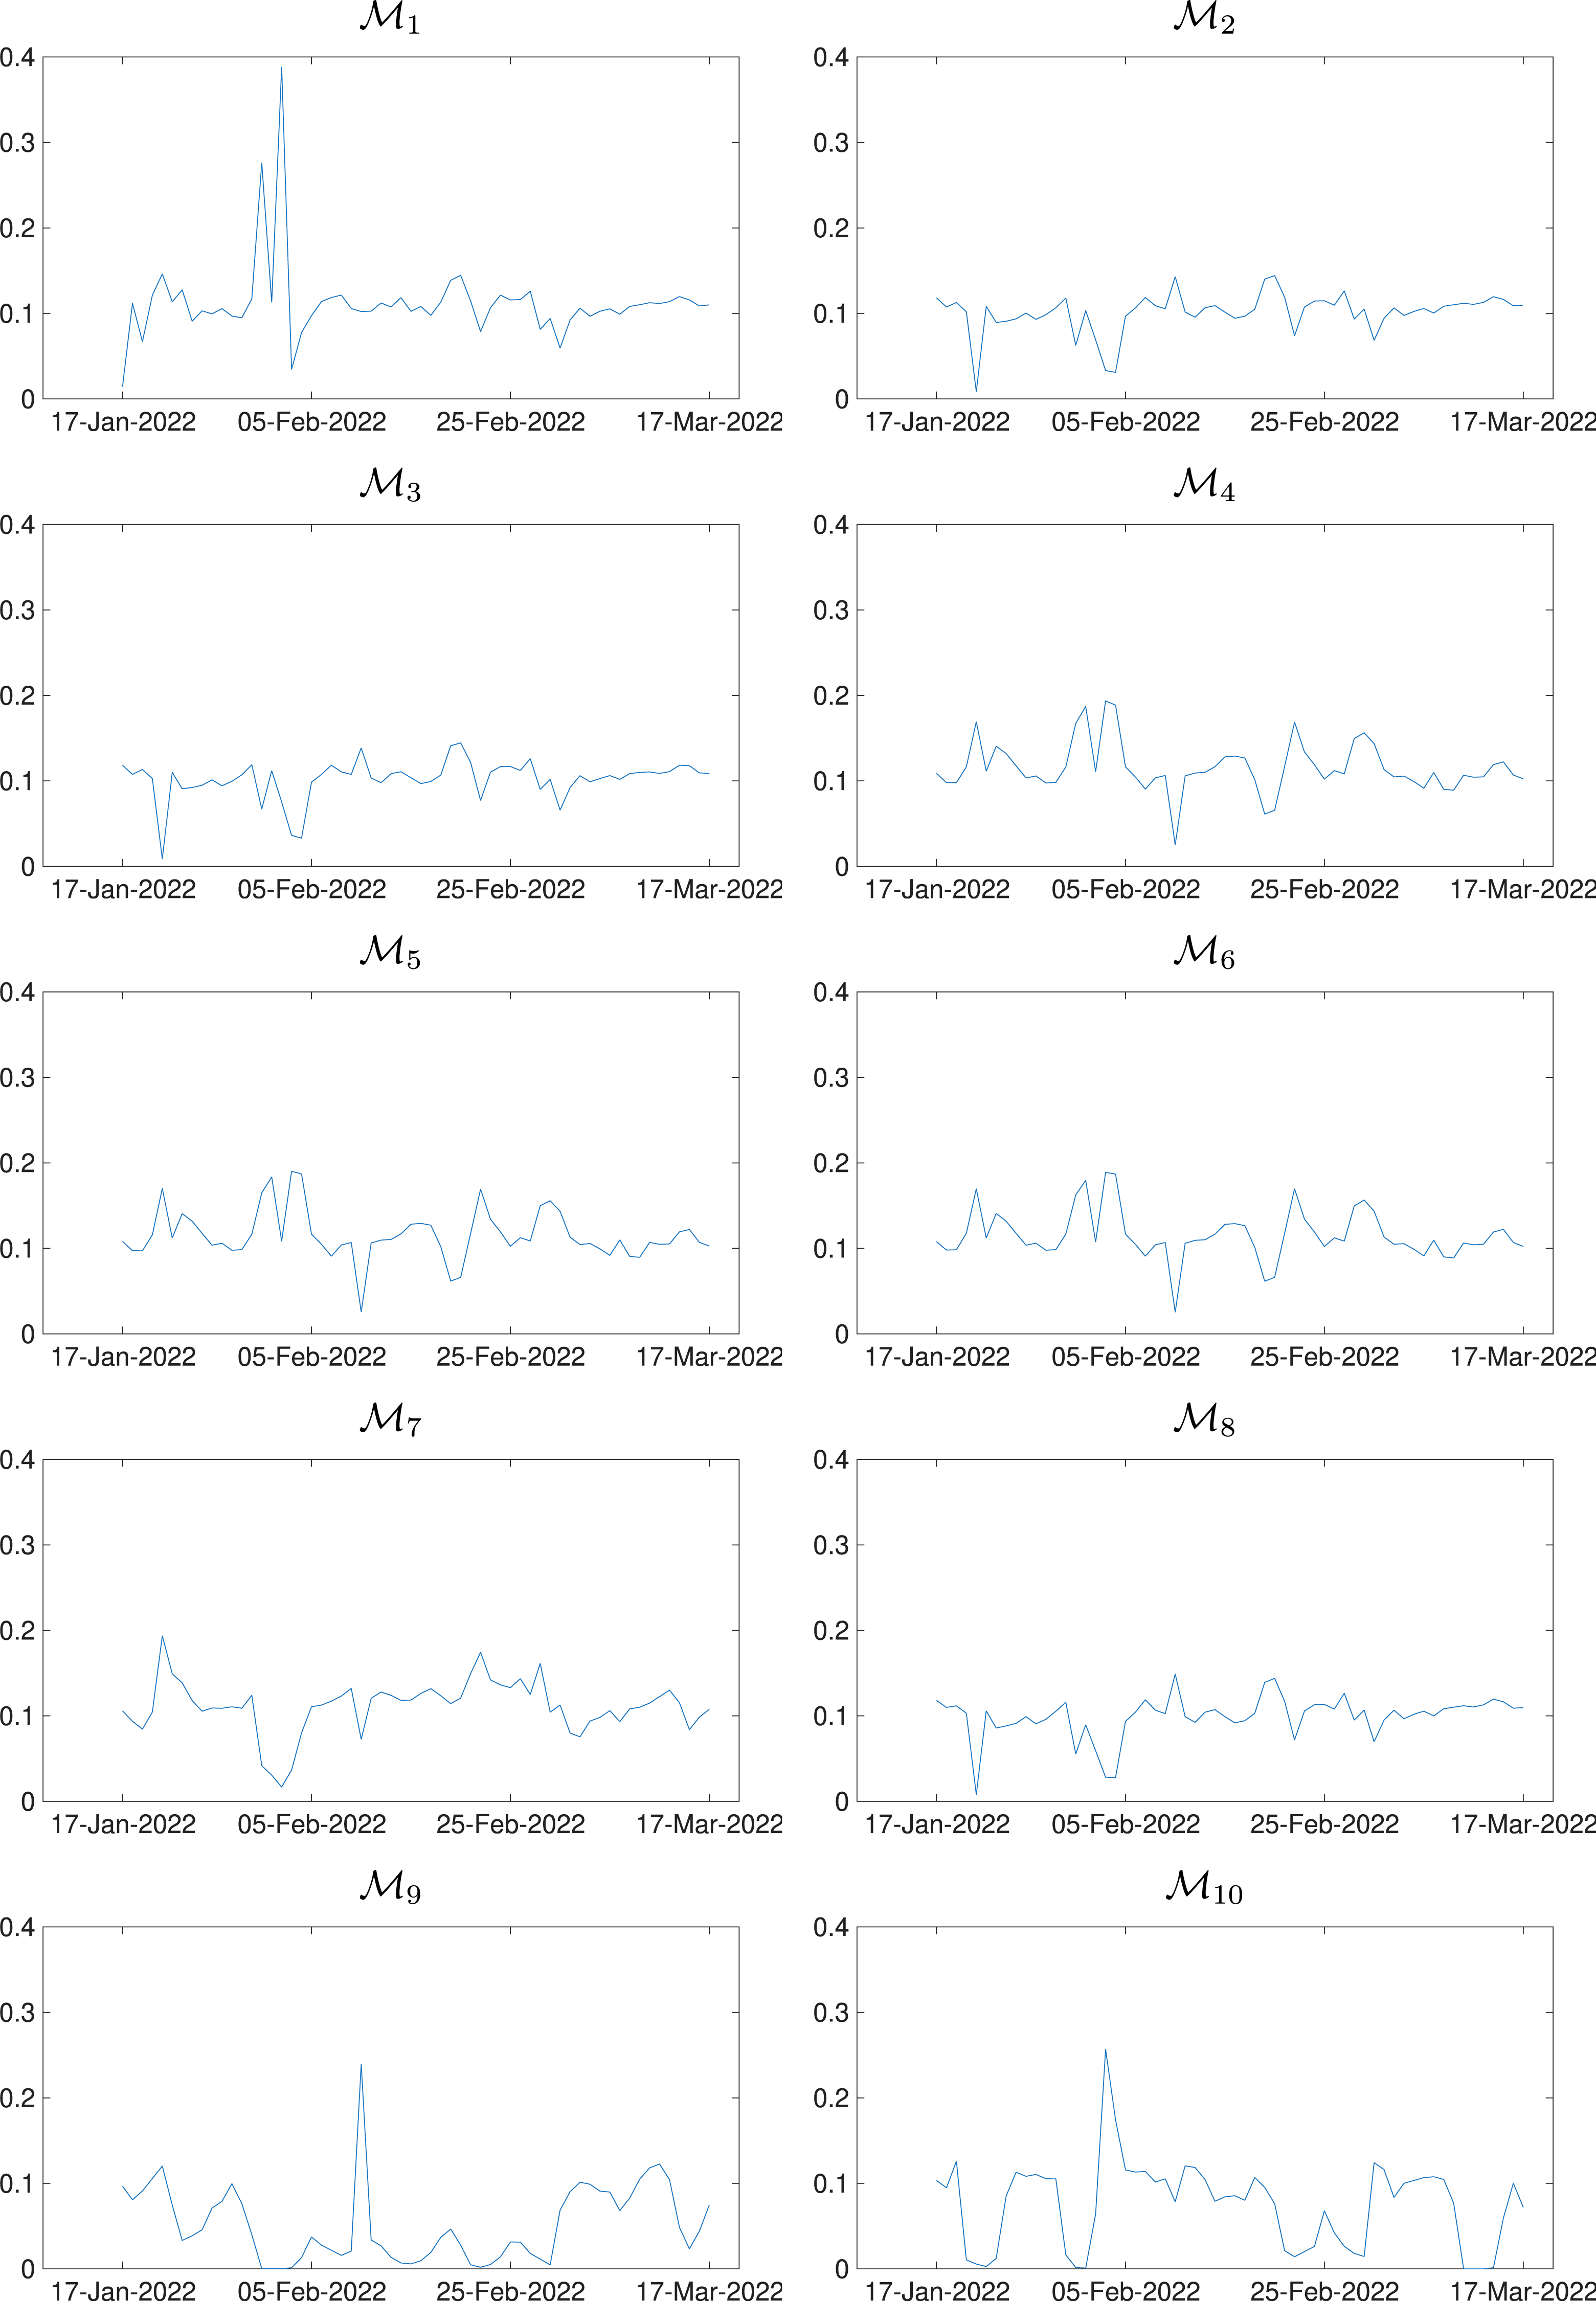
We apply BMA and use time-varying combination weights based on rolling estimates of the model’s forecasting performance measures. Panel (b) of Figure 2 shows the model MSFE over time, and Figure 3 shows BMA weights based on the MSFEs. There are periods, e.g., the beginning of January and February, when Models 1 and 4 outperformed, and other periods when Models 6 and 7 performed better. Models without GARCH effects outperform GARCH models, except during periods of higher series variability. The time variations in predictive ability are confirmed by other measures, which induce time variations in the BMA weights (see Figures C.18-C.19 in the Appendix). The time-varying nature of the problem naturally calls for either the sequential selection of the best model or the combination of models. We apply the different BMA procedures presented in the previous section and obtain the out-of-sample point and density predictions reported in Figures C.16-C.17 of the Appendix. The BMA specifications exhibit different levels of forecasting errors (see Panel (a) of Figure 4). In our results, BMA based on MAE, MAPE, and RMSFE (top left) yields nearly identical errors; similarly, FMA based on AIC, BIC, and HQ (bottom right) yields similar errors. BMA-LS and BMA-CRPS exhibit different performance, with BMA-CRPS usually performing better (bottom right). The BMA based on DA, performs worse than its exponential version, that is, the BMA-EHR (middle-right). On average, the point-forecast performance of BMA-MSFE is superior to that of the other weighting strategies. In particular, it also outperforms the best individual model, as shown by comparing the black lines in the left and right plots of Panel (b) in Figure 4. This indicates that the combination based on MSFE weights can exploit the information across the different models more effectively than relying on a single specification. The out-of-sample point and density forecast of the BMA-MSFE is reported for comparison purposes in the second plot of Panel (a) of Figure 4. The best model combination provides a better fit to seasonality and variability than the best individual model (compare with the first plot in the same panel). Regarding the forecast CIs coverage, there are three groups of models. The predictive intervals of the models with the best density forecasts (large CRPS), Forecasting errors (in logarithms). Panel (a) Alternative BMA specifications. Panel (b) BMA with MSFE weights (left) and the best model (right). Model weights wℓ,t are based on MSFEs (black) and 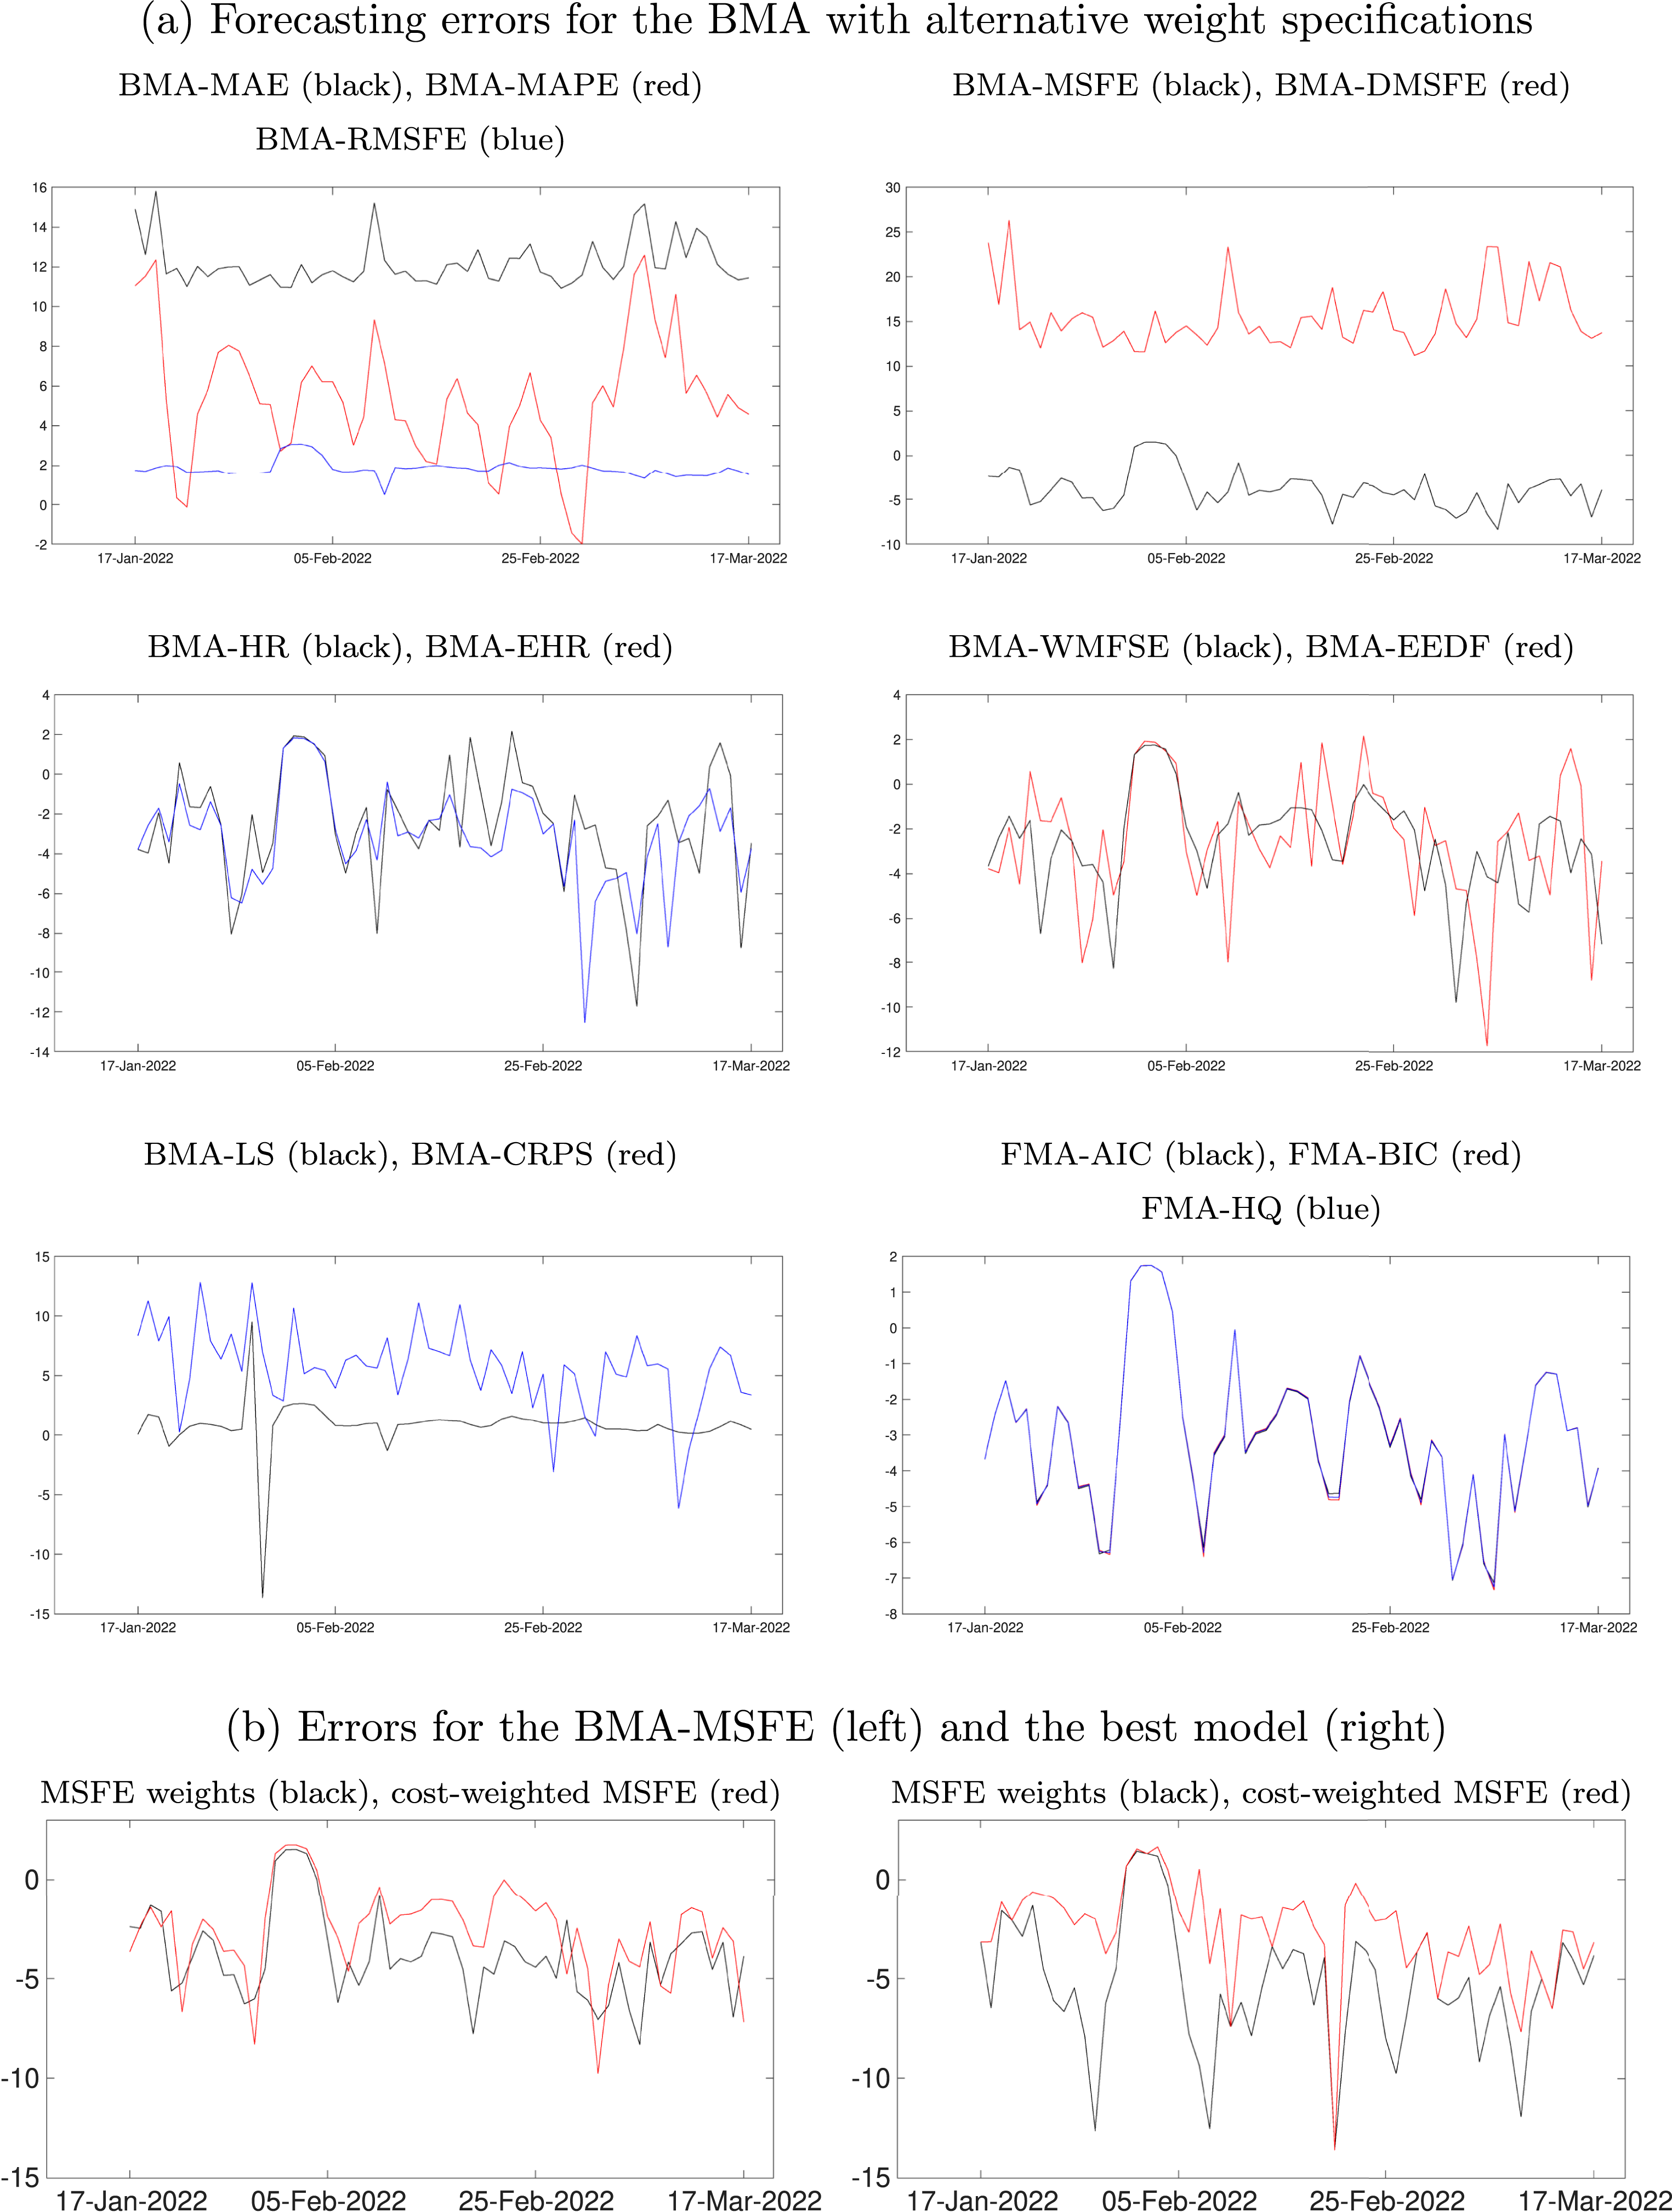
Among the various urban dimensions affected by tourism, waste management is among the most significantly affected, as increased visitor flows often strain existing collection and disposal infrastructure (e.g., see Xiao et al., 2020; Yuxi et al., 2023). Thus, one can expect that the economic implications of a forecast error differ depending on whether the cleaning and waste management system is operating under high or low pressure. Indeed, large forecasting errors tend to occur during holiday periods when visit volumes spike. Cost-based weighting schemes reduce the influence of these large errors and tend to favor models that perform more reliably during non-holiday periods. To exploit the economic relevance of forecasting error, we use the average daily and per-visit cleaning costs. We assumed an average cost of 178 (in 10,000 Yuan/Day) and 2.3 million visits per day during the non-holiday periods and 440 (in 10,000 Yuan/Day) during holidays, with 12 million trips (Culture and Bureau, 2024). The relative cost per day and visit, c s , is equal to 0.7 during non-holiday periods and 0.3 during holiday periods. With these weights, the WMSFE is computed for each model as in equation (18).
The two plots in Panel (b) of Figure 4 show the errors (in logarithms) of forecasts based on equally weighted errors (black line) and on cost-weighted errors (red line). The forecasting errors for prediction averaging and the best model are shown in the top and bottom plots, respectively. In the Appendix, Figure C.20 shows the MSFE-based and cost-based weights for each model. Comparing the results in the two plots shows that a model combination strategy yields smaller forecasting errors than a prediction strategy that selects the best model. In addition, comparing the red and black lines shows that using a cost-weighted combination or selection strategy can reduce forecasting errors. Finally, among measures that incorporate an economic value component, BMA-WMFSE performs better than BMA specifications based on more standard default measures, such as EEDF (see the middle–right plot of Panel (a)). This result suggests that the proposed cost-weighted measure is more effective at capturing the relevant economic trade-offs embedded in the forecasting exercise and leads to improved forecast-combination performance.
Conclusion
Using Big Data and predictive models is crucial when making timely policy decisions for tourism management. Usually, when predicting tourist flows, multiple models are applied, which adds uncertainty and poses challenges for their use in supporting policy-making. We propose a flexible yet straightforward procedure based on forecast combination models to address model uncertainty in decision-making. First, using Telcom Big Data to forecast daily visits to Shanghai, we show that model uncertainty arises when using prediction models from classes commonly used in practice, such as ARIMA, ARIMA with seasonal and GARCH effects.
The empirical analysis identifies SARIMA with seasonal dynamics and heteroskedastic errors (GARCH) as the most suitable model class for forecasting tourism flows. This model class performs consistently well both in-sample and out-of-sample, demonstrating robustness in estimation and forecasting. However, forecasting accuracy varies over time, suggesting that reliance on a single model may not always be optimal. For this reason, forecast combination strategies prove particularly valuable. By integrating information from multiple models rather than relying exclusively on a single best specification, combined forecasts achieve lower prediction errors and greater stability over time. This improvement becomes even more pronounced when cost-weighted combination methods are employed, as they allow the forecasting framework to place greater emphasis on models that perform better under specific conditions. These findings underscore the value of flexible and adaptive forecasting frameworks in tourism analysis, where uncertainty and rapid changes in demand patterns are intrinsic features of the sector.
From a policy perspective, these findings carry important implications for tourism destinations. The results provide practical evidence that more accurate forecasting tools can significantly support public decision-making. Improved predictions of tourism flows allow policymakers and destination management organizations to anticipate demand fluctuations, mitigate congestion during peak periods, and better plan infrastructure, mobility systems, and visitor services. More reliable forecasts also help optimize the allocation of public resources, enabling authorities to design and implement policies that balance tourism growth with sustainability objectives and the well-being of local communities. Moreover, the results highlight the strategic importance of integrating diverse data sources and analytical approaches into tourism governance. The increasing availability of Big Data—particularly high-frequency mobility data—creates opportunities to expand operational management tools and develop more flexible analytical frameworks. In this context, the ability to combine different modelling approaches becomes particularly valuable, as it allows policymakers to continuously incorporate new data streams and methodological advances. Such an adaptive analytical environment supports more responsive, evidence-based tourism management and strengthens destinations’ capacity to address complex challenges related to demand volatility, resource management, and sustainable development.
Despite these encouraging results, some limitations remain. The modelling framework relies on traditional time-series specifications and could be further improved by exploring hybrid approaches that combine statistical and machine learning methods. Moreover, the analysis focuses on a specific dataset and context; future research should test the proposed models across different destinations and time horizons to assess their generalizability and to support the development of more adaptive forecasting tools. Future research should also focus on improving data availability at the individual point-of-interest level, with the aim of testing the applicability of the models developed in this study at a finer spatial scale and analysing tourism dynamics across individual attractions within the same city. Such developments could provide policymakers with more detailed information to support the planning and management of tourism services.
Supplemental material
Supplemental Material - Forecasting daily visits in Shanghai with Model combination and Telco big data
Supplemental Material for Forecasting daily visits in Shanghai with Model combination and Telco big data by Nicola Camatti, Giulia Carallo, Roberto Casarin, Xiang Feng in Tourism Economics
Footnotes
Acknowledgments
The computation has been performed using MATLAB through the HPC cluster at the Venice Centre for Risk Analytics at Ca’ Foscari University of Venice.

Funding
The authors disclosed receipt of the following financial support for the research, authorship, and/or publication of this article: RC acknowledges the support from the European Union - Next Generation EU - Project ‘GRINS - Growing Resilient, INclusive and Sustainable’; the National Recovery and Resilience Plan (NRRP) PE00000018.
Declaration of conflicting interests
The authors declared no potential conflicts of interest with respect to the research, authorship, and/or publication of this article.
Data Availability Statement
The complete reproducibility package can be accessed at: https://doi.org/10.24433/CO.3148292.v1. (Giulia et al., 2026)
Supplemental material
Supplemental material for this article is available online
Author biographies
References
Supplementary Material
Please find the following supplemental material available below.
For Open Access articles published under a Creative Commons License, all supplemental material carries the same license as the article it is associated with.
For non-Open Access articles published, all supplemental material carries a non-exclusive license, and permission requests for re-use of supplemental material or any part of supplemental material shall be sent directly to the copyright owner as specified in the copyright notice associated with the article.
