






Abstract
Regional tourism economies are characterized by uneven development and spatially dependent growth, yet existing work tends to address potential measurement, dynamic evolution, and spatial spillovers in isolation rather than within an integrated framework. Drawing on panel data from Southwest China for 2011–2024, this study measures tourism economic development potential (TEDP) using the entropy-based TOPSIS method, characterizes its temporal evolution through kernel density estimation, and identifies spatial spillover effects with spatial econometric models. TEDP in the region follows an upward trajectory alongside persistent intra-regional disparities. Tourism revenue leakage inhibits local TEDP, whereas residents’ income, per capita consumption expenditure, education level, and digital technology positively drive it. High-potential areas generate positive spillovers on adjacent regions, though revenue leakage attenuates these effects. The integrated measurement–evolution–spillover framework offers a transferable analytical template for evaluating regional tourism economies and informing differentiated coordination strategies.
Keywords
Introduction
Against the backdrop of the recovery of the global tourism market and the coordinated development of the regional economy, Southwest China has become a key area with great vitality and potential in the tourism economy (TE) by virtue of its unique natural landscape and profound human resources. The region covers three provinces, one city, and one autonomous region, namely Sichuan, Chongqing, Yunnan, Guizhou, and Tibet. The natural landscape is rich and diverse; the cultural treasures are colorful; and the advantages of tourism resource endowment are outstanding (Yu et al., 2024). In recent years, national strategies have been promoted. The transportation infrastructure in Southwest China has continued to improve, and digital technology has accelerated its penetration, injecting strong impetus into the TE (Zhao et al., 2025b). The total tourism income of Yunnan, Sichuan, and other provinces has grown rapidly over many years. This shows great vitality and strong momentum (Li et al., 2025a). However, behind the prosperity, the TE in Southwest China is also facing challenges, such as unbalanced development within the region, low efficiency of resource integration, and insufficient spatial spillover effects, which restrict its progress towards high-quality and sustainable development (Ren et al., 2025). Consequently, it holds substantial importance to explore the development potential, dynamic evolution law, and spatial spillover effect of the TE in this region to boost the coordinated evolution of the regional TE.
In the realm of theory, although the existing research on tourism economic development has achieved certain results, it places greater emphasis on the impact of a single region or specific factors on TE growth, and the cross-regional and multi-dimensional comprehensive analysis of tourism economic development potential (TEDP) and its dynamic evolution and spatial spillover effects is insufficient. Especially in the southwest region, the geographical environment is complex, the ethnic culture is diverse, and the regional differences are significant (Luo et al., 2025; Zheng et al., 2025). How to scientifically and comprehensively measure the TEDP, grasp the dynamic change trend, and analyze the mechanism of the spatial spillover effect represents a pressing issue demanding immediate resolution within the realm of TE research. This study uses the entropy TOPSIS method, density analysis method, and spatial econometric model to construct an analytical framework covering multiple dimensions such as tourism quality, economic structure, and infrastructure support, which can more comprehensively and accurately measure the TEDP in Southwest China, reveal its dynamic evolution law and spatial spillover effect transmission mechanism, and provide new perspectives and ideas for enriching the theory of regional TE development. From a practical perspective, the research results can provide a strong decision-making basis for governments at all levels in the southwest region to devise scientifically-grounded and rational tourism development strategies, enhance the distribution efficiency of tourism resources, and strengthen regional tourism cooperation. By accurately identifying the merits and demerits of tourism-driven economic growth in various regions, governments can clarify the designation and function of different regions in regional tourism development, guide resources to gather in high-potential regions, facilitate the synchronized advancement of the regional TE, and bolster its holistic competitiveness.
Drawing upon the longitudinal dataset about Southwest China spanning the period from 2013 to 2024, this paper calculates the entropy value of each index in potential measurement to determine the weight, and comprehensively evaluates the TEDP in each region, avoiding the limitation of subjective weighting, and improves the objectivity and accuracy of evaluation. In terms of spatial distribution characteristics, the potential density map is drawn to intuitively show the degree of agglomeration and spatial differences. The dynamic evolution analysis uses the density analysis method to dynamically track, reveal the law, and identify the “growth club” and “recession trap”. In terms of spatial spillover effect, the spatial lag model and spatial error model are constructed to quantitatively analyze the influence degree and direction of surrounding areas on the region, and reveal the mechanism and conduction path.
Literature review and theoretical line
Literature review
Over the past few years, with the vigorous development of global tourism and the metamorphosis and enhancement of the domestic consumption structure, the TE, serving as a significant component within the national economic framework, has become increasingly prominent in its strategic position (Guodong et al., 2025; Yin and Feng, 2025). To further stimulate and unleash the latent capacity of tourist spending and foster the superior-caliber advancement of the tourism sector, a series of policy documents have been issued at the national level, providing solid policy support for the sustainable prosperity of the TE. As a landmark policy document, Several Measures on Releasing the Potential of Tourism Consumption to Promote the High quality Development of Tourism Industry (No. 36 issued by the State Council) clearly puts forward specific measures such as increasing the provision of premium-grade tourism offerings and amenities, stimulating tourism consumption demand, strengthening inbound tourism work, and improving the comprehensive ability of the industry, which points out the direction for the all-encompassing advancement of the tourism economic system. Under the background of this policy, research on the TEDP is increasing. By conducting a methodical examination of pertinent literature, one may discern that the existing research mainly focuses on three aspects: index construction, research methods, and empirical analysis, and shows a trend of multidisciplinary integration.
In terms of index construction, scholars generally emphasize the importance of the construction of a multi-dimensional index system for comprehensive and accurate measurement of TEDP. Early studies focused on a single indicator, such as tourism income and tourist arrivals (Dimitriadou et al., 2025; Lee and Pennington-Gray, 2025). But with the deepening of research, scholars have come to recognize the complexity of the TEDP, and have commenced to construct a comprehensive index system including resource endowment, market demand, industrial efficiency, policy support, infrastructure, and other dimensions (Xue et al., 2026). For example, some studies have comprehensively evaluated the regional TEDP by constructing an index system (M. Ghoochani et al., 2020) including natural landscape, human resources, traffic conditions, tourism service facilities, etc.; some studies incorporate emerging factors such as the digital economy and innovation capabilities into the indicator system to reflect the new trends in the advancement of TE (Li and Zhang, 2025). These studies provide a useful reference for this paper to construct a scientific and reasonable measurement index system of TEDP.
At the level of research methods, scholars have employed multiple approaches to assess the TEDP and analyze the influencing factors. In terms of potential measurement, subjective and objective weight - assigning techniques, for instance, the entropy-based approach and the analytical hierarchy procedure, are widely used to avoid the subjectivity of a single method and improve the accuracy of evaluation results. For example, some studies have used the entropy method to comprehensively evaluate the regional TEDP (Yin and Feng, 2025) and achieved good results. In the analysis of influencing factors, scholars mostly use regression analysis, space-based econometric frameworks, along with geographic-factor detection methodologies, for the purpose of revealing the driving mechanism and spatial effect of different factors (Wang et al., 2021). For example, the panel regression model can test the significant impact of urbanization development, transportation infrastructure, policy support, and other variables on the TEDP (Tan et al., 2025b; Yu et al., 2024), and the spatial model further captures the spillover effects between adjacent areas and finds that tourism investment exerts a beneficial influence on the potential of local and surrounding areas (Ekonomou and Halkos, 2025; Zhao et al., 2025a). In addition, by analyzing the interaction of factors, the geo-detector identifies collaborative driving modes such as “resource endowment × innovation level”, which provides a basis for differentiated policy formulation (Polukhina et al., 2025). These methods reveal the complex dynamic mechanism of tourism economic development from multiple dimensions and scales.
At the level of empirical analysis, scholars have carried out extensive empirical investigations on the TEDP in different regions and different time periods, and have achieved rich results. These studies not only verify the rationality of index construction and research methods but also reveal the differences, dynamic changes, and spatial correlation of regional tourism economic development. For example, some studies have conducted empirical analysis regarding the advancement of the TE within the Yangtze River Economic Belt, Beijing-Tianjin-Hebei and other regions, and some cities, revealing the imbalance and spatial externalities of TE growth within the region (Wang and Weng, 2025; Zhu et al., 2023). Some studies have conducted long-term follow-up studies on the advancement of the TE in specific provinces or cities, revealing their dynamic evolution rules and influencing factors (Tan et al., 2025b). These studies provide strong support for this paper in choosing the southwest region as the research object and deeply analyzing its TEDP, dynamic progression, and geographical spillover influence.
Considering the aforementioned issues, this study has implemented the subsequent innovations, building upon prior research. Firstly, it comprehensively employs a diverse range of approaches to realize the whole process of research on the TEDP from measurement to dynamic analysis and then to spatial spillover effect analysis, which relatively breaks through the limitations of traditional single-method research. Secondly, it reveals the influence mechanism of emerging factors such as digital technology on the geographical spillover influence of TEDP, and provides novel theoretical underpinnings for fostering the growth of the TE in southwest China in the background of the digital age. Thirdly, it puts forward the integrated development strategy of the regional TE grounded on potential measurement and spatial spillover effect analysis, which provides operable practical guidance for the premium-grade advancement of the TE in Southwest China. These strategies not only take into account the actual situation and resource endowment differences in various regions, but also focus on cooperation and linkage between regions to achieve win-win advancement of the TE.
Theoretical line
This paper concentrates on the principal axis of “tourism economic development potential measurement-dynamic evolution analysis-spatial spillover effect analysis”, and is committed to building a comprehensive and systematic analysis framework of regional TEDP. The theoretical starting point is the measurement of the TEDP. In view of the fact that the TEDP is the cornerstone and premise for the enduring, sound, and swift advancement of the regional TE (Li et al., 2025b), and its size is affected by many factors such as resource endowment, market demand, industrial efficiency, policy support, and infrastructure (Bakalo et al., 2025), this paper first constructs a measurement system of TEDP covering multi-dimensional indicators. The entropy-based TOPSIS approach is employed to comprehensively assess the TEDP in various regions of Southwest China and accurately grasp the basic conditions and potential advantages of tourism economic development in various regions, and lay a solid foundation for subsequent research. Secondly, the theory extends to the level of dynamic evolution analysis, considering that the TEDP is not static, but will continue to evolve dynamically with the progression of time and alterations in conditions in the external environment (Harfst et al., 2025; Wang, 2006). This paper uses density analysis to deeply analyze the characteristics of spatial arrangement and dynamic trends of TEDP in Southwest China. Through this analysis, this paper can reveal its dynamic evolution law, accurately identify “growth club” and “recession trap”, and provide a strong basis for formulating practical and targeted development strategies. Thirdly, the theory is further deepened through the analysis of the spatial overflow impact. In the process of regional tourism economic development, each region is not isolated from the others, but has close spatial correlation and spillover effect, and regional coordination is crucial to unlocking the TEDP (Assaf and Scuderi, 2020). Based on the above analysis, this paper finally uses the spatial econometric model to analyze the spatial overflow impact of TEDP in Southwest China, quantitatively analyzes the extent and direction of the influence of TE development in surrounding areas on the region, and deeply reveals the mechanism and transmission path of spatial spillover effect, to provide solid theoretical support for promoting the coordinated development of regional TE and help the TE in Southwest China achieve higher-quality and more sustainable development.
In addition, drawing on the aforementioned explanations, this paper analyzes the TEDP from the perspectives of tourism revenue leakage, education level, market demand, digital technology, and residents’ income. Tourism revenue leakage refers to the portion of tourism income that flows out of the destination’s economic system during tourism economic activities due to various reasons. It not only directly affects the economic returns of tourism destinations but also exerts profound impacts on the sustainable development of the local tourism industry and the coordinated development of the regional economy (Qiu et al., 2026), which is a key recessive factor restricting the improvement of regional tourism development potential (Chaitanya and Swain, 2024). The improvement of education level can cultivate professional talents and provide intellectual support for tourism innovation and service upgrading (Tan et al., 2025a); vigorous market demand, especially diversified personalized demand, is the principal impetus behind the release of tourism economic potential (Sun and Chen, 2025). Digital technologies improve destination competitiveness via innovative tourism services and cross-regional spatial spillovers (Liu and Huang, 2025; Tang, 2023); the growth of residents’ income directly improves the tourism consumption capacity, broadens the tourism market space, and jointly promotes the release of TEDP (Wang et al., 2025). The theoretical framework is presented in Figure 1. Through the construction of the above theoretical context and the presentation of the diagram, this paper can clearly see the research logic and framework structure of this paper, that is, starting from the measurement of the TEDP, revealing its changing law through dynamic evolution analysis, and finally exploring the synergistic development mechanism of regional TE through spatial spillover effect analysis. Theoretical context framework.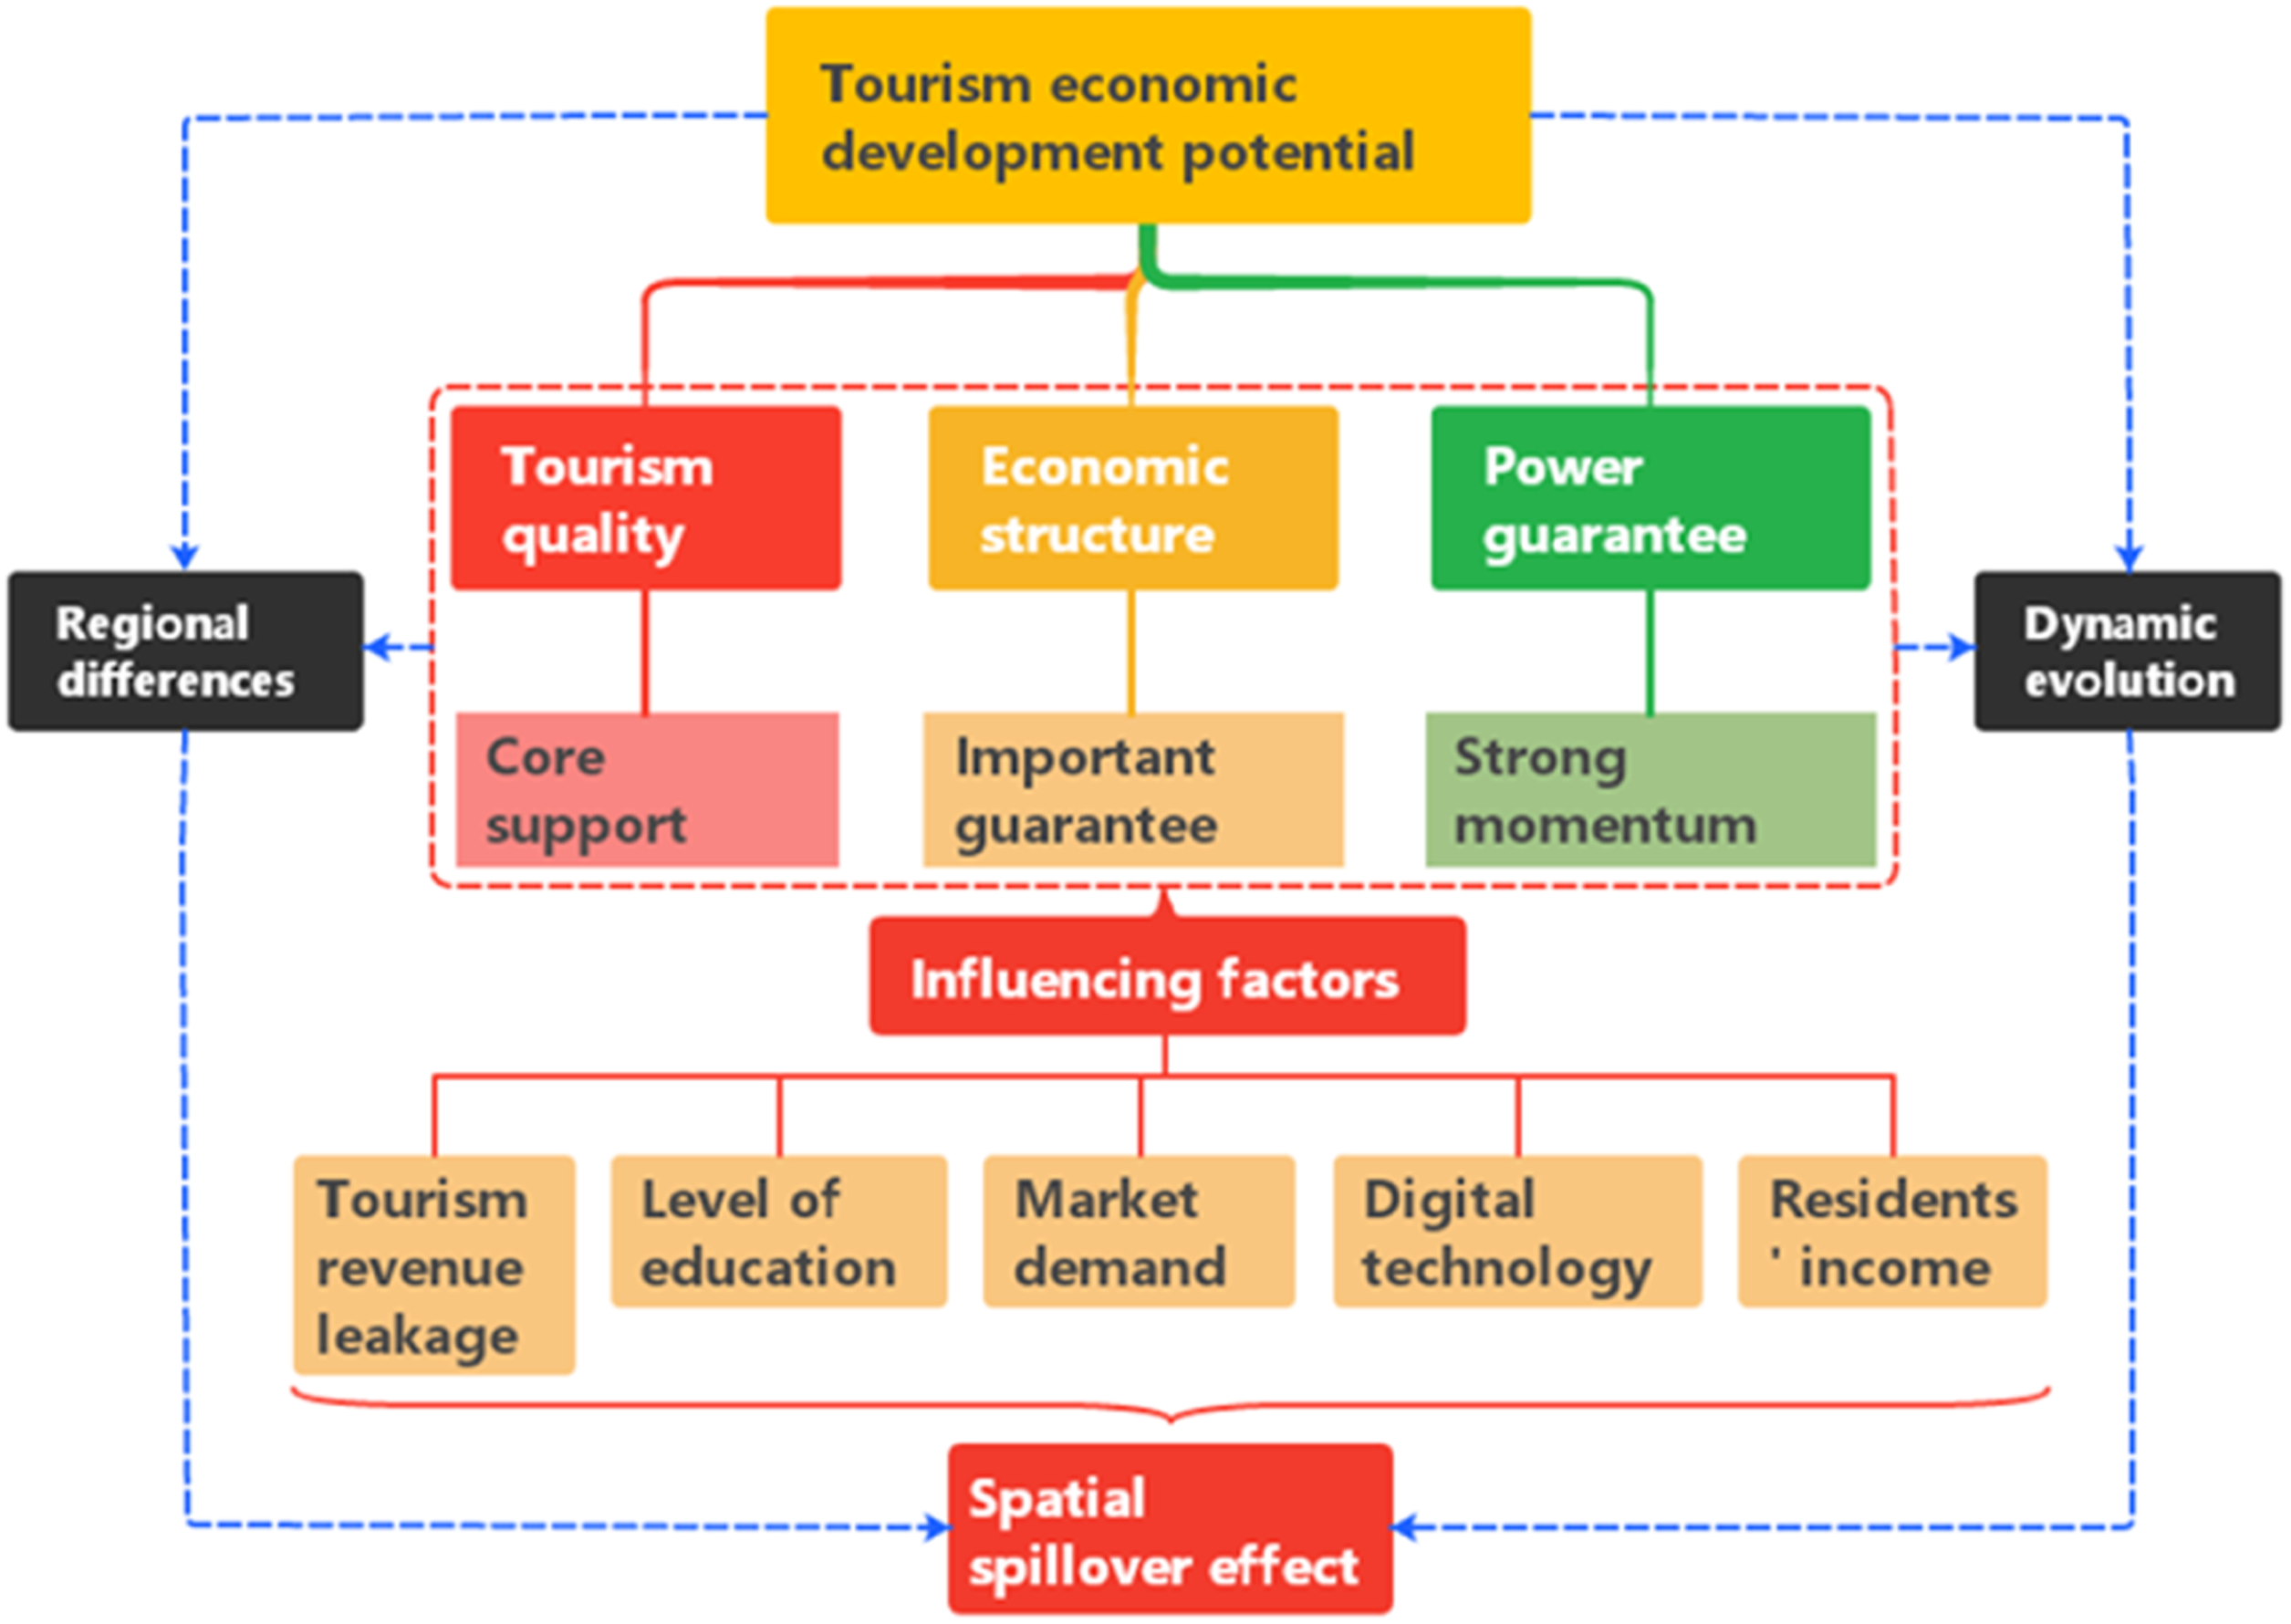
Investigation means, key variables, and research data
Investigation means
Entropy weight TOPSIS
The Entropy Weight TOPSIS approach represents a hybrid evaluation technique that combines the entropy weight method, which focuses on objective weighting, with the TOPSIS method, designed for multi-attribute decision-making processes. This method is widely utilized to tackle complex decision-making scenarios involving multiple indicators, including project assessments, performance evaluations, and strategy optimizations. The fundamental concept behind this approach lies in identifying the weights of various indicators by leveraging entropy values. Following this, it employs the TOPSIS framework to compute how closely each alternative aligns with the ideal solution, ultimately producing an overall ranking of the alternatives. Due to its well-established nature, detailed instructions on its practical application can be found in the research conducted by Shao et al. (2024a).
Kernel density estimation method
Tourism economic development has significant temporal path dependence and regional heterogeneity. Static empirical methods fail to capture the long-term evolution of TEDP and ignore cross-regional interaction effects, thus generating biased estimation results (Assaf and Tsionas, 2019). Therefore, this study applies Kernel Density Estimation (KDE) (Huber et al., 2023; Shao et al., 2024a) to characterize the dynamic distribution trajectories of tourism economic development potential in Southwest China, and establishes a spatial econometric model to identify inter-provincial spatial spillover effects, to clarify the spatio-temporal evolution rules of regional tourism development. The mathematical representation of KDE is given by equation (1):

Here, the expression

s denotes the sample standard error of estimate, which serves as a metric for quantifying the spread or dispersion of the sample data points. There is a broad spectrum of kernel functions available, each possessing distinct advantages and inherent characteristics. For this specific research, the Ivan Konnikov kernel—also widely recognized as the quadratic kernel—has been selected. The mathematical formulation for this particular kernel is presented in equation (3).

KDE typically makes use of graphical representations to illustrate how variables change over time. In these visualizations, a taller peak indicates a higher density of data points. When the kernel density plot moves towards the right, it indicates a continuous improvement in the TEDP. Conversely, a shift of the curve to the left suggests a decline in TEDP. A peak with a relatively low height and a broad base reflects a significant variation in TEDP across different provinces. In contrast, a peak that is both high and narrow implies less variability in TEDP among the provinces. The presence of a distinct multi-peak pattern in the curve indicates a situation of multi-polarization. On the other hand, when the curve transitions from having two peaks to a single peak, it suggests that the polarization effect is diminishing. If the distribution tends to become more dispersed, it indicates that the spatial disparity in TEDP is gradually expanding.
Spatial econometric model
Before establishing the spatial model, it is imperative to conduct a correlation examination initially. In this study, the global Moran’s I statistic is employed to quantify the spatial autocorrelation of TEDP in Southwest China, drawing upon the research of Hong et al. (2023). Spatial econometric models are predominantly categorized into the spatial autoregressive or spatial lag model (SAR), the spatial error model (SEM), and the spatial Durbin model (SDM) (Autant-Bernard and LeSage, 2011; Zhang et al., 2022; Zhang and Liu, 2022). When setting up the model, we need to conduct the advanced LM test. In contrast to the mixed OLS examination, the test outcomes should be evaluated based on spatial error and spatial lag aspects. If merely the outcomes of the spatial error test exhibit statistical significance, the spatial error model is employed. Conversely, if only the results of the spatial lag test are statistically significant, the spatial lag model is chosen (Shao et al., 2024b). When both sets of test results are significant, we proceed to conduct the robust Lagrange Multiplier (LM) test. In the event that the spatial lag’s level of significance surpasses that of the spatial error, the spatial lag model is selected. Should the robust LM test results be significant, we then carry out the Likelihood Ratio (LR) and Wald tests. If the LR test results demonstrate statistical significance, the spatial Durbin model is picked. Moreover, the Hausman test is utilized to make a choice between the random-effects model and the fixed-effects model. If the p-value derived from the test result is statistically significant, the null hypothesis is rejected, and the fixed-effects model is adopted. Otherwise, the random-effects model is selected. The overarching models within the realm of spatial econometrics are represented as equation (4).

Dependent variable
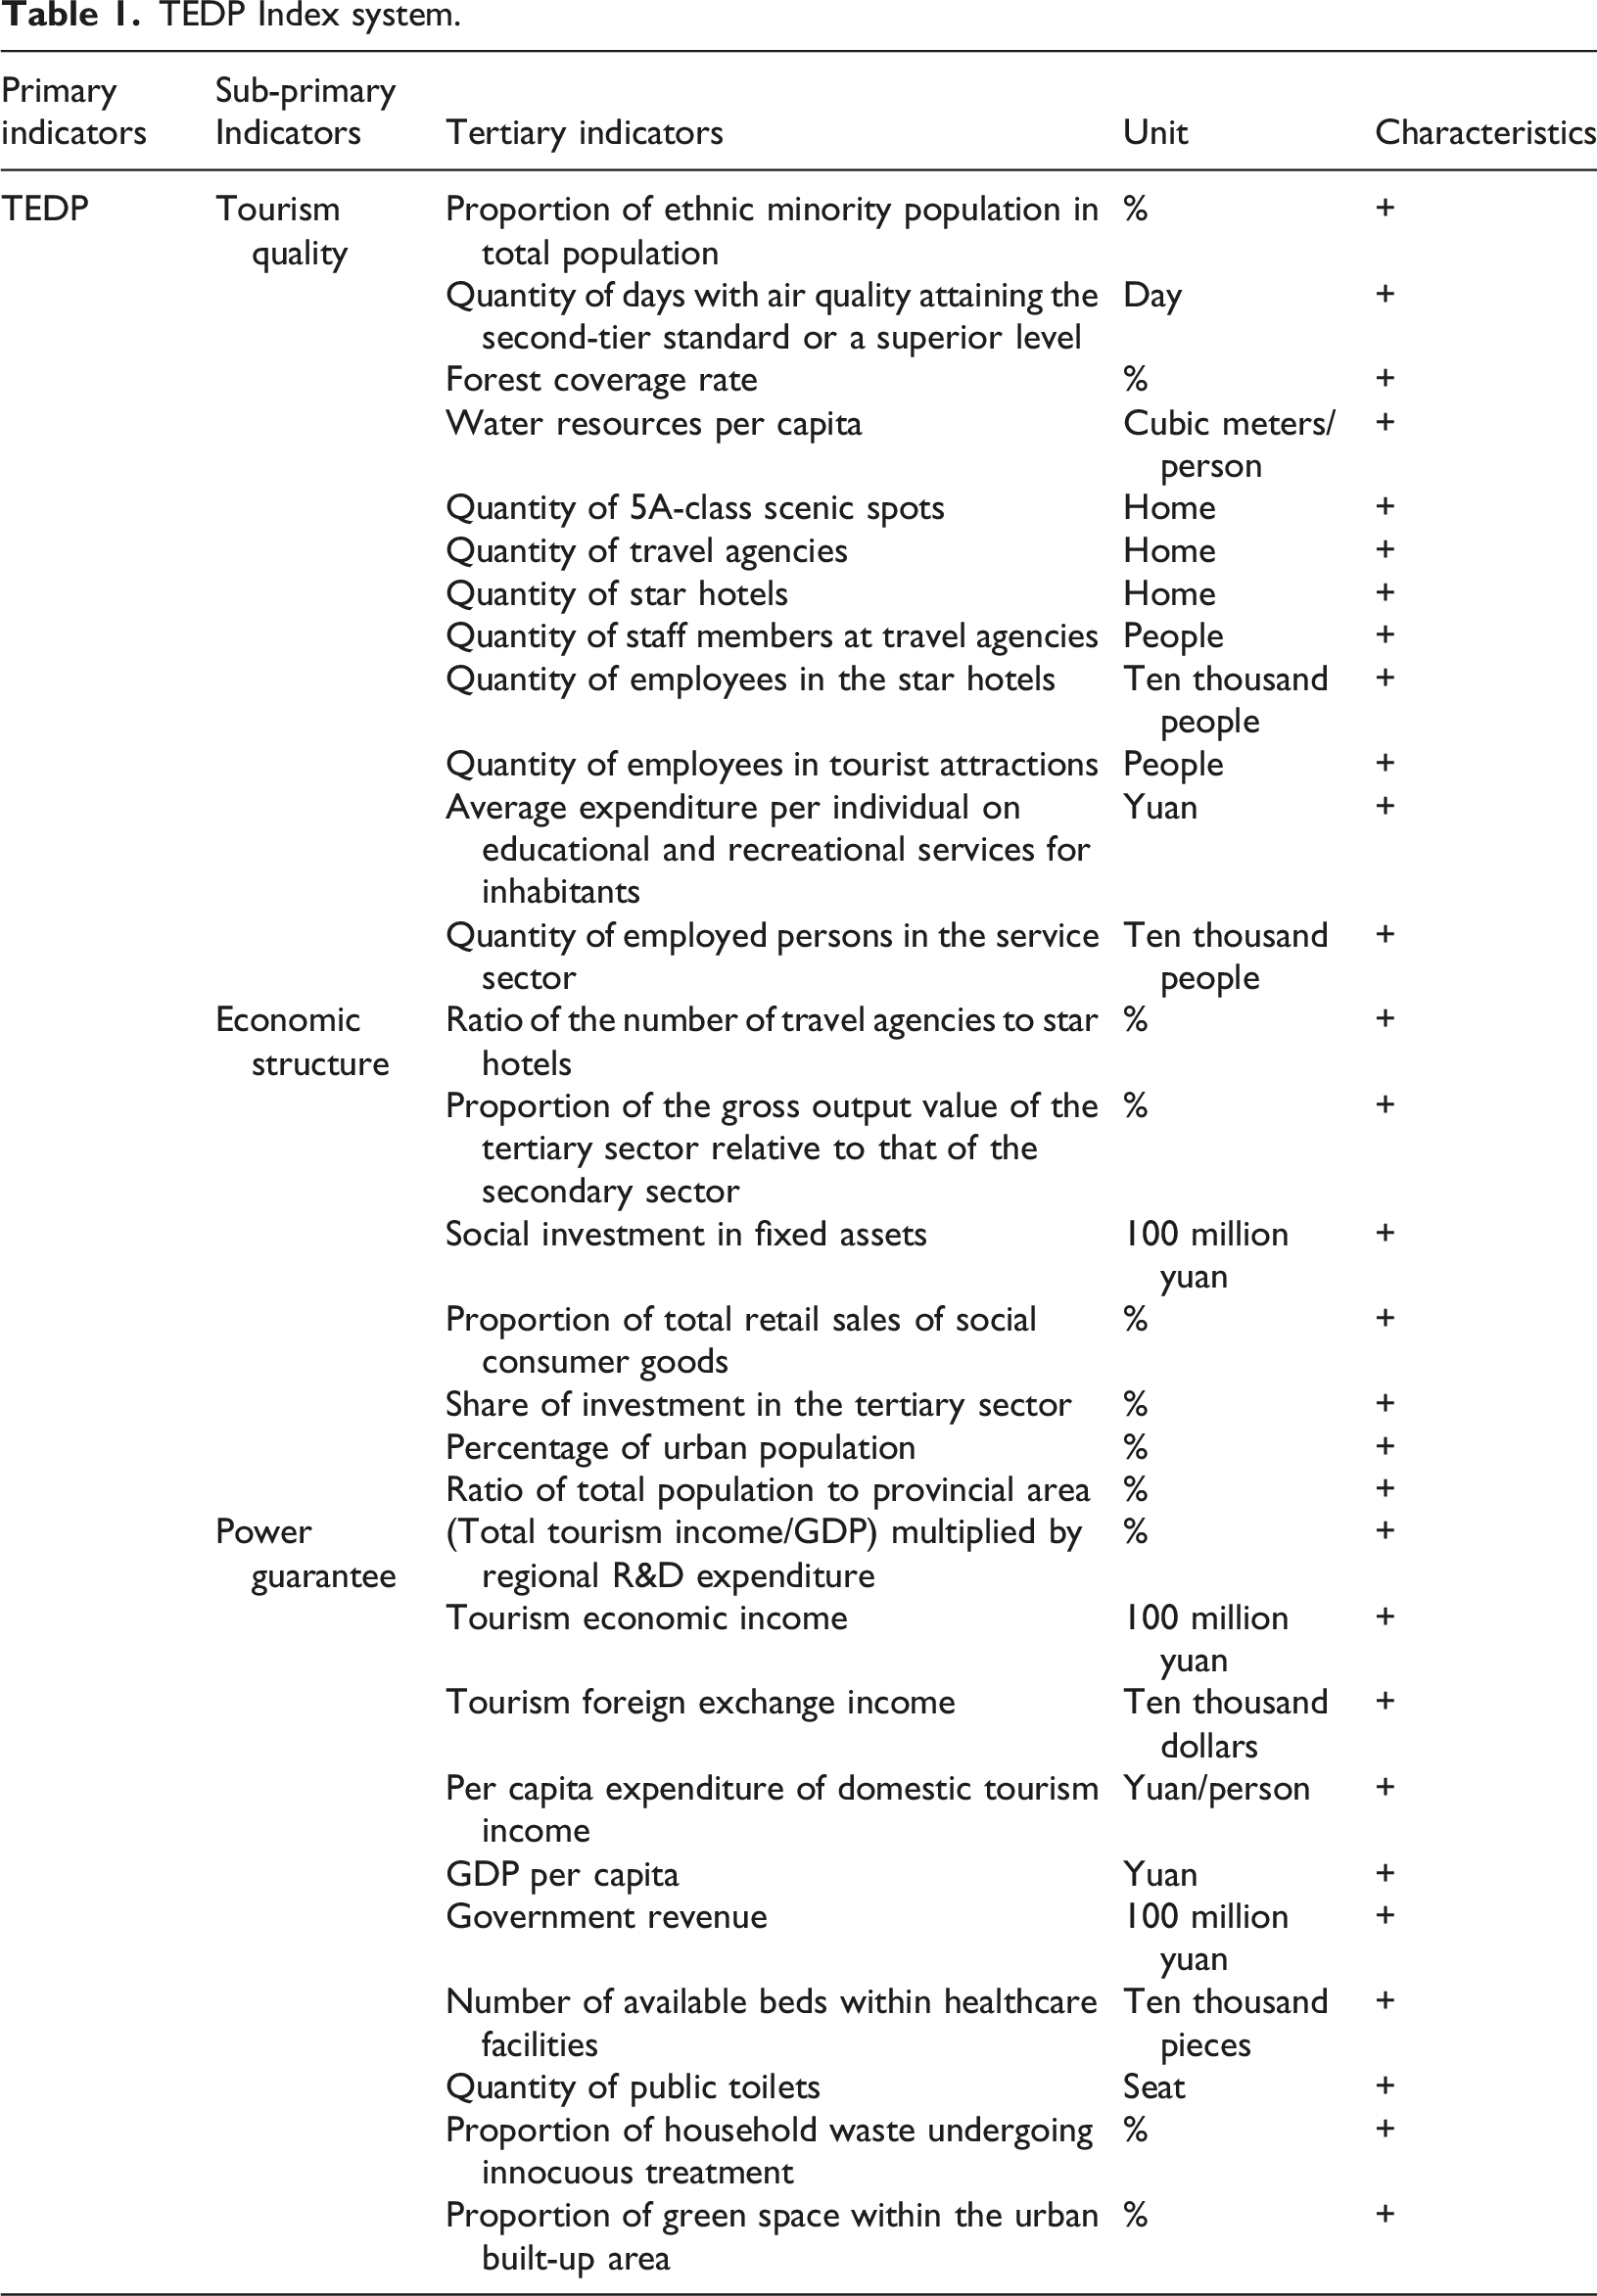
The index system for measuring TEDP is constructed from three dimensions: tourism quality, economic structure, and power guarantee. It aims to comprehensively and systematically assess a region’s inherent capacity for TEDP and future growth.
The first dimension is tourism quality. Tourism quality is a crucial factor in attracting tourists, elevating the tourism encounter, and promoting the enduring advancement of the TE. It is directly related to the demand in the tourism market and the competitiveness of the tourism industry (Alves De Medeiros et al., 2025). With regard to cultural characteristics, the percentage of the ethnic minority population underscores the unique cultural allure of the region, attracting tourists seeking diverse experiences. Regarding the ecological environment, air quality, forest coverage, and per capita water resources provide a high - quality foundation for ecotourism and leisure vacations, aligning with tourists’ pursuit of a high-quality environment. When it comes to tourism resources and industrial scale, the number of 5A-level scenic spots represents the concentration of high-quality resources, while the number of travel agencies and star-rated hotels reflects the industrial reception capacity and can meet the diverse needs of tourists. Simultaneously, human resources and consumption capacity cannot be overlooked. Professionals enhance service quality, and residents’ expenditure regarding instruction and amusement, along with employment in the service industry, reflect the potential demand and service support level of the regional tourism market (Han et al., 2025). Together, these factors build a solid foundation for the advancement of the TE.
Secondly, the dimension of economic structure. A reasonable economic structure can provide a favorable industrial environment and supporting conditions for the growth of the TE, and promote the synchronized advancement between the TE and other industries (Li et al., 2025b). In terms of industrial coordination, the ratio of the quantity of travel firms to that of star-rated hotels reflects the rationality of the inner composition of the tourism sector, whereas the proportion of the output value generated by the tertiary sector in relation to that of the secondary sector serves as an indicator of the extent of industrial structure advancement, which is conducive to the vigorous growth of the TE within the large-scale service industry environment. In the fields of investment and consumption, the amount of social fixed-asset investment provides funds for the construction of tourism infrastructure, the share of aggregate retail sales of social consumer products reflects the activity of the consumer market, and the ratio of investment within the service sector directly reflects the level of support for tourism-related industries, jointly driving the growth of the TE. In addition, in terms of urbanization and population factors, the share of individuals residing in urban areas reflects the level of urbanization, bringing about improvements in infrastructure and consumption upgrading, while population density affects tourism customer sources and the carrying capacity of resources and the environment. A moderate degree of population agglomeration is beneficial for the evolution of the tourism industry marketplace.
TEDP Index system.
Characterization of variables
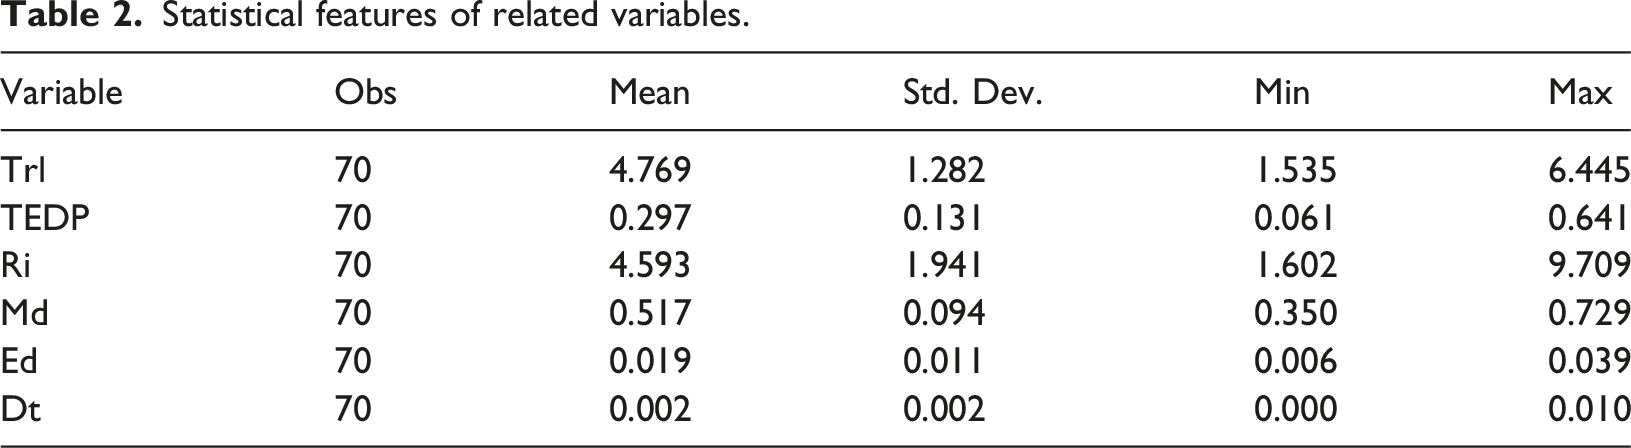
The control variables selected in this paper are tourism revenue leakage, residents’ income, market demand, education level, and digital technology. Tourism Revenue Leakage (Trl) is measured by the proportion of tourism revenue outflow, that is, the ratio of the portion of tourism income that flows out of Southwest China to the total tourism revenue. Residents’ income (Ri) indicates the degree of economic advancement. Market demand (Md) is represented by per-capita consumption expenditure. Education level (Ed) is assessed through the proportion of undergraduates and postgraduates in non-elite higher education institutions (or you could say “the proportion of the population with higher education from ordinary colleges and universities” depending on the actual meaning you want to convey). Digital technology (Dt) is measured by the number of digital technology patents.
Research data
Statistical features of related variables.
Results analysis
Measurement of TEDP
Against the backdrop of the robust evolution of the TE, accurately measuring its development potential holds significant importance for understanding industry trends and formulating scientific strategies. This section focuses on the measurement of TEDP, aiming to conduct a comprehensive examination of the internal potential and external manifestations of TE development in Southwest China. The following presents a detailed analysis of its development disparities from both horizontal and vertical perspectives.
Horizontal difference
Figure 2 visually demonstrates the differences in the average levels of TEDP among Chongqing Municipality, Sichuan Province, Guizhou Province, Yunnan Province, and the Tibet Autonomous Region. Sichuan stands out in Southwest China with a value of approximately 0.400, ranking first. This fully underscores Sichuan’s strong strength in tourism economic development. Its rich tourism resources, such as natural landscapes like Jiuzhaigou and Mount Emei, exert a great attraction on tourists (Wang, 2025). Meanwhile, well-developed tourism infrastructure and a mature tourism industry system also provide strong support for its tourism economic development. The Tibet Autonomous Region has a value of about 0.313, higher than the overall level of Southwest China (approximately 0.288). Tibet’s unique snowy landscapes, mysterious religious culture, and rich ethnic customs constitute highly distinctive tourism resources. Despite being restricted by geographical and transportation factors, its TEDP remains considerable. Chongqing Municipality has a value of around 0.283, close to the overall level of Southwest China. Serving as a city administered directly by the central authorities, Chongqing boasts a unique urban landscape, rich historical and cultural relics, and a lively urban tourism atmosphere, possessing its own characteristics and advantages in tourism economic development. Yunnan Province has a value of approximately 0.258, slightly lower than the overall level of Southwest China. Yunnan has long been renowned for its colorful ethnic customs and beautiful natural scenery. However, during the process of tourism economic development, there may be room for improvement in aspects such as resource integration and market promotion. Guizhou Province has a value of 0.191, relatively low among the regions. Nevertheless, Guizhou has been making continuous efforts in tourism development in recent years. For example, the popularity of attractions such as Huangguoshu Waterfall and the Thousand-household Miao Village has gradually increased (Xu et al., 2025), and its future TEDP is expected to be further unleashed. Average levels of TEDP in research regions.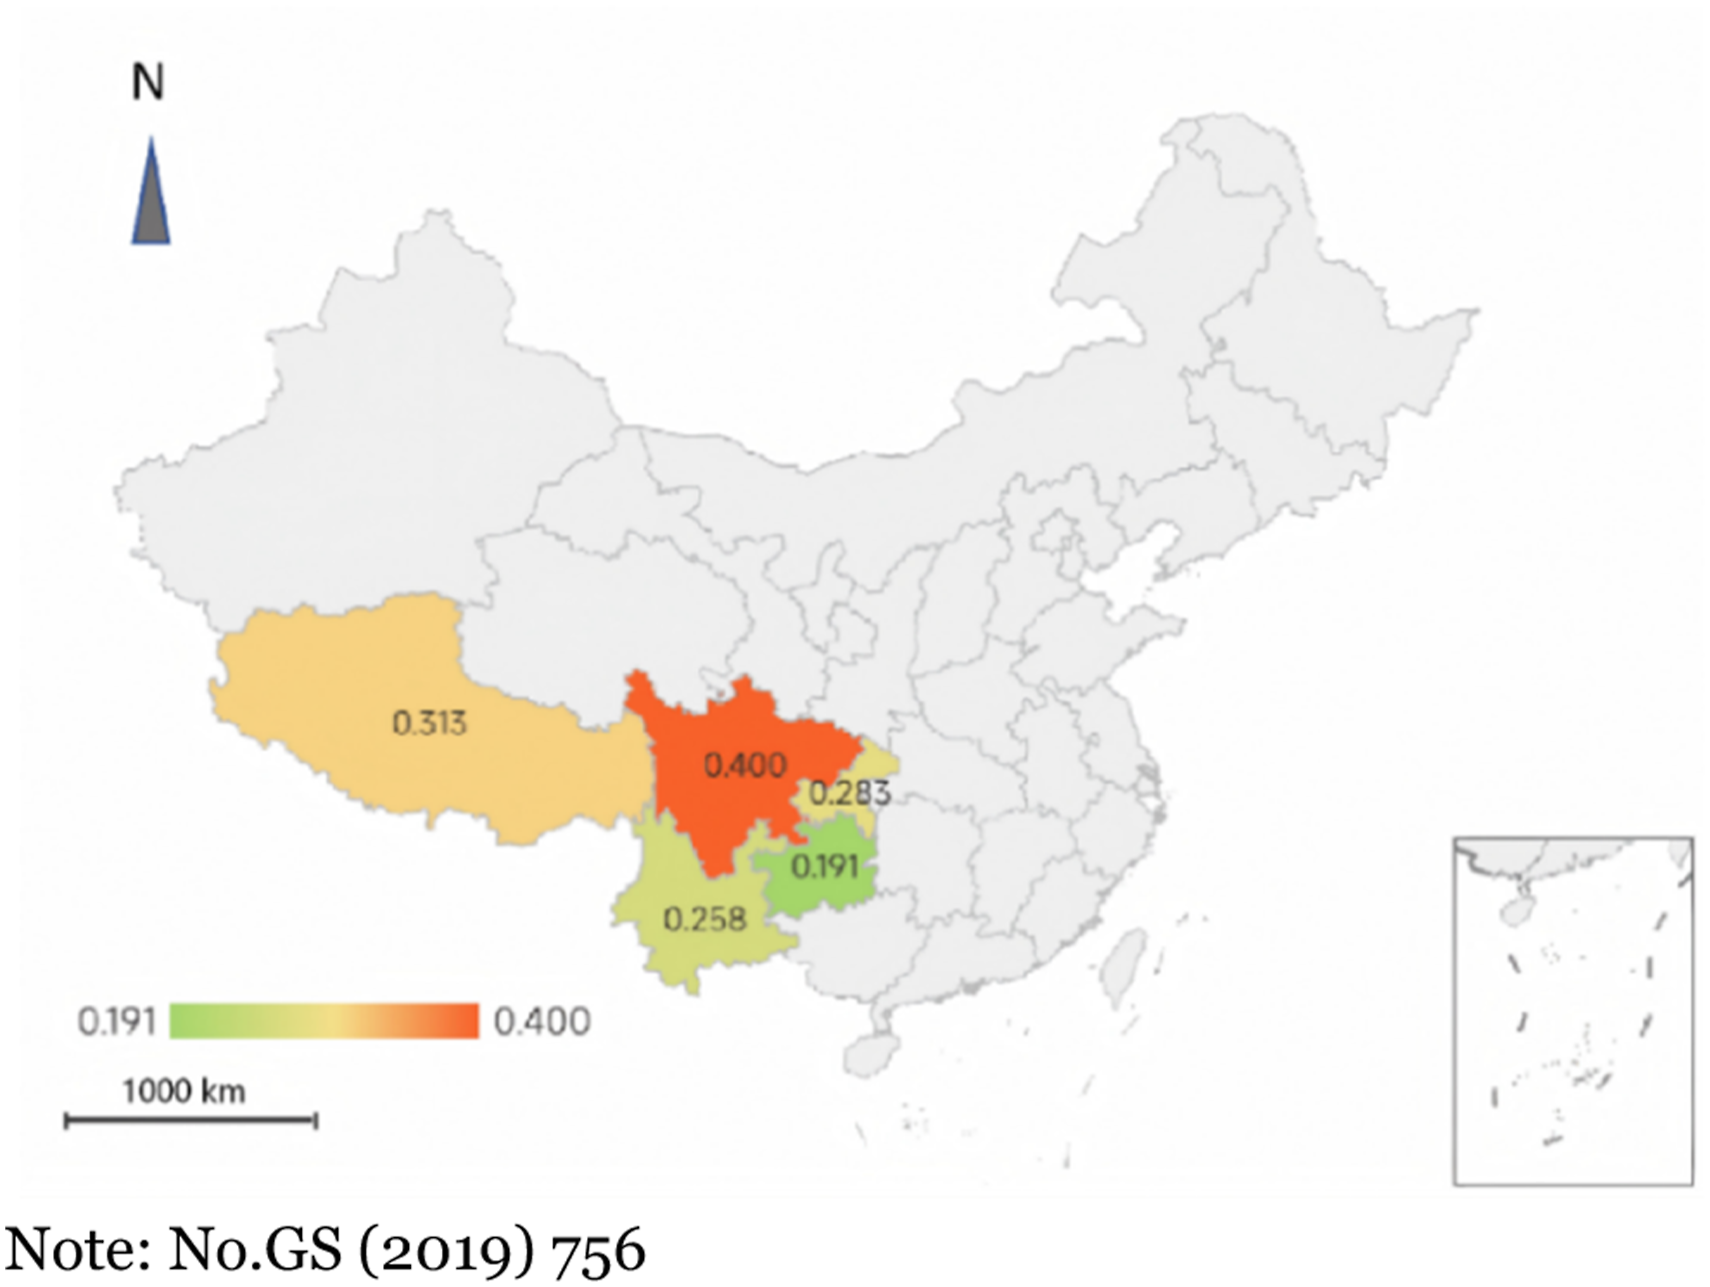
In conclusion, each region in Southwest China has its own strengths and weaknesses in terms of TEDP. It is necessary to strengthen inter-regional collaboration, realize resource pooling and mutually reinforcing strengths, and jointly propel the TE to a new height.
Vertical differentiation
Figure 3 illustrates the changing trends of TEDP in Southwest China as a whole, as well as in Chongqing Municipality, Sichuan Province, Guizhou Province, Yunnan Province, and the Tibet Autonomous Region from 2011 to 2024. From an overall perspective, the TEDP in Southwest China has shown a continuous upward trend, with a notably accelerated growth rate after 2020, indicating the region’s strong development momentum and immense potential in the TE. The curve representing Chongqing’s TEDP has been relatively stable and has risen in a stepwise manner. It experienced steady growth from 2011 to 2020 and accelerated after 2020, aligning with the overall trend in Southwest China. This suggests that Chongqing has a solid foundation for its TE and has been developing steadily. The curve for Sichuan Province initially followed a similar growth trend as other regions. However, it witnessed explosive growth after 2020, briefly becoming one of the regions with the fastest increase in TEDP in Southwest China. This is likely attributable to its rich tourism resources and effective tourism development and promotion strategies. Guizhou Province has a relatively low TEDP in Southwest China, but its curve shows a continuous and stable upward trend. Although the growth was relatively gentle in the early stage, the later growth rate was more consistent, indicating that Guizhou has been making continuous efforts in tourism economic development and constantly tapping its potential. The curve for Yunnan Province shows some fluctuations in the early stage but has maintained an overall upward trend. After 2020, the growth became significant. Its abundant natural and cultural tourism resources provide solid support for tourism economic development. The curve for the Tibet Autonomous Region had relatively low values in the early stage but demonstrated a clear growth trend, especially accelerating in the subsequent phase. This reflects the sustained advancement of the TE sector in the Tibet Autonomous Region and the gradual release of its potential. Evolution of the average levels of TEDP.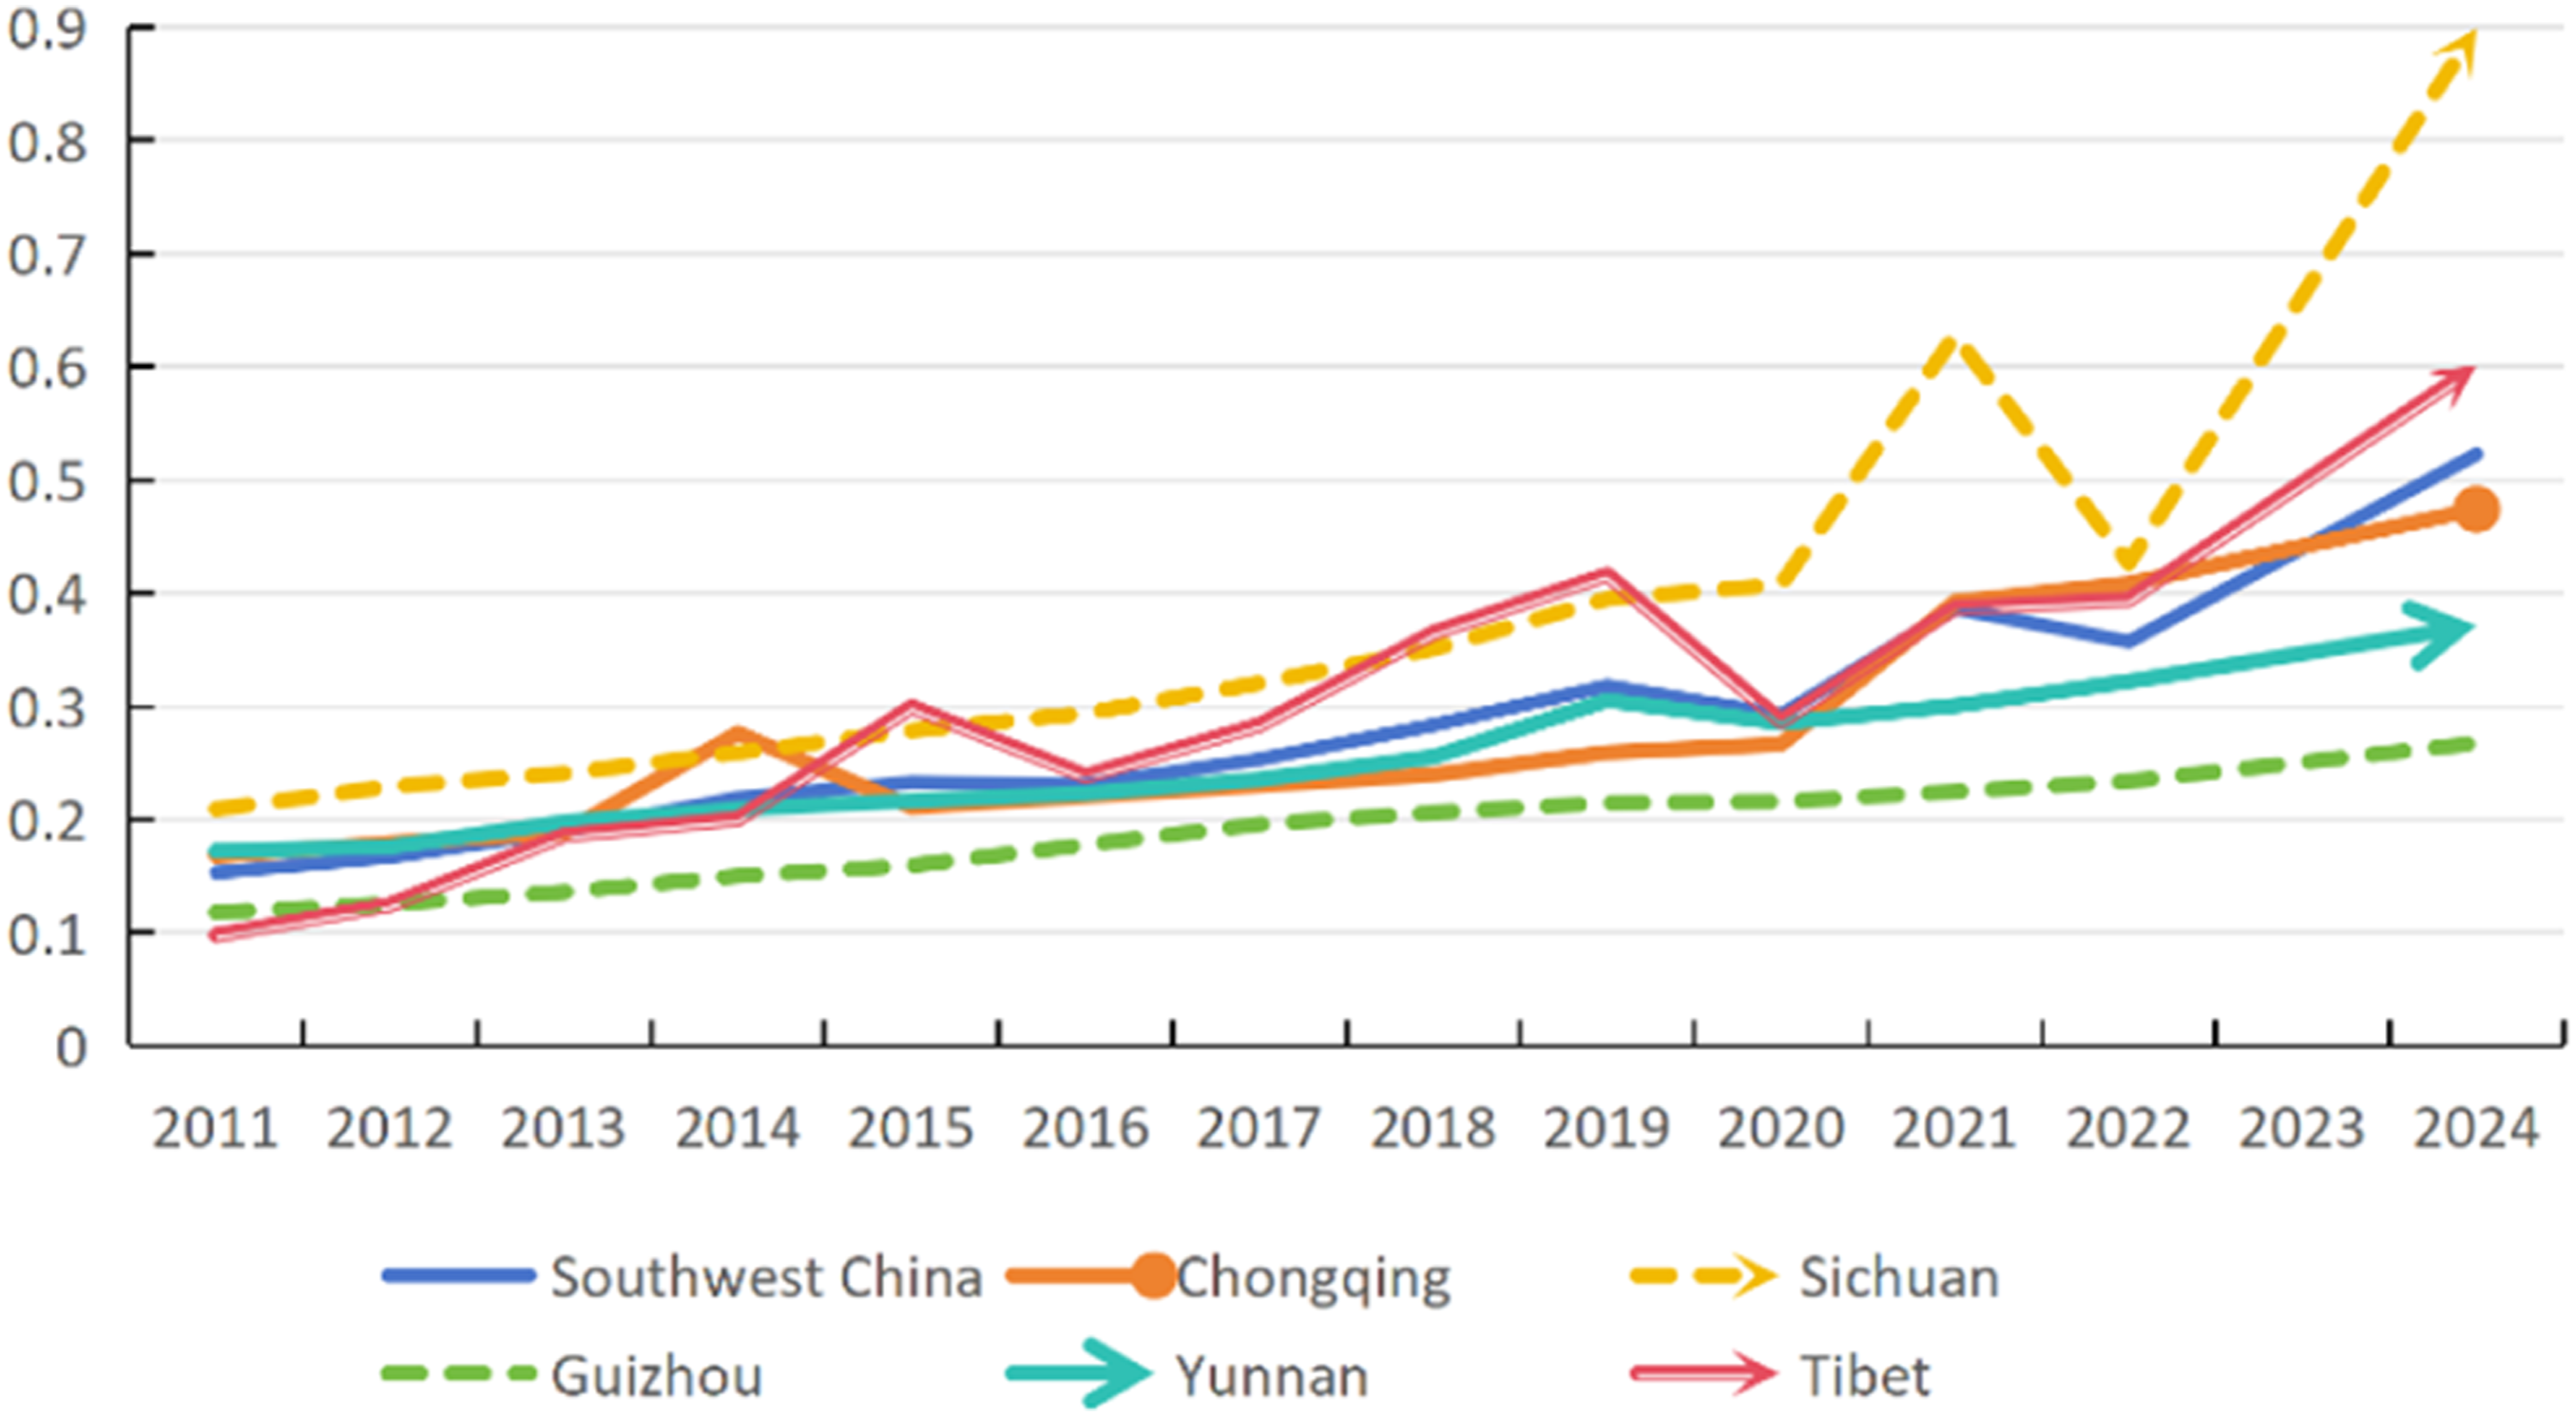
In general, the TEDP in all regions of Southwest China has been continuously improving, but there are differences in the speed and magnitude of improvement. Each region should leverage its own advantages, draw on the successful experiences of other regions, further optimize its tourism industry structure, and enhance tourism service quality to achieve sustained and premium-grade advancement of the TE sphere.
Dynamic evolution
Figure 4 presents the relationship between TEDP and kernel density across different years in a three-dimensional form. From an overall trend perspective, the TEDP in Southwest China exhibits significant dynamic changes over time. The general trend shows that starting from around 2010, the kernel density of TEDP gradually increased, reaching a relatively high peak around 2020, and then declined somewhat between 2020 and 2024. This indicates that the TEDP in Southwest China has undergone a process of first strengthening and then relatively weakening over the past decade or so, but the overall level has still significantly improved compared to the initial stage. In terms of peak changes, around 2020, the kernel density reached its highest value, suggesting that during this period, the degree of concentration of TEDP at various potential levels in Southwest China was the strongest. In other words, the TEDP entered a relatively active and concentrated stage as a whole. As time progresses, the TEDP value corresponding to the peak is not fixed. As is evident from Figure 4, the potential value corresponding to the peak is gradually shifting to the right, implying that the general standard of TEDP in Southwest China is continuously rising, and the number of high-potential regions is increasing. Regarding the distribution shape, the early distribution shape is relatively flat, indicating that there were relatively small differences in TEDP among regions, and the distribution was relatively dispersed. As time goes on, the distribution shape gradually becomes steeper, showing that the differences in TEDP among regions are gradually increasing, and some regions are beginning to stand out, demonstrating stronger TEDP. Concerning the scope of distribution, the range of values for TEDP is continuously expanding, indicating that regions in Southwest China are constantly exploring and expanding in tourism economic development, and the potential levels are showing a diversified development trend. Energetic progress tendency of the TEDP.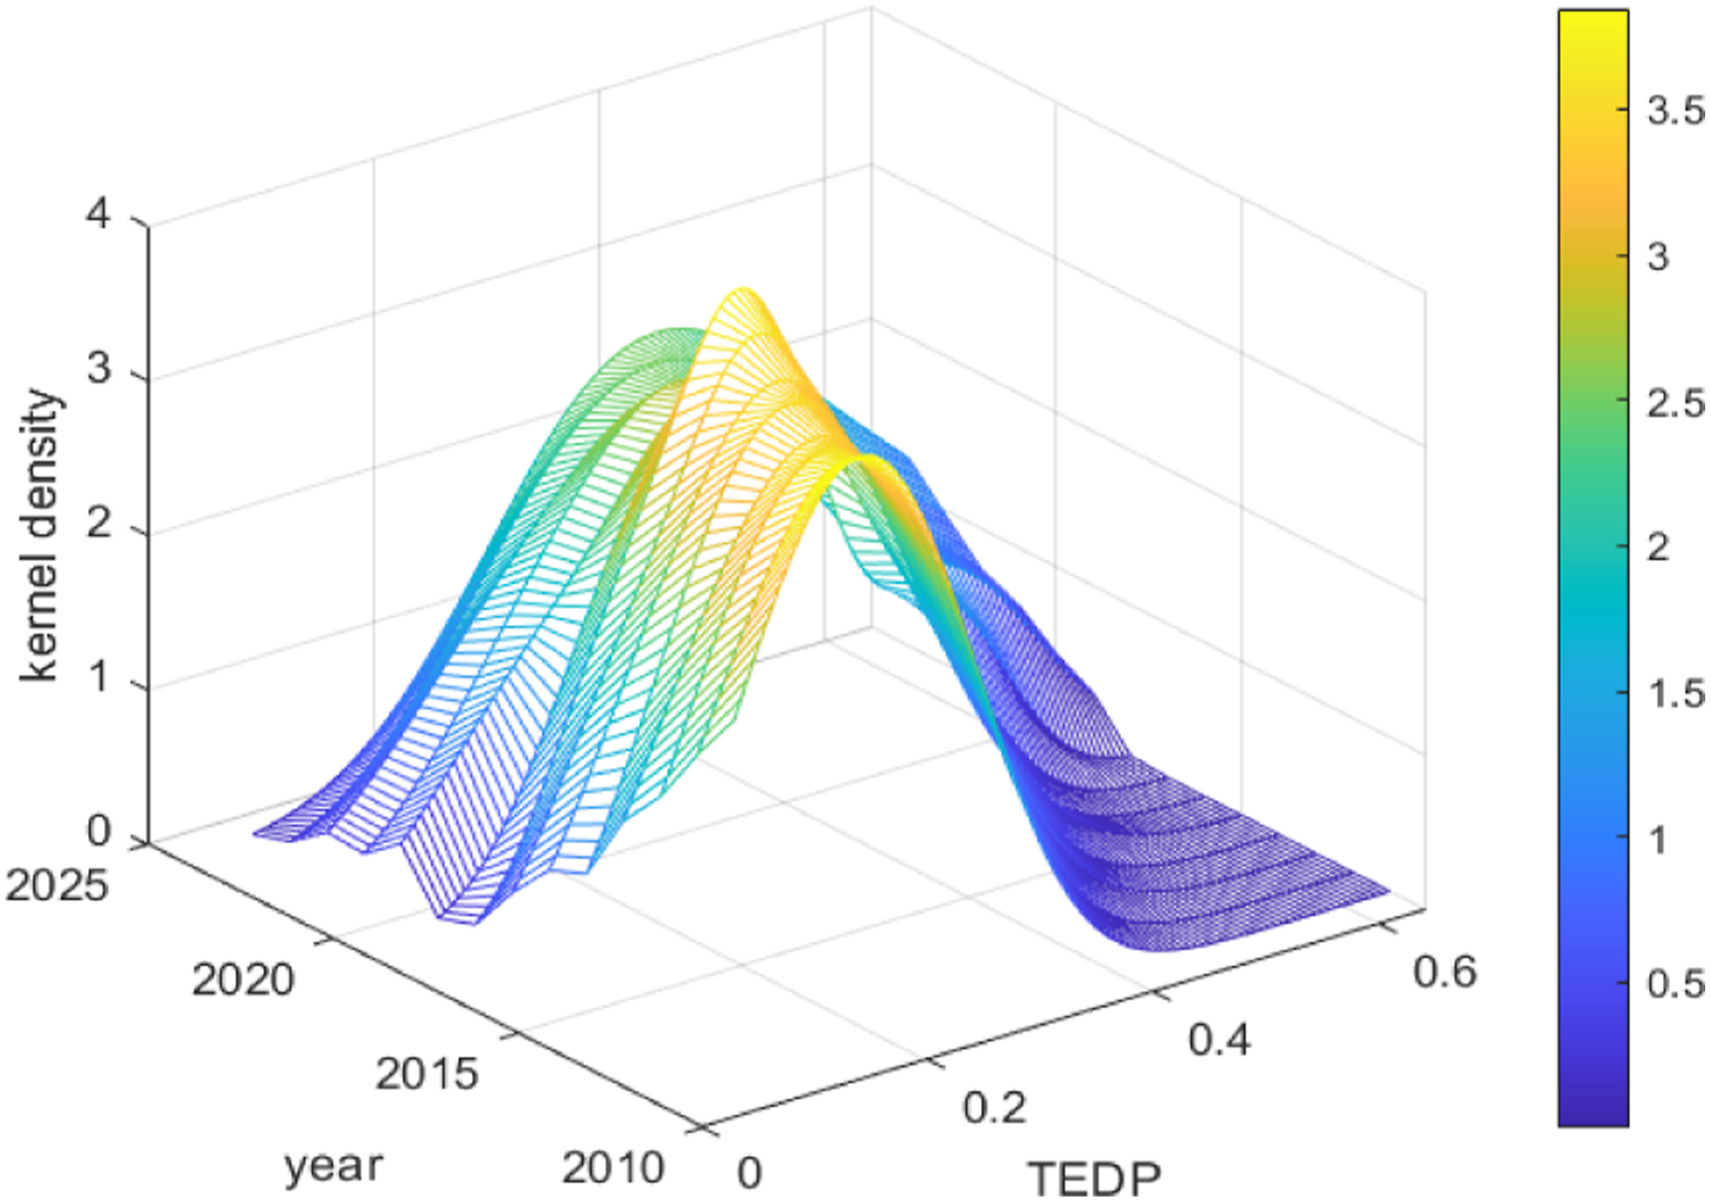
This dynamic evolutionary trend reflects that the TEDP in Southwest China is influenced by an amalgamation of numerous elements, for instance, policy support, infrastructure construction, and tourism resource development. In the future, it is imperative to continue paying attention to the differences in TE development among regions, formulate development strategies according to local conditions, facilitate the harmonious advancement of the TE among regions, and further augment the comprehensive TEDP in Southwest China.
Spatial spillover effects
The decomposition of spatial effects reveals that the direct inhibitory effect of tourism revenue leakage on TEDP (−85.674) far exceeds its indirect positive spillover effect (+24.344), with the total effect remaining significantly negative. This indicates that coordinated regional governance of revenue leakage is critical to enhancing TEDP (see Appendix Table 6 for detailed decomposition results).
Endogeneity treatment
To address potential endogeneity concerns, the Dynamic Spatial Autoregressive (DSAR) model and the Instrumental Variable (IV) approach are employed. The DSAR results show that the coefficient of the lagged TEDP term is significantly positive (0.783), confirming the notable temporal persistence of TEDP. The signs and significance of all core explanatory variables remain consistent with the baseline regressions (see Appendix Table 7). The IV approach uses historical per capita income levels and the mean per capita income of other provinces within the same region and year (excluding the province itself) as instrumental variables. The Hansen test is not significant, supporting the exogeneity of the instruments, and the regression results corroborate the baseline findings (see Appendix Table 8). Collectively, these tests indicate that the core findings are not substantively affected by endogeneity issues.
Heterogeneity analysis
Given the significant disparities in economic and tourism resource endowments among cities within each province, the sample is further disaggregated to the city level, covering 45 cities (including some autonomous prefectures) in Southwest China. The results (see Appendix Table 10) reveal the following: First, the inhibitory effect of tourism revenue leakage is significantly stronger at the provincial level than at the city level, reflecting a more pronounced inter-provincial “development trap” effect. Second, digital technology is significantly positive at the provincial level but nearly negligible at the city level, suggesting that digital empowerment operates more effectively at the macro-provincial scale. Third, residents’ income exhibits a more robust promoting effect at the city level, whereas the effect of education level remains insignificant at both levels. These findings suggest that the driving mechanisms of TEDP exhibit notable scale dependence.
Discoveries and policy proposals
This study comprehensively measures and deeply analyzes the TEDP in Southwest China by constructing a multidimensional indicator system and integrating the Entropy-TOPSIS method with spatial econometric models. The findings reveal that the overall TEDP in Southwest China exhibits an upward trend, yet significant internal disparities persist. Specifically, Sichuan Province and Chongqing Municipality demonstrate relatively high potential, while Guizhou Province and Yunnan Province require further efforts to unlock their potential. Dynamic evolution analysis indicates that the regional TEDP initially strengthens and then relatively weakens over time, though the overall level remains significantly higher than at the initial stage. Spatial spillover effect analysis demonstrates notable spatial clustering characteristics of TEDP across adjacent regions, with high-potential areas exerting positive spillover effects on neighboring regions. However, tourism revenue leakage may undermine these effects, exacerbating interregional development imbalances. Among the core explanatory variables, residents’ income, per capita consumption expenditure, education level, and digital technology exert significant positive impacts on the TEDP, whereas tourism revenue leakage shows a significant negative effect. Based on these conclusions, this study proposes that Southwest China should promote coordinated TE development and enhance overall competitiveness through measures such as strengthening regional cooperation, optimizing the tourism industrial structure, advancing digital technology applications, cultivating tourism talent, and implementing differentiated development strategies.
Grounded in these findings, a set of targeted and coordinated policy measures is warranted. Given that residents’ income and market demand are the most powerful drivers of local TEDP, provincial governments should prioritize income growth policies, particularly for rural and lower-income populations, through expanding employment in tourism-related service chains, developing community-based tourism enterprises, and channeling fiscal transfers toward consumption voucher schemes that directly stimulate domestic tourism spending. Simultaneously, differentiated tourism product portfolios tailored to varying consumption capacities should be developed to sustain market demand rather than relying on aggregate expenditure growth alone. To address the talent outflow problem embedded in the negative education effect, provincial authorities should collaborate with universities to design tourism management and hospitality-specific degree programs, create competitive compensation mechanisms and career development pathways within the tourism industry to retain educated labor locally, and establish cross-provincial talent-sharing platforms so that human capital spillovers can be internalized through structured cooperation agreements. The positive spillover from digital technology, combined with its competitive suppression of neighboring areas, calls for a regionally integrated digital tourism infrastructure strategy rather than fragmented provincial deployments. Specifically, a unified Southwest China digital tourism platform encompassing shared booking systems, interoperable smart scenic area networks, and cross-boundary data-sharing protocols would transform zero-sum digital competition into a positive-sum regional ecosystem, amplifying the collective TEDP of the entire region. Recognizing the entrenched high-high and low-low spatial clustering, a spatially differentiated cooperation framework should be institutionalized, wherein high-potential regions such as Sichuan and Tibet assume anchor roles in tourism circuit design and brand promotion, while relatively lagging regions such as Guizhou are strategically integrated into these circuits as complementary cultural and ecological nodes, so that spatial agglomeration forces are harnessed for convergence rather than allowed to deepen existing disparities.
Supplemental material
Supplemental Material - Spatial spillovers and dynamic trajectories of tourism economic development potential: Panel evidence from southwest China
Supplemental Material for Spatial spillovers and dynamic trajectories of tourism economic development potential: Panel evidence from southwest China by Jingbo Shao, Xue Lei in Tourism Economics.
Footnotes
Acknowledgments
The authors sincerely thank the professors who generously shared their valuable perspectives on this article, the colleagues who provided unwavering support throughout the research process, and the reviewers who conducted thorough and meticulous assessments.

Ethical considerations
This study is based entirely on publicly available secondary statistical data obtained from the China Macroeconomic Database, China Tourism Database, and China Regional Economic Database. No human participants, human tissue, or personal data were involved. Therefore, ethical approval was not required.
Author contributions
Funding
The authors disclosed receipt of the following financial support for the research, authorship, and/or publication of this article: This research was supported by the 2025 Annual Project of Philosophy and Social Science Planning in Guizhou Province: “Study on the Current Situation, Problems, and Optimization Path for the Industri-alized Utilization of Agricultural and Tourism Resources in Guizhou” (Project No. 25GZQN01). This work is also supported by the Guangxi Philosophy and Social Science Research Annual Project (No. 25GLF127).
Declaration of conflicting interests
The authors declared no potential conflicts of interest with respect to the research, authorship, and/or publication of this article.
Data Availability Statement
The datasets used and/or analyzed during the current study are available from the corresponding author upon reasonable request.
Supplemental material
Supplemental material for this article is available online.
Author biographies
References
Supplementary Material
Please find the following supplemental material available below.
For Open Access articles published under a Creative Commons License, all supplemental material carries the same license as the article it is associated with.
For non-Open Access articles published, all supplemental material carries a non-exclusive license, and permission requests for re-use of supplemental material or any part of supplemental material shall be sent directly to the copyright owner as specified in the copyright notice associated with the article.
