
Abstract
The pervasiveness and importance of relationships and networks has fueled the development of the social network analysis approach, which considers structural relationships to be primary causes of societal outcomes. While the potential of social network analysis has been demonstrated and discussed extensively in social science research, relatively little is known about the current and potential use of social network analysis for evaluation purposes. This scoping review of journal articles reveals that evaluators use social network analysis because of its ability to identify key stakeholders, assess network structures and relationships quantitatively, reveal informal relations and visualize even complex networks. However, challenges arise when interpreting findings, determining causation between network structures and outcomes and disseminating evaluation results in an ethically responsible manner. The review concludes that the evaluation field―especially in the development sector―would benefit greatly from increased use of social network analysis, but that this would first require improved use of alternative sources of network data, qualitative methods and inferential statistics that will enable evaluators to move beyond descriptive network analysis.
Introduction
Relationships and networks are ubiquitous in our increasingly complex, connected world. Almost a century ago, social scientists began using the concept of social networks to describe the characteristics of social structures (Giuffre, 2013). The sociologist Georg Simmel, the psychologist Kurt Lewin and the psychiatrist Jacob L. Moreno are among the best known researchers who have adopted relational and social network ideas and terminology since the 1930s (Carrington and Scott, 2011). While the foundations of network analysis were laid by these pioneers, it was not until the end of the 1970s that social network analysis (SNA) became a single, coherent, interdisciplinary research effort that would eventually be recognized as a field of research with its own structural paradigm (Freeman, 2011).
According to this structural paradigm, observed behaviors and social life can be explained by structural relations and the patterns formed by these relations. In other words, “social network analysists argue that causation is not located in the individual, but in the social structure” (Marin and Wellman, 2011: 13). The focus of SNA is therefore on relationships among social entities and the patterns and implications of these relationships (Wasserman and Faust, 1994: 3); this means that the basic data element of SNA is the existence or extent of a relationship between social units (Durland, 2005a; Gesell et al., 2013). This structural paradigm differs radically from those that underpin traditional social science approaches, which conceptualize social life in terms of actors’ attributes (Doreian, 2001; Carrington and Scott, 2011; Freeman, 2011; Giuffre, 2013; Giuliani and Pietrobelli, 2011). While the SNA approach differs from traditional variable-based approaches in terms of the type of data, assumptions about the data and the language of analysis (Durland, 2005a), they are not necessarily mutually exclusive (Knoke and Yang, 2008). It might even be fruitful to use both attribute and network data, because this would ensure that the explanatory insights provided by actor attributes could be considered alongside network perspectives (Doreian, 2001; Knoke and Yang, 2008).
In what follows, we define and illustrate a number of key network principles before discussing the relevance of the structural approach for evaluation, particularly within the development sector. For the purposes of this review, a social network is broadly defined as “a finite set or sets of nodes or units of analysis and the relation or relations defined among them.” This definition is almost identical to that proposed by Carolan (2014: 6–7) and Wasserman and Faust (1994: 20). However, we wish to avoid the impression that SNA is only applicable to individuals or collectivities such as formal organizations, and have therefore opted to use the encompassing term node rather than the restrictive term actor. In SNA, the terms node, actor, vertex and unit of analysis all refer to various types of social entity, including individuals and corporate or collective social units (Wasserman and Faust, 1994: 17). Node attribute data (i.e. information on the characteristics of the nodes in question) are often collected to enrich the network analysis further (Wasserman and Faust, 1994). The nodes themselves can be connected by one or more relations (also referred to as ties, relationships or edges) in various forms, such as social relations (e.g. friendship, kinship), interactions (e.g. collaboration, communication) and flows (e.g. information exchange, influence). Relations among nodes can be specified according to certain characteristics or relation attributes, such as tie strength and direction (Giuffre, 2013; Marin and Wellman, 2011). Furthermore, SNA can be conducted at various levels, ranging from individual actors and subgroups (e.g. triads, cliques) to entire networks (Luke and Harris, 2007). By way of illustration, Figure 1 shows a network presented in a study by Cross et al. (2009) which examined changes in interagency collaboration within a coalition funded by the Safe Schools/Healthy Student Initiative. The network consists of formal organizations and functional units working toward the initiative’s goals. The types of agencies included in the network are represented by the various node shapes. The ties between the nodes reflect interagency collaboration and their thickness reflects the intensity of this collaboration.
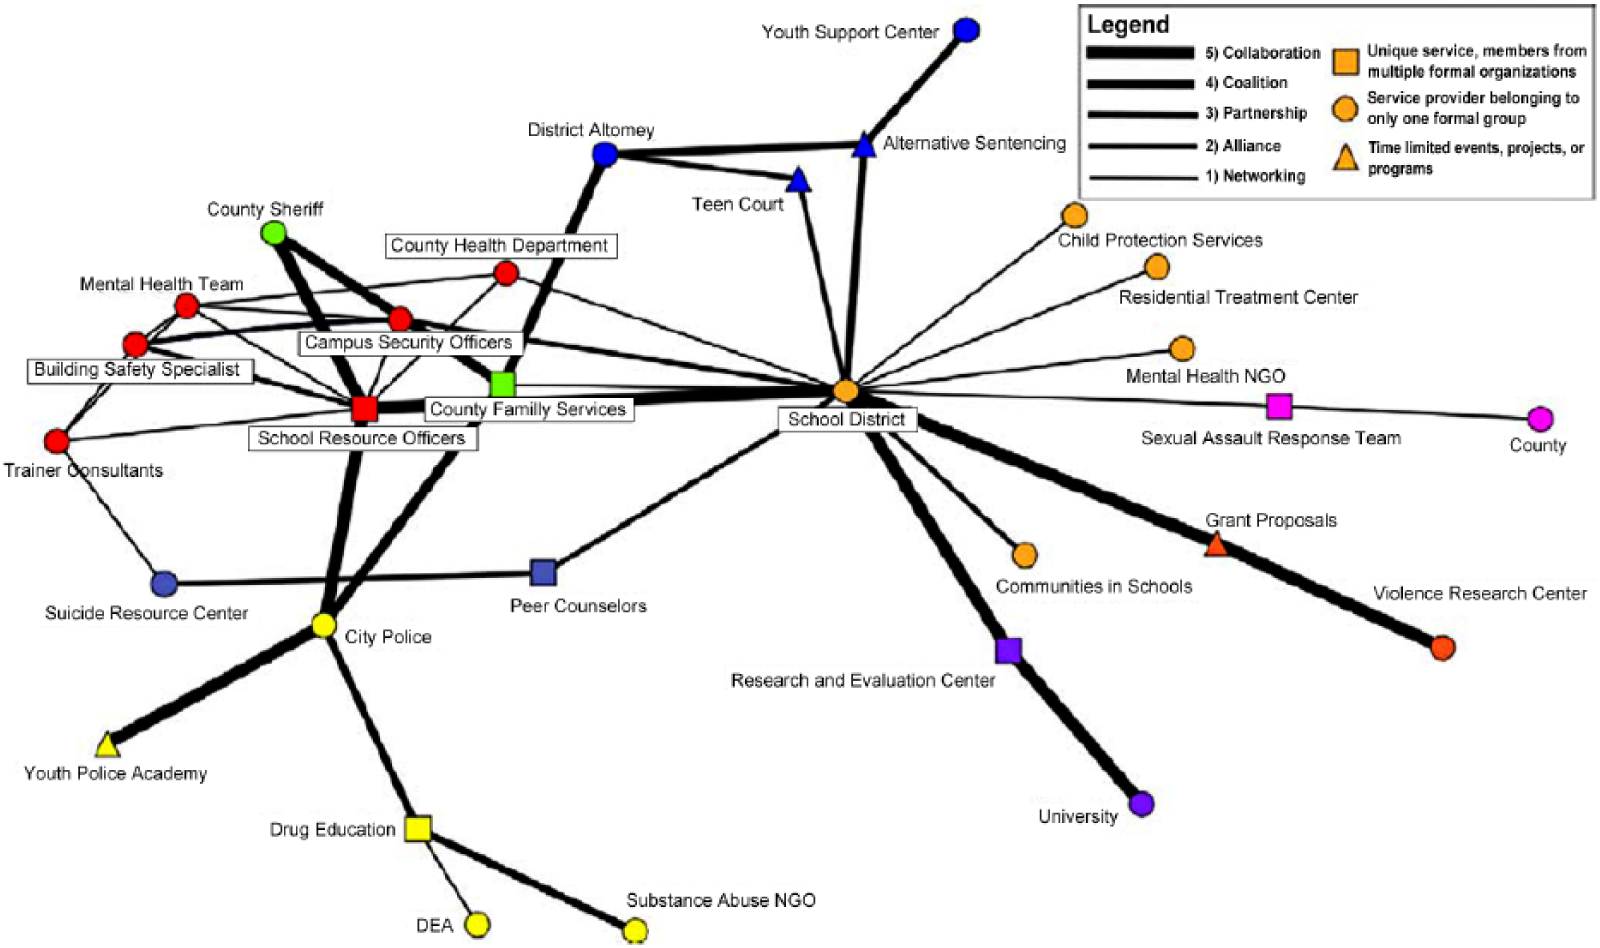
Illustration of network visualization (source: Cross et al., 2009: 321).
The increasing recognition that relations do matter and that the study of interdependence is one of the core missions of the social sciences has led to the adoption of SNA in a wide variety of disciplines and research areas (Cranmer et al., 2017; Giuffre, 2013). For instance, SNA has been used in studies on disease transmission networks (e.g. Neaigus et al., 2001), behavioral influence in substance use, smoking and obesity (Friedman et al., 1997; Gesell et al., 2012; Latkin et al., 2009), information and innovation transmission networks (e.g. Haythornthwaite, 1996; Valente, 1995), citation networks (e.g. Neal et al., 2013), friendship and acquaintance networks (e.g. Jackson and Rogers, 2007), and natural resource management (e.g. Gallemore et al., 2014, 2015).
While SNA has long been used in research, interest in applying it in the field of evaluation has only emerged recently (Durland and Fredericks, 2005a; Laven et al., 2010). This evolution can be explained in part by the fact that the quality and effectiveness of a given intervention are increasingly being linked to the structure and relational quality of interactions among the stakeholders involved in that intervention (Abma, 2006; Giuffre, 2013; Gomersall et al., 2017; Hunter et al., 2015). In the development sector, cohesive and dense social community structures are often considered critical building blocks for successful development interventions and collective action because of their potential to reduce information asymmetries and monitoring and enforcement costs (Bodin and Crona, 2008; Dewachter and Holvoet, 2017; Kuzdas et al., 2015; Schnegg and Linke, 2015; Seferiadis et al., 2015). Similarly, the failure of development initiatives is increasingly being attributed to their insensitivity to social and power dynamics within communities (D’Exelle and Holvoet, 2011). For instance, the practice of engaging community ‘brokers’ to facilitate the interface between local communities and development staff has been increasingly criticized because it makes development initiatives prone to elite capture of development resources (D’Exelle, 2009) and may reinforce structural forms of poverty when brokers do not represent their local communities adequately (Bastiaensen et al., 2005: 985). Thus, there is increasing recognition that social arrangements can affect collective outcomes such as natural resource management and chronic poverty (e.g. Barman-Adhikari and Rice, 2014; Bastiaensen et al., 2005; Bodin and Crona, 2008; Green and Hulme, 2005; Petersen, 2016; Seferiadis et al., 2015). Structural approaches have therefore gained importance in the field of development evaluation; namely, “the systematic and objective assessment of an on-going or completed project, programme or policy, its design, implementation and results” (OECD, 2002: 21), in order to determine initiatives’ intrinsic and context-determined value. This article aims to contribute to evaluation research and practice by providing a comprehensive review of articles that shed light on the potential of using SNA for evaluation purposes. The scoping review is guided by the following questions:
When and how has SNA been applied for evaluation purposes?
What are the challenges of applying SNA for evaluation purposes?
What opportunities does SNA offer for evaluation?
The remainder of the article is structured as follows. The next section discusses the methodological aspects of this review, including the case selection strategy and the study limitations. The third section presents the main review findings. The discussion section summarizes these findings through an analysis of the strenghts, weaknesses, opportunities and threats (SWOT) and highlights some of the implications. The final section presents the conclusions and recommendations for both evaluation researchers and practitioners.
Methodology
This article presents the results of a scoping review on the current and potential use of SNA within the field of evaluation. Scoping reviews generally provide a “preliminary assessment of potential size and scope of available literature” by categorizing previous work by study design or other key features (Grant and Booth, 2009: 95). Scoping reviews are similar to systematic reviews in that they attempt to be systematic, transparent and replicable, but do not aim to be exhaustive and generally include no formal quality assessments (Grant and Booth, 2009; Petticrew and Roberts, 2006).
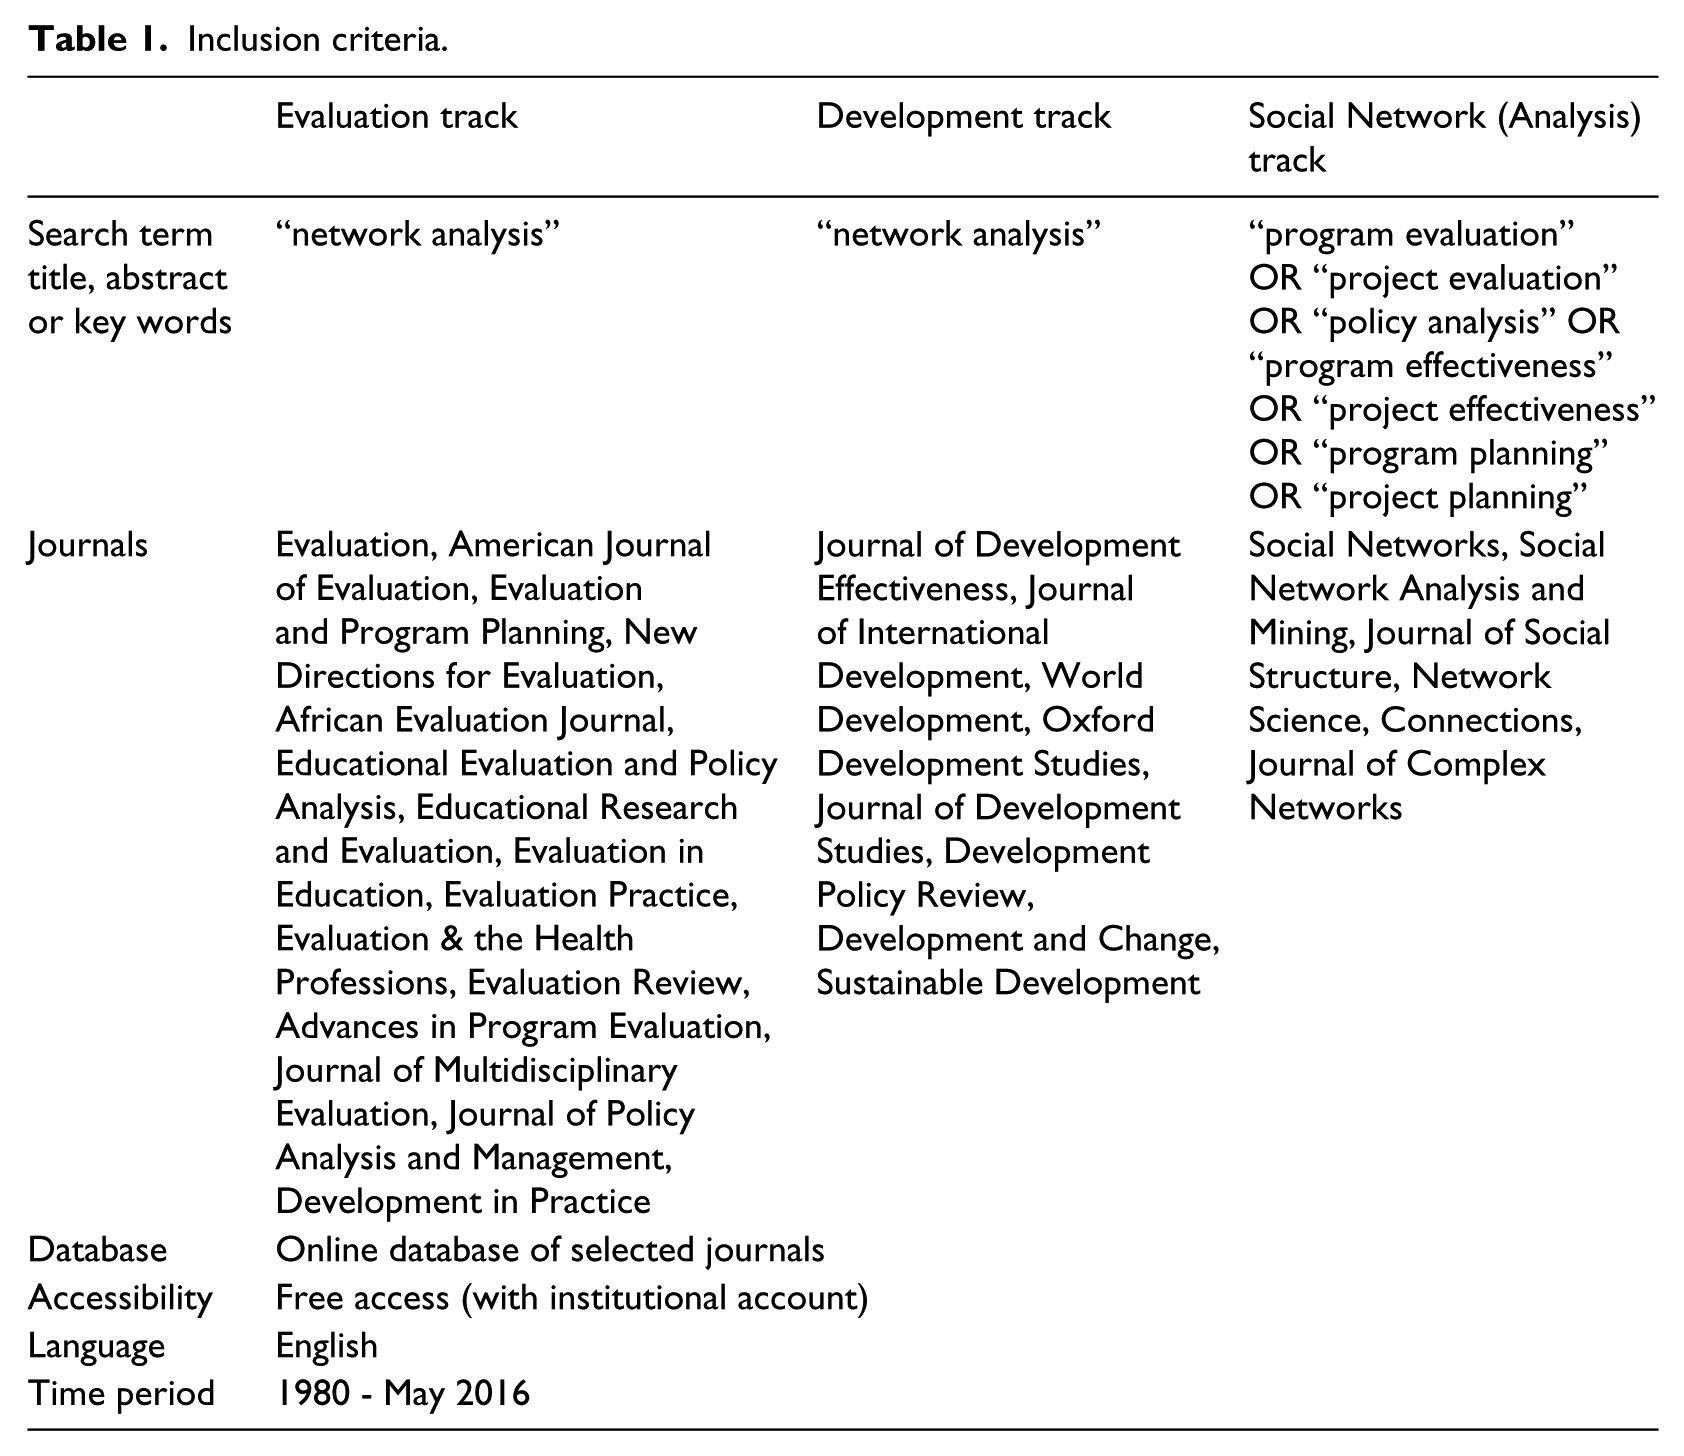
While we did not intend to conduct an exhaustive review, we nevertheless elaborated a search strategy to inform the search for and selection of relevant literature published in academic journals. The search strategy focused on articles published in journals related to evaluation (Track 1), international development (Track 2) and SNA (Track 3) (see Table 1). Purposively sampling eligible journals allowed for the application of less stringent inclusion criteria and was in line with the focus on the current and potential use of SNA for evaluation purposes, particularly in a development context.
Inclusion criteria.
As shown in Figure 2, 1 the search strategy resulted in 54 articles which had mainly been published in evaluation-related journals. The articles were categorized not only by the thematic focus of the journal in which they were published (Tracks 1–3), but also by their objectives: a) illustrated use of SNA (34 articles), b) reflection on and discussion of potential use of SNA (16 articles), and c) suggestions for further methodological development of SNA tools and methods (4 articles). 2
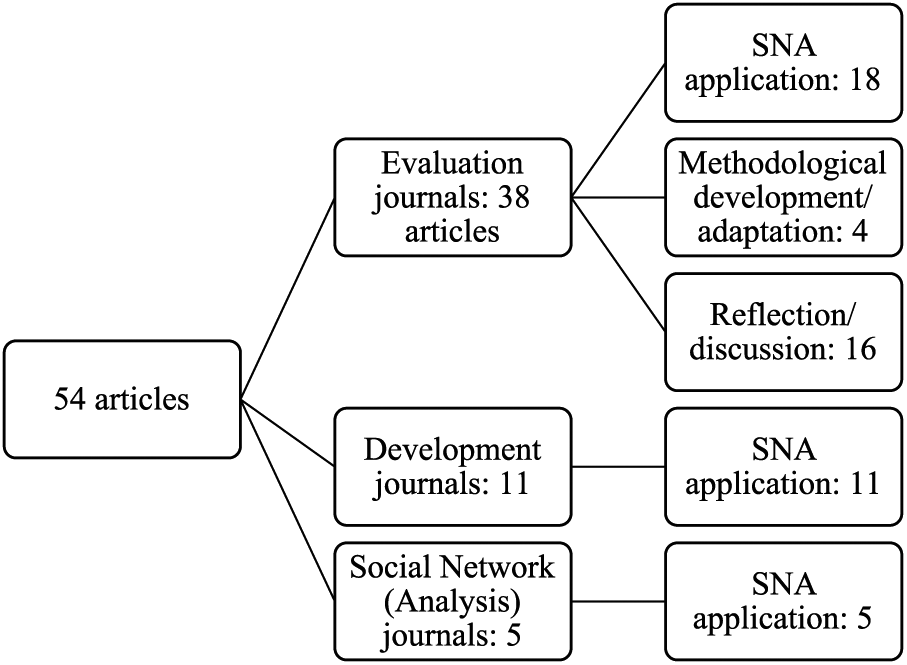
Results of search strategy.
In the next step, we systematically screened and extracted data related to pre-defined categories, including several study design features (e.g. definition of network relations, data collection methods, data analysis methods). Data were collected for each of these categories in an Excel database, which formed the basis for subsequent descriptive analysis although we also refer to other literature to provide further insights.
We encountered several challenges during the review. First, the search strategy focused only on articles published in international journals, whereas many evaluations are never published in such journals. Thus, while the innovative nature of evaluations that use SNA approaches might make them suitable for publication as journal articles, caution is required when drawing conclusions about the use of SNA for evaluation purposes based on this particular sample of journal articles. Second, judging the ‘evaluative nature’ of an article was challenging given the many facets of and perspectives on evaluation, and the fact that no single definition of evaluation exists (Mark et al., 2006). We therefore took a rather broad interpretation of evaluation which―in line with the definition presented above―encompasses formative and summative assessments of the design, implementation and results of projects, programs and policies. Third, while the article discusses the strengths and weaknesses of SNA in evaluation, it makes no systematic comparison of SNA to other evaluation approaches, as was done, for instance, by Gomersall et al. (2017).
Findings and analysis
This section is divided into two main parts. First, we discuss historical evolutions in the interest and use of SNA in the field of evaluation. Next, we discuss how SNA is or could be conducted by exploring i) the evaluation questions answered in the articles; ii) the operationalization of key network analysis concepts; and the approaches to iii) data collection and iv) data analysis.
Historical evolution of SNA-related publications in evaluation, development and social network journals
Figure 3 presents the time distribution of the 54 papers we selected using the search strategy (see ‘Methodology’). It shows an upsurge of interest in SNA in the field of evaluation and development, especially since the turn of the century. Although this figure was generated using a relatively small sample, it displays the same general trend as the graphs in Borgatti and Halgin (2011: 1169) and Knoke and Yang (2008: 1). Growing interest in SNA can be attributed to a number of factors, including increasing recognition of its potential to improve organizational effectiveness and enhance understanding of complexity and systems, technological advances in data analysis and network visualization, and the burgeoning appeal of online social networking (Durland and Fredericks, 2005a; Knoke and Yang, 2008; Provan et al., 2007). The evaluation community may also have been triggered by a special issue of New Directions for Evaluation which introduced SNA and its applications in program evaluation. Yet, despite this special issue and the importance of networks in program and policy implementation (e.g. Provan and Milward, 2001), as well as several calls for increased attention to be paid to the potential of SNA in program and policy evaluation (e.g. Davies, 2009; Laven et al., 2010), SNA use in evaluation remains relatively limited.
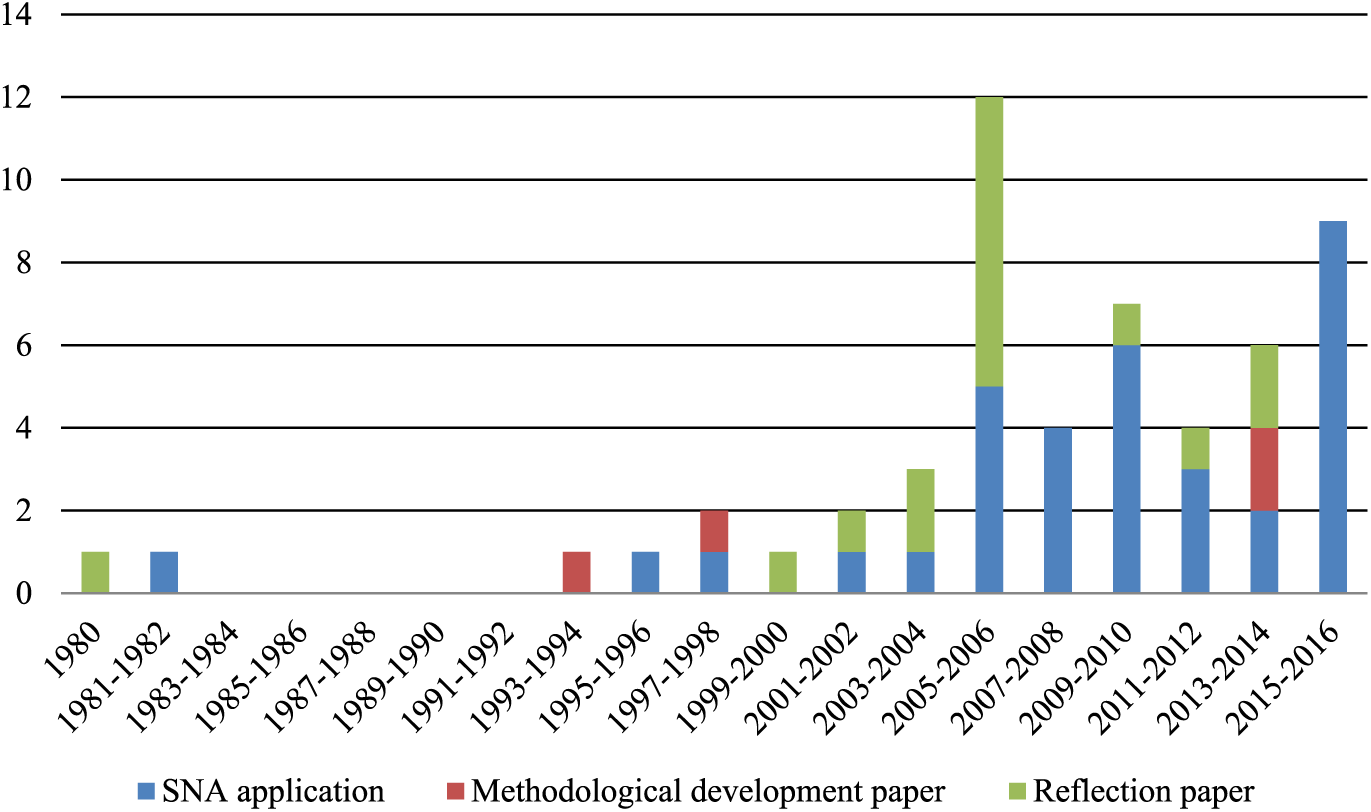
Distribution over time of SNA-related publications in evaluation, development and social network journals (n = 54).
Evaluation questions suitable for SNA approaches
In this part, we present a preliminary framework for categorizing applications of SNA within the field of evaluation. The framework, shown in Table 2, builds on three observations. First, networks can be regarded either as independent (explanatory) variables or as dependent variables (O’Malley and Marsden, 2008). In other words, some evaluations may be guided by the theory of networks, which focuses on factors that could explain the network configuration observed, while other evaluations are more consistent with network theory, which revolves around the consequences of the network structures observed and relations to certain societal or network outcomes (Borgatti and Halgin, 2011). Second, it is possible that both the dependent and independent variables of interest are relational in nature. This might be the case, for example, if the evaluation focuses on network evolution. Third, SNA is rooted in a structural paradigm which states that relationships can explain observed behavior better than the individual attributes of network members can (Wellman, 1988, described in Doreian, 2001), but many evaluators seem to violate the strict network orthodoxy and combine both network and conventional attribute data in their analyses. Using these three observations as a starting point, we identified five main categories of evaluation question which can be addressed using SNA.
Categorization of evaluation questions.
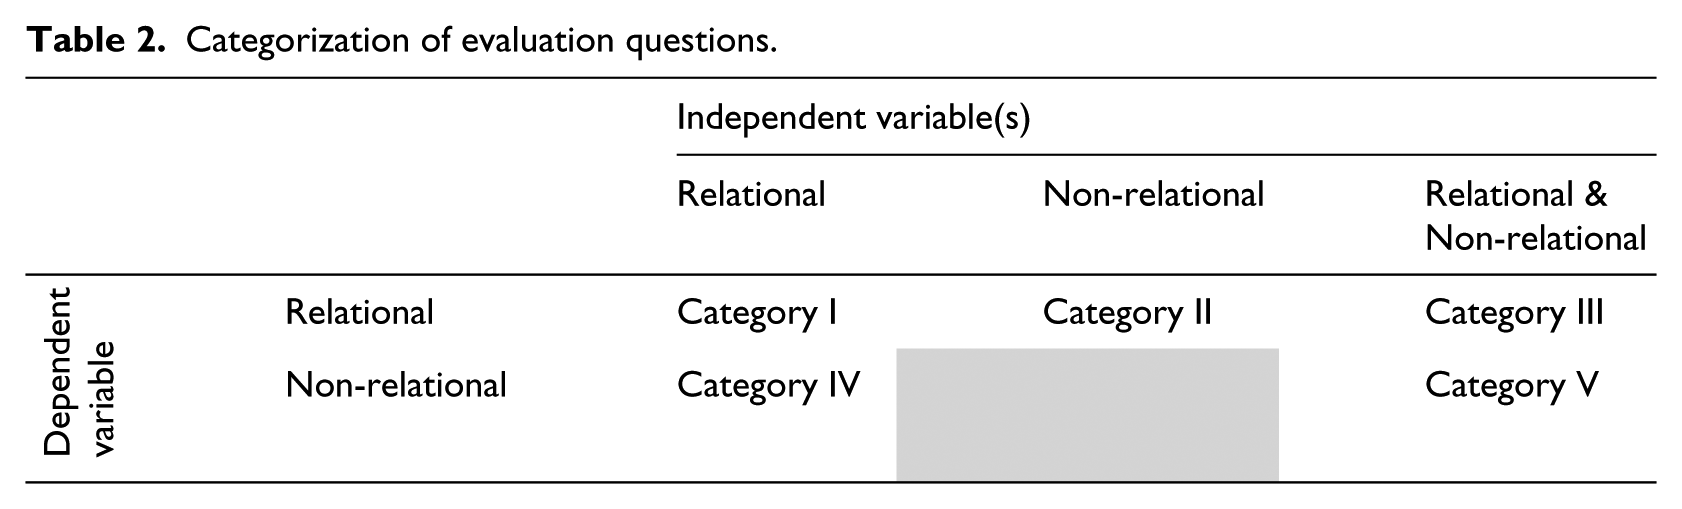
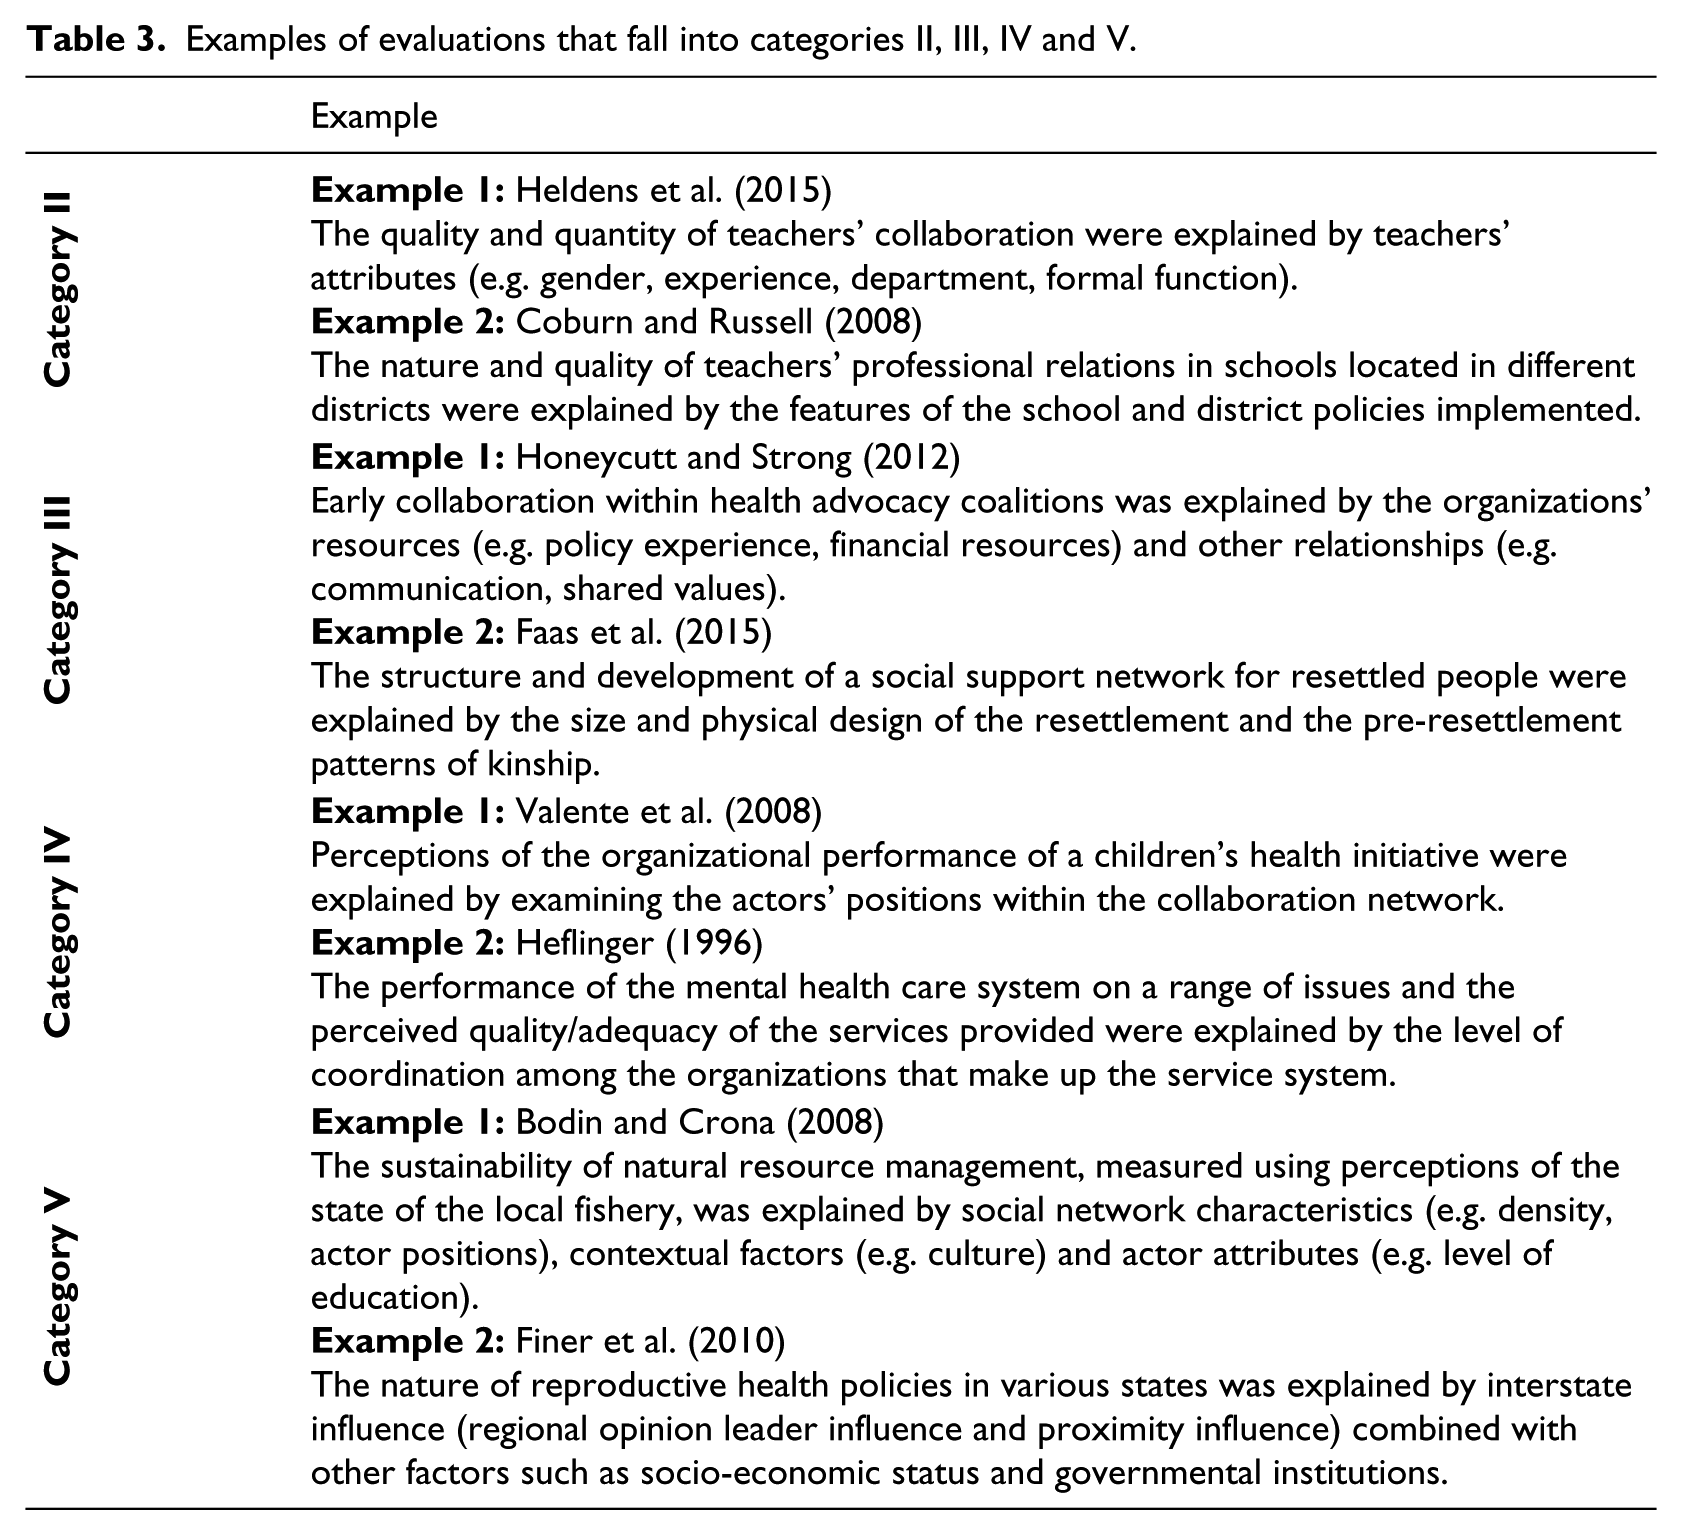
The review yielded SNA applications―some of which are summarized in Table 3 for clarification purposes―that fall into categories II, III, IV and V. Of these, we found more applications that regard the observed network structure and relations as the dependent variable (i.e. categories II and III) than applications that focus on the consequences of the network (i.e. categories IV and V). This observation is in line with Albrecht et al. (2014), who refer to the former as ‘the governance of networks’ and the latter as ‘governance through networks’. The relatively lower share of ‘governance through networks’ assessments, which aim to assess the external impacts generated through the networks (e.g. perceived quality of public services), might be due to the difficulty of demonstrating the link between the internal network configuration and external network effects empirically (Albrecht et al., 2014; Cross et al., 2009; Friedman et al., 2007; Gold et al., 2008; Luke et al., 2010; Mohammadfam et al., 2015; Provan et al., 2005). Despite these difficulties, evaluators might be tempted to make bold statements about external network effects on the basis of network metrics which describe internal network processes. The main aim of the categorization in Table 2 is therefore to raise awareness of the evaluation questions and designs that can guide SNA application and prevent claims being made about external network effects that cannot be substantiated by the type of network analysis that has actually been conducted.
Examples of evaluations that fall into categories II, III, IV and V.
Operationalization of network analysis constructs
An important step in the design and application of SNA is the meaningful operationalization and specification of the network, actors and relations; that is, in line with the evaluation objectives and explanatory theories being used (Borgatti and Halgin, 2011). First, we must define the boundaries within which relationships will be measured (Durland, 2005a). Sometimes the network is finite and bounded by clear, formal criteria such as membership status (e.g. Dozier et al., 2014). In these cases, evaluators can prepare lists (e.g. a list of members) and ask each actor about the existence and nature of network relations with the other actors on that list (e.g. Hayes et al., 2016; Miskel and Song, 2004; Petersen, 2016). In other cases, however, network boundaries might be less clear-cut, for instance when network membership is self-defined (Provan et al., 2007), or large and fluid (Hoppe and Reinelt, 2010). As demonstrated by Coburn and Russell (2008), Real and Hasanagas (2005) and Schnegg and Linke (2015), evaluators can then use free-recall methods, which allow respondents to name a limited (fixed choice) or unlimited (free choice) number of actors to whom they are linked (Giuliani and Pietrobelli, 2011). Free-recall methods may generate networks that are more realistic and less arbitrarily bounded by the evaluator. Yet, distinguishing between ‘insiders’ and ‘outsiders’ remains a challenge when applying SNA (e.g. Honeycutt and Strong, 2012; Provan et al., 2010).
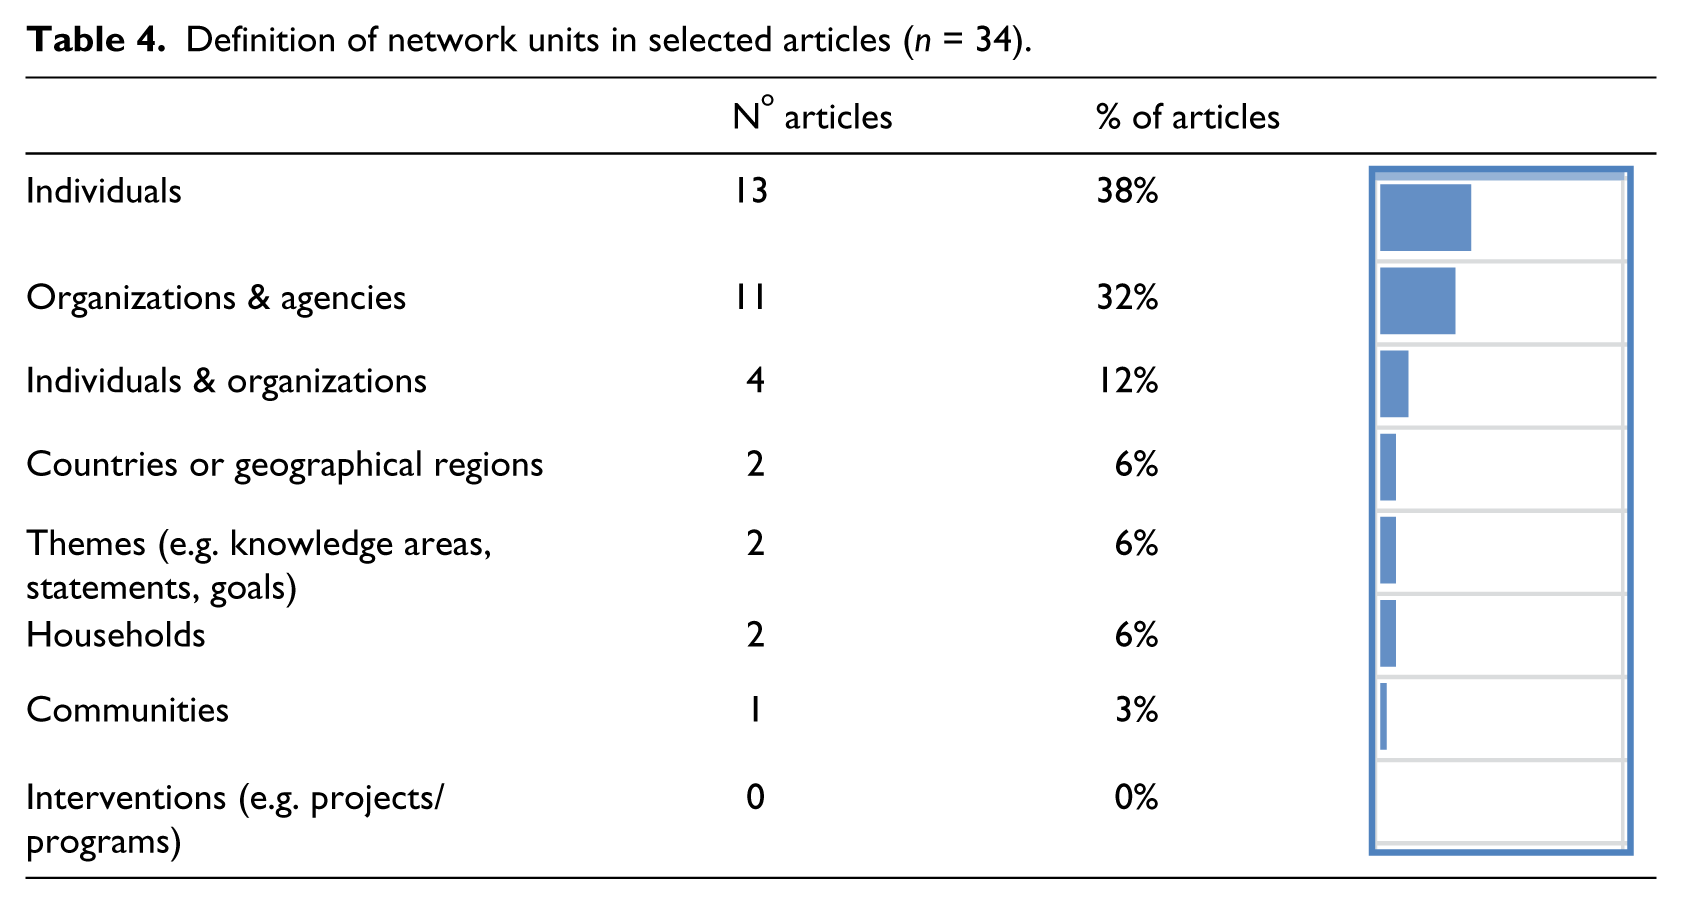
Second, evaluators must decide which nodes to consider in the network analysis. Table 4 shows that individuals (38%) and organizations (32%) are the most common actors of interest in social network analyses for evaluation purposes. Given the challenges of aid fragmentation and donor proliferation in the development sector, it would be interesting to conduct social network analyses in which the units of analysis are interventions or intervention proposals. While examples of such network analyses can be found in the literature (e.g. Grady et al., 2015; Urrea et al., 2016), none of the articles included in the review defined its units in this way. Furthermore, some articles present data on supra-individual relations (e.g. organizational relations) gathered from individuals who represent the higher level organization to which they belong. Such practices raise concerns about the accuracy of the data gathered, as these individuals might not be able to provide a comprehensive view of existing relations at supra-individual levels (Gold et al., 2008; Luque et al., 2010; Pemsl and Seidel-Lass, 2010; Wasserman and Faust, 1994). In several articles, evaluators attempted to limit this potential flaw in data quality by purposively selecting the most knowledgeable individuals (e.g. Fredericks, 2005; Honeycutt and Strong, 2012) or by aggregating responses from multiple individuals in the same organization (e.g. Pemsl and Seidel-Lass, 2010; Valente et al., 2008).
Definition of network units in selected articles (n = 34).
Third, the extent to which evaluation questions can be answered through SNA will also depend on how evaluators define the relational content of the connections among nodes. Numerous types of relations can be subjected to network analysis, and these have been categorized in various ways (e.g. Borgatti and Halgin, 2011: 1170; Knoke and Yang, 2008: 12; Wasserman and Faust, 1994: 37). In line with Marin and Wellman (2011), this review categorizes connections either as flow, interaction, social or affiliation relations. Table 5 illustrates that SNA applications within the field of (development) evaluation generally focus on multiple types of interaction and information flow. Network evaluators seem to be less interested in actors’ social relations, such as trust and friendship. Drawing on the categorization of ties proposed by Borgatti and Halgin (2011), this would imply that network evaluators concentrate on transitory, event-type ties rather than state-type ties. Further, the relative lack of cases in which relations are defined as affiliations might be explained by the limited availability of network measures for two-mode or affiliation networks. However, evaluators should be aware of the options available for two-mode networks, including transformation to one-mode networks, because large amounts of readily available data―such as attendance lists―could function as data input for two-mode network analysis.
Definition of relations among network units in selected articles (n=34).
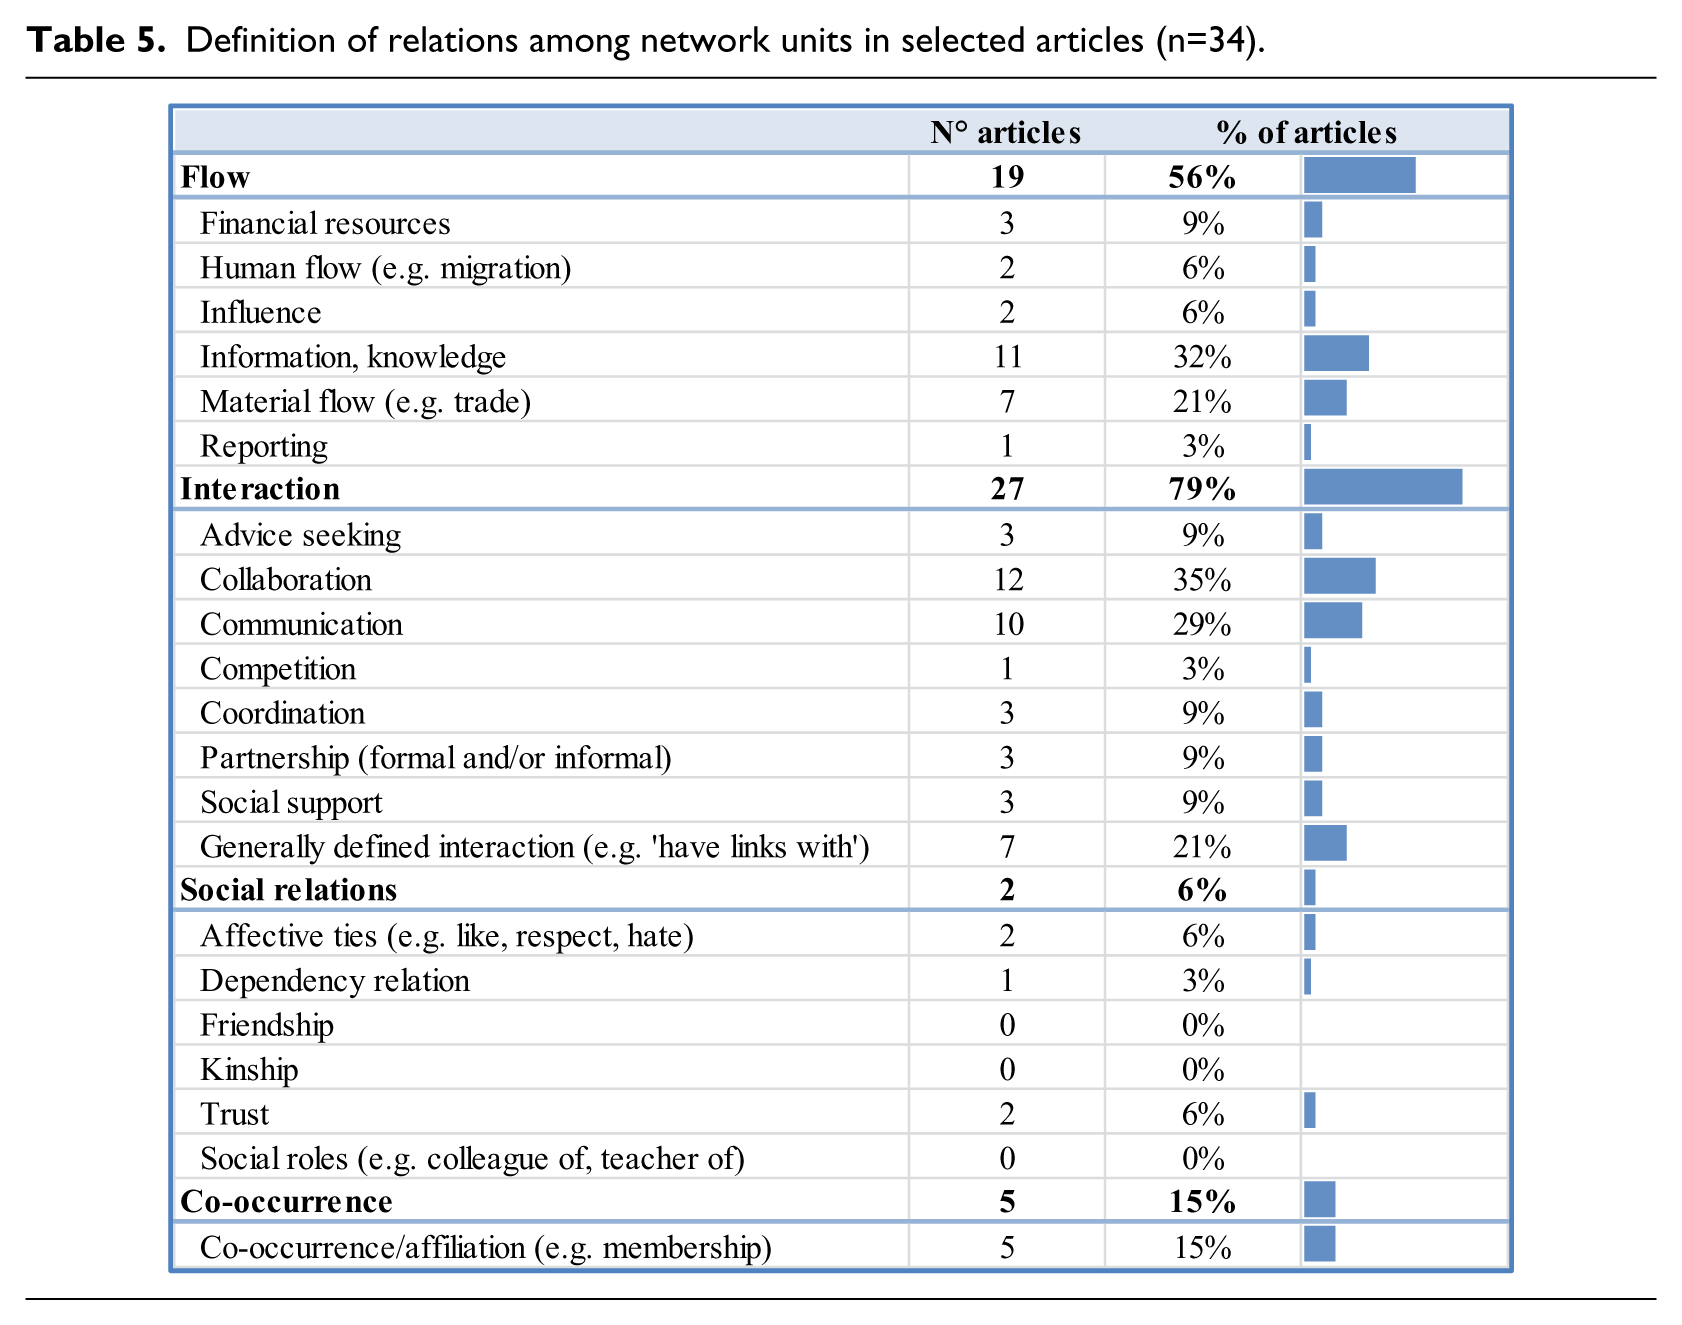
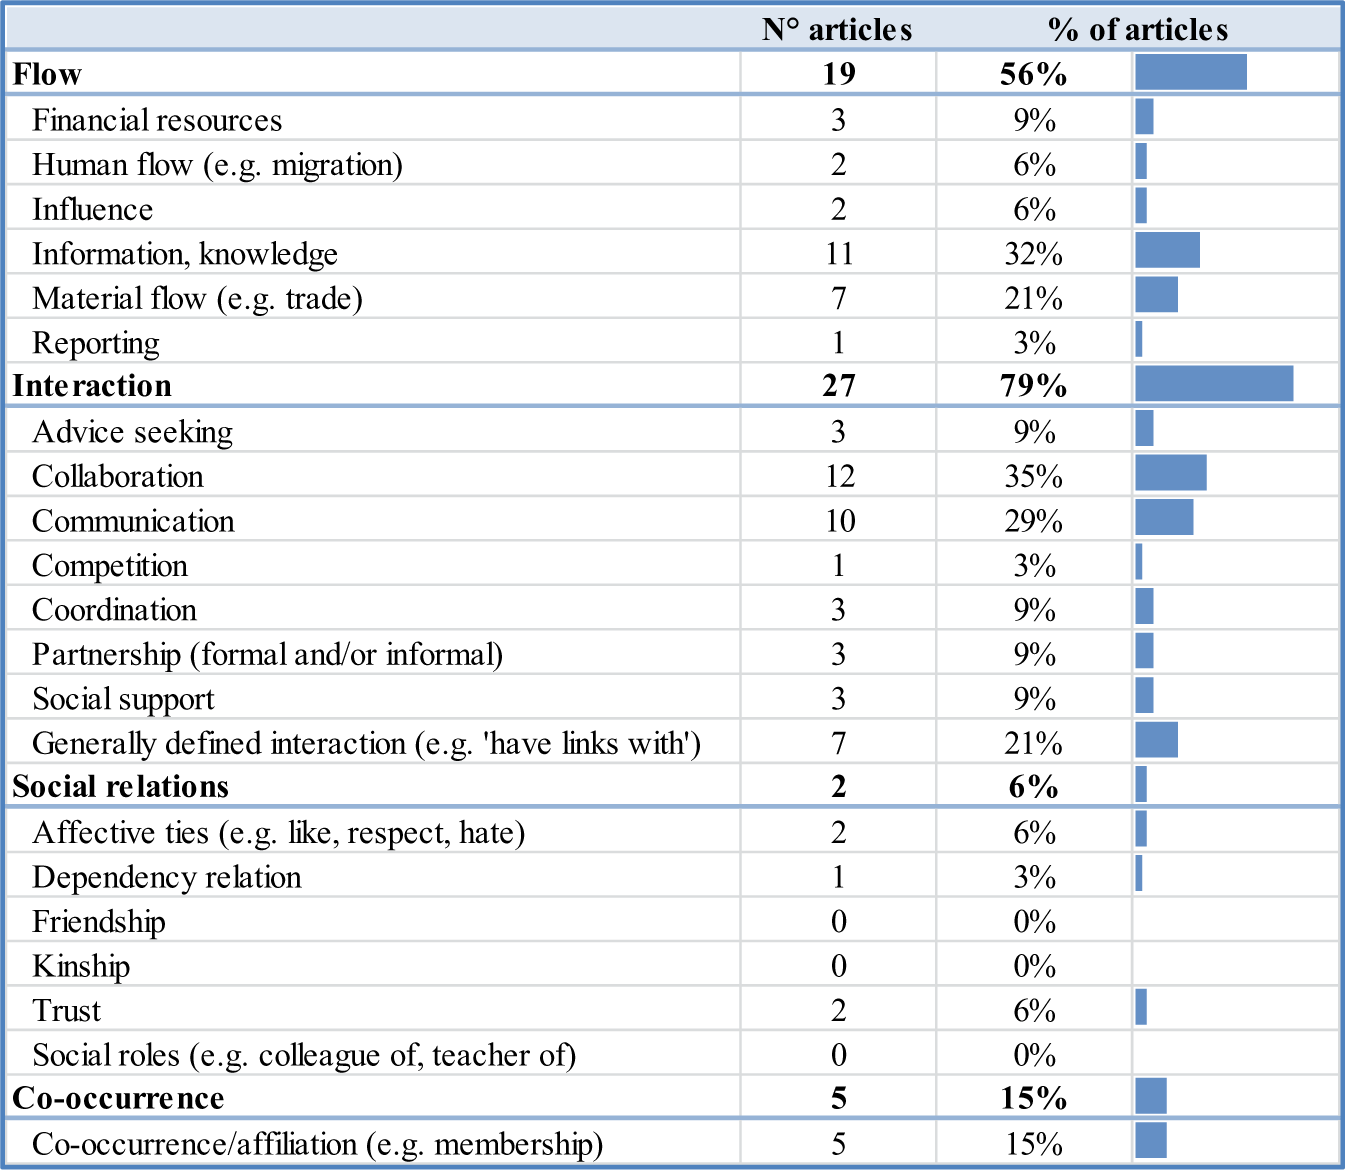
Most SNA applications (65%) examined differently defined relations among the same network units (see Table 5). We would encourage the examination of multiple relations if the number of differently defined relations are kept within reasonable limits (Provan et al., 2007), because little research has examined the benefits and risks of measuring particular network relations (Fredericks, 2005; Honeycutt, 2009; Luke et al., 2013) and network analysists are still in the dark as to how various relational contents might connect (Knoke and Yang, 2008). Paying close attention to how relationships are operationalized is also important as this determines validity; that is, the degree to which the relationship “actually measures what it is intended to measure” (Wasserman and Faust, 1994: 57). A study published by Laven et al. (2010: 279) asked organizations “to identify the organizations with which they were currently connected” (our emphasis); unfortunately, this example demonstrates the need for serious consideration of construct validity in network analysis.
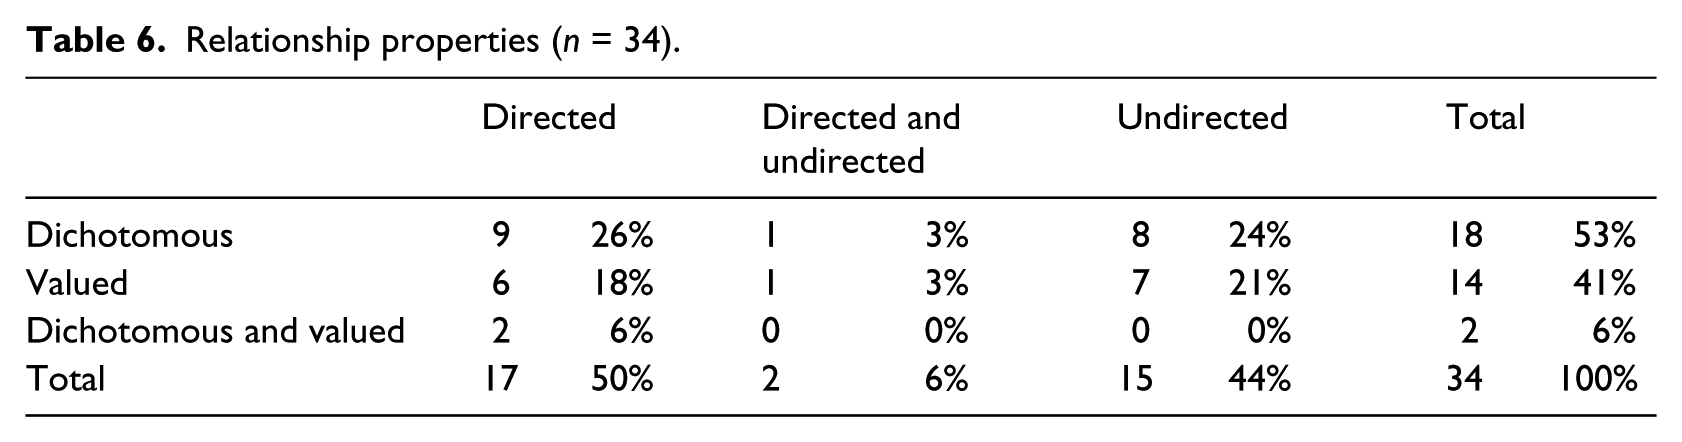
Evaluators can also specify properties for the relations they are interested in, such as whether they are directional or non-directional and dichotomous or valued (Wasserman and Faust, 1994). Table 6 shows that less than half of the articles that used SNA identified valued relationships; for instance, based on frequency (e.g. Hagen et al., 1997; Heldens et al., 2015; Petersen, 2016), degree of congruence (e.g. Coburn and Russell, 2008) or quality (e.g. Fredericks, 2005). Several authors viewed the use of dichotomous rather than valued relational data as a significant limitation of their studies (e.g. Chu-Shore, 2010; Drew et al., 2011a; Friedman et al., 2007; Gregson et al., 2011; Luke et al., 2013). The use of binary data does indeed preclude analysis of the qualities rather than quantities of relationships (Gregson et al., 2011) and ignores their often fuzzy nature (Brunelli et al., 2014). However, network evaluators are sometimes forced to dichotomize their network data because the analytical models and software packages being used have not yet been modified to handle valued information (Clifton and Webster, 2017; Thomas and Blitzstein, 2011).
Relationship properties (n = 34).
Data collection
In most SNA applications, no distinction is made between relational and non-relational (e.g. attribute) data, so data collection occurs in an integrated manner (Durland, 2005a; Scott, 2000). We therefore make no distinction between the methods used to collect each data type.
Surveys (56%) and interviews (47%) were the most common means of gathering data (see Table 7). In contrast, the use of log files (i.e. a time-stamped log of events that is automatically produced by software and computer systems), as demonstrated in de Brito et al. (2013) and Hunter et al. (2015), remains scarce. This is unfortunate given that log file data collection is rather straightforward and also provides an opportunity to measure hidden social interactions longitudinally (Hunter et al., 2015). In addition, only a handful of articles were based solely on secondary data (e.g. Arribas et al., 2009; Le Blanc, 2015). The focus on actor attribute data in traditional research and evaluation might have discouraged the development of databases on relations among actors (Engelberg, 1980; Doreian, 2001; Zickafoose et al., 2014). This does not mean, however, that existing databases (e.g. surveys, attendance lists, progress reports) could not be used for SNA. It is often possible―though not always straightforward―to transform available data into relational data suitable for network analysis.
Data collection methods (n=34).
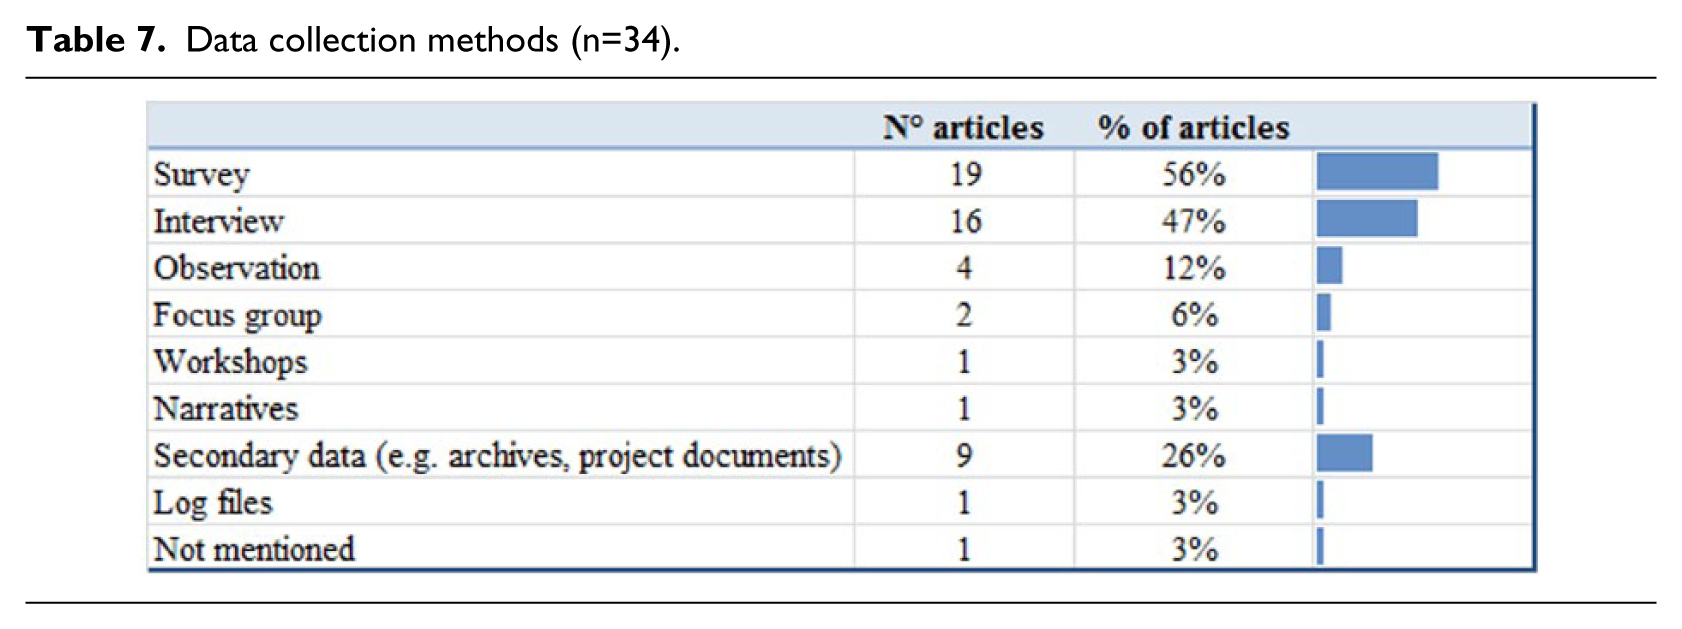
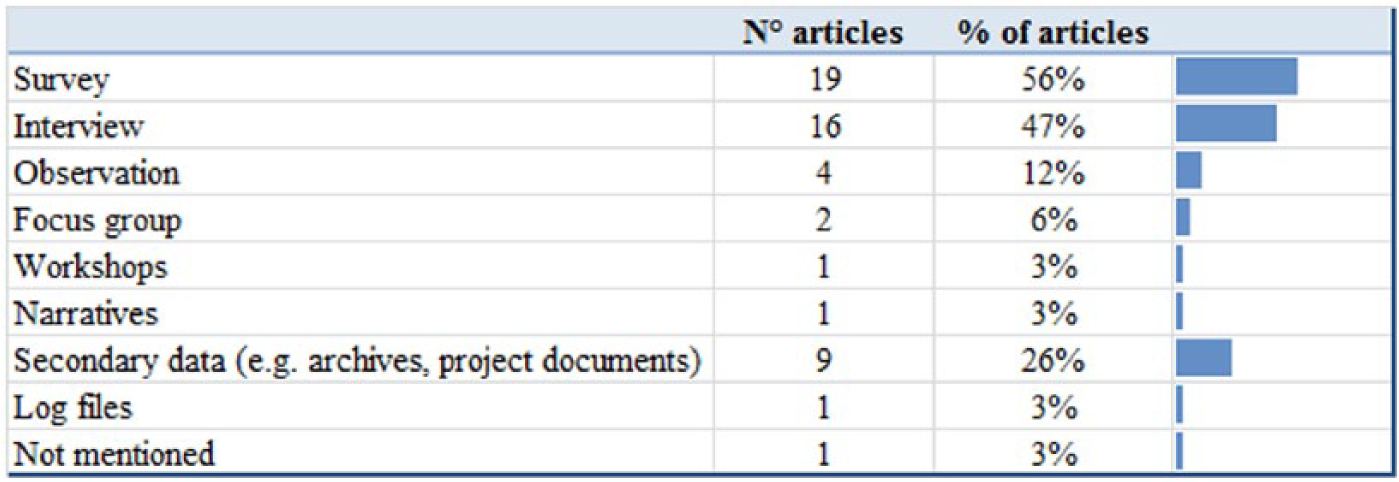
Despite these potential alternatives, SNA in evaluations frequently entails the collection of primary data (82% of the articles), which is characterized by several challenges. First, the collection process can be complex and demanding in terms of both evaluators’ and respondents’ time and resources, and requires high levels of commitment from all stakeholders, especially in longitudinal studies (Albrecht et al., 2014; Drew et al., 2011a, 2011b; Giuliani and Pietrobelli, 2011; Hermans et al., 2012; Honeycutt, 2009; Provan et al., 2007). Second, the sensitivity of SNA to data omissions constitutes an important validity concern for network evaluators. It is crucial to ensure complete data, because missing information on particular nodes may yield biased measurements and inaccurate representations and understandings of the network (Luque et al., 2010; Penuel et al., 2006; Urrea et al., 2016; Valente et al., 2008). However, obtaining high response rates 3 may be complicated by resource constraints, access restrictions and non-response (Friedman et al., 2007; Hermans et al., 2012; Hoppe and Reinelt, 2010; Provan et al., 2005; Urrea et al., 2016). In addition, it is important to consider the potential bias resulting from the non-random nature of missing network data. Non-response, for instance, might be higher among actors who are less involved in or committed to the network (Honeycutt and Strong, 2012; Real and Hasanagas, 2005). Similarly, respondents in ego-centric network studies (egos) are generally less likely to report ties among alters who are seen as isolated, which implies that weak ties may be underreported in ego-centric networks (Knoke and Yang, 2008). According to some authors, triangulating data collected through multiple methods might help reduce reliability concerns resulting from incomplete data and response biases (e.g. Friedman et al., 2007). However, the use of mixed methods might impose an unreasonable burden on evaluation stakeholders which could further limit the feasibility of network data collection and SNA more generally (Martı́nez et al., 2003). A less time-intensive alternative might be the ‘random matching within sample approach’ which assumes that the relations captured between a node and the randomly matched alters represent a qualitative measure of the node’s social network (Murendo et al., 2017). Third, the self-reported nature of primary network data can also threaten the validity and reliability of the data. Having respondents report their interactions with other people first requires them to recall these interactions, which may limit the accuracy of the information reported (Bernard et al., 1984 described in Wasserman and Faust, 1994). Carolan (2014) argues that participant observation might be a more accurate means of capturing relational behaviors. Some evaluators tackle the self-reporting reliability issues by limiting the analysis to ties that are mutually identified (e.g. Kuzdas et al., 2015; Luque et al., 2010; Provan et al., 2010). Others choose not to apply such restrictions because the fuzzy nature of what constitutes a relationship may mean that actors have different, but equally valuable perceptions of their relationship (Drew et al., 2011a; Durland, 2005b; Friedman et al., 2007).
Data analysis and interpretation
Level of analysis
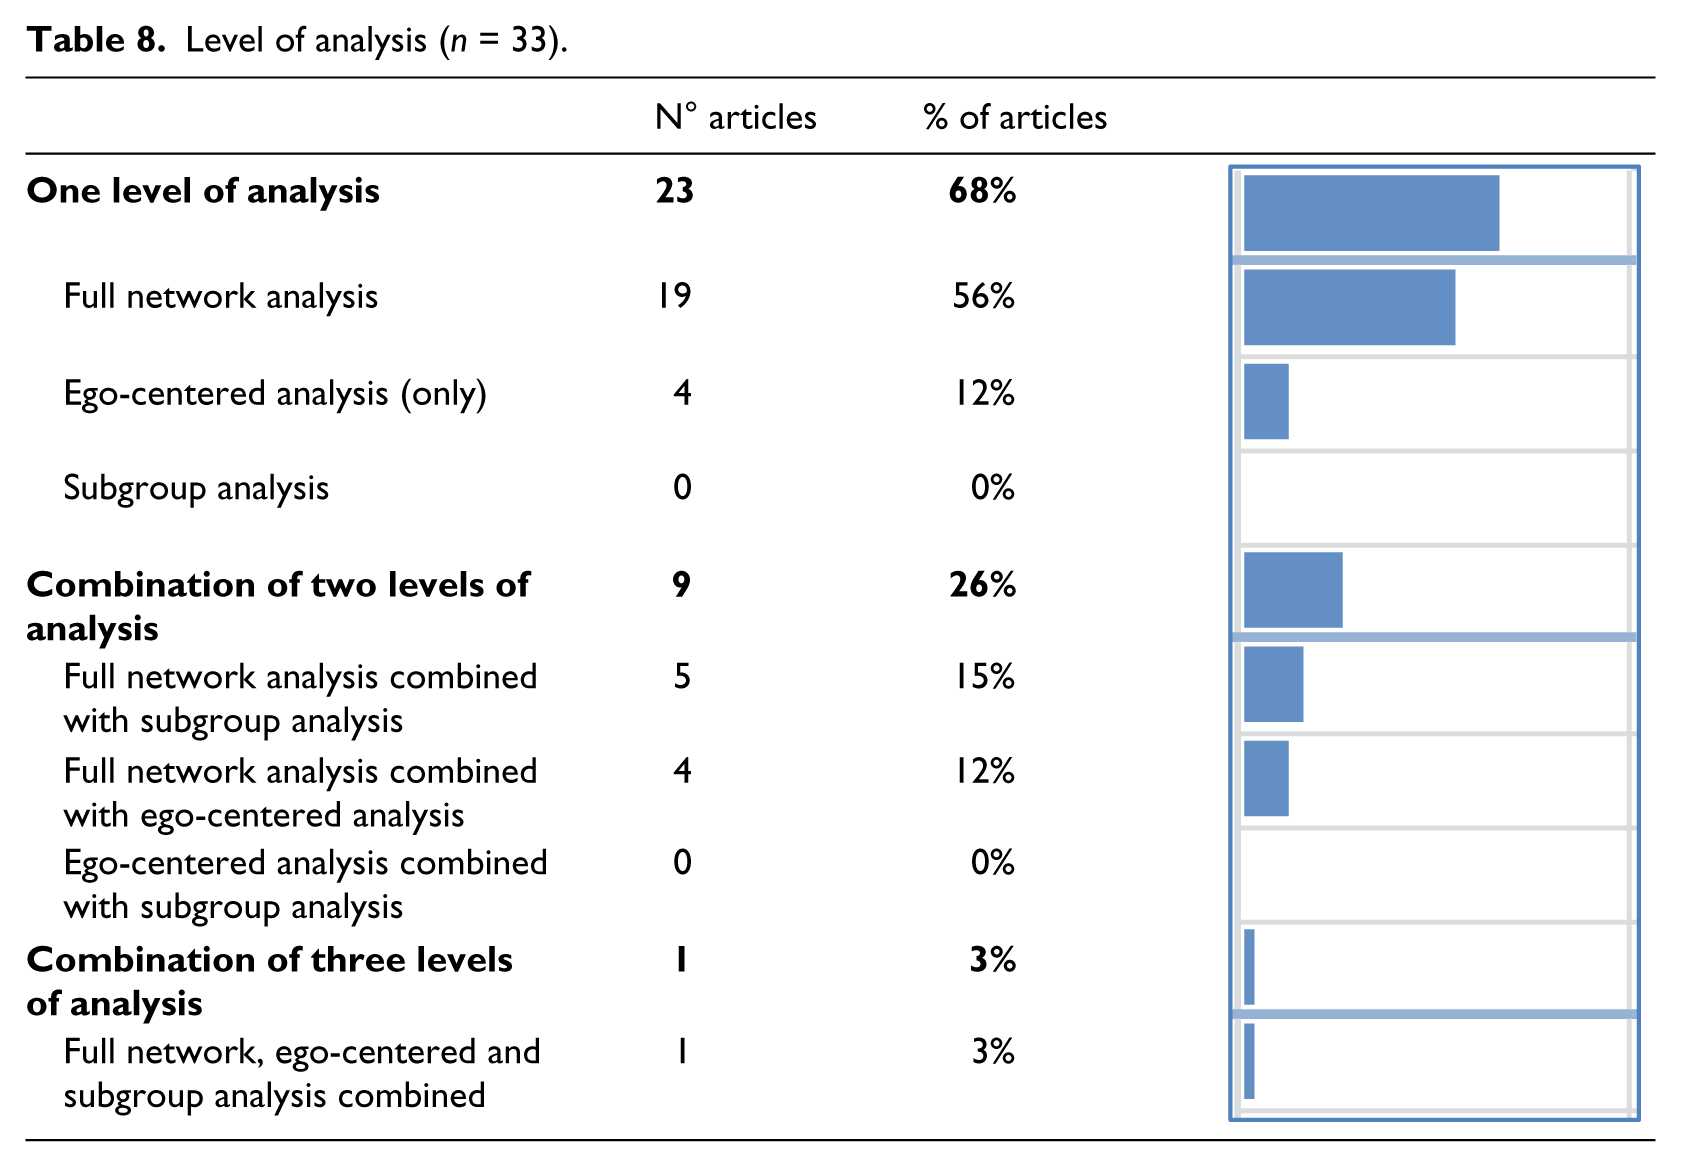
Networks and relations can be analyzed at various levels, ranging from individual actors to subgroups (e.g. clusters) and full networks (Luke and Harris, 2007). Table 8 categorizes the articles by level of analysis and seems to indicate that full network analyses were most frequently performed. However, this result should be interpreted with caution because the level of analysis was not always made clear. Moreover, the studies’ explanations of the choices made in this regard were rarely satisfactory despite the differences in the assumptions underpinning ego-centric and full network analyses.
Level of analysis (n = 33).
Data analysis approaches
Network data can be analyzed in various ways, but the analyses tend to fall into three main approaches. These are (1) network visualization, (2) descriptive metrics of network properties and (3) statistical approaches.
As shown in Figure 4, network visualizations (79%) and descriptive measures (74%) were most often used to analyze network data and more than half of the studies under review (56%) combined these two approaches. This finding is unsurprising as the growing interest in SNA is largely driven by mathematical and software developments which focus on its quantitative aspects. No similar development has taken place on the qualitative side, which leaves qualitatively oriented analyses somewhat on the sidelines (Carrington and Scott, 2011; Crossley, 2010; Durland and Fredericks, 2005a; Edwards, 2010; Heath et al., 2009). This is also apparent from the fact that qualitative analysis was only used in approximately one-quarter of the articles, and applied exclusively in combination with at least one of the other analytical approaches displayed in Figure 4. The use of mixed methods in network analysis should be welcomed, as quantitative and qualitative approaches have complementary strengths. Qualitative approaches, for instance, can reveal the form, substance and meaning given to the relations identified and enhance our understanding of the mechanisms which form the network (Hopkins, 2017; Kolleck, 2016). Furthermore, combining qualitative and quantitative approaches might also mitigate some of the risks associated with the software-driven popularity of SNA, such as the uncritical application and interpretation of network results (e.g. Cross et al., 2009; Heldens et al., 2015; Petersen, 2016; Walther, 2015). In what follows, we look at the three principal analytical approaches in more detail.
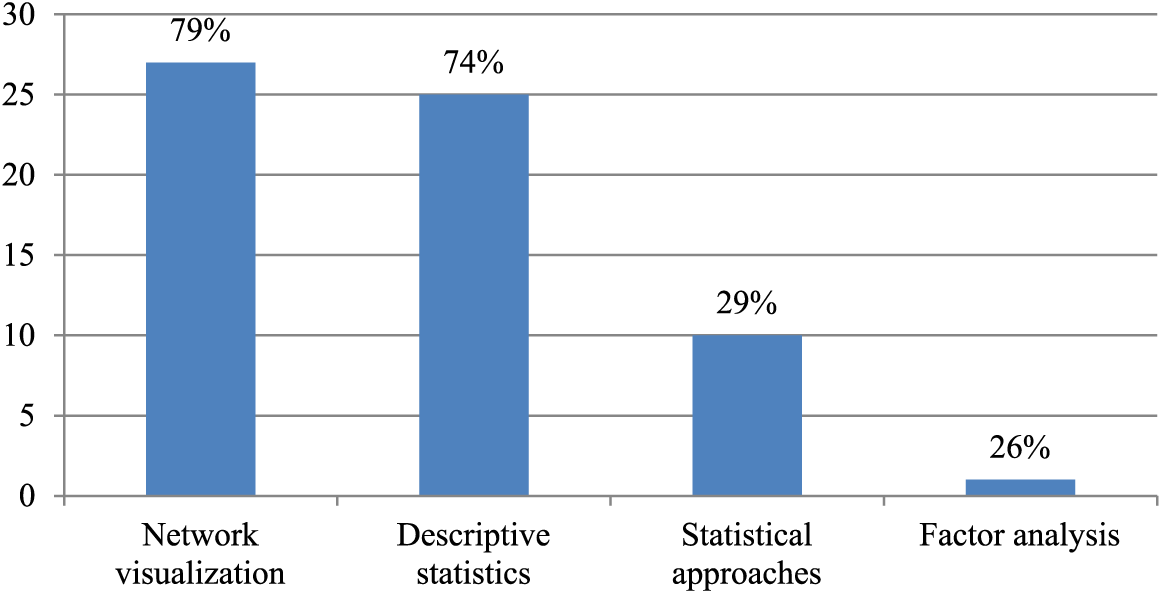
Data analysis approaches (n = 34).
Network visualization
The most common way to visualize networks is with sociograms, which are graphical depictions of the relationships in a network at a given point in time (Durland, 2005a). Visual approaches are mainly used to identify key network members and subgroups (de Brito et al., 2013; Gregson et al., 2011; Kolleck, 2016), visualize complex and informal relationships (Drew et al., 2011b) and communicate network results to evaluation stakeholders (Birk, 2005; Kuzdas et al., 2015). Social network analysists can enhance the clarity and attractiveness of network visualizations by using information on node attributes (e.g. organization type), relation attributes (e.g. quality of interaction) and/or network positions (e.g. degree centrality) to diversify the way in which the network is visually represented. Table 9 illustrates that the articles included in this scoping review mostly opted to vary the size, color and/or shape of the nodes. In addition, they also attempted to make visual representations of relations more informative by adding arrows and varying the thickness of the ties.
Network visualization options (n = 34).
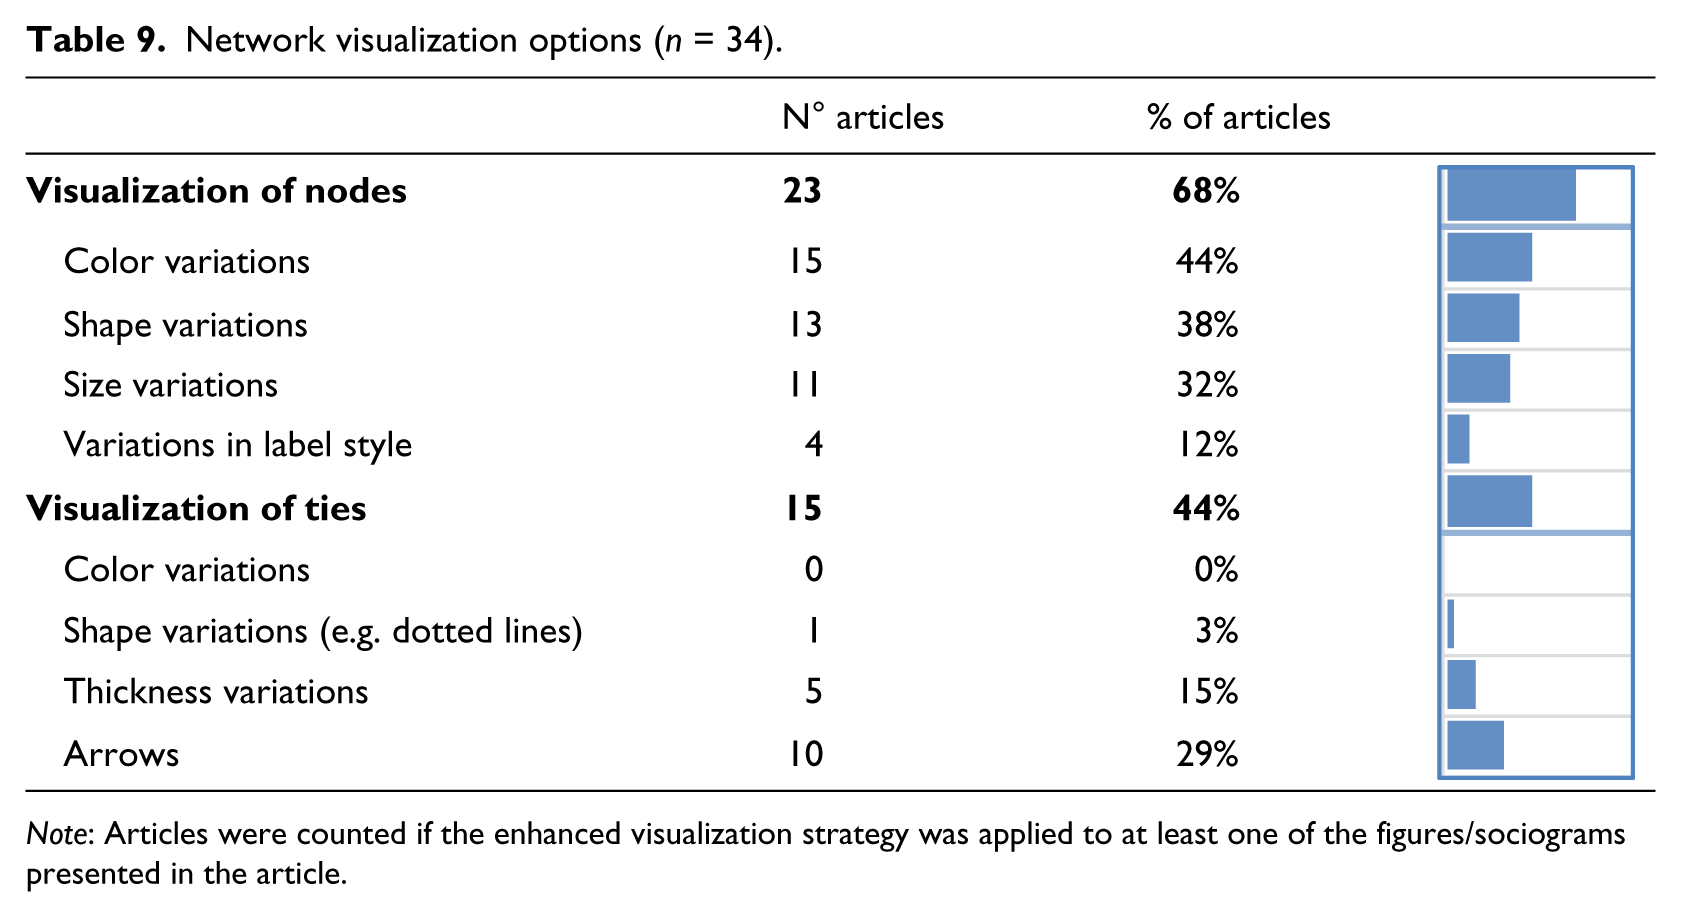
Note: Articles were counted if the enhanced visualization strategy was applied to at least one of the figures/sociograms presented in the article.
Despite this range of options for producing attractive visual representations of networks and the underlying social fabric, these visualizations shed little light on the factors that explain the nature of the networks displayed (Honeycutt, 2009; Johnsen and Starrett, 1997; Luke et al., 2010; Rödder et al., 2014). Especially in larger networks, visual analysis remains suggestive and should preferably constitute only the starting point of a more elaborate analysis (Durland, 2005a).
Descriptive network metrics
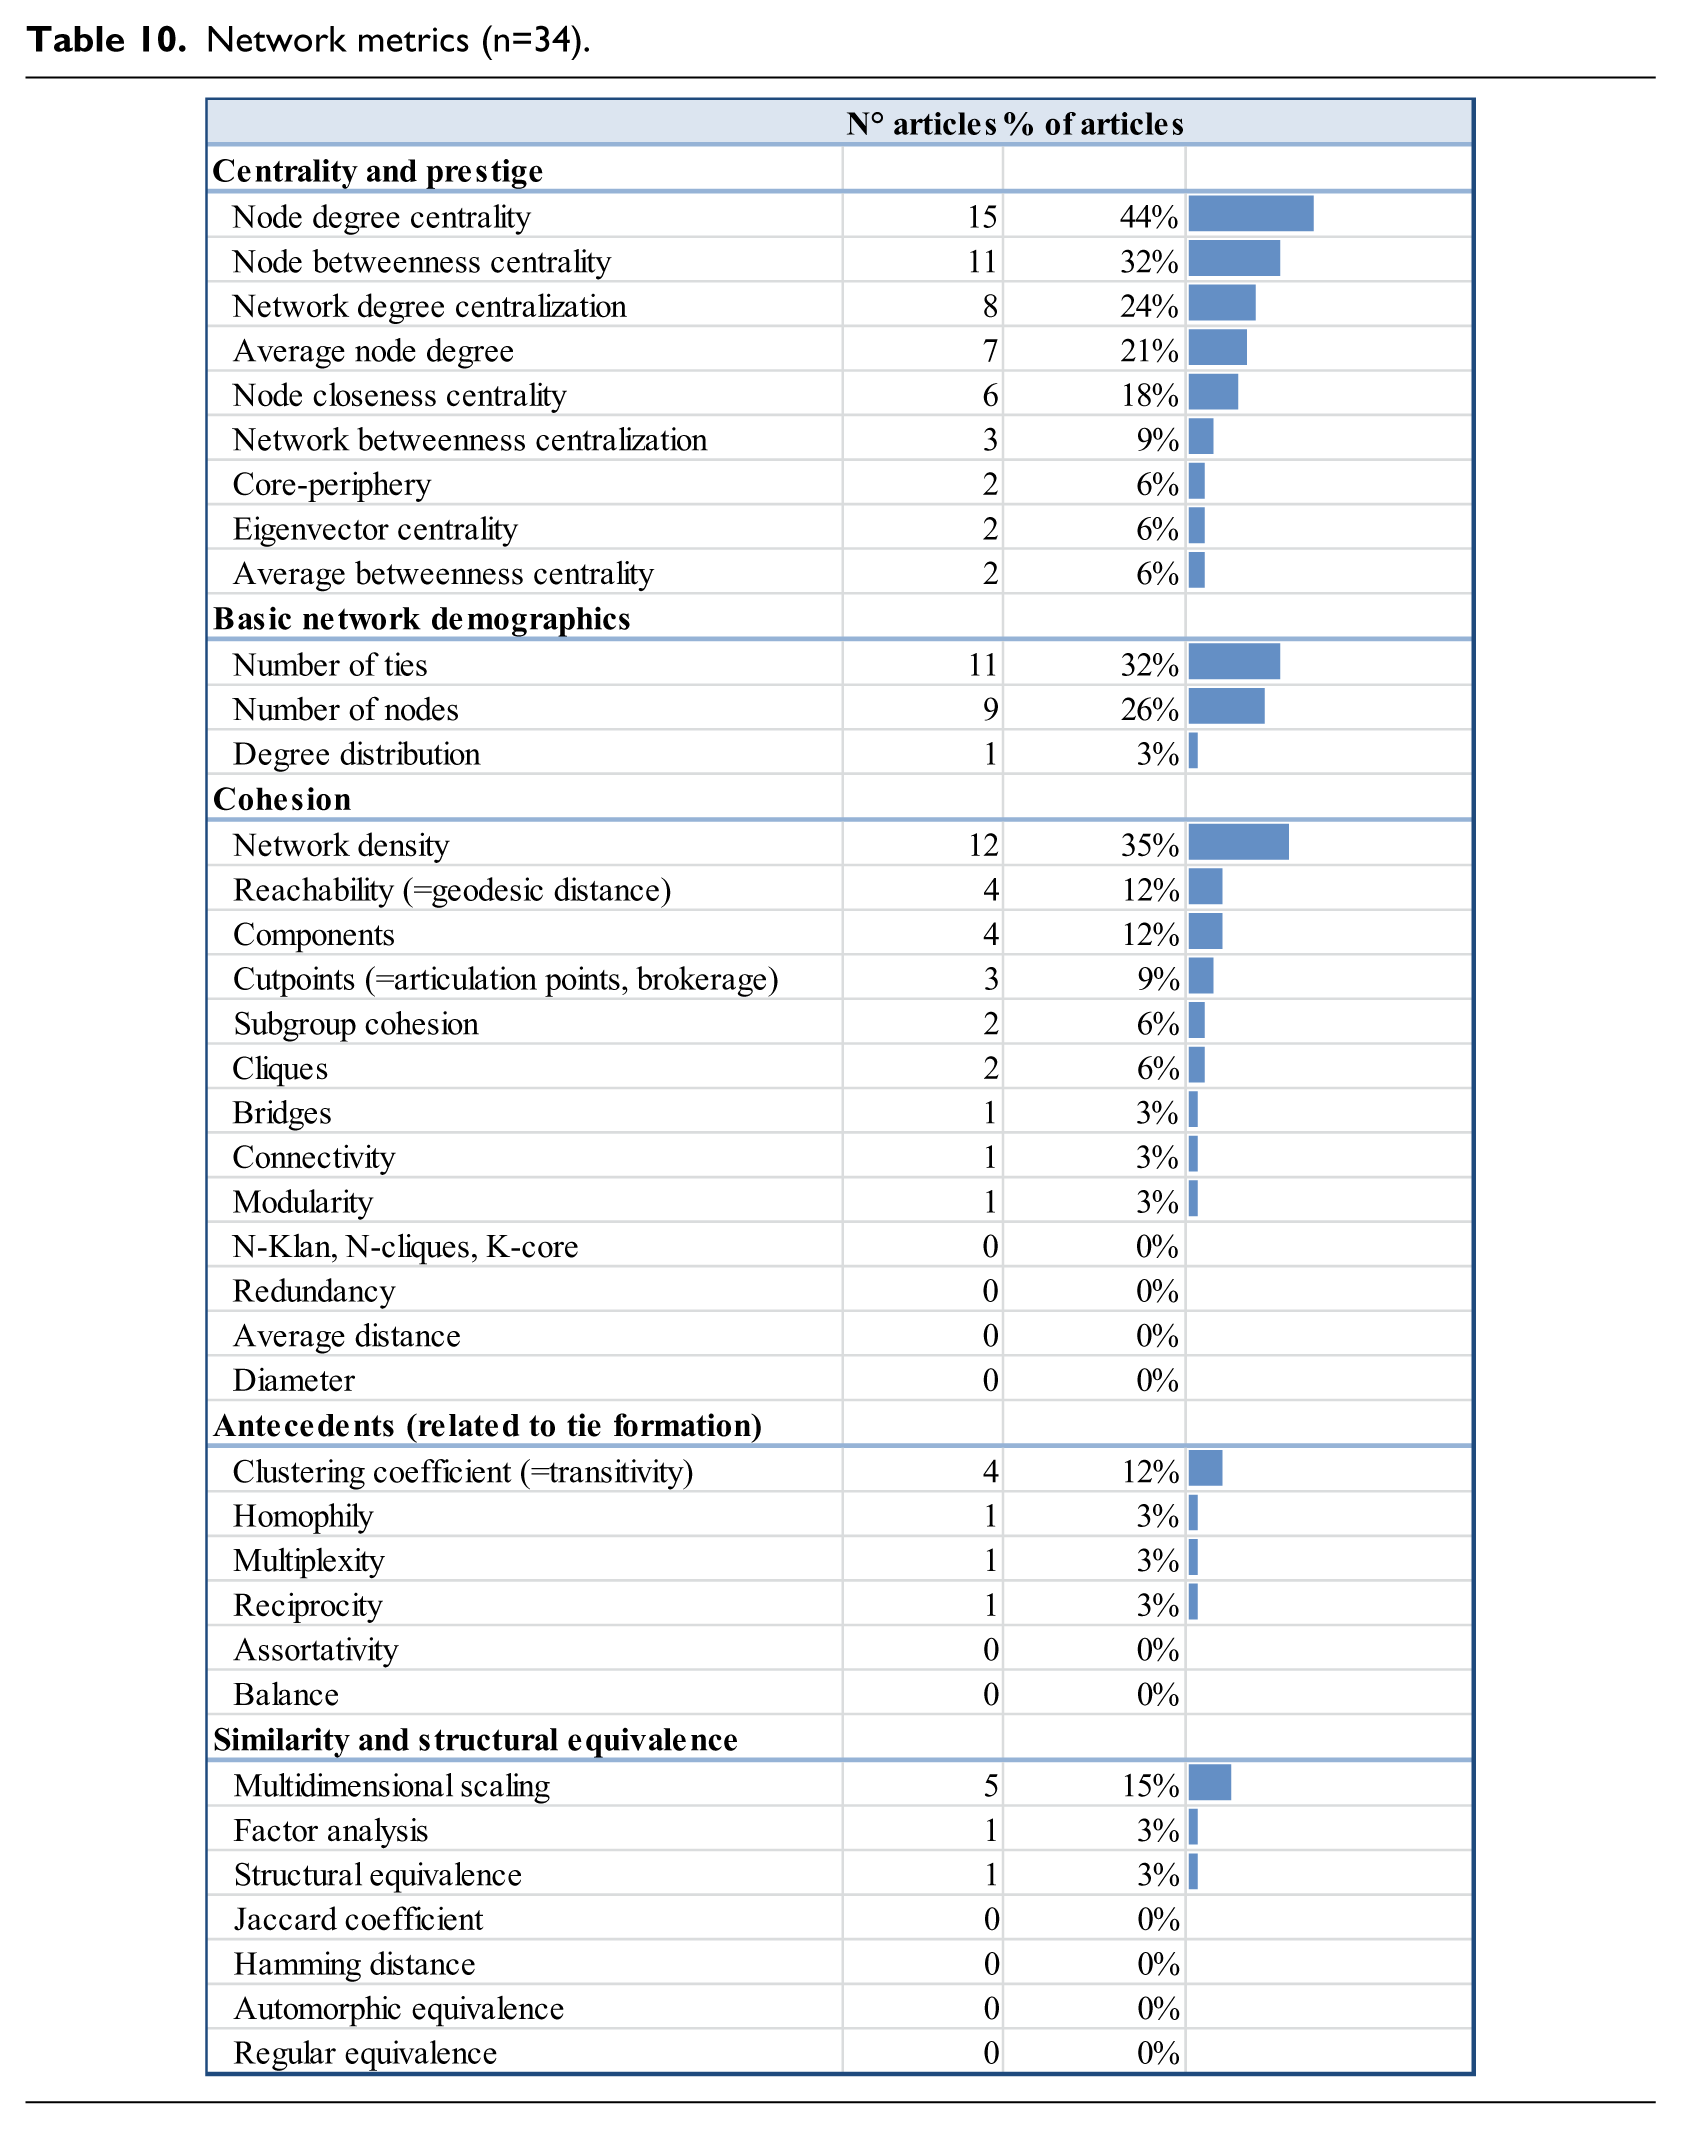
Network metrics are used frequently (75%) and are generally considered a convenient means of describing and summarizing network properties (Hanneman and Riddle, 2005). We analysed existing network metrics 4 and their level of use in the articles reviewed (see Table 10 for extensive but still not exhaustive analysis). It is interesting to note the frequent use of centrality measures, especially degree centrality (44%). These indicators, inspired by structural network theory, reflect the level and distribution of popularity, visibility, efficiency and power in the network (Barman-Adhikari and Rice, 2014; Durland, 2005a; Hawe et al., 2004; Kolleck, 2016). The second category of network metrics contains metrics of network cohesion, particularly network density. Some articles (12%) also tested for the presence of isolated actors within the network by calculating the number of subgroups (mostly components), but the attention paid to potentially disconnected actors is significantly lower than that given to ‘key’ (i.e. central or influential, actors). Besides central positions, the articles also demonstrate considerable interest in ‘brokerage’ positions in their calculation of betweenness centrality 5 measures (32%) and detection of articulation points (9%) and bridges (3%) whose removal would lead to the division of the network into separate subgroups. Metrics that received less attention were those related to the formation of ties which eventually influence network structure and evolution, such as transitivity, homophily and reciprocity. 6 Moreover, similarity among actors within the network tended to be examined using multidimensional scaling (MDS) (15%), which uses a measure of proximity between pairs to visually map network members onto a multidimensional space (Miskel and Song, 2004).
Network metrics (n=34).
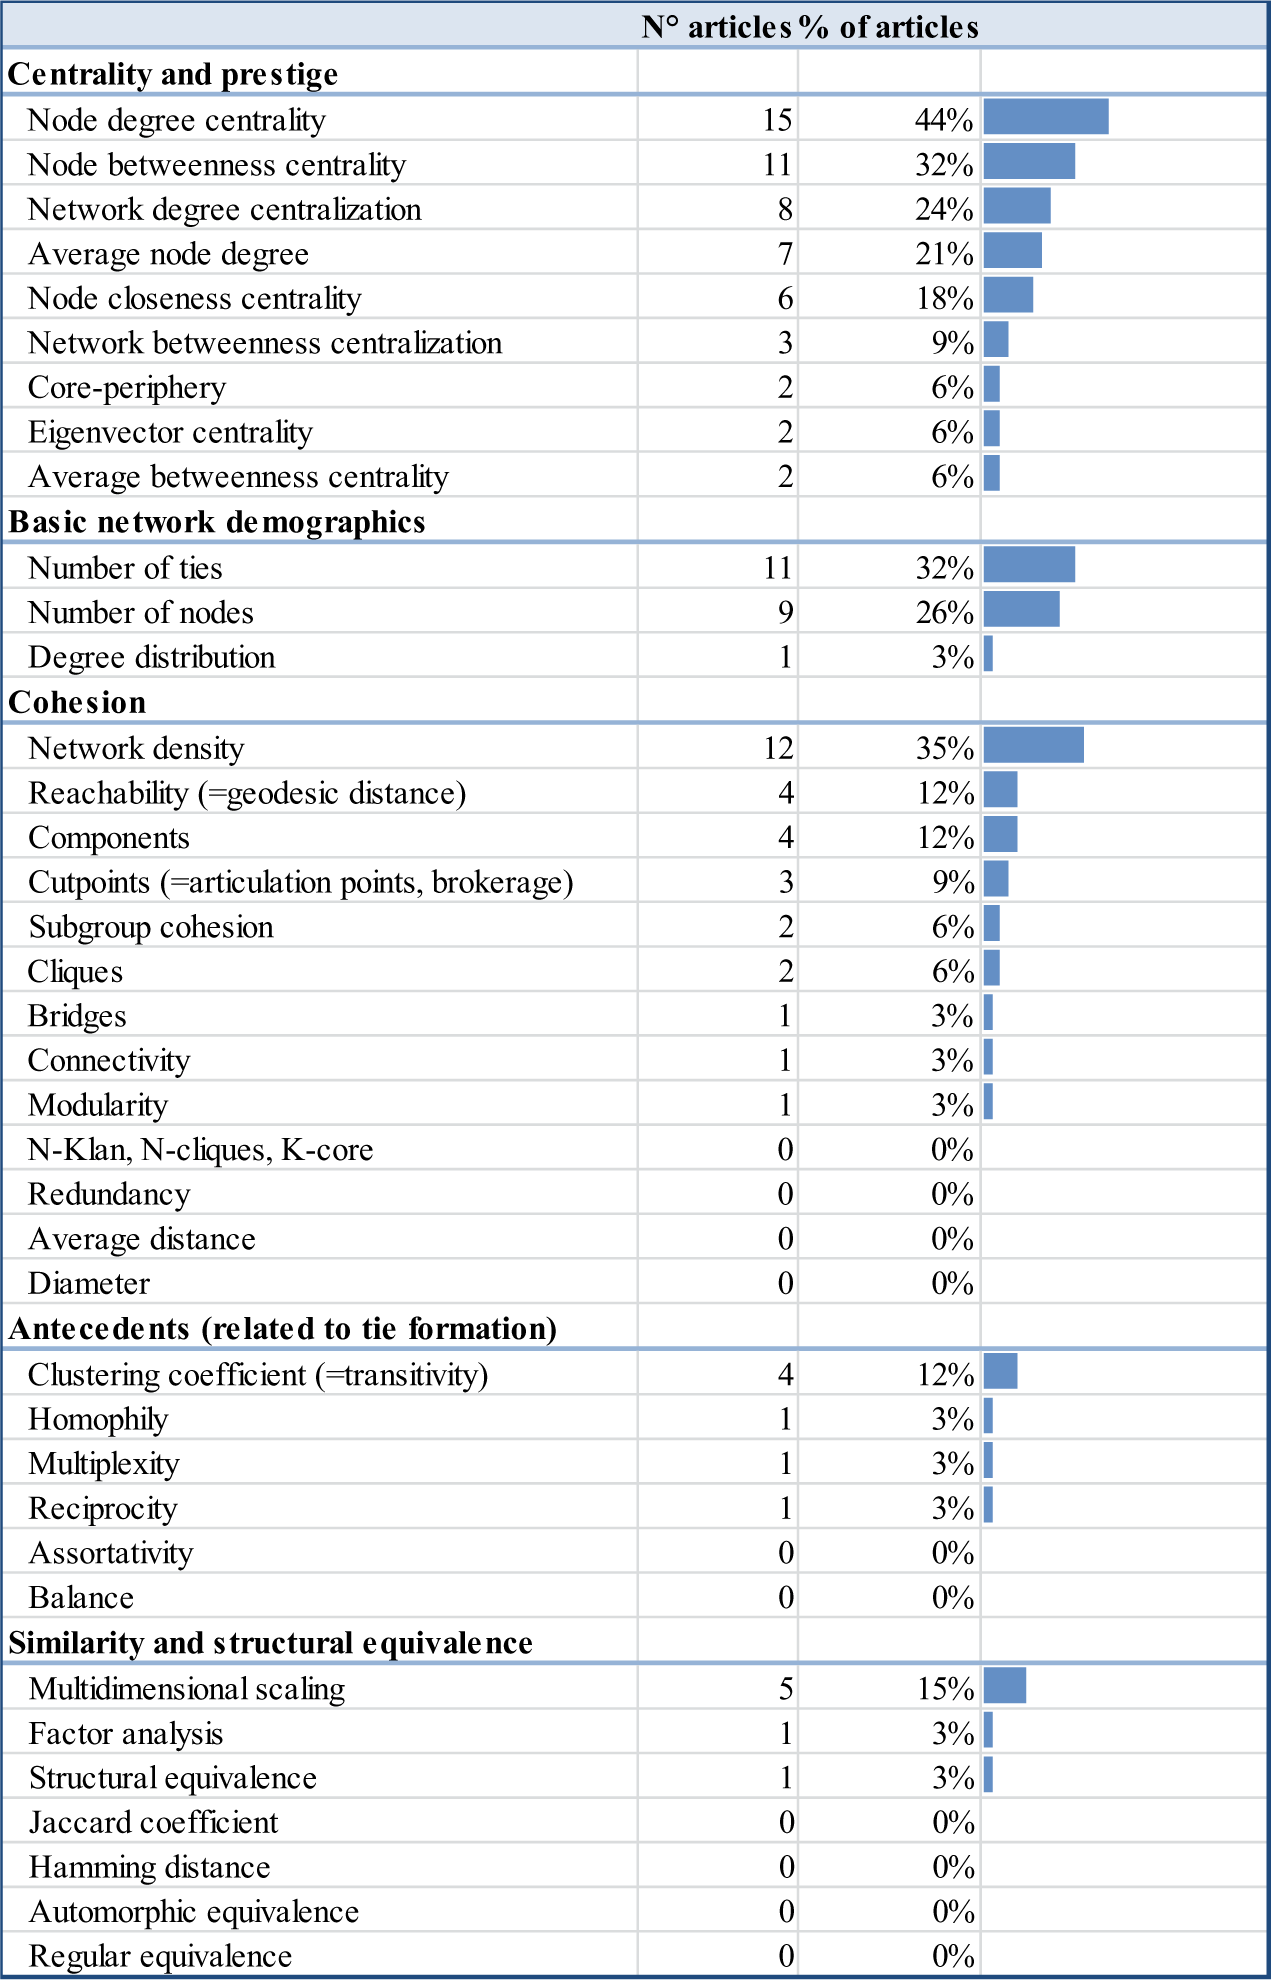
While these network metrics can contribute to a better understanding of the network under study, some recurrent concerns or drawbacks should be noted. First, a major concern relates to the uncritical use and even misuse of common network metrics, such as centrality measures (Honeycutt, 2009; Hoppe and Reinelt, 2010; Zickafoose et al., 2014). Unfortunately, it is not yet common practice to justify the choice of network metric (e.g. Bodin and Crona, 2008) or explain the metric semantically in the particular evaluation setting (Levina and Hillmann, 2013; Rödder et al., 2014). Second, the interpretation of the network metrics obtained requires careful contextualization, since different network structures are suitable for different purposes. Hence, the lack of a universal ideal network precludes the establishment of standard benchmarks for judging networks’ performance (Abma, 2006; Friedman et al., 2007; Honeycutt, 2009; Honeycutt and Strong, 2012; Provan et al., 2005; Zickafoose et al., 2014). Evaluators should therefore formulate statements about what is intended or desired within a particular setting (e.g. Chen and Chang, 2015; Heldens et al., 2015) and engage in participatory feedback sessions (Durland and Fredericks, 2005b; Fredericks et al., 2002; Provan and Milward, 2001). Third, relatively few evaluations used SNA, resulting in a lack of comparison cases which could facilitate the interpretation of network metrics through space and time (Gallemore and Jespersen, 2016; Gregson et al., 2011; Honeycutt, 2009; Hoppe and Reinelt, 2010; Kochan and Teddlie, 2005; Laven et al., 2010; Provan and Milward, 2001; Rotberg, 2013). The value of network metrics in evaluation will remain limited if only snapshot data are available. As networks are often highly dynamic, data on multiple time points are required to understand the network structure, evolution and progress observed (Albrecht et al., 2014; Carley et al., 2002; Provan et al., 2005). Fourth, descriptive network measures might yield informative statements about network configuration and processes, but caution is needed when interpreting the effects or impacts generated through the network on the basis of these measures (DeGroff and Cargo, 2009; Engelberg, 1980).
Statistical approaches
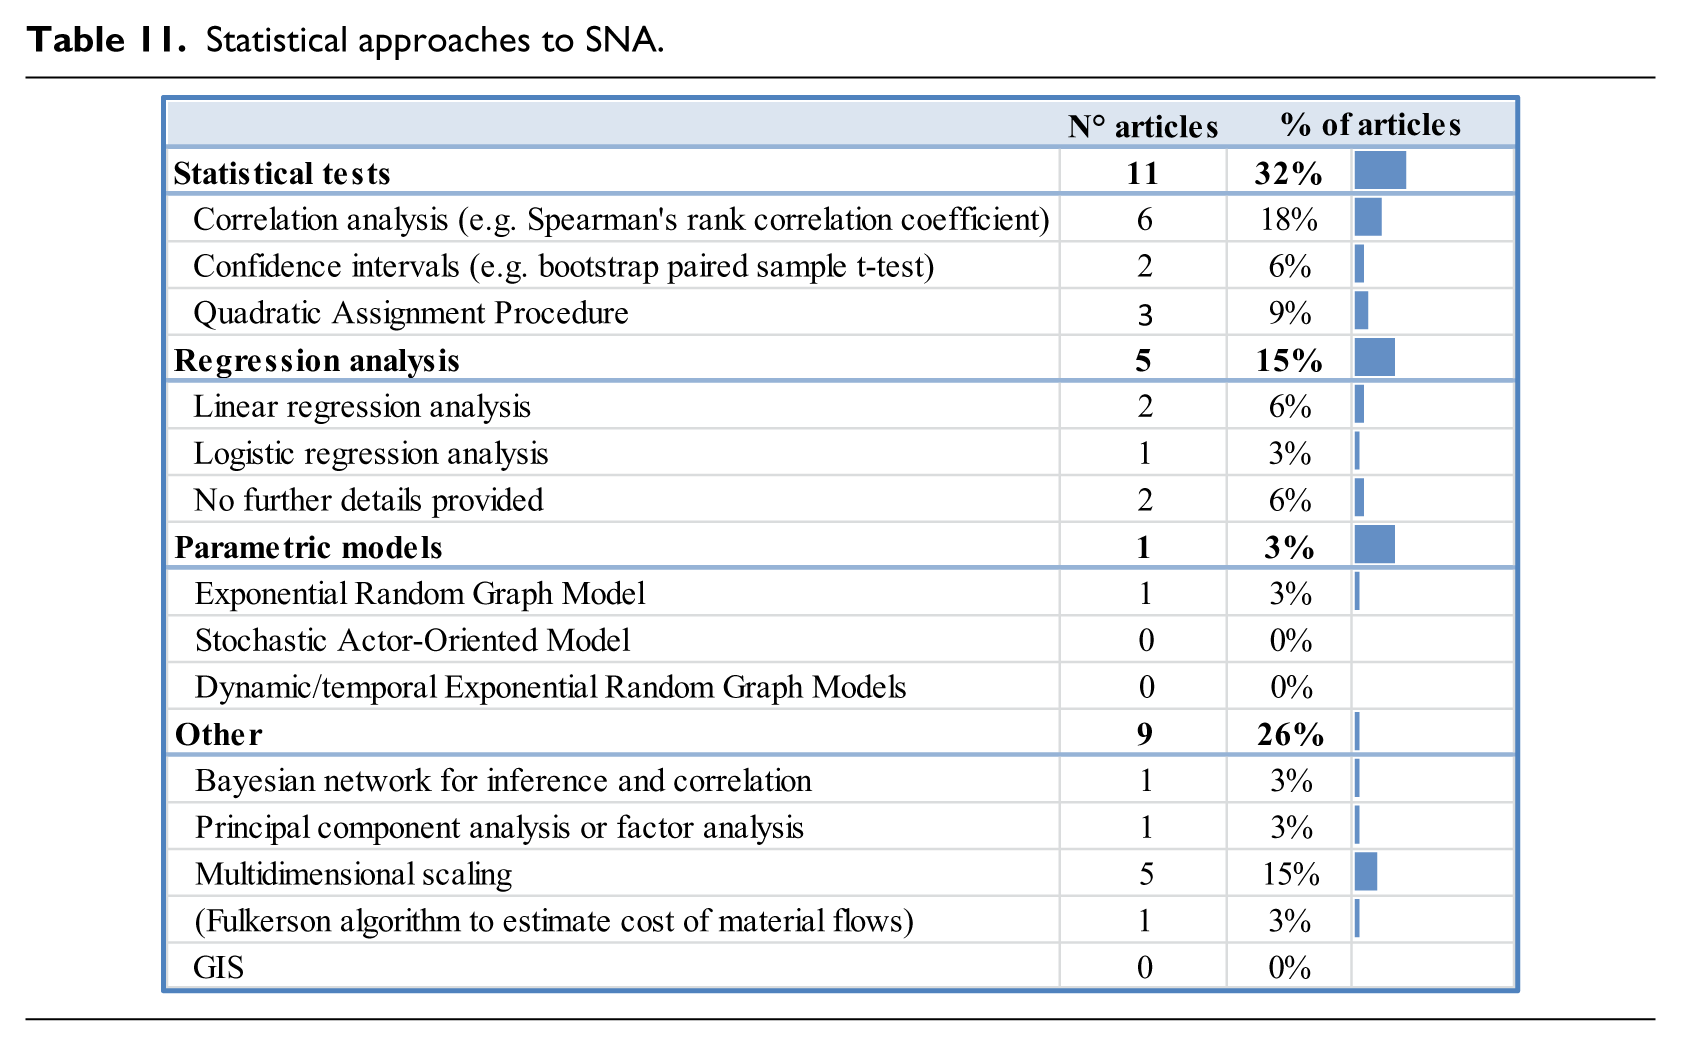
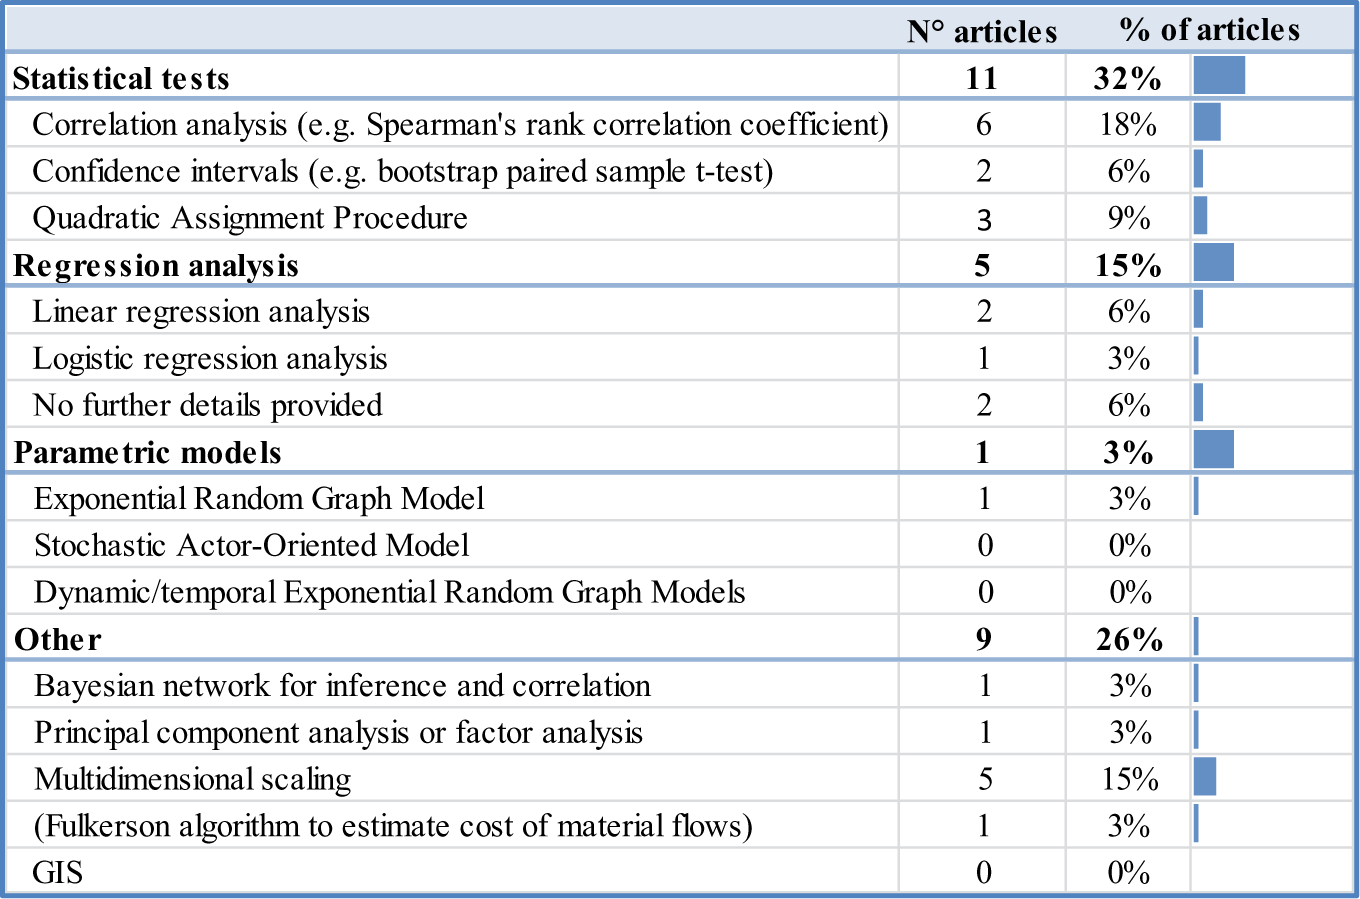
Statistical modeling of network data is one of the leading and most rapidly developing areas of SNA. As other disciplines continuously make methodological contributions to the field of SNA, ours should only be considered a preliminary attempt to outline the statistical approaches that could be used in evaluation (see Table 11). As Table 11 shows, several articles applied statistical tests, for instance to test whether changes or differences in network metrics were significant (e.g. Friedman et al., 2007; Miskel and Song, 2004). Additionally, three of the articles we reviewed used the quadratic assignment procedure (QAP) 7 to test significance and estimate the association between two or more networks containing the same actors (Heldens et al., 2015; Provan et al., 2010; Valente et al., 2008). While the use of QAP is relatively scarce, insights from these applications could contribute to our knowledge of how relational contents connect and influence the network configuration observed (see ‘Operationalization of network analysis constructs’). A handful of articles also used regression models, such as general linear regression models (Finer et al., 2010) and ordered logistic regression models (Honeycutt and Strong, 2012). Modified versions of these conventional statistical models can correct for the interdependence of observations, but their assumption that the observations are independent still hinders the modeling of network-based interdependence. The need for statistical models that no longer assume independence has led to several methodological innovations, such as exponential random graph models (ERGMs or p* models) and stochastic actor-oriented models (SAOMs or Siena models) (Cranmer et al., 2017; Doreian, 2001). ERGMs can model entire network structures in terms of local tie-based structures and patterns 8 (e.g. reciprocity, homophily) by comparing the network to stochastically generated networks of the same size (Cranmer et al., 2017; Harris, 2014; Luke et al., 2010; Robins and Lusher, 2012). SAOMs can model actor-driven processes that explain network evolution and progress (Snijders et al., 2010). While the applicability of these innovative statistical models has been illustrated in the literature (e.g. Valente et al., 2010), there were only few articles included in the review that actually used them. Of course, the evaluations included in the review may not have aimed to model network dependencies. There could be other reasons, however, for the scarce use of these models, such as the challenging process of specifying endogenous dependencies and the data requirements―especially in the case of SAOMs, which require longitudinal data.
Statistical approaches to SNA.
Discussion
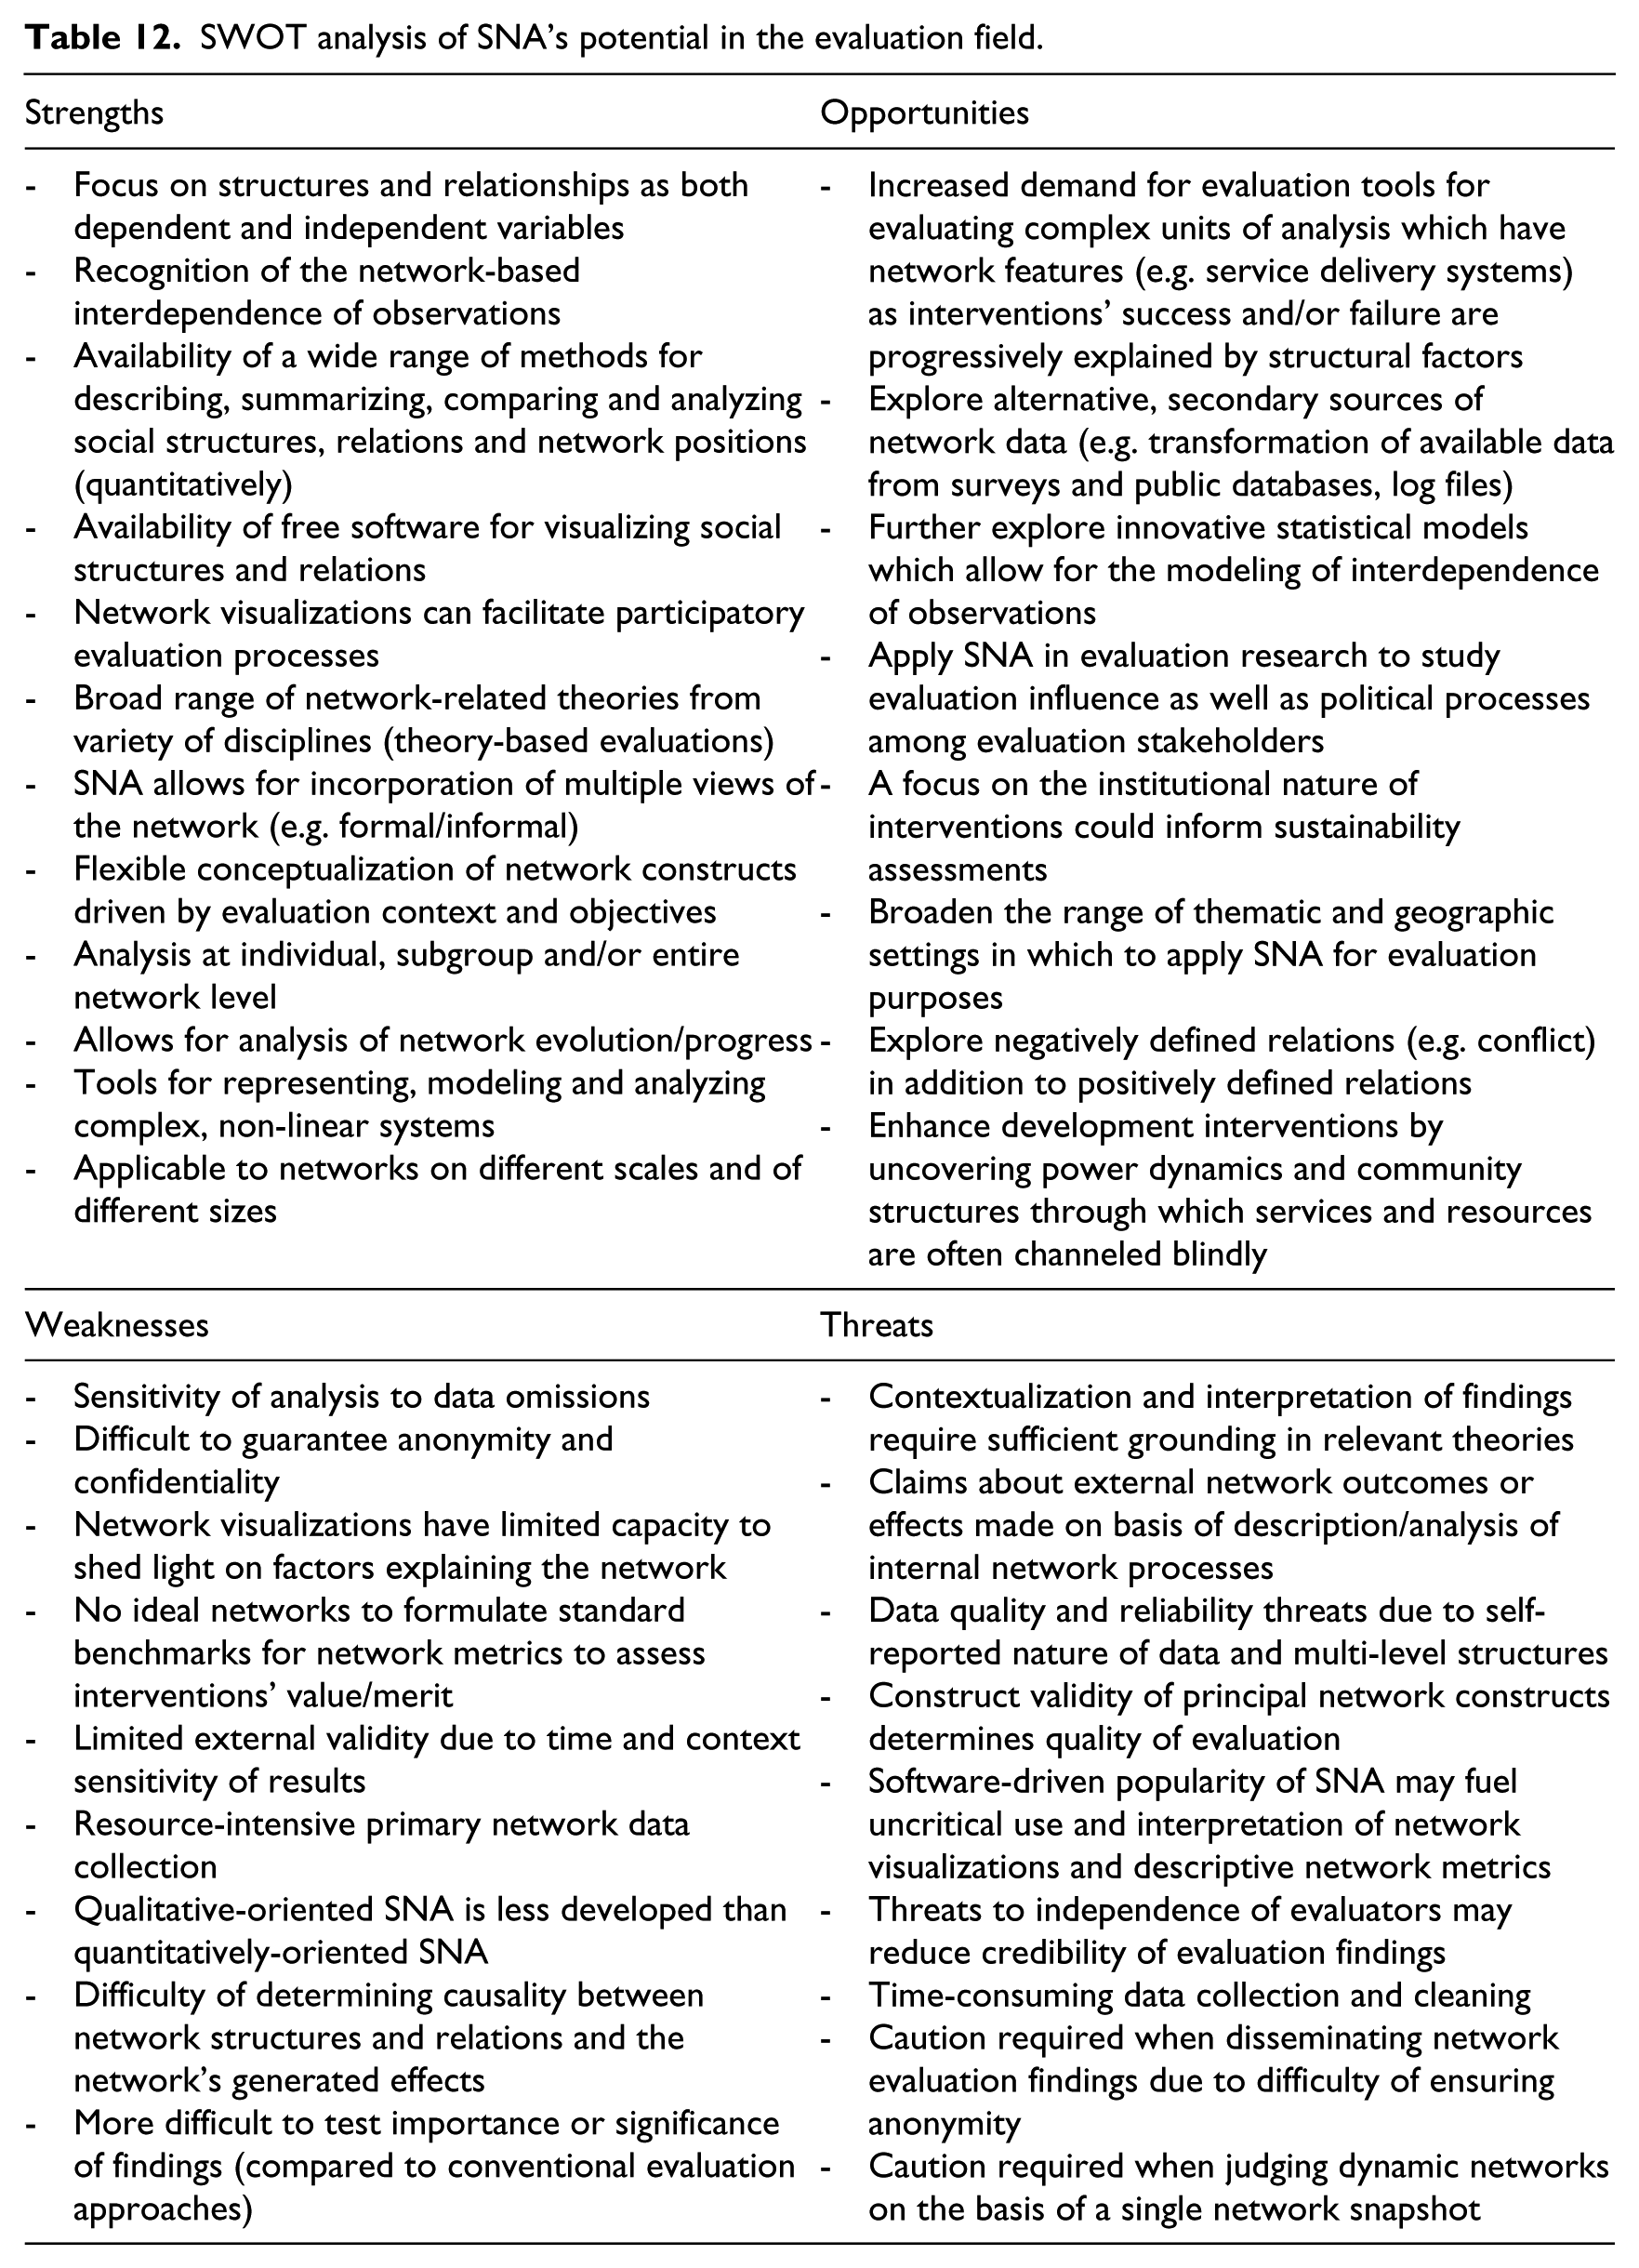
This section draws together the strengths, weaknesses, opportunities and threats related to the use of SNA in the field of evaluation practice and research (see Table 12). Following previous discussions, this section focuses on five important implications for evaluation, particularly within the development sector.
SWOT analysis of SNA’s potential in the evaluation field.
First, SNA requires the collection of the names of the respondents and their contacts (Kadushin, 2005), which makes it difficult to guarantee anonymity, especially in small networks. This raises concerns about confidentiality and the potential negative consequences of the evaluation (Drew et al., 2011a; Fredericks et al., 2002; Hayes et al., 2016; Honeycutt, 2009; Hoppe and Reinelt, 2010; Petersen, 2016). This concern is particularly valid when poor network performance appears to be traceable to certain nodes or when the results are put to use in an existing conflict or power struggle within the network. However, it should be noted that anonymity is rarely desired or required for evaluations, as it may seriously affect the interpretation and usefulness of the findings (Dozier et al., 2014; Luque et al., 2010; Petersen, 2016). Some network evaluators even consider the ability to analyze, interpret and disseminate network findings among the nodes to be a major advantage of network analysis. In line with this reasoning, Corlew et al. (2015), for instance, deliberately abandoned the principal of confidentiality so that they could customize network tools and recommendations to assist the network under evaluation.
Second, while insights from SNA could be at least as valuable and important in developing settings as in more developed settings, there seems to be a geographical bias in the degree to which SNA is currently being applied. The low share of SNA applications in developing settings might be due in part to the fact that the review only considered articles published in English-language, international journals, but we expected this effect to be counteracted by the incorporation of articles published in development-related journals. Yet, only 26 percent of the articles included in the review focused on interventions located in developing regions, whereas more than half related to interventions implemented in the United States.
Applying SNA in developing regions could be more challenging because of the limited availability of information systems and funds needed to engage in resource-intensive primary data collection. However, SNA has much potential to enhance the understanding of social structures and relations in communities and/or among implementation partners. This understanding is crucial to improving the effectiveness and sustainability of interventions and to reducing the likelihood that development initiatives unintentionally reinforce inequity and exclusionary processes.
Third, a hotly debated issue in the development evaluation literature is whether and how evaluations should address and demonstrate causal attribution between the intervention being evaluated and its outcomes and impact. Evaluations are not always required to establish causal attribution, but it is important to discuss SNA’s implications for causal inference. The concept of ‘causality’ is further complicated when evaluators adhere to SNA’s structural paradigm, because it implies that the causes of the changes observed should be sought not (only) in actor attributes (as was the case in conventional approaches), but also in structural processes or mechanisms (Doreian, 2001; VanderWeele and An, 2013). This is challenging, because multiple mechanisms often operate simultaneously and vary across time and space (Doreian, 2001; Fafchamps, 2015). It is unsurprising, then, that the challenges encountered in determining causal relationships between network structure and valued external network outcomes are a recurring theme in the articles included in this review (e.g. Barman-Adhikari and Rice, 2014; Engelberg, 1980; Honeycutt, 2009; Honeycutt and Strong, 2012; Leavy, 2015; Provan et al., 2010; Urrea et al., 2016; Yuldashev and Sahin, 2015).
It would be premature, however, to conclude that establishing causality in network analysis is impossible. A valuable starting point for addressing causality might be to develop a context-specific theory about how the governance of the network might affect its performance, in order to facilitate interpretation and assessment. While SNA provides no theory of its own about how relations affect societal outcomes (Kenis and Schneider, 1991: 44 described in Albrecht et al., 2014), a wide variety of theories from different disciplines could help evaluators explore the link between network output and performance (Davies, 2004; Drew et al., 2011a; Gest et al., 2011). These include social capital theory (e.g. Albrecht et al., 2014; Coburn and Russell, 2008; Dewachter and Holvoet, 2017; Laven et al., 2010; Petersen, 2016), collective action and common-pool resource theory (e.g. Bodin and Crona, 2008; Kuzdas et al., 2015; Schnegg and Linke, 2015), systems theory (e.g. Engelberg, 1980; Luke et al., 2010; Provan et al., 2005; Real and Hasanagas, 2005; Wright et al., 1981), social influence theory (e.g. Barman-Adhikari and Rice, 2014; Gravel and Tita, 2015), information theory (Rödder et al., 2014) and transaction cost theory (e.g. Gallemore et al., 2015). The use of longitudinal network data should also be encouraged, as such data can help evaluators distinguish potential sources of correlation in network configuration and outcomes, something that is not possible with cross-sectional data (Albrecht et al., 2014; Friedman et al., 2007; Kochan and Teddlie, 2005; VanderWeele and An, 2013). Additionally, mixing quantitative and qualitative (e.g. ethnographic) methods of inquiry can enhance understanding of the causal relationships underpinning the network outcomes observed (Doreian, 2001; Engelberg, 1980; Faas et al., 2015; Friedman et al., 2007; Kochan and Teddlie, 2005; Laven et al., 2010; Martı́nez et al., 2003; Provan et al., 2007; Walther, 2015).
Fourth, there is considerable scope for applying SNA in evaluation research. Due to the politically sensitive nature of evaluation, for instance, it might be valuable to examine how social relations between evaluators and stakeholders influence the possibilities and constraints of evaluative practice (Abma, 2006). Similarly, SNA tools could be used to explore how stakeholder relations change as a consequence of their engagement in evaluation processes. The literature on evaluation influence and use (e.g. Henry and Mark, 2003; Mark and Henry, 2004) could also benefit from SNA applications grounded in well-established ideas and theories, such as information dissemination theories, social capital theories and Granovetter’s strength of weak ties, in order to model and optimize the dissemination and influence of evaluative knowledge and processes (e.g. Khalil et al., 2016).
Fifth, power structures and conflicts among participants, including evaluators, might have a greater influence on the evaluation process when SNA approaches are used compared to more conventional methodologies. This is partly due to the sensitive and political nature of questions asked about social ties (Penuel et al., 2006), which may foster feelings of unease and reluctance, especially when respondents are asked to report on negative or private relations (e.g. Bowen et al., 2014; Caniato et al., 2014; Drew et al., 2011a, 2011b; Gold et al., 2008; Luque et al., 2010). In addition, network evaluators may struggle to achieve a level of independence sufficient for obtaining credibility, especially if long-standing mistrust exists among stakeholders (Lehtonen, 2014). Similar threats to independence arise when expertise and knowledge are controlled by a limited number of stakeholders, making evaluators dependent on their truthful collaboration (Benjamin and Greene, 2009; Penuel et al., 2006).
Conclusion and recommendations
Conventional analytical approaches to evaluation implicitly assume that relationships do not matter. However, increasing recognition of the critical role of relations and structures in determining societal and organizational outcomes has made it difficult to argue that these structural factors do not deserve our attention. This scoping review explored the current and potential use of SNA―which emphasizes the importance of relationships among interacting units―in the evaluation field. The review of journal articles revealed that SNA is used relatively rarely for evaluation purposes, especially in developing regions. Evaluators who do use SNA value its fundamental focus on relations and structures, the high degree of flexibility with which network constructs can be conceptualized in terms of the evaluation objectives, and the variety of theories that can guide the evaluation’s design and the interpretation of its findings. Additionally, the wide range of network tools available in SNA enable network evaluators to identify key stakeholders, assess network structures and relations quantitatively, visualize complex networks and model the networks observed. Various types of evaluation questions can be addressed using SNA, but the review supports the conclusion of Albrecht et al. (2014) that the focus seems to be on internal network processes. Few evaluations have succeeded in linking observed network outputs with externally valued network outcomes in a credible manner. The review also shows that network analyses conducted for evaluation purposes look mainly at interactional (e.g. collaboration and communication) and flow (e.g. information exchange) relationships within networks composed of individuals and/or organizations. At present, network data are collected mostly through surveys and interviews, despite the resource intensity of this data collection process, the validity threats associated with self-reported data and the increasing availability of secondary data suitable for network analysis (e.g. log files). Network visualization and descriptive network metrics are the most popular approaches to analyzing network data. Evaluators also employ inferential statistical analyses, but application of the most innovative statistical models (e.g. ERGMs, SAOMs) remains scarce. Quantitative analyses are only occasionally complemented by qualitative analysis, meaning evaluators may miss out on the benefits of mixed-methods approaches in SNA.
Our review concludes that the SNA approach encompasses many tools that could be valuable in the field of evaluation, especially in the development sector. However, further work is needed on the interpretation of descriptive network metrics and the link between network outputs and external network effects. Additionally, our findings suggest that network evaluators should explore the possibility of using secondary network data, perhaps by transforming data that is already available. This may create opportunities to engage in longitudinal network analysis, which would better capture the dynamic nature of most networks. We also encourage evaluation practitioners and researchers to explore the full range of opportunities offered by SNA, bearing in mind that such a structural approach could significantly enhance the usefulness and influence of evaluations as well as the effectiveness and sustainability of development efforts.
Footnotes
Acknowledgements
The author is grateful to Nathalie Holvoet, Danny Cassimon and Sara Dewachter for helpful comments and suggestions on earlier versions of the article. The anonymous reviewers are thanked for the valuable feedback on the draft manuscript. Any remaining errors are the author’s own responsibility.
Funding
This research received no specific grant from any funding agency in the public, commercial, or not-for-profit sectors.