






Abstract
The Likert-type scale is widely used to measure destination image but is ill-suited for relative comparisons across items or groups because of its methodological characteristics. As a forced-choice method, best–worst scaling (BWS) compels respondents to select both the most and least preferred items, thereby overcoming this limitation. This study assesses the effectiveness of BWS by measuring cognitive image using case 1 BWS and comparing the results with those obtained from a Likert-type scale. An analysis of domestic tourists’ cognitive image of Hakodate City, Japan, suggests that BWS identifies differences more clearly than the Likert-type scale at both the item and group levels. These results indicate that, in the context examined here, BWS is more suitable than the Likert-type scale for relative comparisons of destination image. The findings contribute methodologically to the measurement of destination image and provide practical implications for prioritizing efforts to sustain and enhance destination image.
Introduction
Destination image constitutes a core theme within destination marketing, and scholars have amassed an extensive body of literature on the topic since the early 1970s (Pike, 2002; Torres-Pruñonosa et al., 2024; Wang et al., 2023). As made clear by Crompton's classical definition—“the sum of beliefs, ideas, and impressions that a person has of a destination” (Crompton, 1979: 18)—destination image encapsulates tourists’ subjective evaluations of destinations. Destination image is widely regarded as a key driver of tourists’ visitation decisions and the enhancement of destination brand equity (Afshardoost and Eshaghi, 2020; Konecnik and Gartner, 2007). Consequently, it has attracted substantial scholarly attention and remains a critical consideration in destination marketing practice.
Scholars have advanced several classification systems to delineate destination image components (Nghiêm-Phú, 2014; Wang et al., 2023). Yet across these frameworks, the component that consistently receives primary emphasis is the set of attributes of the destination itself—commonly termed the cognitive image. Because the cognitive image reflects concrete attributes of a destination, destination marketing organizations (DMOs) seeking to enhance that image can readily pinpoint which attributes merit attention, thereby facilitating the design of targeted improvement strategies and delivering practical benefits (Arabadzhyan et al., 2021).
Methods for measuring cognitive image encompass questionnaire surveys, interviews, experiments, and analyses of text and photographs drawn from DMOs’ materials or user-generated content (Bui et al., 2022; Chu et al., 2022; Wang et al., 2023). Additionally, mixed-method designs have attracted growing scholarly interest in recent years (Lee and Park, 2023; Wang et al., 2023). Even so, questionnaires remain the most frequently employed approach (Chu et al., 2022). Common formats include Likert-type scales, semantic differential scales, and open-ended prompts (Chu et al., 2022). Among these, the Likert-type scale is the most widely used in academic research (Chu et al., 2022; Dolnicar and Grün, 2013). With a Likert-type scale, respondents express their agreement with a statement on an ordered set of categories—typically five- or seven-point options—thereby generating data that are readily quantifiable (Bhattacherjee, 2019; Veal, 2017). The resulting data are amenable to both statistical hypothesis testing and causal-model estimation via structural equation modeling.
However, aggregated scores from Likert-type scales are fundamentally ill suited to relative comparisons across items or groups. The use of such scores makes it difficult to identify which attribute items are evaluated more or less favorably and whether evaluations of these items differ across groups when measuring cognitive image, thereby hampering destination marketing efforts. This limitation is attributable to three characteristics of Likert-type scales (Cohen, 2009; Louviere et al., 2015). First, respondents’ response styles may induce concentration at the extremes of the scale or at the neutral midpoint (Louviere et al., 2015). Specifically, social desirability bias and acquiescence bias frequently skew respondents’ answers toward more favorable options (King and Bruner, 2000). This complicates interpretation of whether differences across cognitive image items or across groups in their evaluations reflect actual differences in evaluation or, instead, response styles. Second, the halo effect—characterized by excessive inter-attribute correlations—may lead to greater similarity among individual item evaluations (Cannon and Cipriani, 2022; Phelps et al., 1986). This effect not only obscures differences among cognitive image items but also makes it difficult to detect item-specific differences across groups. Third, Likert-type scales elicit evaluations of each item in isolation, which hinders the assessment of trade-offs among attributes (Cohen, 2009; Gajderowicz et al., 2023). This approach obscures trade-offs, making it difficult to identify the relative evaluations of cognitive image items and to compare these evaluations across groups.
Best–worst scaling (BWS) offers an alternative survey technique that addresses the limitation of Likert-type scales discussed above. In BWS, respondents are shown subsets of three or more items and asked to identify the most and least preferred options within each subset (Finn and Louviere, 1992; Louviere et al., 2015). Because respondents must select both the most and the least preferred items, this task clarifies trade-offs and makes evaluative differences among options explicit (Louviere et al., 2015). Thus, BWS facilitates relative comparisons across items or groups when measuring cognitive image.
Although several tourism studies have employed BWS (e.g., Aguiar-Quintana et al., 2022; An and Alarcón, 2021; Heo et al., 2022; Kim et al., 2019), few, if any, have applied BWS to the measurement of the cognitive component of destination image (Chu et al., 2022; Wang et al., 2023). This study therefore employs BWS to measure the destination image and compares its results with those generated by a conventional Likert-type scale, thereby assessing the effectiveness of BWS—specifically, its suitability for item- and group-level comparisons relative to Likert-type scales. The findings are expected to provide empirical evidence that BWS yields clearer contrasts and serves as a practical, effective survey method for DMOs.
Literature review
Cognitive image as a primary component of destination image
In the destination marketing literature, two principal taxonomies are widely recognized for classifying destination image components. The first taxonomy comprises three components—cognitive, affective, and conative (Gartner, 1994; Gil Arroyo et al., 2023; Liu et al., 2024). Cognitive image reflects tourists’ evaluations of specific destination attributes, including nature, cultural heritage, and accommodation facilities (Beerli and Martín, 2004; Gartner, 1994; Gil Arroyo et al., 2023; Liu et al., 2024). Affective image captures tourists’ emotional responses to a destination, such as feelings of excitement or pleasure (Baloglu and McCleary, 1999; Beerli and Martín, 2004; Gil Arroyo et al., 2023; Liu et al., 2024). Conative image pertains to action-oriented responses, typically manifested as intentions to visit the destination or recommend it to others (Agapito et al., 2013; Gartner, 1994; Gil Arroyo et al., 2023; Liu et al., 2024). These three components are interrelated; empirical evidence shows that the cognitive and affective images influence the conative image (Agapito et al., 2013; Woosnam et al., 2020). Conative image is frequently operationalized through constructs such as behavioral intention and intention to recommend (Chen and Tsai, 2007; Stylidis et al., 2017), which, as noted above, capture essentially the same underlying construct. In recent years, this taxonomy has gained broad acceptance as the most widely adopted framework for modeling destination image (Tasci and Moreno-Gil, 2024). A derivative of this taxonomy is the cognitive–affective–overall framework, which replaces the conative image with an overall image component that captures tourists’ holistic evaluation of the destination (Baloglu and McCleary, 1999; Beerli and Martín, 2004; Limonta et al., 2024).
The second taxonomy comprises three dimensions—attribute–holistic, functional–psychological, and common–unique (Echtner and Ritchie, 1991, 1993). Attribute denotes an individual characteristic of a tourist destination, whereas holistic captures the destination's overall impression (Echtner and Ritchie, 1993). Functional pertains to directly observable characteristics, whereas psychological encompasses more abstract and intangible aspects (Alcañiz et al., 2009; Echtner and Ritchie, 1993). Finally, common captures attributes shared by all tourist destinations, whereas unique encompasses features specific to a single destination (Echtner and Ritchie, 1993; Stepchenkova and Morrison, 2008). Building on this taxonomy, each measurement item can thus be positioned simultaneously on multiple dimensions. For instance, “cool climate” and “hospitality of service staff” are positioned as the attribute–functional component, whereas “rustic atmosphere” and “sophistication” correspond to the holistic–psychological component, respectively (Echtner and Ritchie, 1993; Velikova et al., 2024).
Since the 2010s, a two-component core–periphery framework has been advanced as an alternative taxonomy (Lai and Li, 2012; Su et al., 2020; Wang et al., 2018). Core constitutes a focal component that attracts primary attention and is readily recalled by tourists, whereas periphery constitutes a component situated at the core's margins and is readily forgotten (Lai and Li, 2012; Wang et al., 2018). Using Lai and Li’s (2012) study of Beijing, China, as an illustration, the core corresponds to historical sites and architecture, whereas the periphery encompasses nightlife, entertainment, and tourism information.
The coexistence of multiple taxonomies, as discussed above, underscores the persistent challenge that the structure of destination image lacks consensus. Nevertheless, all three taxonomies include a component that corresponds to the cognitive domain. In the first taxonomy, this component is labeled explicitly as “cognitive.” In the second taxonomy, the “attribute” element within the attribute–holistic dimension maps onto the cognitive image. The core–periphery taxonomy represents a further subdivision of that cognitive image. Taken together, prior research indicates that the cognitive image constitutes a primary component of destination image frameworks.
Building on these theoretical insights and the previously mentioned practical benefits—which DMOs can readily translate into targeted initiatives—this study focuses on measuring the cognitive image. Because cognitive image consists of a set of concrete destination attributes, it is particularly compatible with BWS, a method that clarifies trade-offs among multiple items and makes evaluative differences across options explicit. In this study, the primary interest lies in the relative comparison of destination-specific attributes across items and groups, rather than in assessing the overall level of a broader perception-based construct. These considerations also support the decision to focus the analysis on cognitive image.
Applications of BWS in tourism research
In tourism research, Likert-type scales have been widely used to measure destination image and other subjective tourist evaluations (Dolnicar and Grün, 2013; Veal, 2017). Against this backdrop, several studies have employed BWS, which is designed to enable clearer relative comparisons across multiple items or groups. Kim et al. (2019) applied BWS to examine the attributes that tourists consider important when choosing hotels across different categories. Cleanliness and bed quality were the two most important attributes in every category; however, service quality, room comfort, and décor were rated more highly in luxury hotels, whereas price and security were prioritized in economy hotels, indicating categorical differences. Similarly, An and Alarcón (2021) used BWS to identify salient attributes in rural tourism. Staff hospitality, outdoor activities, supplementary facilities, and location emerged as relatively important, although their salience varied according to respondents’ characteristics and prior rural-tourism experience. Moreover, BWS has been applied to identify the factors that tourists deem important when selecting wineries (Del Chiappa et al., 2022) and peer-to-peer accommodations (Heo et al., 2022). Extending these applications, Aguiar-Quintana et al. (2022) embedded BWS-derived importance scores within an importance–performance analysis framework to relate tourists’ perceived importance of surf-tourism attributes to their satisfaction with each attribute. Collectively, these studies suggest that assessing the perceived importance of tourism services and destination attributes has become a predominant approach in the tourism literature employing BWS.
Scholars have also examined aspects beyond attribute importance. Zhang et al. (2023) used BWS to examine elements of low-carbon tour promotion and found that travelers were most attracted to messages emphasizing product innovation. Tapsall et al. (2022) employed BWS to gauge concerns about cruise-travel risk factors that the COVID-19 pandemic brought to light. Health risks emerged as the top-ranked concern across respondents; however, the second-ranked concern varied between experienced and inexperienced cruise travelers.
However, very few studies have applied BWS to measure destination image. Consequently, comparative analyses between Likert-type scales and BWS remain scarce in this context. Addressing these gaps is essential to refining destination marketing theory by enabling more precise assessment of tourist behavior, while simultaneously advancing marketing practice through more precise measurement of destination image. Nevertheless, although BWS excels at identifying trade-offs, it also has characteristics that can result in complex survey designs and may increase respondent burden (Cohen and Lockshin, 2016; Louviere et al., 2015). Therefore, the central issue is whether BWS is suitable for verifying relative comparisons of cognitive images across items or groups.
Method
Selection of the BWS variant
BWS comprises three variants—cases 1, 2, and 3. Case 1, or the object case, presents respondents with a subset of discrete objects (e.g. product features, opinions, and policy statements) and asks them to select the most and least preferred object (Louviere et al., 2015). Case 2, the profile case, shows respondents a single profile in which multiple attributes appear at specified levels; they then identify the most and least preferred attribute level within that profile (Louviere et al., 2015). Case 3, the multiprofile case, displays three or more complete profiles and requires respondents to choose the most and least preferred profile (Louviere et al., 2015). Given how cognitive image has been assessed in prior research (Bui et al., 2022; Chu et al., 2022; Wang et al., 2023), typically by evaluating destination attributes without explicitly constructing profiles in which attribute levels are specified, case 1 BWS aligns with this established measurement approach. Therefore, this study used case 1 BWS.
Study design
This study measures destination image using both BWS and Likert-type scales, and then compares the resulting evaluations. To mitigate potential order effects—that is, the influence of question order on respondents’ assessments—half of the respondents completed the BWS first, whereas the other half completed the Likert-type scales first.
Implementing BWS requires constructing subsets of three or more items. This study employed the most common configuration, a balanced incomplete block design (BIBD) (Heo et al., 2022; Louviere et al., 2013). In a BIBD, each subset contains the same number of items. When configuring a BIBD, four parameters must be specified: the total number of subsets, the total number of items, the number of items per subset, and the replication frequency of each item. To minimize respondents’ cognitive load, the four BIBD parameters should not be set excessively high. As a guideline, the number of subsets should be at most 15, and the number of items presented in each subset should be at most 6 (Cohen and Lockshin, 2016). Yet accurate measurement of destination image requires an adequate number of items. Balancing these considerations, this study adopted a typical BIBD configuration (Louviere et al., 2015) consisting of 11 subsets, 11 items, five items per subset, and a replication frequency of five. Within each subset, respondents selected the item they perceived as the best and the one they perceived as the worst. The 11 cognitive image items listed in Table 1 were adapted from prior destination image research (e.g. Baloglu and McCleary, 1999; Beerli and Martín, 2004) and tailored to reflect the characteristics of the study area described below. For the Likert-type scale, each of the 11 items was rated on a seven-point scale (7 = very good, 1 = very poor).
Cognitive image items.
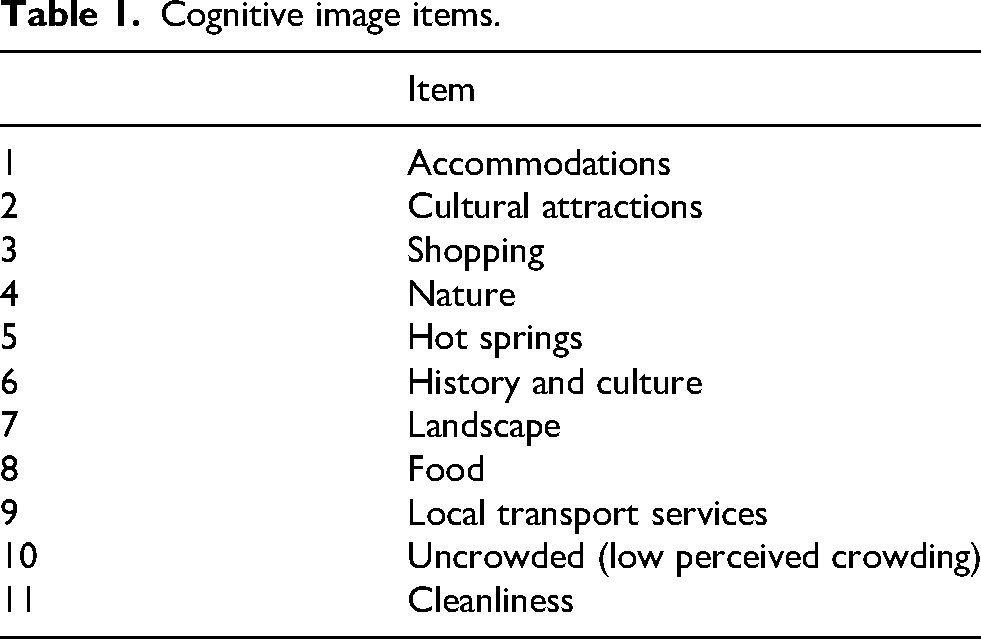
Building on this survey design, this study compares measurement outcomes derived from BWS and Likert-type scales across respondent groups. Specifically, it examines how destination image evaluations differ according to visit experience, a key attribute known to influence such perceptions (Beerli and Martín, 2004; Fakeye and Crompton, 1991; Ortanderl, 2025). Accordingly, this study employed a nonprobability sampling design that balanced the two cohorts by allocating an equal number of respondents to the visit-experienced and nonvisitor groups.
Data collection and sample
The data for this study were collected through a consumer panel managed by Freeasy, an online research service operated by iBRIDGE Corporation. Freeasy has been used in several peer-reviewed studies that conducted online surveys among residents of Japan and has been described as having a panel of 13 million people (Sugawara et al., 2024; Xie et al., 2024). The survey was administered in November 2024 and employed a nonprobability sampling design involving quota allocation to recruit equal numbers of respondents from the visit-experienced and nonvisitor groups. This design was adopted because the objective of the study was not to estimate population parameters, but rather to compare BWS and Likert-type scales as survey methods and to compare different respondent groups. In this regard, Baker et al. (2013) suggest that nonprobability online sampling may be useful for comparative studies or for examining relationships between variables when the objective is not to estimate population parameters.
This study focused on Hakodate City, located in northern Japan. Hakodate was chosen because it is widely recognized within Japan as a major tourist destination and offers a rich array of natural/heritage resources and tourist attractions. Accordingly, the sample comprised respondents who had previously visited Hakodate City for leisure purposes within the last 5 years (visit-experienced group) and those who had not visited Hakodate City but were aware of the city (nonvisitor group). The sample was deliberately limited to residents of the Tokyo metropolitan area, the primary source market for tourists to Hakodate.
Initially, based on the consumer panel's profile information on place of residence, residents of the Tokyo metropolitan area were identified, and a screening survey was then conducted with this subset. The screening survey consisted of two core questions and a follow-up question for respondents who reported prior visitation. The first asked, “Have you ever visited Hakodate City on a leisure trip involving at least one overnight stay?” and required a yes-or-no response. The second asked, “Are you aware of Hakodate City?” and offered three response options: “Aware,” “Have heard of the place name,” or “Not aware.” This second question was included because, even among nonvisitors, meaningful responses regarding cognitive image could not be expected unless respondents were aware of the destination. Respondents who answered “Yes” to the first question were then asked a third question: “Please select when you most recently took a vacation trip to Hakodate City involving at least one overnight stay.” They were presented with five response options: “Within the past year,” “Within the past 2 years,” “Within the past 3–5 years,” “Within the past 6–10 years,” and “More than 10 years ago.” Respondents who answered “Yes” to the first question and selected “Within the past year,” “Within the past 2 years,” or “Within the past 3–5 years” for the third question were classified as the visit-experienced group. Respondents who answered “No” to the first question but selected either “Aware” or “Have heard of the place name” for the second question were classified as the nonvisitor group. After responses to the screening survey were obtained from 10,000 residents of the Tokyo metropolitan area, 1176 individuals were classified into the visit-experienced group and 5110 into the nonvisitor group.
A main survey was then administered to both groups, and data were collected from 500 individuals in the visit-experienced group and 500 individuals in the nonvisitor group. As described later, this study uses a counting approach to compute BW and ABW scores. Because formal criteria for determining sample size for counting-based case 1 BWS scores have not yet been well-established (Louviere et al., 2015), this study determined the per-group sample size by referring to figures reported in a recent review article on BWS (Schuster et al., 2024). Schuster et al. (2024) reported mean sample sizes of 495.9 across all empirical studies analyzed and 533.0 for studies in the business field. Eligible respondents were enrolled on a first-come, first-served basis until the target sample size of 500 respondents in each group was reached.
To measure destination image using BWS and Likert-type scales, instructions were provided as shown in Figures 1 and 2. In addition, demographic questions were not included in this study because respondents had already registered this information with the consumer panel, and it was linked to their survey responses. After removing invalid cases in which the same item was chosen as both “best” and “worst,” the final sample comprised 420 visit-experienced and 436 nonvisitor respondents.
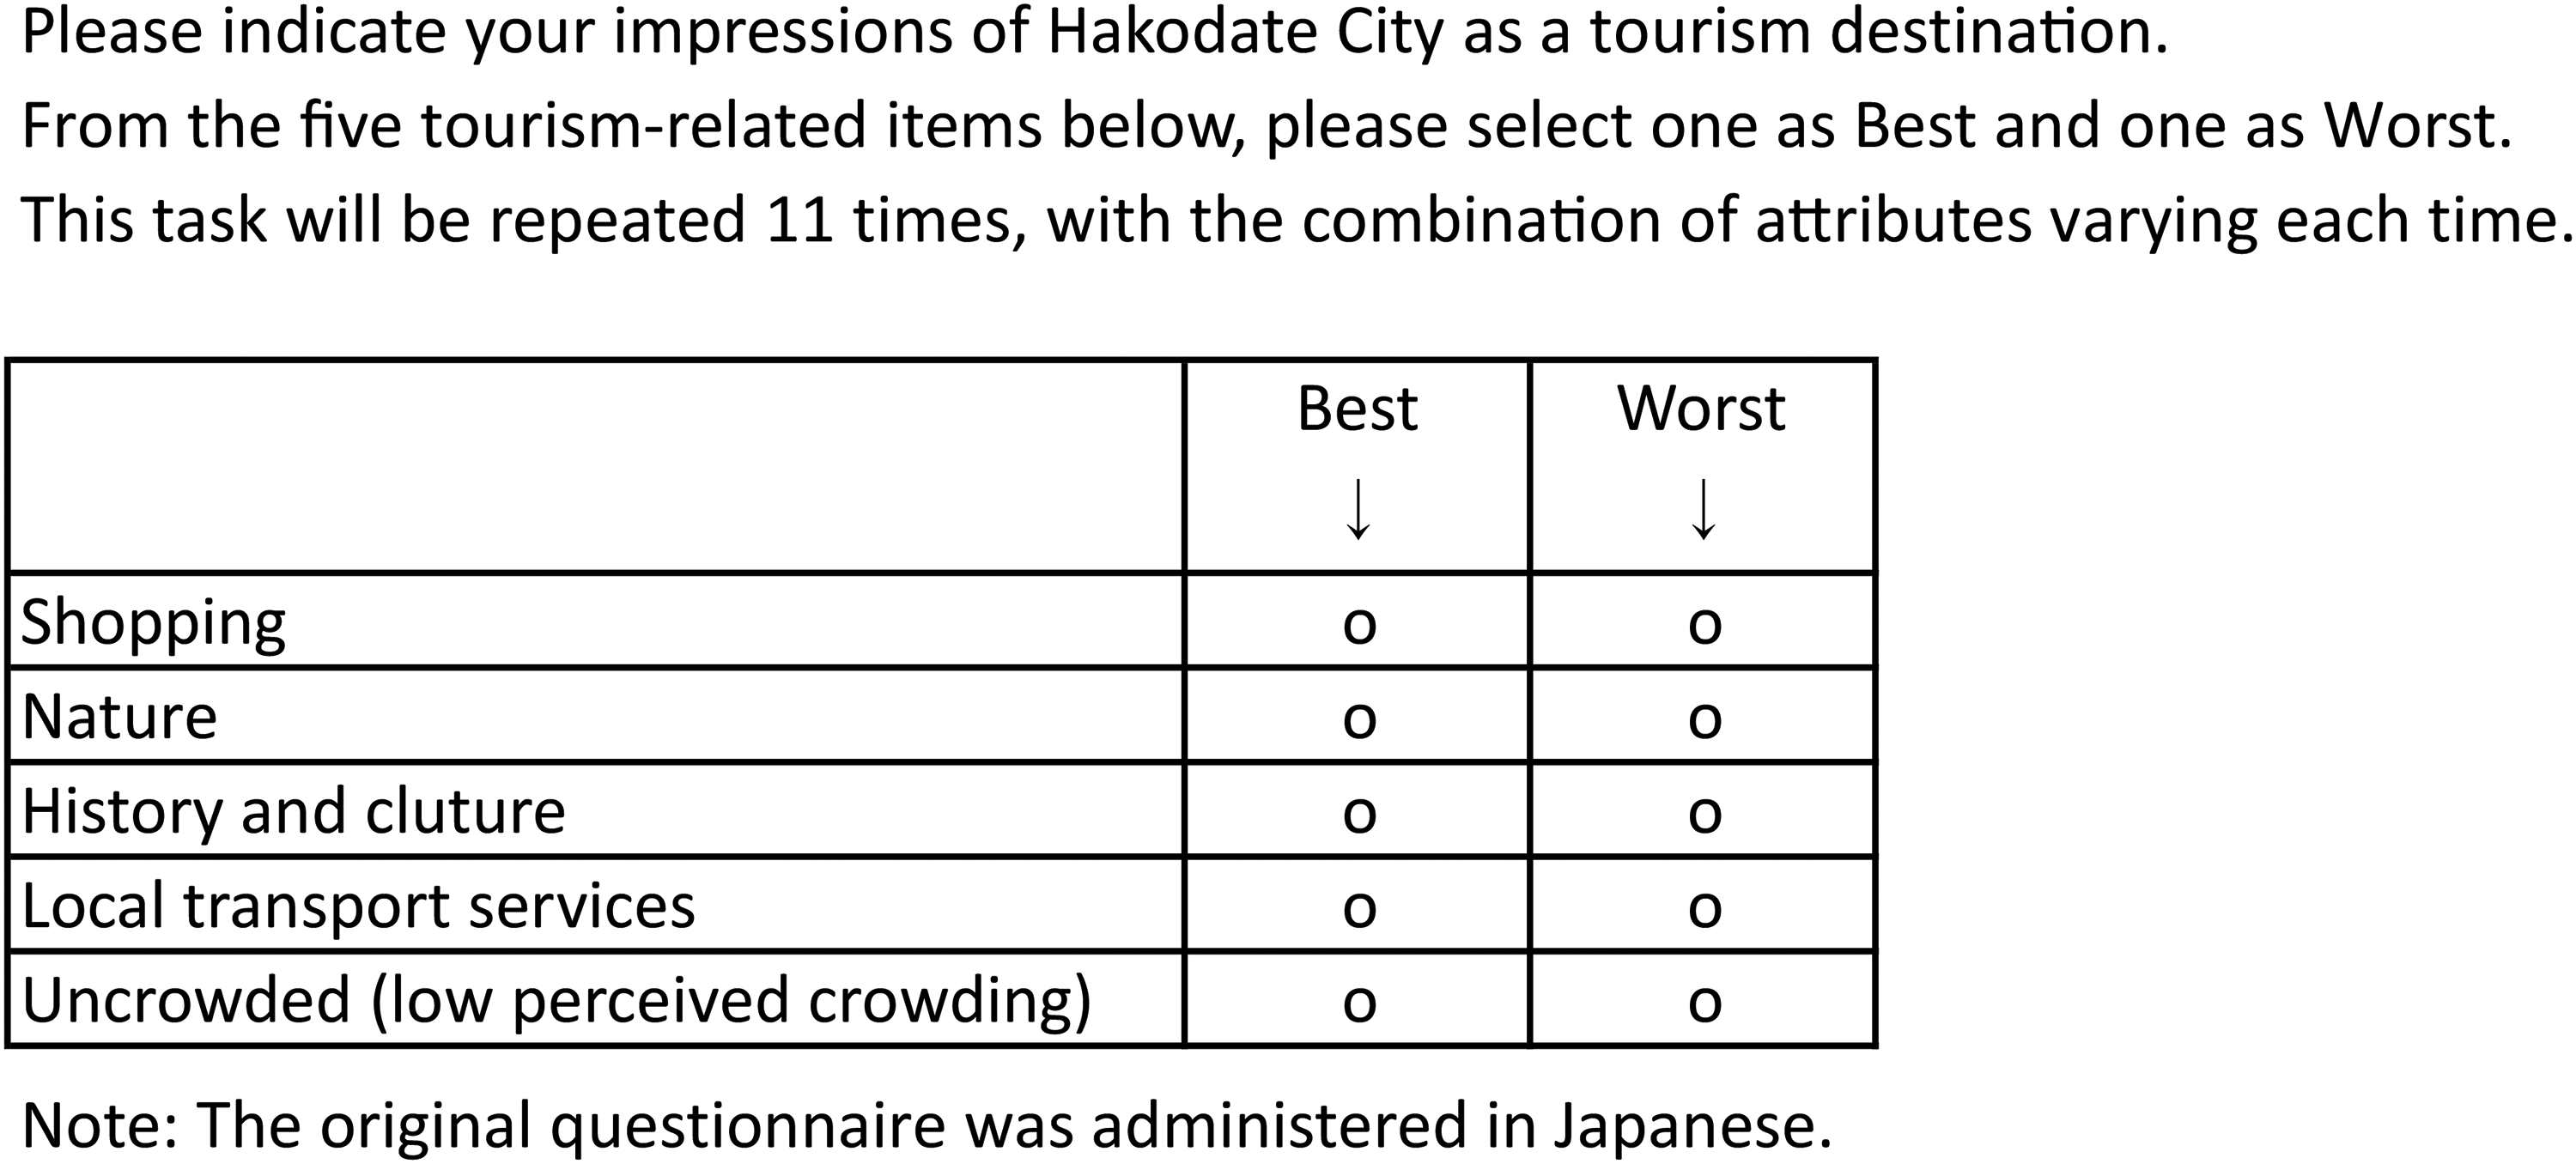
Example of a best–worst scaling question.
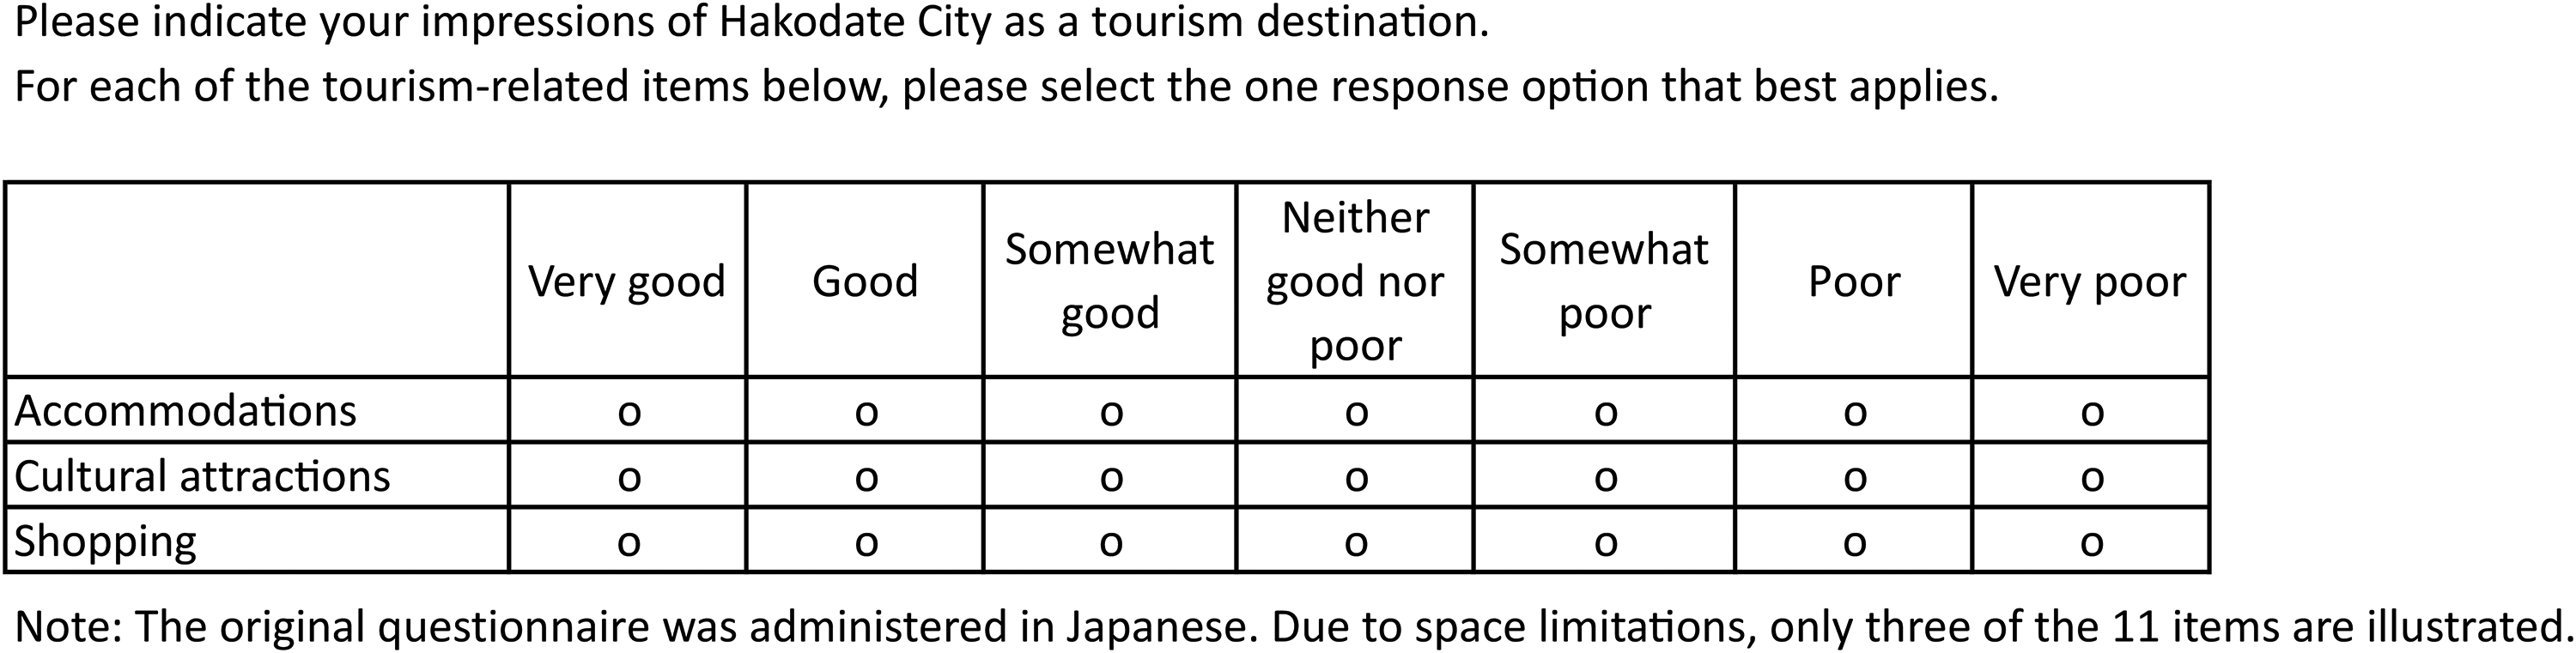
Example of a Likert-type scale question.
Data analysis
Analytical methods for BWS data are commonly classified into two broad categories: counting and modeling approaches (Aizaki and Fogarty, 2023; Louviere et al., 2015). The counting approach derives item scores from the aggregated frequencies with which each item is selected as “best” and as “worst.” Among the available metrics, the simplest is the BW score. It can be calculated at both the aggregated and respondent levels by subtracting an item's total “worst” selections from its total “best” selections (Aizaki and Fogarty, 2023; Kim et al., 2019). Another widely used metric, the average BW (ABW) score, can likewise be computed at both levels. The aggregated ABW score is calculated by dividing the raw BW score by both the total number of respondents and the item's replication frequency (Heo et al., 2022; Kim et al., 2019). At the respondent level, the ABW score is computed by dividing the raw BW score by the item's replication frequency. The ABW score ranges from −1 to 1, facilitating straightforward interpretation. The counting approach is straightforward to implement, requires minimal statistical expertise, and is therefore a practical choice for applied research.
The modeling approach builds on the discrete choice framework and estimates respondents’ best and worst selections using statistical techniques such as conditional and mixed logit models (Aizaki and Fogarty, 2023; Cheung et al., 2019). The modeling approach offers distinct advantages because it enables researchers to test the statistical significance of each item's selection probability through its estimated coefficient and to predict selection behavior. By contrast, the modeling approach presents several drawbacks. It requires specialized statistical expertise to conduct the analysis, and the resulting coefficients must be interpreted relative to a reference category, which hampers intuitive understanding.
In light of these considerations, this study prioritizes generating findings directly applicable to practice and accordingly adopts a counting approach to analyze the BWS data and compute the BW and ABW scores. Notably, empirical evidence indicates that item-level coefficients estimated through modeling techniques are highly correlated with BW scores (Louviere et al., 2013, 2015). Consequently, employing the counting approach is unlikely to impede accurate assessment of destination image. For the Likert-type scale, the raw scores ranging from 1 to 7 were entered into the analysis.
Results
Profile of sample
Table 2 reports descriptive statistics for the respondents. The gender distribution was slightly male-skewed (63.0% male). By age group, respondents aged 60 years and older constituted the largest share (33.4%). The mean respondent age was 52.9 years. For visit-experienced respondents, the modal number of visits was 1.
Descriptive statistics of respondents.
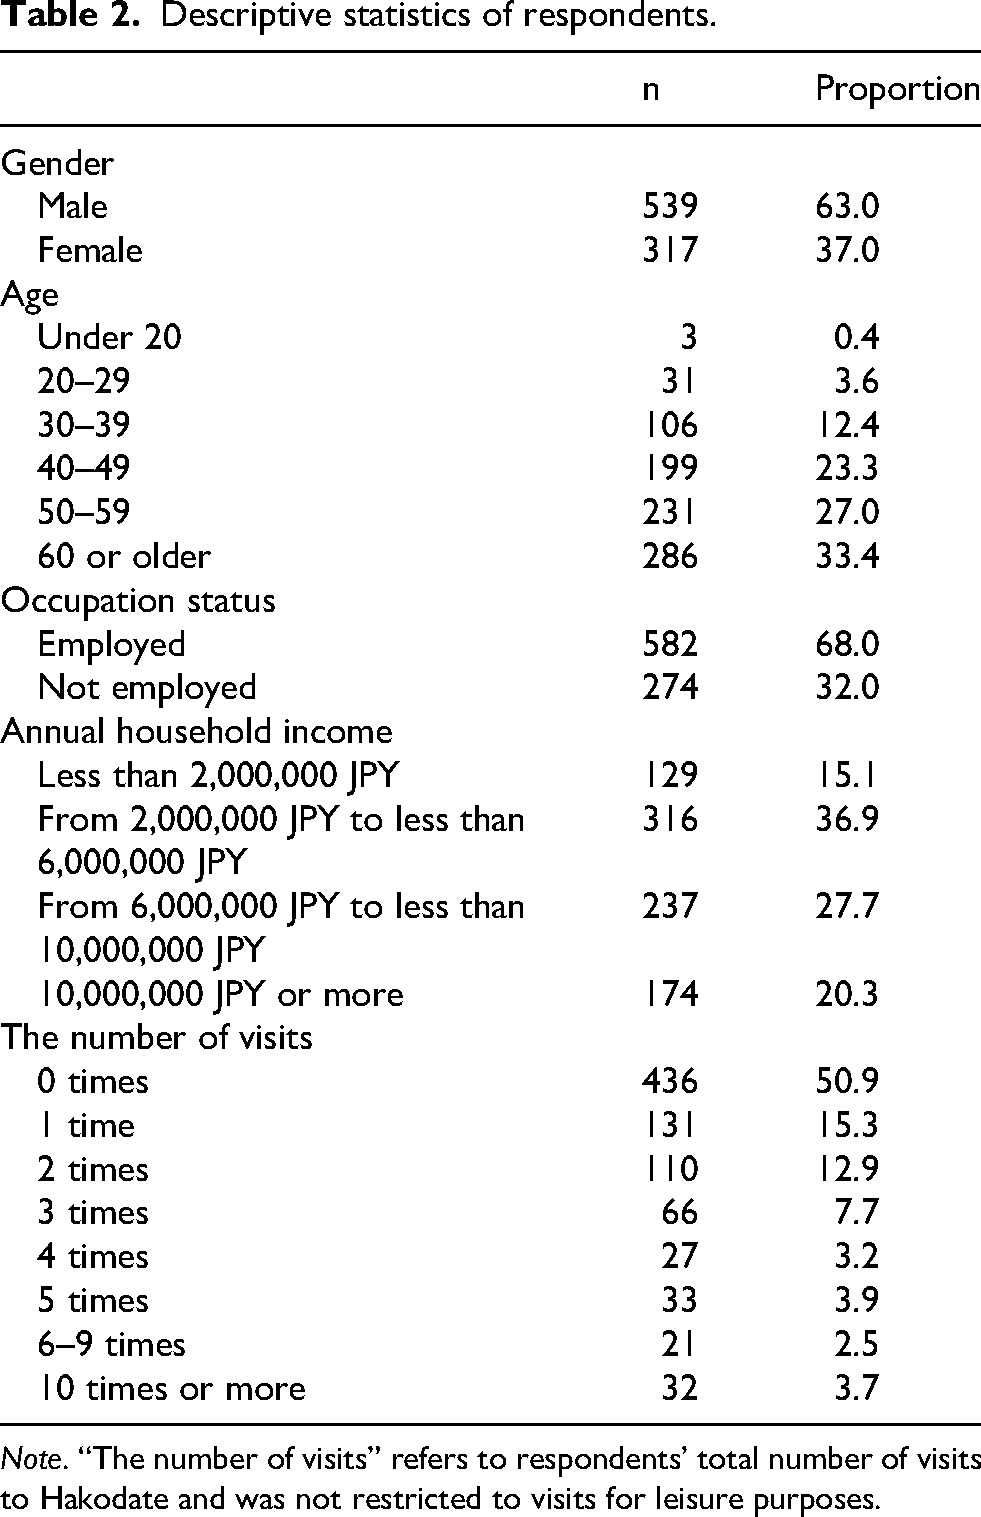
Note. “The number of visits” refers to respondents’ total number of visits to Hakodate and was not restricted to visits for leisure purposes.
To assess sample representativeness, demographic profiles of the visit-experienced and nonvisitor groups were compared with the closest available external benchmarks. The visit-experienced group was benchmarked against tourists from the region corresponding to the Tokyo metropolitan area, using Hakodate City's official tourism statistics (Hakodate City, 2025). In the study sample, 65.2% of respondents were male and 34.8% were female, whereas the statistics reported 34.4% male, 64.5% female, and 1.1% undeclared. By age, the study sample was concentrated among respondents aged 50 to 59 (23.3%) and 60 years or older (38.8%). Similarly, the official statistics showed high shares for respondents aged 50 to 59 (30.6%) and 60 years or older (26.3%). The nonvisitor group was benchmarked against official population estimates for the Tokyo metropolitan area (Statistics Bureau, Ministry of Internal Affairs and Communications, 2025). In the study sample, 60.8% of respondents were male and 39.2% were female, whereas the population estimates indicated 49.4% male and 50.6% female. By age, the study sample was concentrated among respondents aged 50 to 59 (30.5%) and 60 years or older (28.2%). The population estimates also showed high shares for respondents aged 50 to 59 (17.5%) and 60 years or older (35.1%). These results suggest that both the visit-experienced and nonvisitor groups had higher proportions of male respondents than their respective benchmarks, while older age cohorts were prominent in both the study samples and the corresponding benchmarks. However, because the external benchmarks were approximate proxies, the assessment of sample representativeness and the generalizability of the findings concerning the cognitive image of Hakodate City should be interpreted with caution.
Scores from BWS and Likert-type scales
The BWS data were analyzed in R using the support.BWS package (Aizaki and Fogarty, 2023). Table 3 reports descriptive statistics for the BWS data. A positive ABW score indicates that best selections outnumbered worst selections, reflecting a relatively positive evaluation. Conversely, a negative ABW score indicates that worst selections outnumbered best selections, reflecting a relatively negative evaluation. In this study, seven of the 11 items exhibited positive ABW scores. The highest score was for “landscape” (0.394), followed by “food” (0.369). The two lowest scores were “local transport services” (−0.521) and “uncrowded (low perceived crowding)” (−0.452).
Descriptive statistics for BWS data.
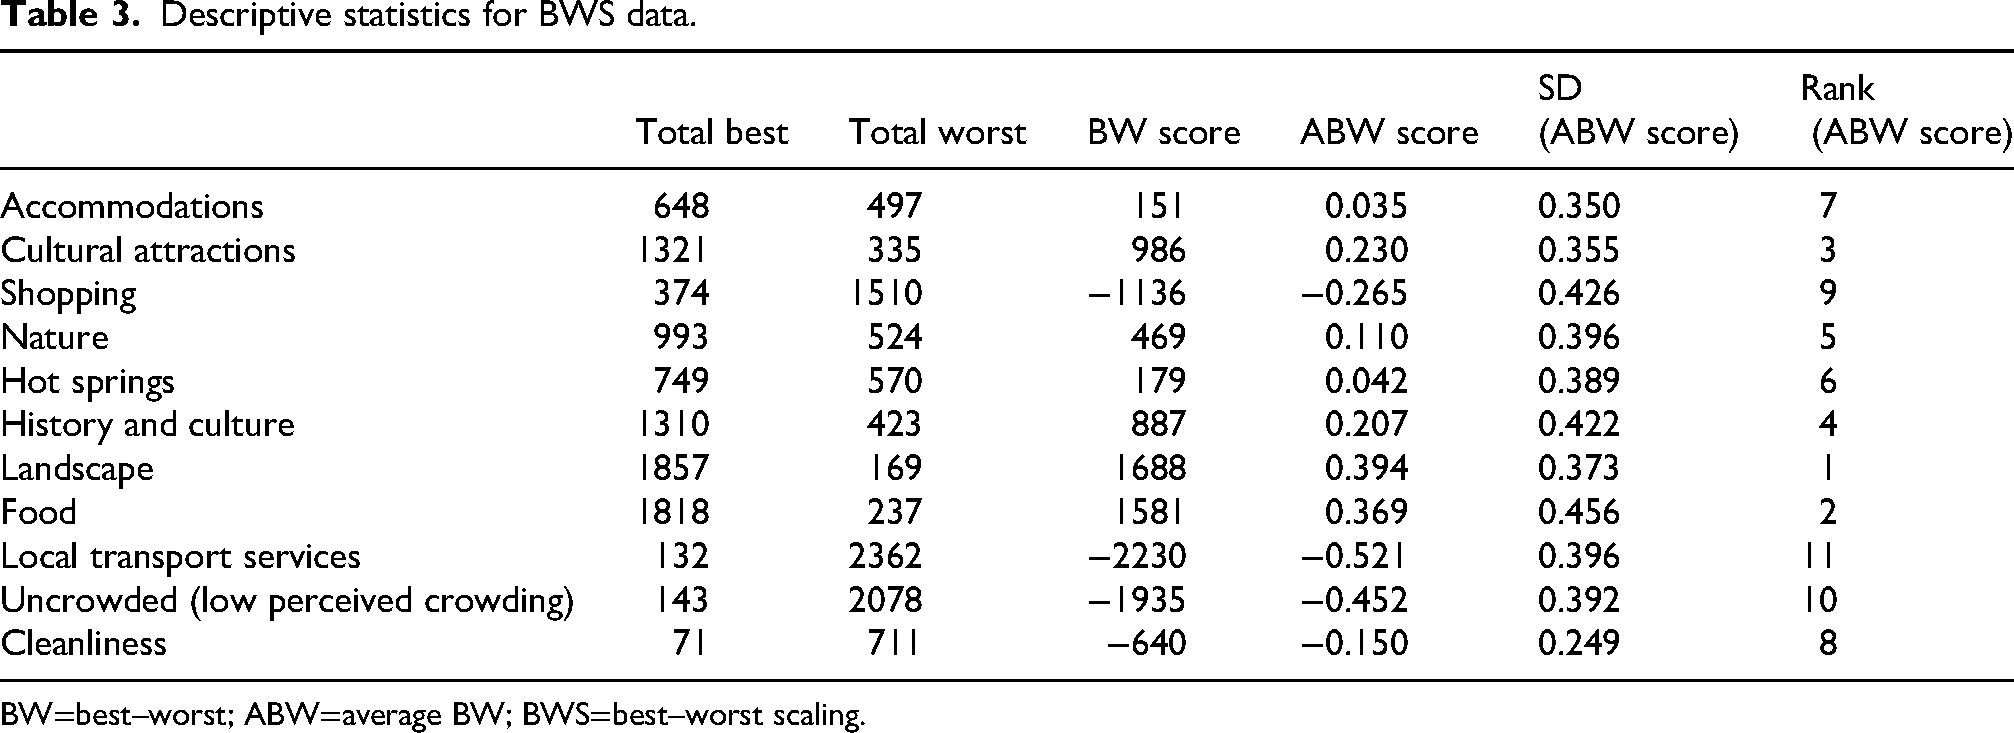
BW=best–worst; ABW=average BW; BWS=best–worst scaling.
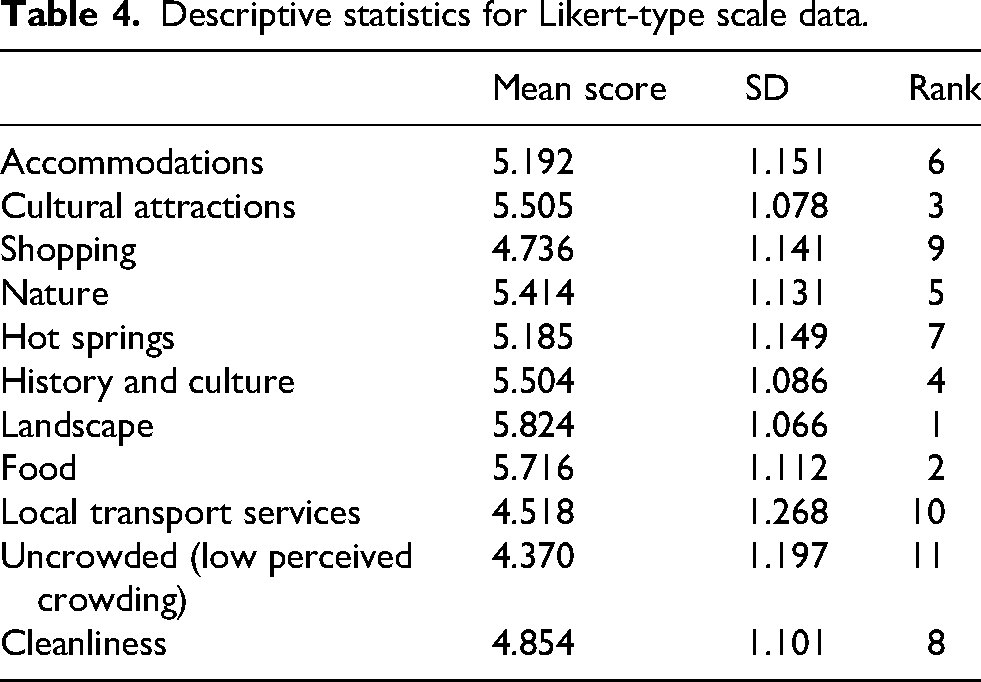
On the seven-point Likert-type scale used in this study, a mean score greater than 4 indicates a tendency toward positive evaluation. As reported in Table 4 and consistent with the ABW scores, the highest-rated item was “landscape” (5.824), followed by “food” (5.716). The two lowest-rated items were “uncrowded (low perceived crowding)” (4.370) and “local transport services” (4.518). These items were also the lowest-rated based on the ABW scores, although their relative ranks differed. When item-level rankings derived from ABW scores were compared with those from Likert-type scale means, seven of the 11 items had identical ranks.
Descriptive statistics for Likert-type scale data.
Item-level analysis
To assess the suitability of BWS for item-level comparisons, we compared inter-item correlation coefficients for scores derived from BWS and from Likert-type scales, following prior studies (Lee et al., 2007; Soutar et al., 2015). This study focuses on comparing the relative magnitudes of the estimates across cognitive image items, rather than their absolute values. Inter-item correlation coefficients are reported as a descriptive indicator of trade-offs among items and the resulting item-level differentiation. In Likert-type scales, uniformly positive ratings may increase positive inter-item correlations, potentially obscuring relative differences among items. In contrast, BWS may yield lower positive correlations or even negative correlations between items, potentially making trade-offs more apparent.
As shown in Table 5, pairwise correlations among ABW scores ranged from −0.295 to 0.247. Of the 55 pairwise correlations, 45 were negative (81.8%). By contrast, as shown in Table 6, pairwise correlations among Likert-type scale items ranged from 0.204 to 0.639, and all were positive.
Correlation matrix of ABW scores.
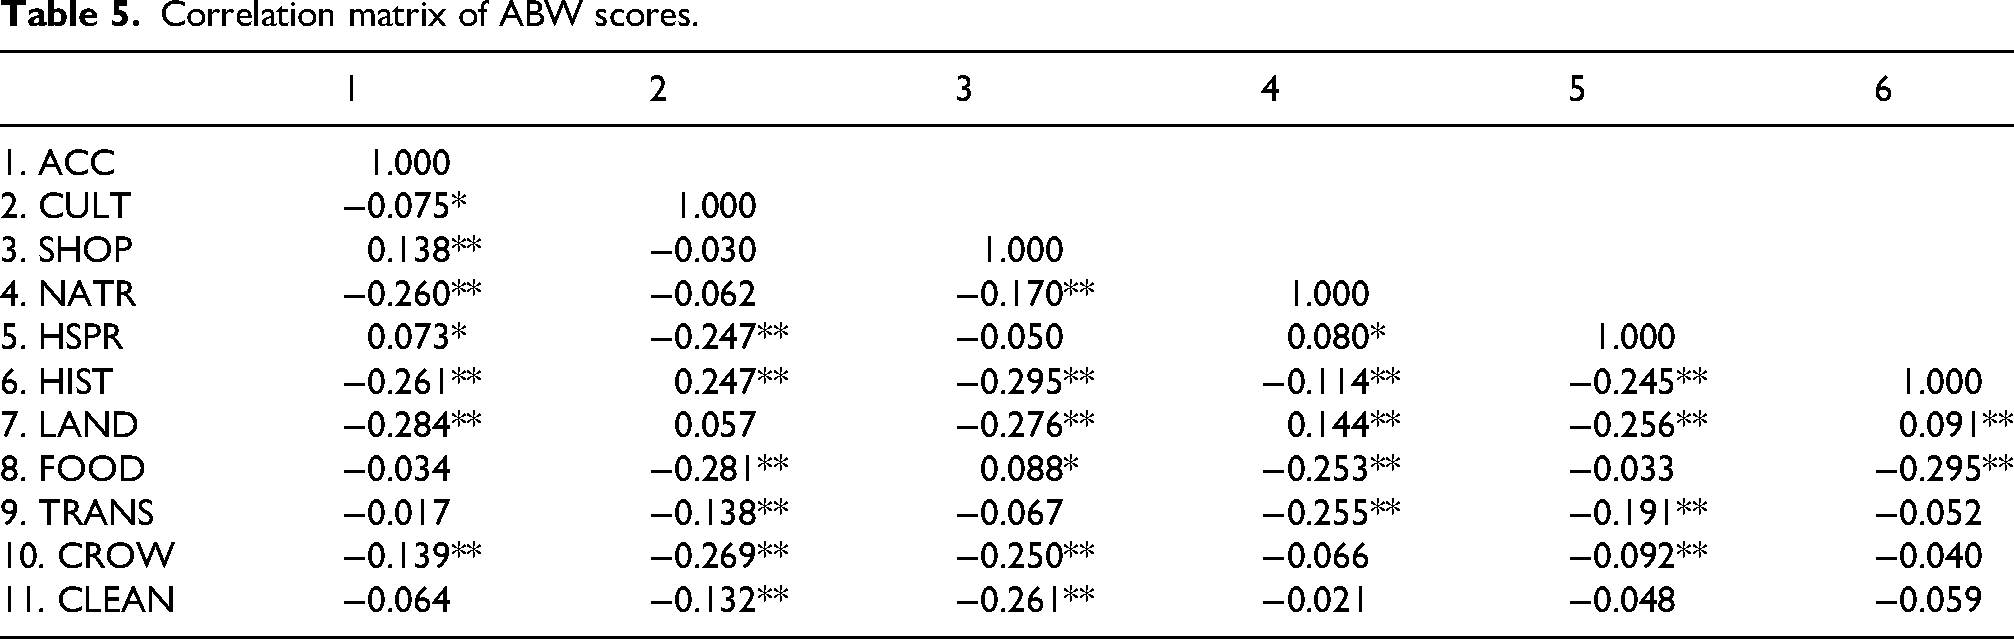
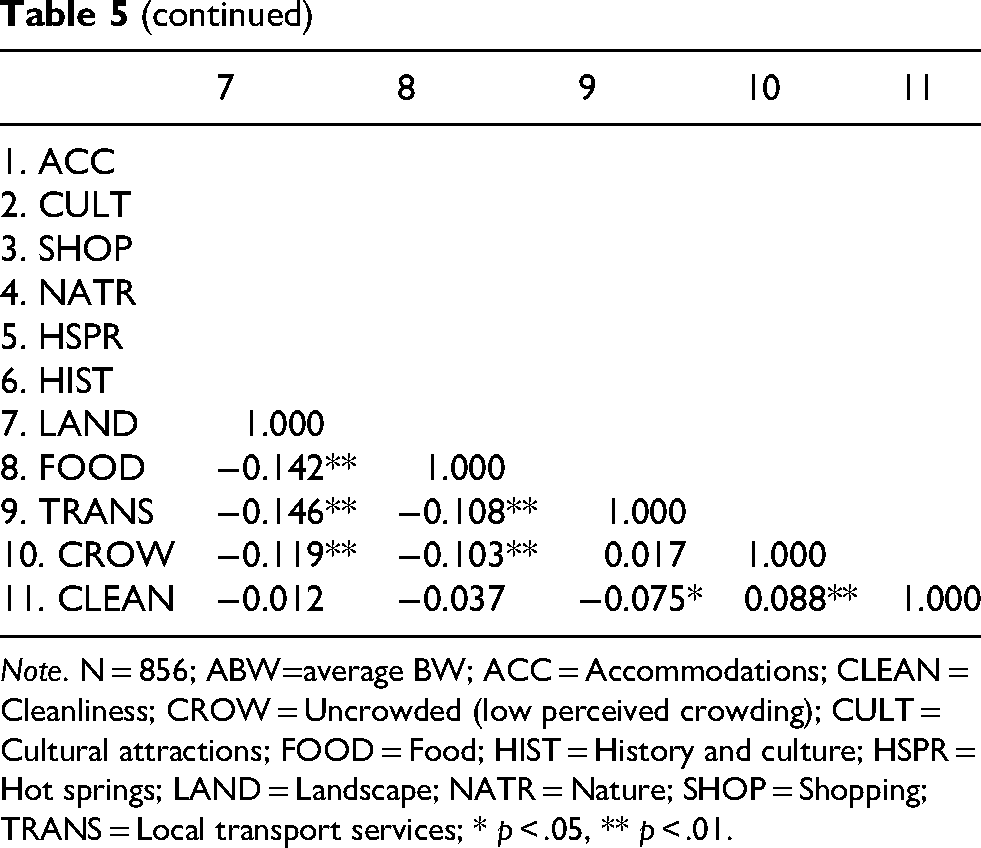
Note. N = 856; ABW=average BW; ACC = Accommodations; CLEAN = Cleanliness; CROW = Uncrowded (low perceived crowding); CULT = Cultural attractions; FOOD = Food; HIST = History and culture; HSPR = Hot springs; LAND = Landscape; NATR = Nature; SHOP = Shopping; TRANS = Local transport services; * p < .05, ** p < .01.
Correlation matrix of Likert-type scale scores.
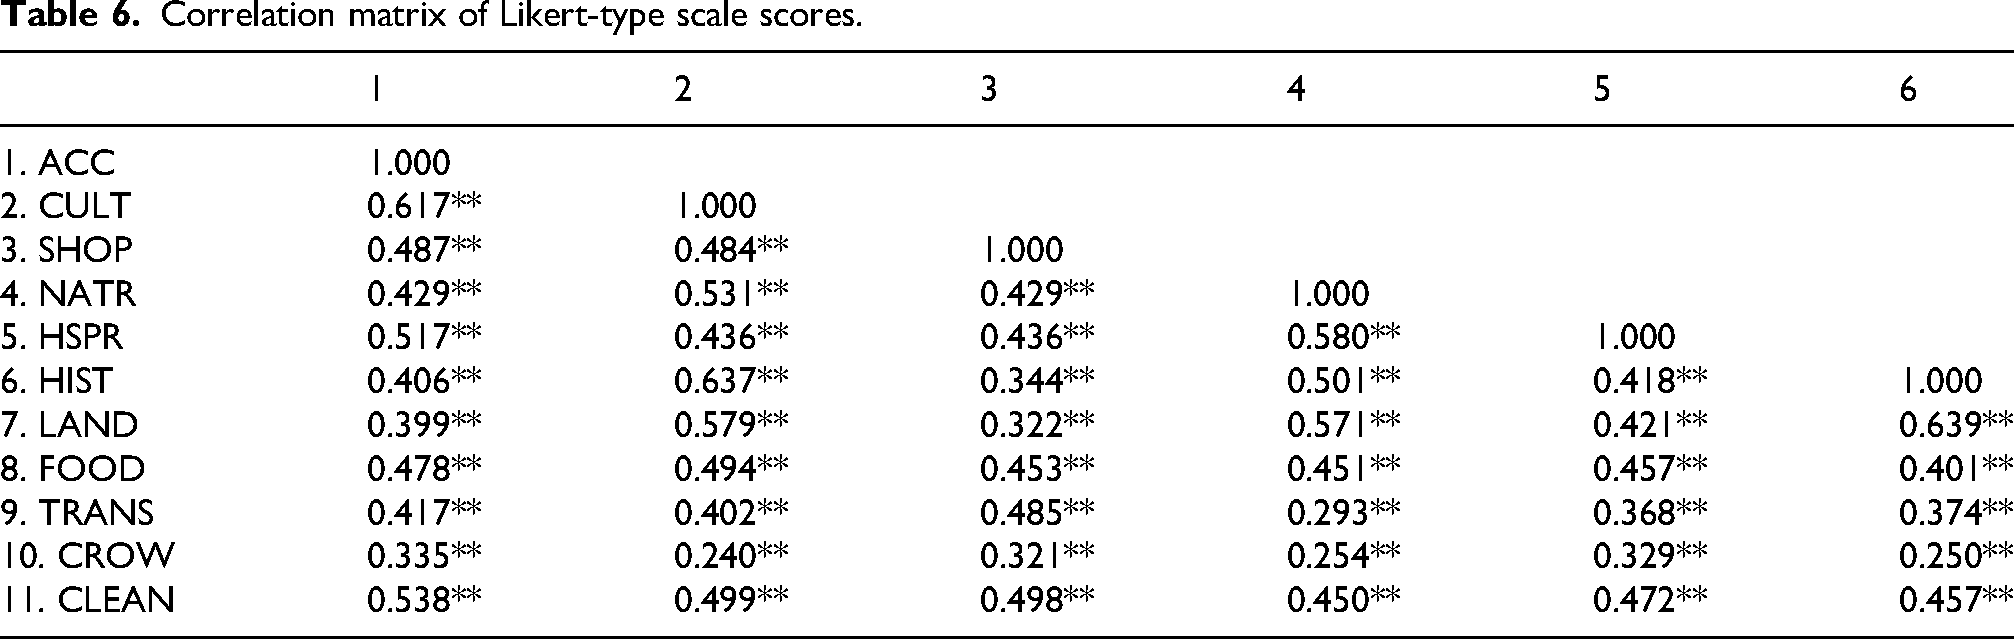
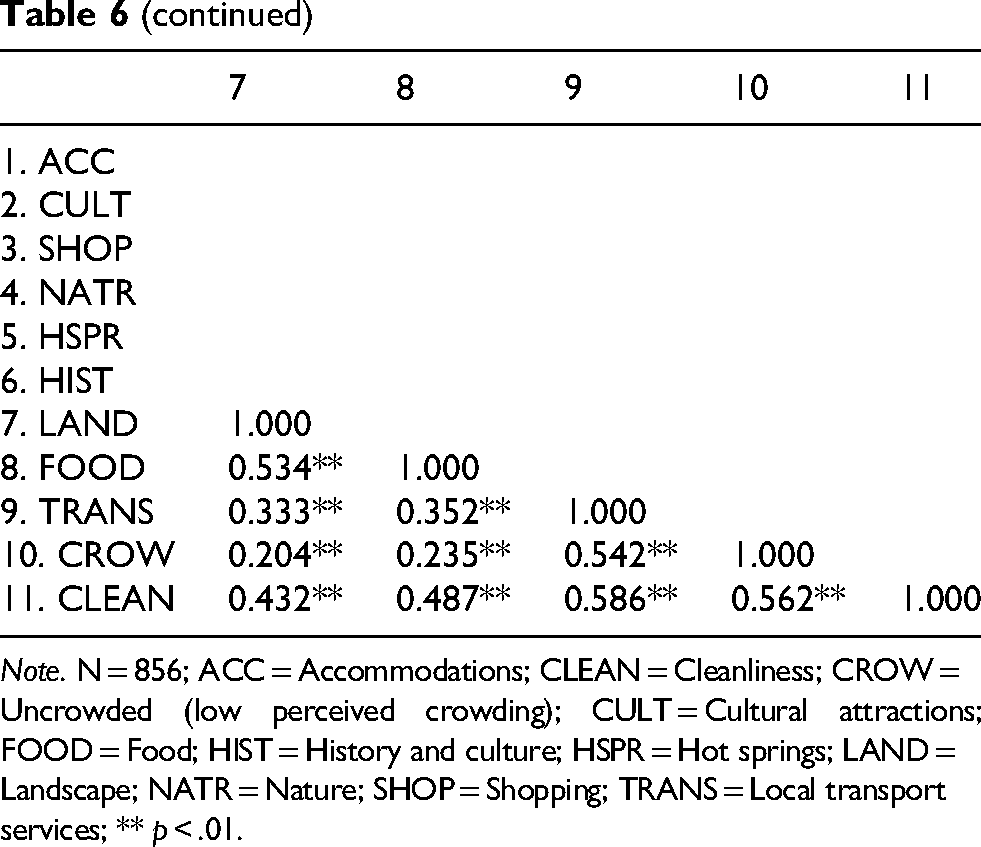
Note. N = 856; ACC = Accommodations; CLEAN = Cleanliness; CROW = Uncrowded (low perceived crowding); CULT = Cultural attractions; FOOD = Food; HIST = History and culture; HSPR = Hot springs; LAND = Landscape; NATR = Nature; SHOP = Shopping; TRANS = Local transport services; ** p < .01.
As an additional analysis, we compared the across-item ranges and standard deviations (SDs) of the scores reported in Tables 3 and 4 to gauge item differentiation from the dispersion of the estimates, rather than comparing absolute item values across survey methods. To the best of our knowledge, this analytical approach has been used infrequently in prior research. For the BWS data, the observed range (max − min) was 0.915 (max = 0.394; min = −0.521), and the across-item SD was 0.312. For the Likert-type scale data, scores were rescaled to −1 to +1 to align with the ABW score metric; the range was 0.484 (max = 0.608; min = 0.123), and the across-item SD was 0.162.
Group-level analysis
To assess the suitability of BWS for group-level comparisons, we conducted t-tests comparing the visit-experienced and nonvisitor groups on scores derived from BWS and from Likert-type scales. As shown in Table 7, the ABW score analysis revealed statistically significant between-group differences at the 5% level for six of the 11 items. The visit-experienced group scored significantly higher on “accommodations,” “local transport services,” and “uncrowded (low perceived crowding),” whereas the nonvisitor group scored significantly higher on “cultural attractions,” “nature,” and “landscape.” Table 8 shows that the analysis of the Likert-type scale scores revealed statistically significant between-group differences at the 1% level for all 11 items, with the visit-experienced group scoring higher on each item.
Comparison of ABW scores between visit-experienced and nonvisitor groups.
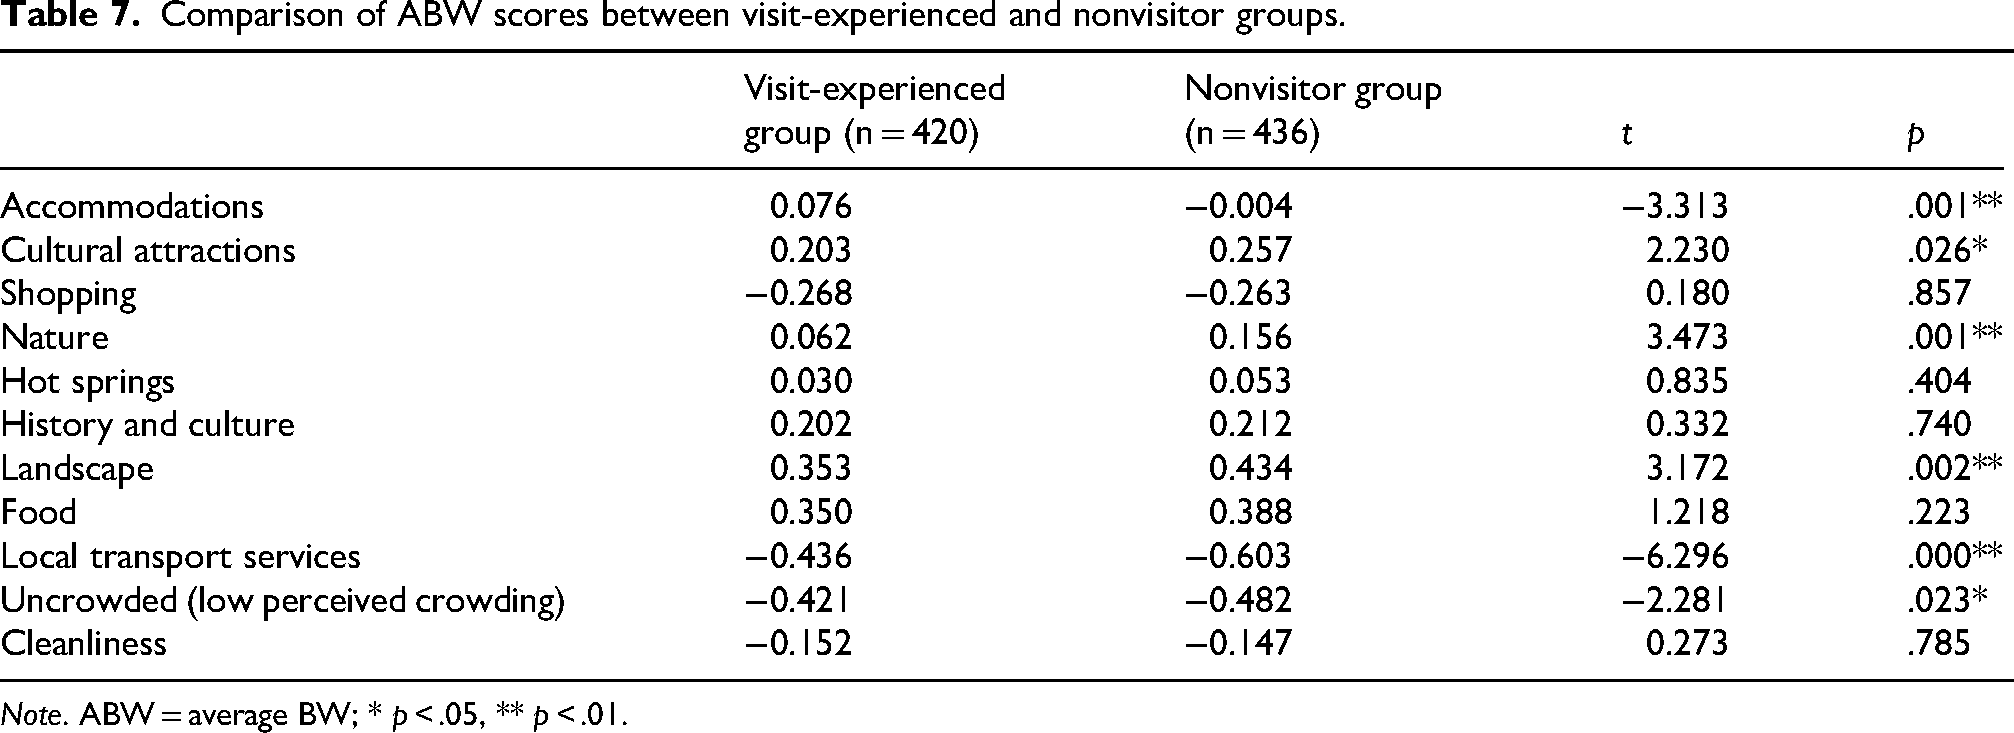
Note. ABW = average BW; * p < .05, ** p < .01.
Comparison of Likert-type scale scores between visit-experienced and nonvisitor groups.
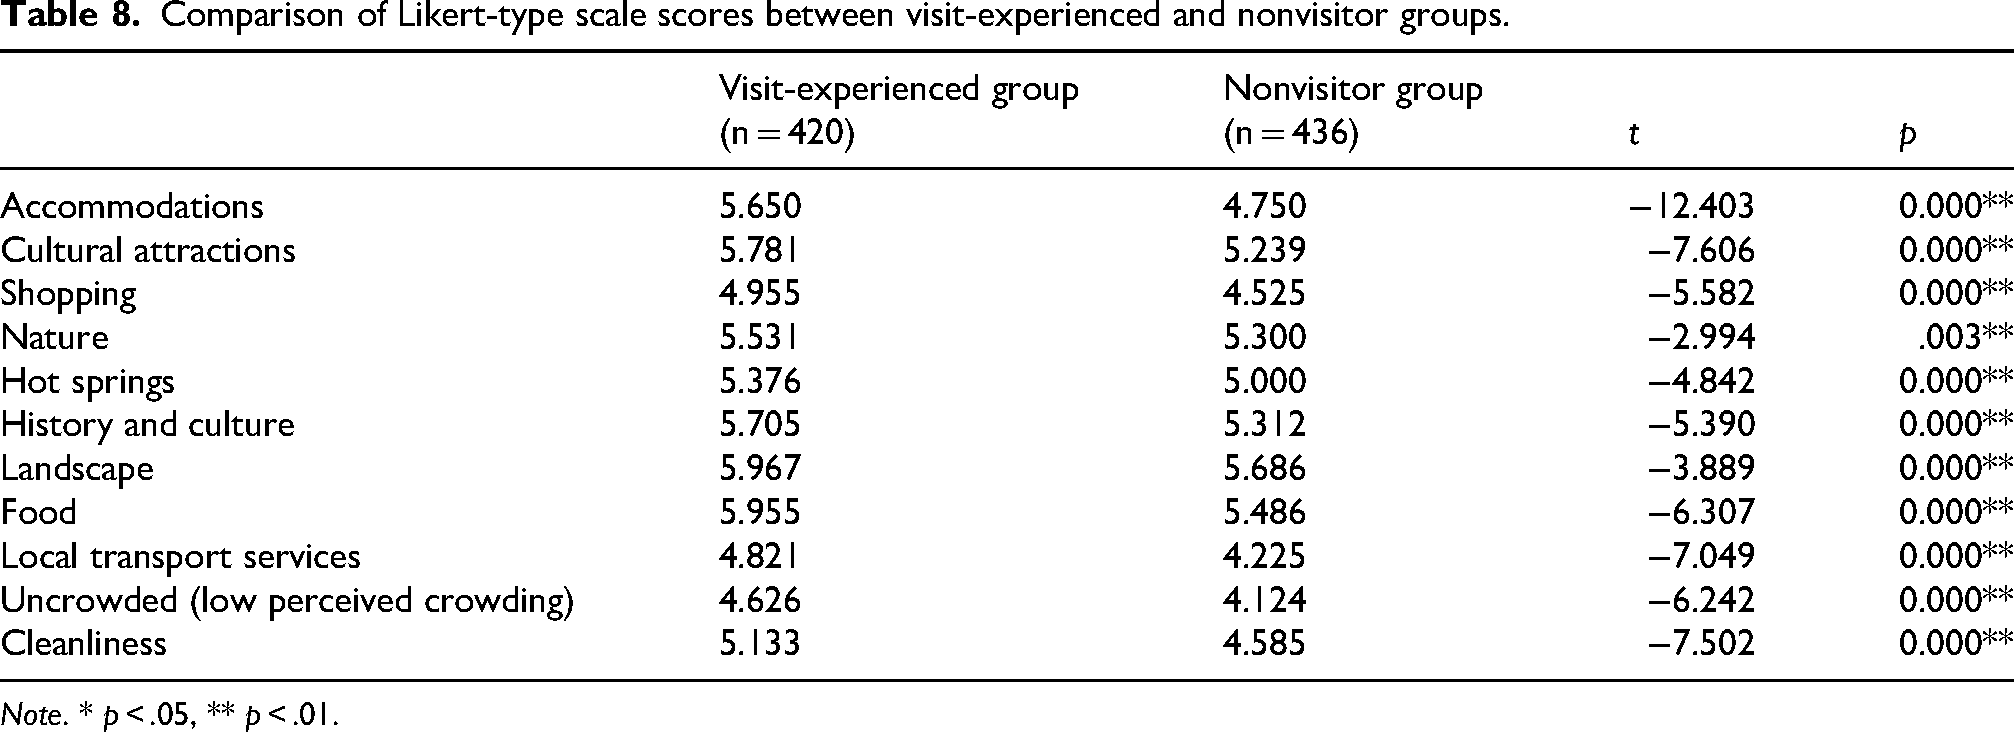
Note. * p < .05, ** p < .01.
Discussion and implications
Discussion
This study assessed the suitability of BWS for measuring destination image by comparing survey results obtained with two methods—case 1 BWS and a Likert-type scale—focusing on relative comparisons across items or groups. The findings of this study are consistent with recent tourism research showing that BWS is well-suited to identifying trade-offs among items (Heo et al., 2022; Tapsall et al., 2022). Furthermore, this study can be positioned as an illustration of the diversification and refinement of measurement methods that have increasingly come to the fore in recent destination image research (Wang et al., 2023). The following paragraphs discuss the interpretation of this study's main findings.
First, in the Likert-type scale data, all item means exceeded 4 (see Table 4), indicating positive evaluations across items. This pattern may reflect respondents’ positive evaluation of Hakodate City, respondents’ response style, or both.
Second, regarding item rankings, both the BWS and Likert-type scale methods yielded broadly similar results (see Tables 3 and 4). Nevertheless, differences in data quality should be noted. As mentioned earlier, in BWS, cases in which the same item is selected as both “best” and “worst” are logically impossible and can be excluded as invalid data. Specifically, 144 respondents (80 visit-experienced group; 64 nonvisitor group) were excluded in this study, which likely reflects careless responding. In contrast, although Likert-type scale data may include potentially problematic response patterns, such as straightlining (selecting the same option for all items) or extreme responding (preferring the most extreme options), these responses may still reflect respondents’ genuine answers and therefore cannot be dismissed as invalid data based on these characteristics alone (Leiner, 2019). Compared with BWS, it is more challenging to identify invalid data in Likert-type scale responses based on response style or clearly implausible patterns.
Third, in item-level analyses, BWS yielded more negative inter-item correlations than the Likert-type scale (see Tables 5 and 6). The predominance of negative inter-item correlations in the BWS data suggests that respondents made trade-offs among items, resulting in greater item differentiation. In contrast, the Likert-type scale data showed uniformly positive inter-item correlations, which is consistent with more interrelated evaluations across items. In addition, BWS yielded wider score ranges and larger standard deviations than the Likert-type scale. Both the range and the standard deviation were larger for the BWS data, indicating greater item differentiation under BWS. Taken together, these results indicate that BWS discriminates among items more effectively than the Likert-type scale and is suitable for relative, item-level comparisons.
Fourth, in group-level analysis of the BWS data (see Table 7), a comparison of average item scores between the visit-experienced and nonvisitor groups suggests that the services provided at destinations—specifically, “accommodations” and “local transport services”—and perceptions of low crowding are evaluated more positively by those with prior visit experience. In particular, because both groups recorded negative scores on “local transport services” and “uncrowded (low perceived crowding),” these negative evaluations may become less negative (i.e. improve) with visit experience. “Cultural attractions,” “nature,” and “landscape”—on which the nonvisitor group scored significantly higher—can be interpreted as resources with which destinations are endowed, as defined by Dwyer (2026). Across the full sample, these items received relatively high evaluations (see Table 4); however, the results suggest that actual visit experience may slightly lower their evaluations.
Compared with the BWS analysis, the Likert-type scale data yielded statistically significant differences for more items (see Table 8). At first glance, this appears to contradict the assumption that BWS is more suitable for relative comparisons of item-level evaluations between groups. However, in both practice and research in tourism destination marketing, it is essential to clearly identify which specific items differ in their evaluations between groups. From this standpoint, suitability is defined as the ability to clearly identify item-level differences between groups; on this definition, the findings are not in conflict.
The comparison of Likert-type scale scores between the visitor and nonvisitor groups may have yielded results consistent with prior research indicating that visit experience enhances destination image (Baloglu and McCleary, 1999; Fakeye and Crompton, 1991; Ortanderl, 2025). However, as shown in Table 8, scores for both groups were positive (all means exceeded 4), and the differences were modest (0.23–0.60), except for “Accommodations,” which showed a difference of nearly one point (0.90). Moreover, Table 6 shows that inter-item correlations for the Likert-type scale items were uniformly positive, suggesting that evaluations across items tended to be interrelated. Overall, even if statistically significant differences exist between groups on individual items, Likert-type scale responses may make it difficult to identify which items show salient between-group differences.
In contrast, BWS is characterized by a zero-sum property: across items, the sum of best-minus-worst (B–W) counts equals zero (Loose and Lockshin, 2013). Accordingly, when some items exhibit statistically significant increases or decreases in ABW scores, the nature of BWS implies that other items receive fewer such selections, which can reduce the likelihood of detecting additional significant differences. This mechanism helps explain why BWS tends to reveal more salient between-group differences. Based on these results, this study concludes that, in the context examined here, BWS is more suitable than the Likert-type scale for relative between-group comparisons of item evaluations.
Theoretical implications
This study contributes to both the destination image literature, particularly research on cognitive image measurement, and the literature on the application of BWS in tourism. Regarding the former, among the various approaches to measuring destination image—including nonsurvey approaches (Bui et al., 2022; Chu et al., 2022; Wang et al., 2023)—this study makes a methodological contribution by introducing BWS as a novel survey method for measuring the cognitive component of destination image and by demonstrating its effectiveness in relative comparisons across items and groups (see Tables 5–8). Specifically, the comparison between Tables 5 and 6 shows that BWS clarifies item-level trade-offs and provides greater differentiation among cognitive image items. The comparison between Tables 7 and 8 further shows that BWS more clearly identifies which cognitive image items differ between groups in terms of relative evaluations, whereas the Likert-type scale indicates significant differences for all items in the same direction. The findings of this study provide empirical support for prior research (Cohen, 2009; Heo et al., 2022; Louviere et al., 2015; Yang and Yagi, 2024) indicating that Likert-type scales may obscure discrimination among items, even in the context of destination image measurement. Theoretically, these results extend prior evidence of this tendency (Cohen, 2009; Heo et al., 2022; Louviere et al., 2015; Yang and Yagi, 2024) to the context of destination image measurement.
This ability of BWS to delineate relative differences across items and between groups is valuable when examining how influential factors shape destination image. As noted in prior research, destination image varies with factors such as prior visit experience, motivations, and sociodemographic characteristics (Baloglu and McCleary, 1999; Beerli and Martín, 2004; Fakeye and Crompton, 1991; Ortanderl, 2025; Wang et al., 2023). Among these factors, this study focuses on prior visit experience. The BWS results suggest that such experience may improve relative evaluations of destination-provided services while lowering those of endowed resources (see Table 7). Although the generalizability of this tendency warrants re-examination across different contexts, the findings may reveal a new pattern in how visit experience influences destination image. By extending prior research examining the role of visit experience in destination image formation (Beerli and Martín, 2004; Fakeye and Crompton, 1991; Ortanderl, 2025), these insights may contribute theoretically to destination marketing and tourist behavior research in ways that go beyond methodological advances alone.
In the literature on the application of BWS in tourism, this study contributes to methodological clarity in a more detailed comparison between BWS and the Likert-type scale. Unlike prior tourism research (Heo et al., 2022) that did not test between-group differences in BWS data, this study conducted independent-samples t tests to formally assess group-level differences (see Tables 7 and 8). By examining the methodological characteristics that explain why BWS yielded fewer statistically significant items than the Likert-type scale, this study suggests that BWS is more suitable for group-level comparisons in cognitive image measurement because it more clearly identifies which item evaluations differ between groups. This examination makes a theoretical contribution to applied BWS research by interpreting the findings in light of the zero-sum property of BWS (Loose and Lockshin, 2013), a perspective not explicitly adopted by Heo et al. (2022) when interpreting BWS results reported separately across respondent groups.
Managerial implications
The findings of this study have managerial implications for DMOs. Specifically, BWS is recommended for relative comparisons across items or between groups within a destination's image. By clearly identifying which destination attributes are relatively more or less valued, DMOs can prioritize initiatives to sustain and enhance a destination's image. For example, in Hakodate City, which is used here as an illustration, “landscape” and “food” received relatively high evaluations. Accordingly, the DMO can prioritize efforts to maintain service quality, manage landscape resources, and refine marketing communications for these attributes. In practical terms, the DMO's efforts to maintain food-related service quality could include facilitating customer service training sessions for local restaurant staff. For landscape resource management, key efforts could include coordinating with stakeholders to manage tourist use and promoting the establishment of guidelines for signage and building exteriors that do not detract from the landscape. To refine marketing communications, the DMO could disseminate content highlighting visitor experiences that combine local food with the surrounding landscape, such as enjoying fresh seafood while taking in the night views.
Conversely, “local transport services” and “uncrowded (low perceived crowding)” received relatively low evaluations. Therefore, the DMO can focus on developing and implementing efforts to improve the perceived performance for these attributes. For local transport services, the DMO's efforts could include developing and publicizing model routes that enable tourists to travel comfortably, as well as providing clear access information, such as route maps and timetables, through the DMO's official website and social media accounts. To promote low perceived crowding, the DMO could use its official website and social media accounts to provide information on peak periods, crowded locations within the destination, and lesser-known attractions that may encourage visitors to avoid heavily visited sites.
Furthermore, segment-specific approaches can be tailored to the visit-experienced group, for example, by focusing on improving attributes such as “nature” and “landscape,” which received significantly lower evaluations in this group than in the nonvisitor group. More specifically, the DMO could use its official website and social media accounts to highlight the distinctive appeal of nature and landscapes in seasons different from those of tourists’ previous visits, as well as to introduce tourists with prior visit experience to new nature-based experiences. This, in turn, facilitates the efficient allocation of managerial resources by DMOs.
However, when implementing BWS, it is important not to include too many survey items. As the number of survey items increases, the number of subsets increases, and the number of items within each subset may also increase, which may raise respondents’ cognitive load. Given these considerations, the total number of survey items should be determined with reference to typical BIBD configurations. Additionally, when examining relationships between destination image and other variables—such as satisfaction or visit intention—a Likert-type scale is preferable to BWS. Even in such cases, using BWS to select items that are relatively highly or lowly evaluated remains useful when determining the destination image measurement items. For example, one practical approach would be to use BWS first to identify a small number of high-priority attributes, such as those rated relatively high or low, among the many attributes of a tourist destination. Likert-type scales could then be used in a subsequent survey to examine the relationships between those attributes and satisfaction or visit intention.
Limitations and future research
Although this study offers theoretical and managerial insights, it has limitations that should be acknowledged. First, the analysis is confined to a single context—domestic tourism in Japan. To assess the generalizability of the findings, replication in other contexts is warranted. For instance, given that BWS is more suitable for cross-cultural comparisons than Likert-type scales (Aizaki and Takeshita, 2023; Cohen, 2009), future research could recruit respondents from multiple cultural contexts within international tourism to further assess generalizability. Furthermore, the suitability of BWS for relative comparisons across items or groups in destination image measurement may vary depending on the characteristics of the target population and the nature of the destination; therefore, these factors should also be examined.
Second, this study is limited to an assessment based on cross-sectional survey data. Given that destination image changes dynamically over time (Gallarza et al., 2002; Tasci and Moreno-Gil, 2024), longitudinal studies using BWS to track temporal change are important for developing a more detailed understanding of the temporal dynamics of destination image.
Third, this study did not examine whether respondent characteristics moderate the comparative results between BWS and Likert-type scales. The literature suggests that response styles on Likert-type scales vary by respondent characteristics such as age, education level, and cultural background (Billiet and Davidov, 2008; Bonjeer and Vonkova, 2024; Harzing, 2006). Therefore, examining the moderating effects of respondent characteristics in future research is important for refining the findings reported in this study.
Conclusion
An analysis of domestic tourists’ cognitive image of Hakodate City, Japan, suggests that BWS can identify both item- and group-level differences more clearly. These results suggest that, in the context examined here, BWS is a more effective survey method than the Likert-type scale for relative comparisons of a destination's cognitive image.
Footnotes
Acknowledgements
During the preparation of this work, the author used ChatGPT to improve the language, writing quality, and readability of the manuscript. After using this tool/service, the author reviewed and edited the content as needed and takes full responsibility for the content of the published article.

Author contribution(s)
Ethical consideration
This study was approved by the Research Ethics Committee of Takasaki City University of Economics on 30 October 2024.
Funding
The authors disclosed receipt of the following financial support for the research, authorship, and/or publication of this article: This work was supported by JSPS KAKENHI Grant Number JP24K21012.
Declaration of conflicting interests
The author declared no potential conflicts of interest with respect to the research, authorship, and/or publication of this article.
Data availability statement
The datasets generated during and/or analyzed during the current study are available from the corresponding author on reasonable request.