
Abstract
Introduction
There is an ever-increasing demand for social care in the UK, with expenditure predicted to double to £56 billion by 2038/39. Many councils are under budget restrictions putting pressure on the number of services provided and their quality. Telecare complements social care and involves the implementation of technology to keep individuals more independent.
Methods
This study utilised a retrospective time-series analysis of data provided by Lancashire County Council between the period January-2013 to March-2018. A generalised linear mixed model (GLMM) was used to control for potential confounders. Two groups were identified: those using telecare (telecare group, n = 699) and those who did not (control group, n = 839).
Results
The fixed effects data showed that telecare group start £75 per week lower in cost and as time progressed this reduced further by 9p per service user per week. In contrast, control group costs rose 5p per week per user. This effect was independent of age but was affected by measure of dependency. Analysis was then utilised to make predictions based on weighted averages. The scenario showed a total difference of £4,949 per service user over the whole year. A second scenario pro-rata’d costs for the full year showed a difference of £6,214, where telecare would avoid costs of £17 million per year.
Discussion
This analysis demonstrates that there is evident potential for the use of telecare to reduce social care resource use and costs. This study also highlights the use of a GLMM as a novel method of analysing observed data by controlling confounders.
Introduction
In the UK, social care can be defined as the provision of social work, personal care, protection or support services to those in need or at risk. Social care can be provided by both public and private institutions. In 2018/19, the total number of adult social care users in England was estimated to be 980,000. 1 This is predicted to increase to 1,470,000 by 2038/39. The Health Foundation has estimated that the expenditure under the current system would have to double from £28 billion to £56 billion (2018 prices) in the same time period, to address the predicted increase in demand. In addition, 627,000 new social care staff (a 55% increase from 2018/19) would have to be employed by 2030/31. 2 These factors, inter alia, combine to highlight a social care system under severe pressure and at risk of crisis.
In the UK, local authorities hold the primary responsibility for balancing the rise in social care needs against a backdrop of reduced funding. The Covid-19 pandemic exacerbated the situation as English local councils experienced an estimated £9.7 billion of additional cost pressures in 2020/21. 3
An expanding digital health field that complements standard social care services is the use of telecare. Telecare involves the use of personal alarms and security systems to help individuals remain more independent, 4 allowing councils to become more efficient with their distribution of social care services. Due to technological advances, the costs of these systems have reduced over time. There is currently very little evidence assessing the impact of telecare on the use of social care services for the elderly. A cluster randomised trial from 2013 suggested that there are small relative benefits to psychological and health-related quality of life responses in the elderly. 5
In the context of increasing demand for social care in the UK, this study describes a statistical method used to assess the impact of a telecare deployment in a county council area, with the aim of reducing the use of social care resources through cost-avoidance.
Methods
The study involved a retrospective time-series analysis of social care resource data provided by Lancashire County Council (LCC), covering the period between January 2013 and the end of March 2018, using a generalised linear mixed model (GLMM) to control for potential confounders in the data.
The data were cleaned and anomalous data points were clarified with LCC. Due to the wide variety of social care options and package permutations available, care was grouped into fifteen different categories in consultation with LCC. Care items deemed to be unaffected by telecare were removed from the analysis, such as packages of short-term care following a crisis, one-off costs associated with setting up direct payments, equipment and adaptations, reablement, self-funders using LCC services, and ‘top up’ payments made by LCC but then recovered from the service user.
Two groups of service users were identified: those using telecare (telecare group) and those who did not have telecare (control group). Assignment of telecare was based upon whether service users were new to social care, or had undergone a recent care needs review. They were not randomised by LCC. Telecare service users who had telecare for 6 months or less were excluded from the analysis on the assumption that a shorter period would not give the telecare enough time to demonstrate any effect. This generated a telecare group of 2,786 service users who were then stratified by age group and dependency (known as the Global Need Band) and matched to service users in the control group using similar criteria.
LCC went through a large social care policy change and the social care provided to users was reviewed from April 2016 onwards. Therefore, only data between the period May 2016 and March 2017 was selected. March 2017 was used as the cut-off date as it allowed new service users to have at least one year of care data. This reduced the sample size of the telecare (n = 699) and control (n = 839) groups. Other anomalies in the data, including service users whose care was transferred to another provider, were controlled for. All costs within the analysis were inflated to 2017 prices to ensure parity across users.
The sample size was limited by the number of available telecare service users. A retrospective power calculation was performed to ensure the final sample size was large enough to detect statistically significant results. A report by London Councils cited analysis of a telecare intervention in North Yorkshire that estimated that telecare resulted in an average annual saving of £3,600 per person, 6 or £70 per week. No standard deviation was reported, so a conservative 2.5 times the mean value (£175) was used as the standard deviation within the power calculation. With an alpha value of 0.05 and power value of 0.80, a sample size of 98 in each group was estimated to be required to provide sufficient power to find statistical significance for the expected effect size. The sample sizes of 839 in the control group and 699 in the telecare group were, therefore, suitable for the primary objective of the study and allowed for expected attrition in participant numbers during the analysis period.
The effect of telecare on the weekly cost of social care per service user was assessed using a zero-inflated GLMM. GLMMs can be used to evaluate the effect of a combination of multiple independent variables simultaneously. This is especially useful when the data have more than one source of random variability, for example when measuring an outcome multiple occasions for the same individual. It allows for the relationship between each independent variable and the dependent variable to be assessed while statistically controlling for the other independent variables (i.e., control for imbalances between groups which may impact the treatment effect).
The GLMM was also designed to be a hurdle model to account for the high number of zero related costs. A hurdle model is a two-step process. The statistical model predicts the probability of having a zero cost in addition to a cost on the condition of the data point not having a zero cost. The following formula is then used to estimate the cost:

All analyses were performed in the statistical analysis software R v. 3.5.1. (R Core Team 2018). 7 The zero-inflated GLMM was performed using the R package “glmmTMB”. Normalised model residuals were extracted using the R package DHARMa.
Results
Following the refinement of the data set to account for the 2016 change in social care policy by LCC, imbalances were introduced between the control and intervention groups. All variables were significantly different between the two groups, with the exception of the different age bands (Table 1). The regression model chosen accounted for the imbalances between the two groups. A decision was made to maximise the volume of data and to account for imbalances through statistical methods rather than undertaking further refinement and reduction of the data set.
Statistical matching of the control and telecare group.
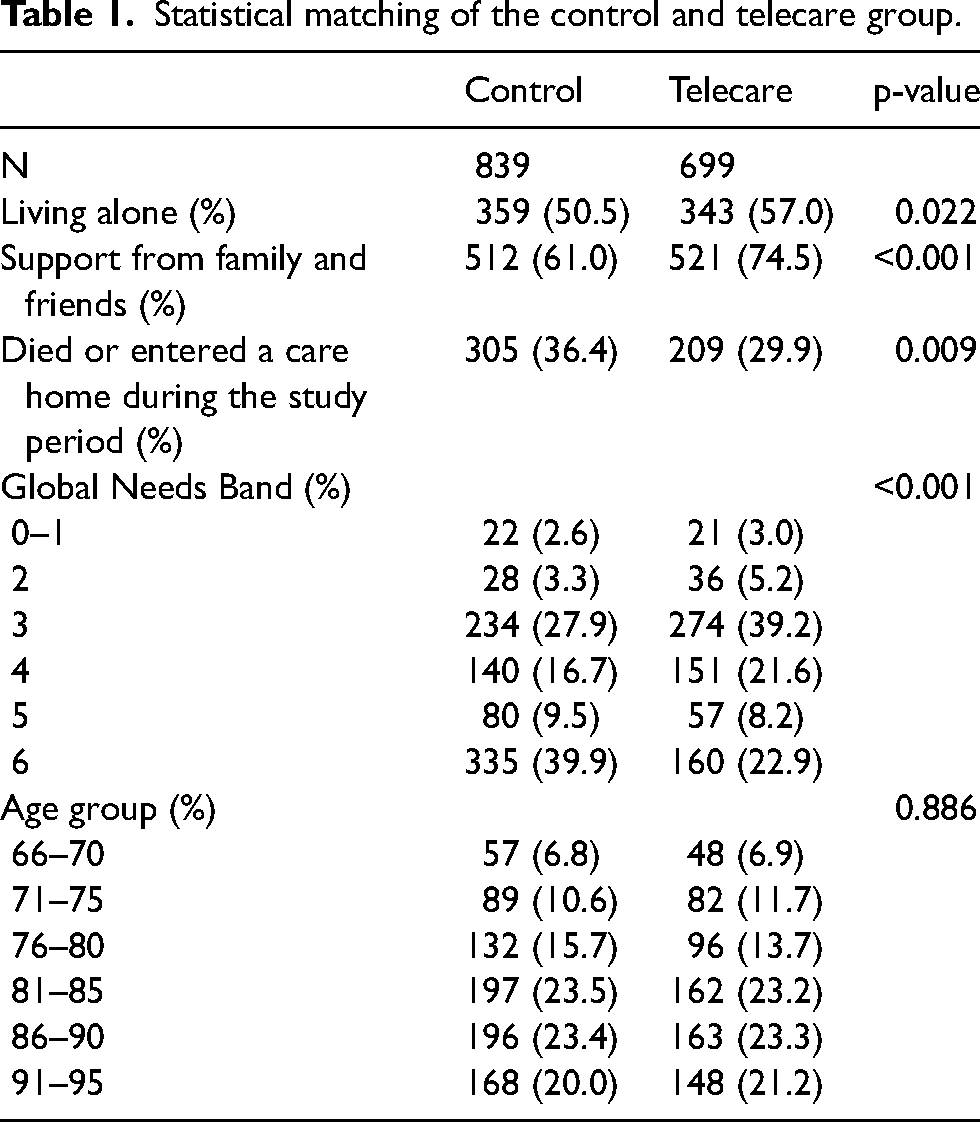
Despite the matching appearing sub-optimal, when multiple predictor variables are included in a model, the coefficient estimates reflect the association between the outcome and a predictor after adjusting for all other variables in the model. The European Medicines Agency guideline on adjustment for baseline covariates in clinical trials 8 reported that baseline covariates can be accounted for either within the initial matching process or it can be adjusted for in the analysis.
The results of the GLMM are shown in Figure 1, the solid line represents the model prediction for each group and the points represent the unadjusted raw data estimate. The model predictions show a good fit with to the raw data as they fall within the 95% confidence intervals (CIs) over the entire study period. For the control group, the model slightly under-predicts from around 40 weeks onwards but still within the 95% CIs.
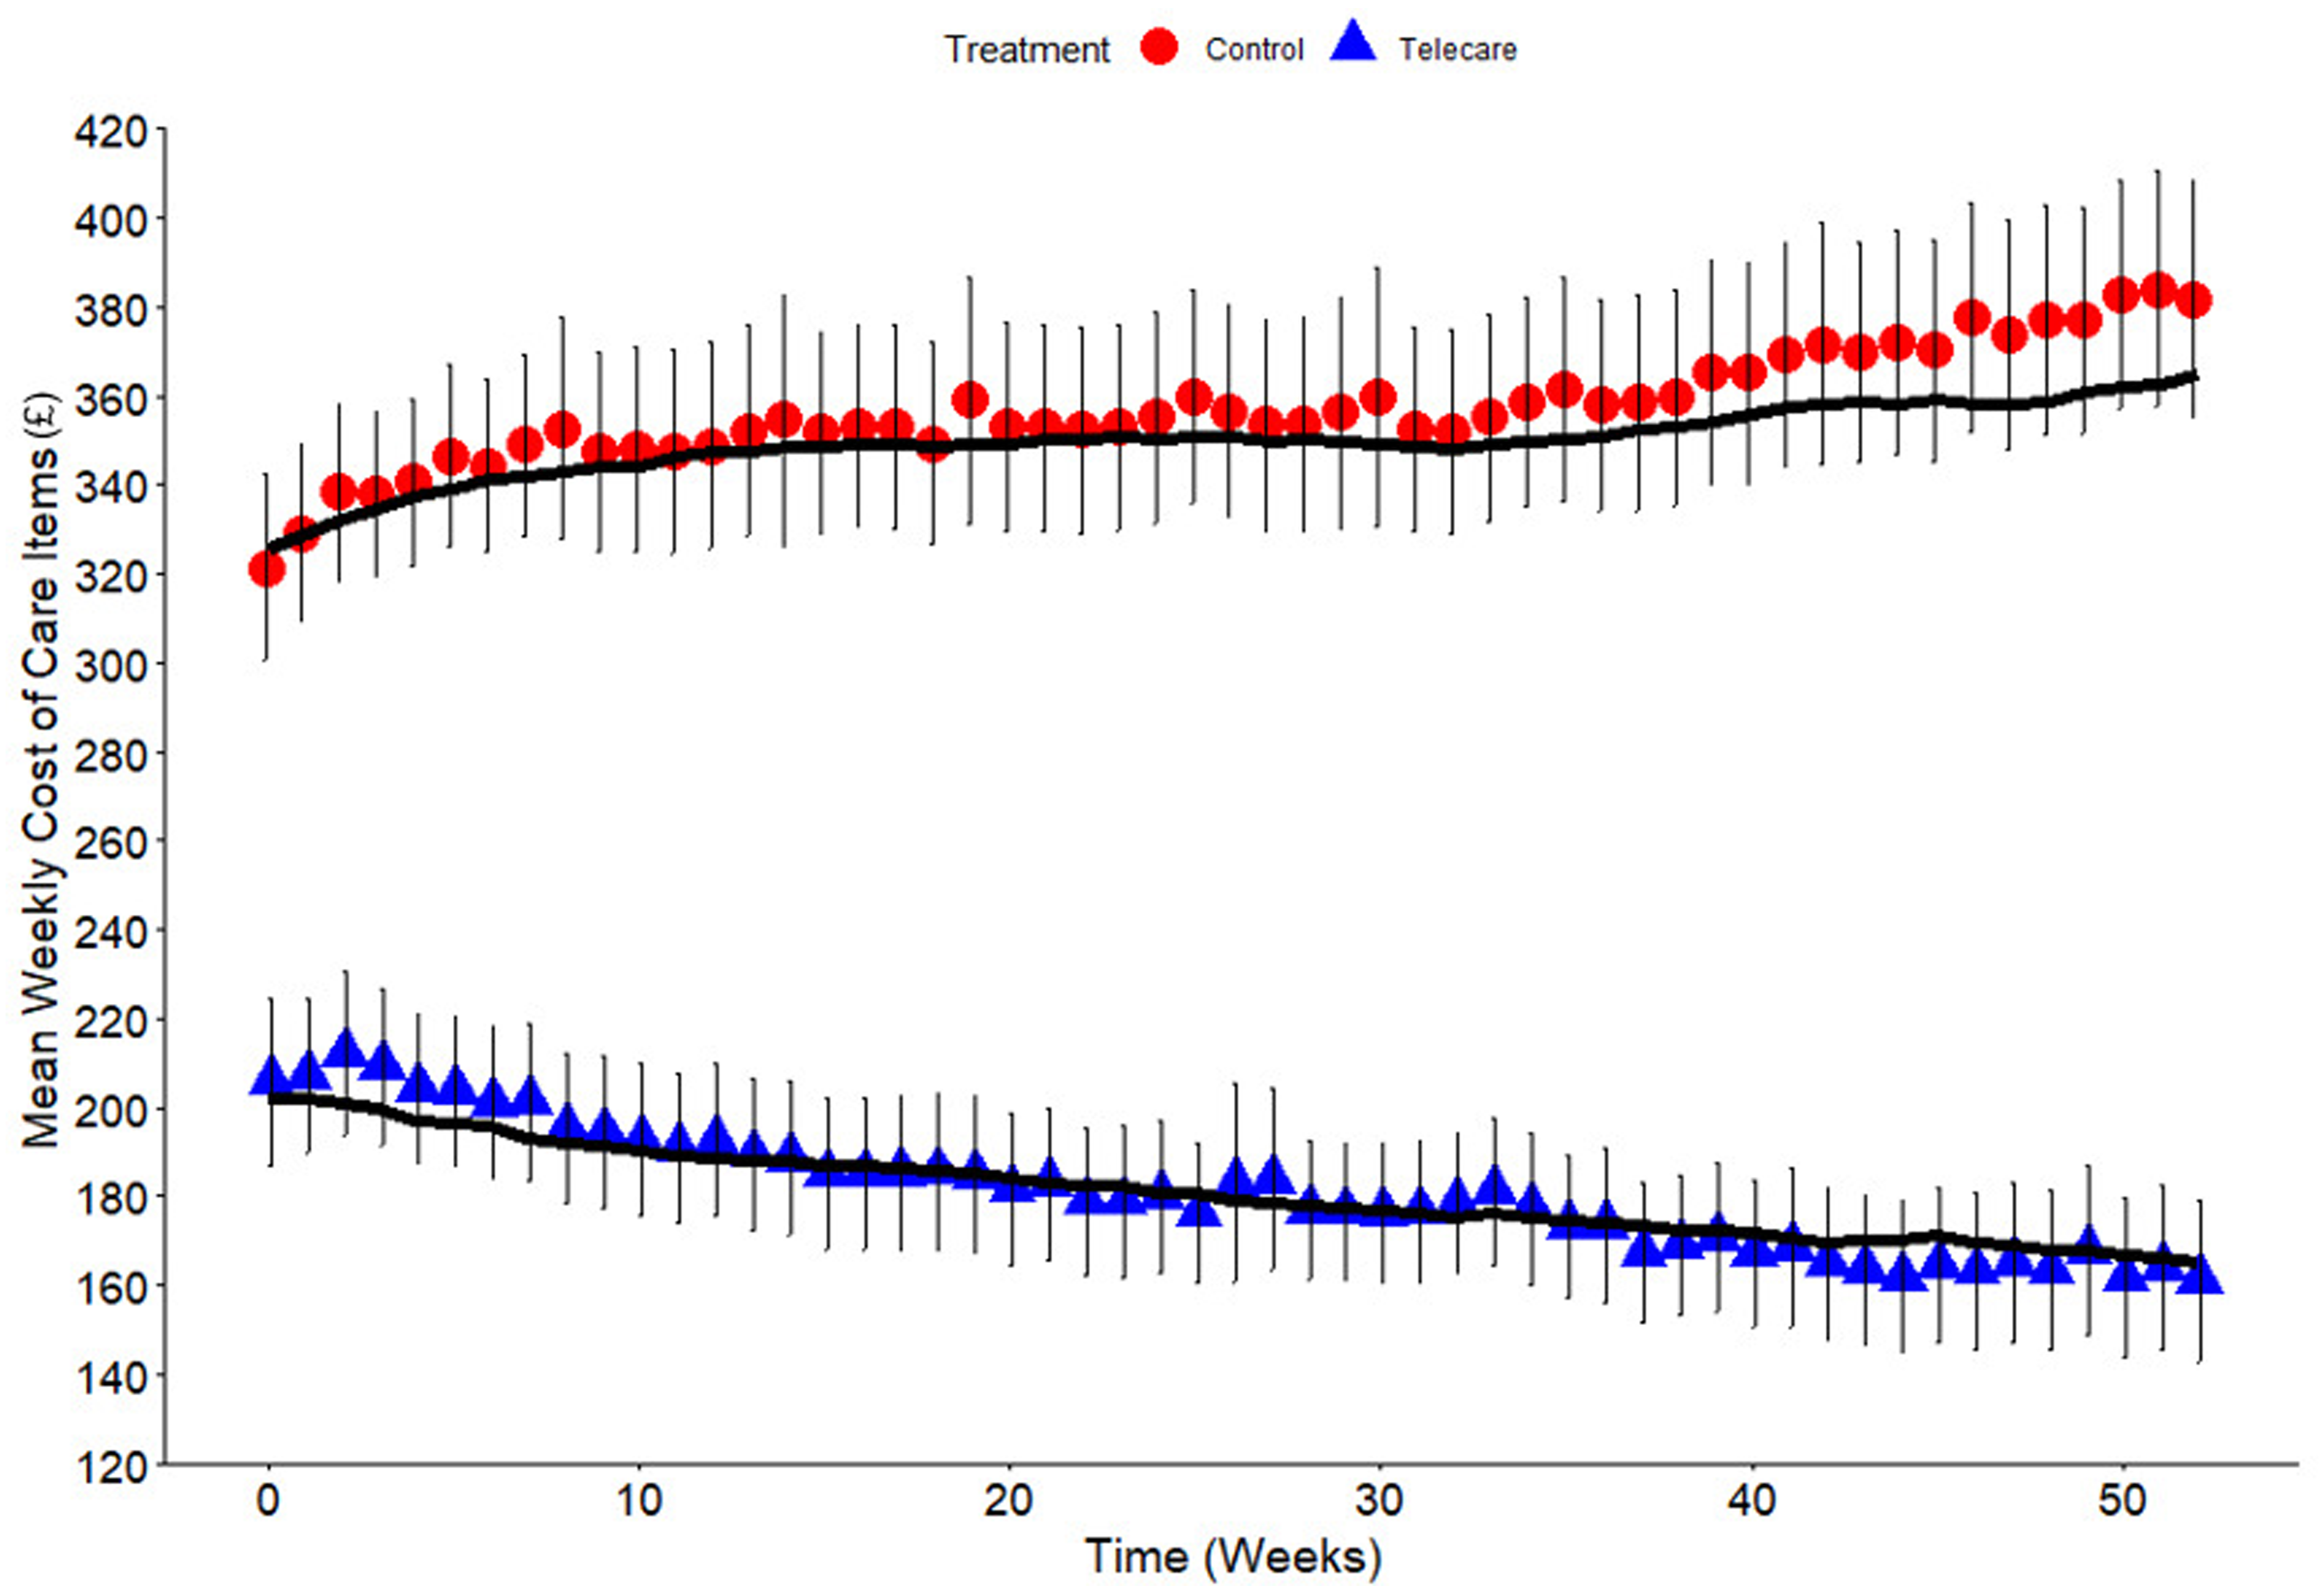
Statistical model best fit line for mean costs (£) per week of service users for both cohorts. Each point represents the unadjusted raw data estimate and the solid line represents the model predictions. Bars represent ± 95% confidence intervals.
The results of the fixed effects part of the model (Table 2) show that the telecare group service users start £75 per week lower in cost (at week 0 in the time-series) than for service users in the control group. As the time progressed the cost of social care services for all service users increased by approximately 5p per service user per week, but the telecare group cost reduced by 14p per service user per week (net reduction of 9p).
Statistical model coefficients and p values.
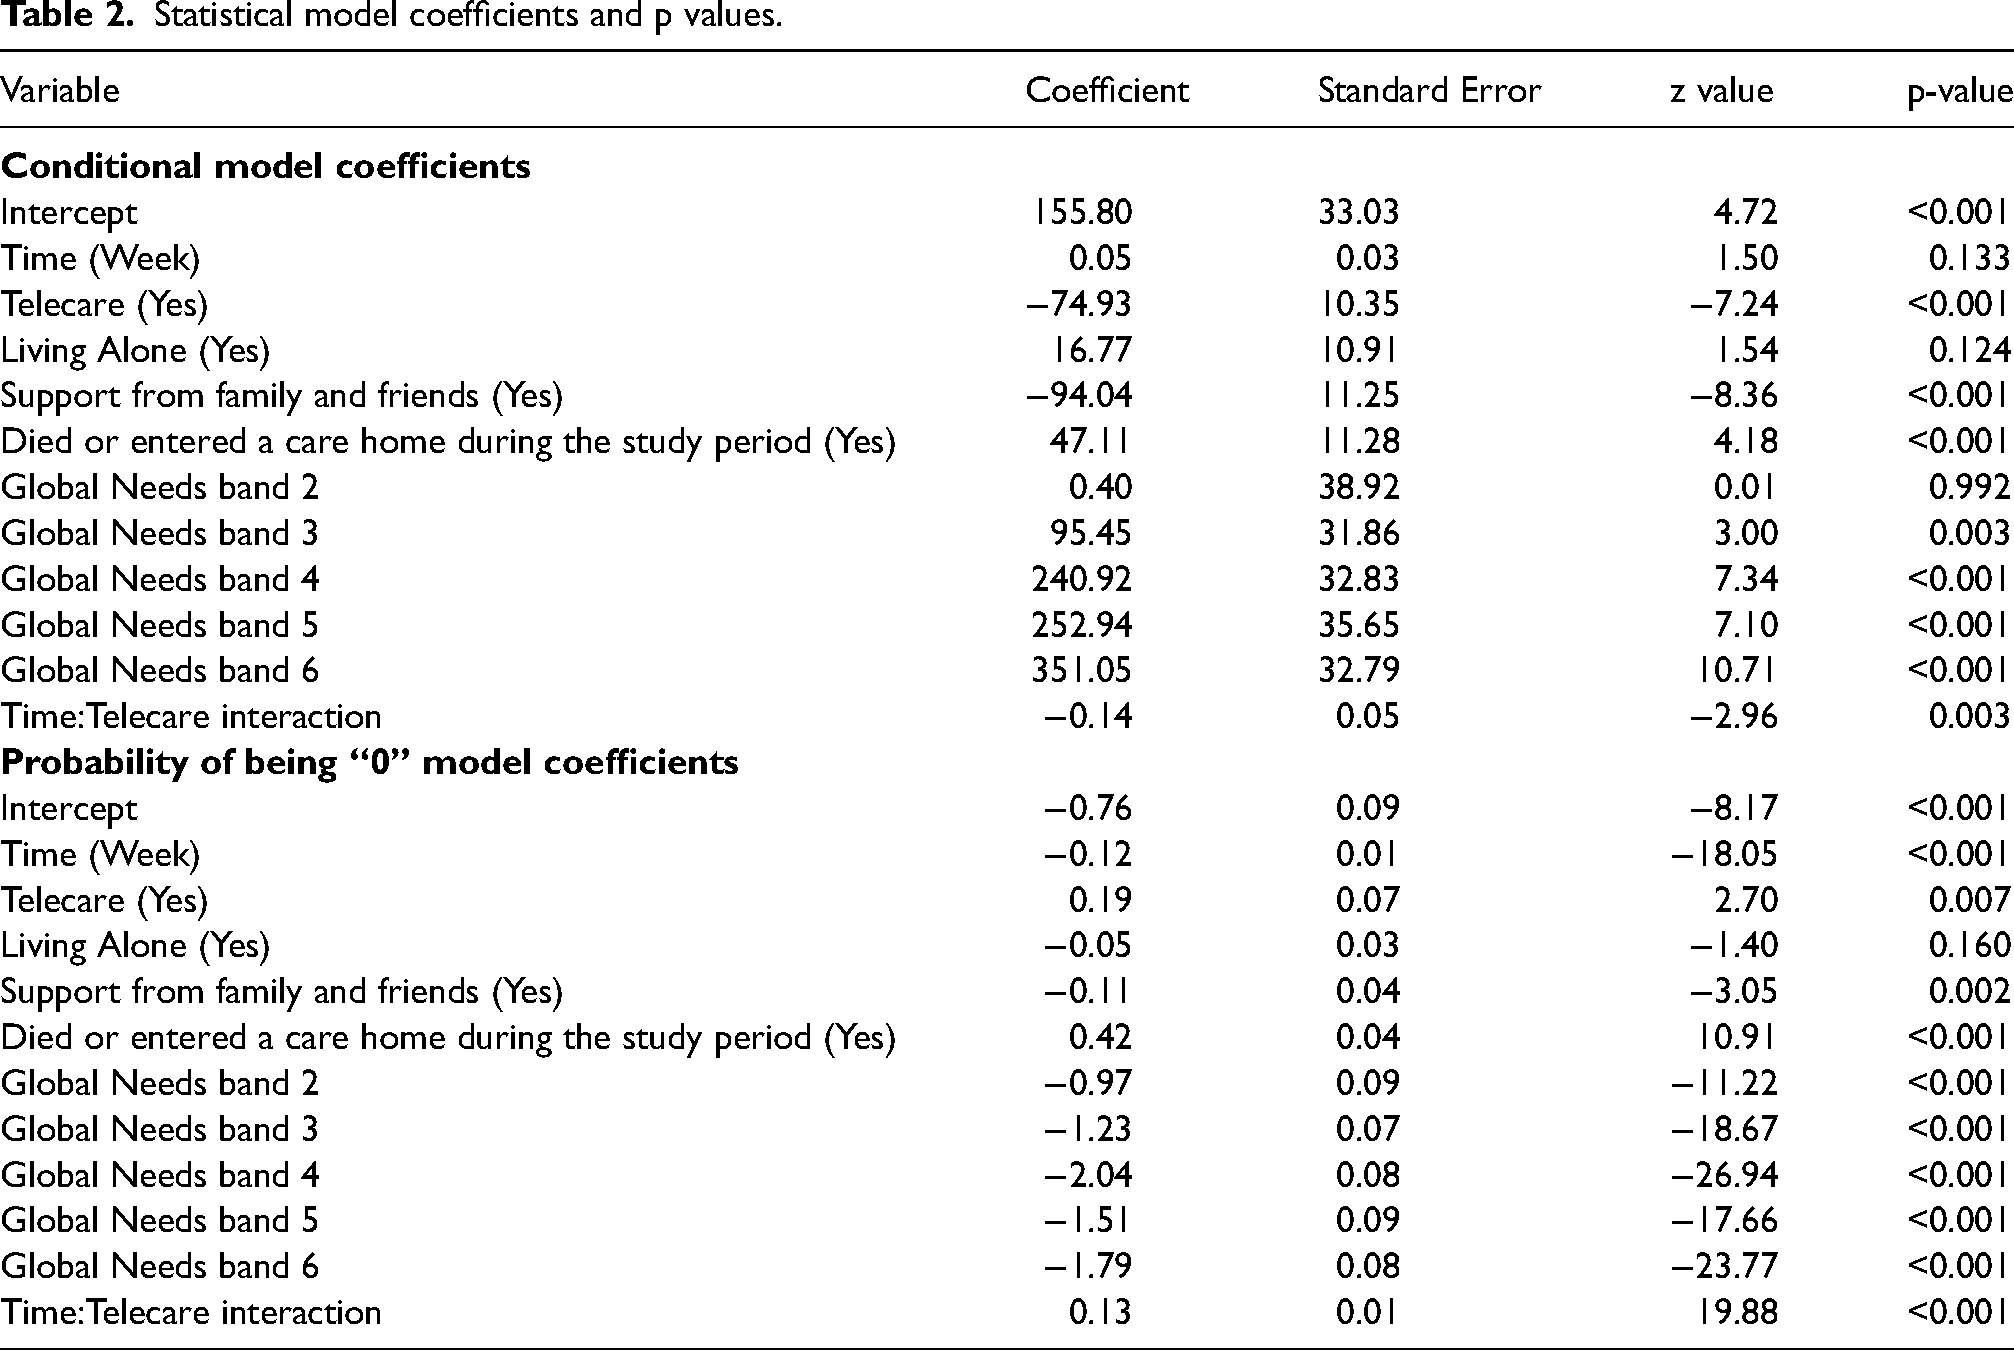
Social care costs were observed to increase by £17 per week for people living alone. By contrast, social care costs decreased by approximately £94 per week for people who received support from family and friends. Service users who died or who entered a care home had average social care costs that were £47 per week higher than those who did not die or enter a care home. Social care costs increased as dependency (measured by Global Need band) increases.
Importantly, the analysis showed that age did not have a significant impact on the costs of social care, whereas dependency (Global Need Band) did (p < 0.05). The statistical analysis was used to develop model predictions based on weighted averages to indicate the potential difference in social care cost between the two cohorts (where the exact same hypothetical group went through the control and telecare arm of the statistical model based on the Lancashire service users’ demographic data). Figure 2 shows the statistical model for service users with costs pro-rata’d and limited to the time periods observed.
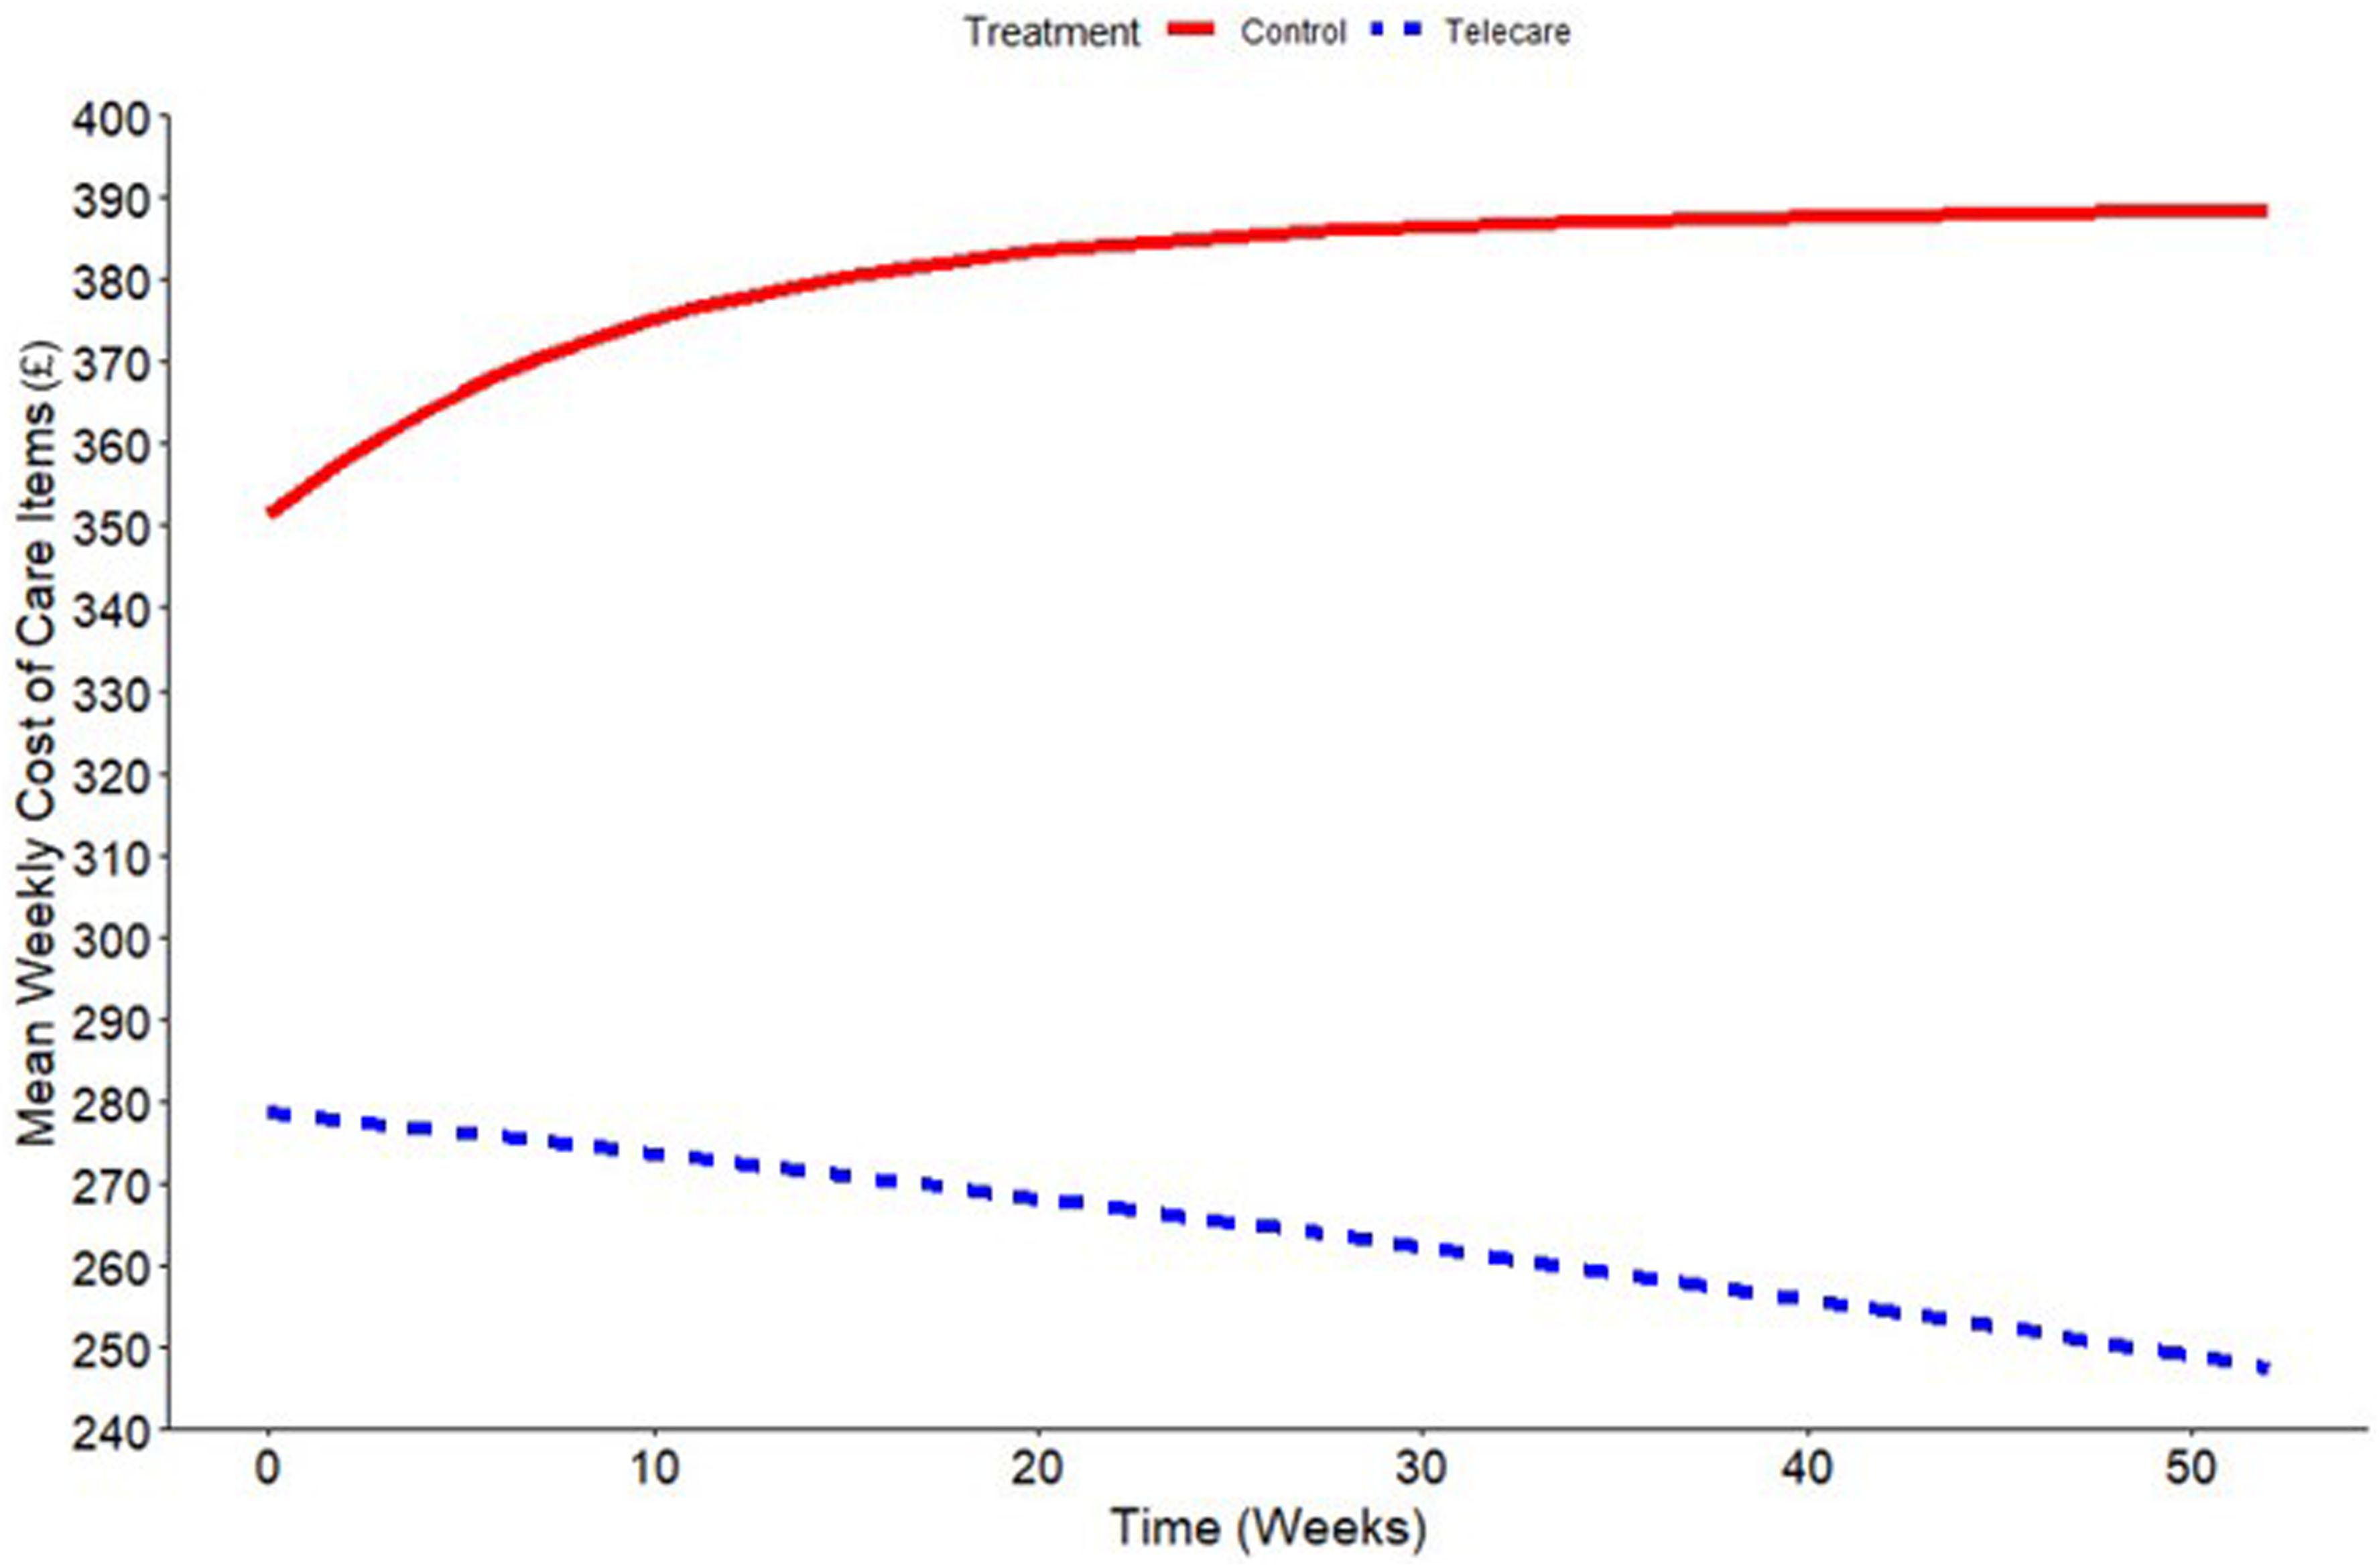
Mean costs (£) per week using the average demographics of service users with costs pro-rata’d. Each line represents the model prediction.
This scenario showed a total difference between the two groups of £4,949 per service user over the whole year. The average cost of telecare per year was £385 (£7.40 per week) plus £26 for the home responder service (£0.50 per week). If these costs are offset against the other costs of social care then the net cost difference between service users with and without telecare was £4,538 per year. Based on a total observed number of nearly 3,000 telecare users (who also use other forms of social care), around £13.3 million of additional costs were potentially avoided through the use of telecare during the observed study period. Applying a 95% confidence interval, the range of costs avoided would be between £6.8 million and £16.5 million.
A second scenario, whereby costs were extrapolated for the full year for all service users (assuming that everyone received care for a full 52 weeks), showed an increased cost difference of £6,214 per service user per year for people with telecare compared to those without telecare. The net difference was £5,803 per service user. Under this scenario, the use of telecare for these service users would avoid additional costs of almost £17 million per year for the cohort of telecare service users, with a 95% confidence interval range of £10.4 million to £20.2 million.
Normality of the statistical model residuals were then checked using a histogram and Q-Q plot (Figure 3). The bell shape curve (Figure 3a) and the close proximity of data points to the standard (Figure 3b) indicate that the model produces residuals that are normally distributed.
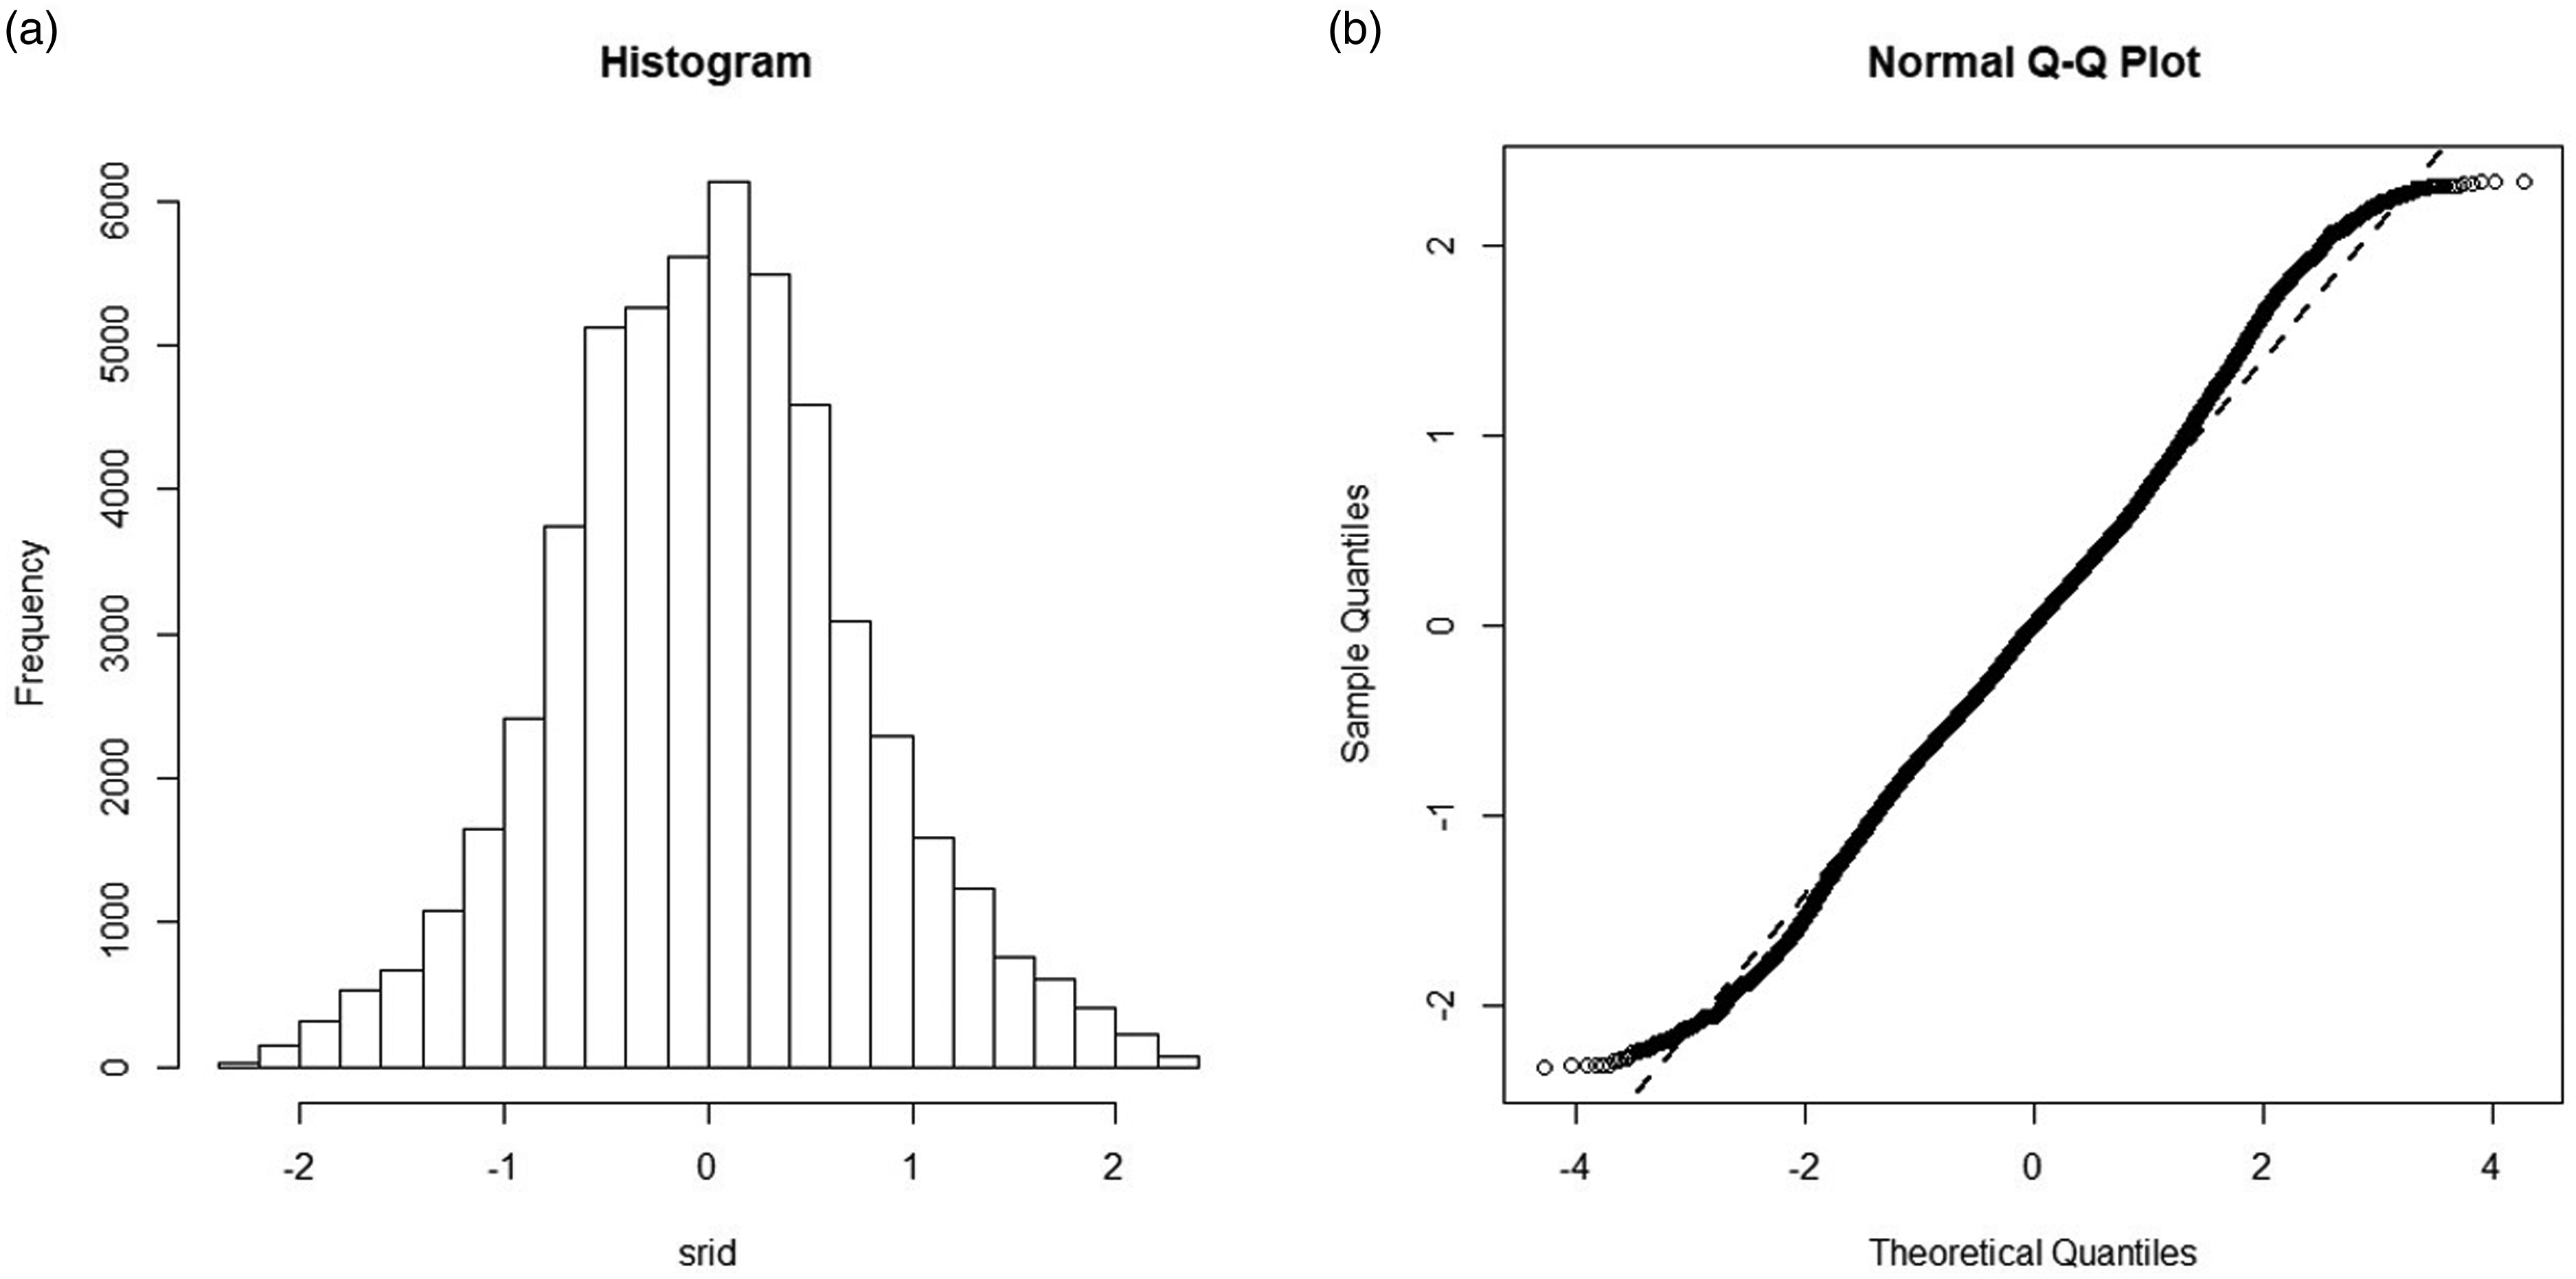
Normality of model residuals. Normality was assessed using a histogram (a) and quantile-quantile (Q-Q) plot (b).
Collinearity in the data was then assessed to ensure independence of all of the independent variables used within the model. Of all the relationships examined in Figure 4, there were only two potential relationships between independent variables. Both of these arose from the Global Needs band variable (Global_Needs), in comparison to whether the service user lived alone (Living_Alone) and whether the service user entered a residential care home or died (Dead_Home) at any point during the time period. Overall there were no significant relationships exhibited between the independent variables. These statistical model diagnostic checks show that the model fitted to the available data is robust.
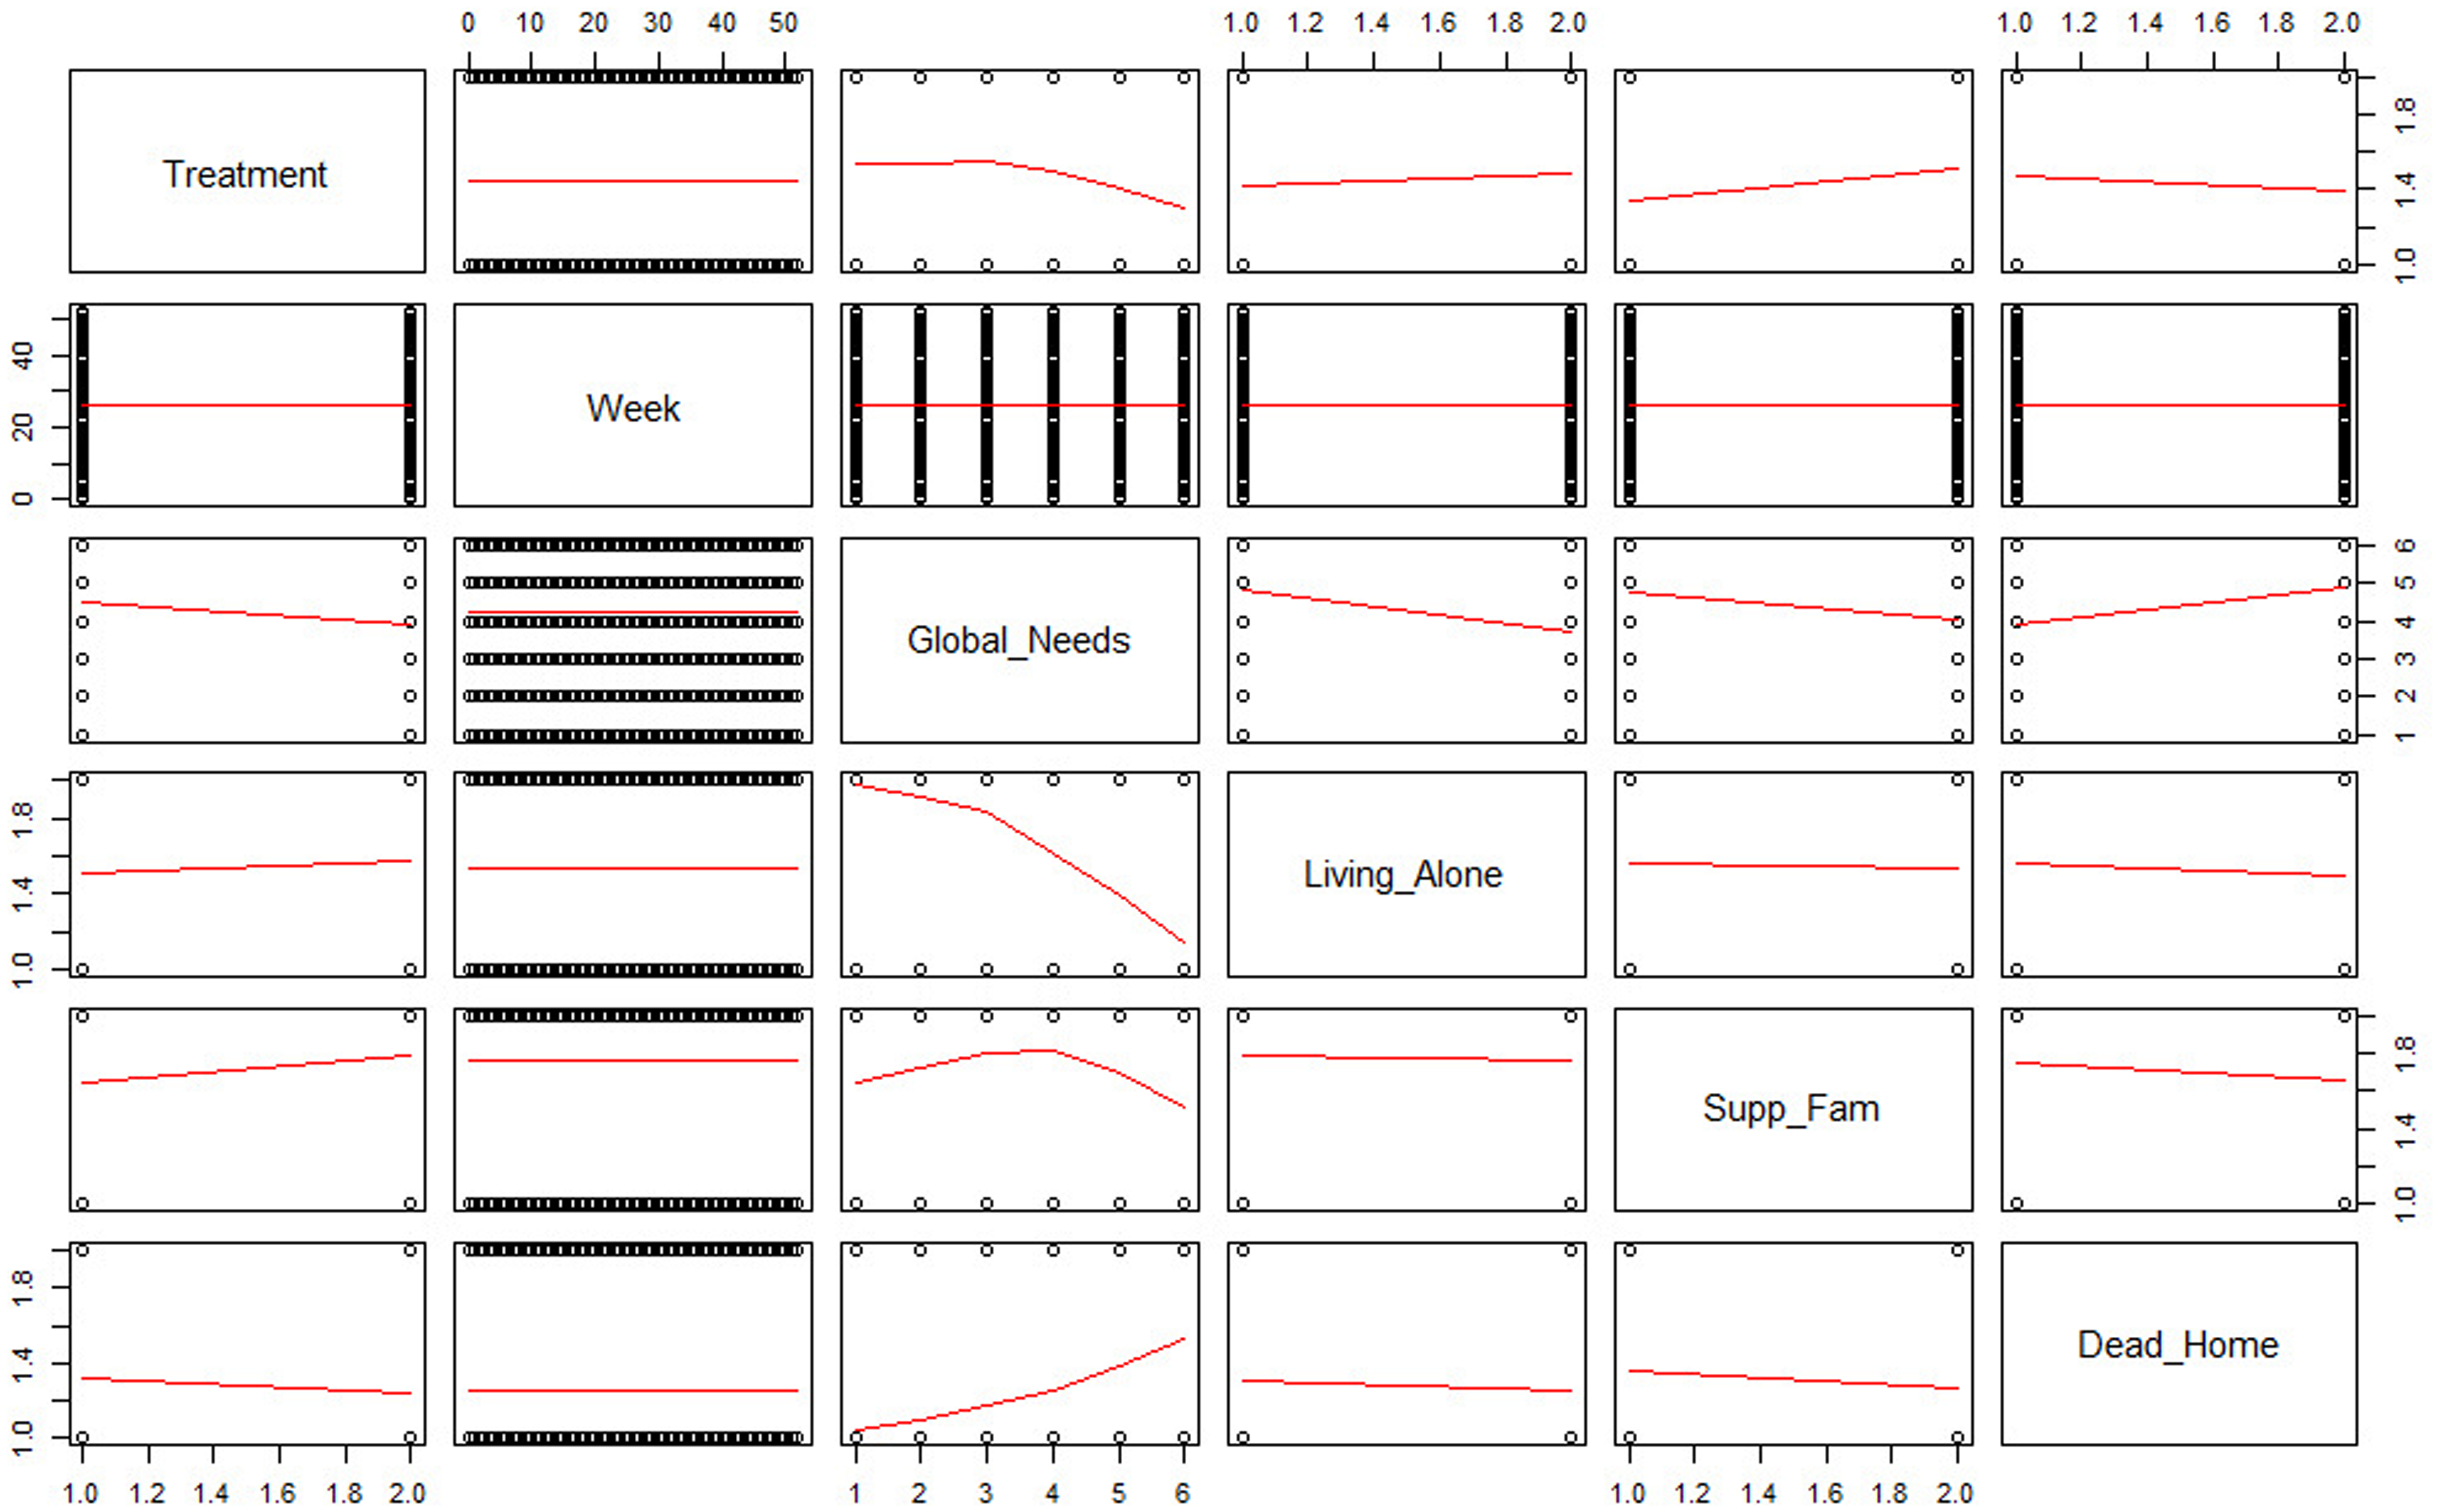
Collinearity for each independent variable. Relationship of each independent variable assessed by collinearity.
Discussion
Studies have shown that there is variation in the effectiveness and cost-effectiveness of telecare interventions and they often only a focus on sub-groups of social care users. In this study, examining an elderly population using social care, it was found that the use of telecare had a net cost difference compared with no telecare of between £4,538 to £5,803 per service user per year.
Other studies have found different results, with one study finding that telecare led to increased costs of £1,014 compared with the control group with the health-related quality of life gain (measured in quality adjusted life years (QALYs)) being similar in both groups. 9 However, that study dated from 2014 and may not reflect the progression in telecare technology and reduction in cost since then. In another study, no benefit was found when focusing on people with dementia, where a telecare intervention did not significantly differ in social care cost and participants gained fewer QALYs compared with the control group. 10 These findings are not unanimous as evidenced when using telecare in first phase pilot schemes in North Yorkshire. 6 The 2005–2006 study exhibited a net saving of £4,300 (similar to our own) compared to traditional care and was expanded to 1,000 plus users. Research into telecare and its effects on adult social care support remains sparse and this study highlights a pressing need for more modern studies.
This current study is the first to use a hurdle regression model to explore and quantify the impact of telecare on reducing the economic burden of delivering adult social care in the UK. As the data used in this study is collected in the real world as opposed to a robustly designed RCT, the methodology used in this study provides a robust approach for controlling for observable confounders, which may impact a service user's level of care, in order to isolate the direct impact of telecare.
It is important to state the limitations of the analysis. The analysis was carried out on a data set that was collected for service provision rather than research purposes and there a high number of different ‘co-variates’ or influences on the potential outcomes that could produce bias in the analysis, including age, levels of dependency and whether service users receive support from family and friends. The analysis has, therefore, attempted to adjust for the various limitations of the data through using a GLMM to predict average costs, in spite of the existence of potential confounders due to the high number of co-variates. This approach also controlled for the difference in dependency characteristics of the two group (such as the larger proportion of people with higher dependency in the control group). Another potential limitation of the analysis is the difference in the numbers of people in the two cohorts who were new to the social care system compared to those who had been receiving social care for some time. Analysis of the two groups showed that between the start of May 2016 and the end of March 2017, 274 control group service users and 266 telecare service users received a care item for the first time (i.e., they were introduced to social care). The two groups are, therefore, reasonably well matched in that respect.
Furthermore, it should be noted that the statistical model slightly under predicts the central estimate of the control group compared to the underlying raw data. However, in our opinion this means the results presented from this study are conservative and do no overstate the difference in costs between the two groups. Nevertheless, this approach requires further evaluation and refinement to avoid any over or underestimations in future studies.
Despite the limitations of the data, we believe this analysis helps to demonstrate that there is clear potential for telecare to reduce the costs of increasing social care. Equally importantly, this implies that the use of social care resources by people using telecare can be reduced, potentially releasing capacity to meet currently unmet need. We also draw attention to the use of a generalised linear mixed model (GLMM) as a novel method of analysing an observed data set by controlling for confounding factors. Further analysis could be undertaken using a prospectively collected data set, applying better control over parameters to reduce potential confounders.
Footnotes
Acknowledgements
Research funded by Tunstall.
Declaration of conflicting interests
The authors declared no potential conflicts of interest with respect to the research, authorship, and/or publication of this article.
Funding
The authors disclosed receipt of the following financial support for the research, authorship, and/or publication of this article: This work was supported by Tunstall Healthcare (UK) Ltd.