
Abstract
Background:
Intervention for patients with symptomatic varicose veins is largely driven by a combination of symptoms, the magnitude of venous reflux, clinical severity scoring algorithms, and unresponsiveness to conservative medical therapy. Our goal was to evaluate biological features of superficial veins from patients with symptomatic varicose veins, comparing these to healthy veins for biological insight into the progression of superficial vein disease.
Methods:
RNA was extracted from incompetent great saphenous veins at the time of phlebectomy and compared with residual healthy superficial veins from patients following coronary artery bypass graft surgery. The venous wall transcriptome was interrogated by NanoString. PANTHER and Gene Ontology identified biological pathways of interest. Based on these data, plasma biomarkers from patients with varicose veins or matched controls were evaluated.
Results:
Multiple genes were upregulated and downregulated for pathways involving angiogenesis, collagen biosynthesis, and inflammation. COL1A1 was upregulated in varicose veins by fourfold, and interleukin-6 (IL-6) was downregulated by 21-fold. The blood IL-6 concentration was higher in the validation cohort of patients with varicose veins compared with relatively healthy patients (4.8 vs 1.3 pg/mL, p = 0.0085). Blood collagen 1A1 (COL1A1) was lower in patients with varicose veins compared with healthy patients (66,355 vs 82,661 pg/mL, p = 0.0497). A positive association was observed between circulating COL1A1 concentration and the Venous Clinical Severity Score, suggesting its potential utility as a prognostic biomarker for pathological great saphenous vein remodeling in patients with varicose veins.
Conclusions:
This hypothesis-generating study revealed that blood COL1A1 and IL-6 concentrations may be blood biomarkers used as additional objective data that may indicate adverse vein remodeling in patients with varicose veins.
Keywords
Background
Varicose veins, often in the lower extremities, constitute chronic venous insufficiency (CVI). The prevalence of varicose veins in the general population is around 20%. 1 Although asymptomatic in some patients, varicose veins carry a risk of skin erosion, ulcer development, as well as superficial vein thrombosis.2,3 A large study in Taiwanese patients revealed that varicose veins carry a risk of deep vein thrombosis (DVT), making this condition an underrecognized, potentially life-threating condition. 4 Risk factors for developing varicose veins include female sex, obesity, pregnancy, a taller than average stature, a first-degree relative with varicose veins, as well as certain behavioral patterns such as prolonged standing. 5 Varicose veins are typically treated conservatively with compression therapy and risk factor modification. In refractory cases, interventional therapy may be employed, including sclerotherapy, laser thermal ablation, and phlebectomy. 6 In the US, the degree of pathological reflux by venous Duplex in patients with superficial varicose veins is often used in decision making for interventional venous therapy. 7 Whether biomarkers secreted into the blood may serve as markers of venous remodeling is unknown.
The molecular mechanisms driving venous remodeling in patients with CVI that result in varicose vein development are unclear. Histopathological studies performed on excised varicose vein samples have demonstrated extracellular matrix (ECM) remodeling and collagen deposition in varicose veins. 8 Recent advances in genomics, 9 transcriptomics, 10 and proteomics have permitted the characterization of molecular pathways involved in vascular remodeling. 11 Few studies have considered that local vein wall changes could result in systemic biomarker alterations. Understanding the relationship between wall remodeling and circulating proteins could shed light on disease pathogenesis and the development of biomarkers for diagnosis or to assist in surveillance programs.
Our goal was to evaluate biological features of superficial veins from patients with symptomatic varicose veins, comparing these to healthy veins for biological insight into the progression of superficial vein disease.
Methods
Human subjects
Patients and healthy subjects were recruited only after informed consent by a coordinator not involved in clinical care. This study was approved by the local institutional review board and conducted in accordance with the Declaration of Helsinki.
Specimen collection
Biological specimens (vein tissues) were collected from patients with varicose veins undergoing phlebectomy and from patients with coronary artery disease (CAD) undergoing coronary artery bypass surgery at the University of Rochester between 2016 and 2019 after informed consent. Varicose veins (the great saphenous vein [GSV]) were removed by surgical phlebectomy and processed the same day. Healthy saphenous vein specimens were obtained by surgical resection in patients with established, severe CAD undergoing coronary artery bypass graft (CABG) surgery. For veins collected prior to CABG, adipose tissue was trimmed and blood was rinsed using cold saline solution. Segments of the vein tissue from each patient were either placed in formalin for subsequent histological analysis, or snap-frozen in liquid nitrogen and stored at −80°C for future analysis. Transcriptomics and immunostaining on these tissue samples were performed at the Cleveland Clinic. Blood samples for biomarker analysis were collected from a different cohort of patients with varicose veins, along with age- and sex-matched healthy controls at the Cleveland Clinic between 2022 and 2025 for biomarker analysis.
Transcriptomics
Veins extracted at the time of clinical intervention that were snap-frozen in liquid nitrogen and stored until analysis were thawed only once. RNA was extracted from the vein into TRIzol using a kit (Qiagen) according to the manufacturer’s instructions. RNA (100 μg per sample) was used as the template for analysis. The nCounter Fibrosis Panel was used with the addition of the genes detailed in the Methods section (NanoString Technologies, Inc., Seattle, WA, USA). In total, we determined the expression of 770 genes involved in fibrosis along with the following probes: MMP20, MMP21, CD235a, CD69, GPIBα, GPIbβ, ITGA2B, GP-9, GP-5, vWF, CXCL4, and CD62. Data normalization and gene expression analysis were completed using nSolver Analysis Software version 4.0.7 and Advanced Analysis Software version 2.0.134 (Bruker Spatial Biology). Adjusted p-values were used to determine the expression of each gene, and pathway analysis determined the biological systems activated or suppressed in each sample.
Immunofluorescence
Vein samples were sectioned at 5-μm thick and mounted on Superfrost Plus™ slides (M6146-PLUS: Cardinal Health; Waukegan, IL). Staining for IL-6 and collagen-1A1 (COL1A1) was performed on the benchtop using a Sequenza slide rack (73310017; Epredia, MI). In brief, slides were deparaffinized and rehydrated using xylene and an ethanol gradient to water. Antigen retrieval was performed using a citrate/tris acidic buffer, pH 6, for 15 minutes at 99°C in an Oster food steamer (5711; Newell, Atlanta, GA, USA), then brought to room temperature with a gradual deionized water wash for 30 minutes. After rinsing with Tris-buffered salinewith Tween 20 (TBST), Bloxall (SP-6000-100; Vector Labs, Newark, CA, USA) was applied and incubated for 10 minutes at room temperature. Slides were rinsed with TBST. A total of 400 μL of 3% horse serum with Triton X-100 (T-9284: Sigma-Aldrich; St. Louis, MO) in phosphate-buffered saline (PBS) was applied and incubated for 30 minutes at room temperature. On appropriate slides, blocking buffer was removed and replaced with either IL-6 (1:800 dilution; ab6672; Abcam, Cambridge, UK) or COL1A1 (1:200 dilution; Cell Signaling Technology, Danvers, MA, USA) and incubated at 4°C overnight. Slides were brought to room temperature and rinsed with TBST. Then, 300 μL of ImmPRESS horse anti-rabbit HRP (MP-7401; Vector Labs) was applied to each slide and incubated for 30 minutes at room temperature. After a rinse, Opal 690 (FP1497001KT; Akoya Biosciences, Marlborough, MA, USA) was diluted to 1:1500 in a tyramide signal amplification (TSA) buffer (322809: Advanced Cell Diagnostics; Newark, CA), applied to each slide, and incubated in the dark for 20 minutes at room temperature. Slides were then rinsed and placed on coverslips with ProLong Gold with DAPI (P36931; Invitrogen, Eugene, OR). Image capture and processing were performed using QuPath software (open source).
Enzyme-linked immunosorbent assay
Blood samples were obtained from the systemic circulation via antecubital venipuncture in patients with varicose veins and matched controls. Importantly, these individuals were distinct from those whose vein wall specimens were analyzed for biomarker identification, thereby providing an independent cohort and a second layer of validation. A volume of 20 mL of blood was drawn from an unbiased selection of 28 patients with varicose veins and from 28 relatively healthy controls into EDTA tubes with venipuncture and centrifuged at 3400 rpm for 10 minutes. Plasma concentrations of IL-6 and COL1A1 were determined by enzyme-linked immunosorbent assay (ELISA) using the following kits: Quantikine HS ELISA Human IL-6 Immunoassay (HS600C; Bio-Techne; Minneapolis, MN) and Quantikine ELISA Human Pro-Collagen I alpha 1 (COL1A1) (DPCA00; Bio-Techne), according to the manufacturers’ instructions.
Statistical analysis
Data were tested for normality using the Shapiro–Wilk test. Normally distributed continuous variable group differences were assessed by the two-tailed Student’s t-test and skewed data were assessed by the Mann–Whitney U test. The predictive value of blood biomarkers to distinguish patients with varicose veins from healthy volunteers was represented as the area under the curve (AUC) with 95% CIs. The relationship between blood biomarker concentration and the Venous Clinical Severity Score (VCSS) or venous reflux time was shown using simple liner regression, and the strength of association was assessed using Pearson’s correlation coefficient (rho). Analyses were conducted using GraphPad Prism version 10 (GraphPad Software). Significance was accepted at p < 0.05.
Results
For transcriptomic and proteomic analysis, 11 patients (five with varicose veins and six undergoing saphenous vein harvest for coronary artery bypass surgery) were selected. Patient demographics are shown in Table 1. Hematoxylin and eosin (H&E) staining of vessels revealed more tortuosity and thinner walls in varicose veins, confirming their identity and in line with expectations (Figure 1).
Clinical features of patients with varicose veins for vein biomarker analysis.
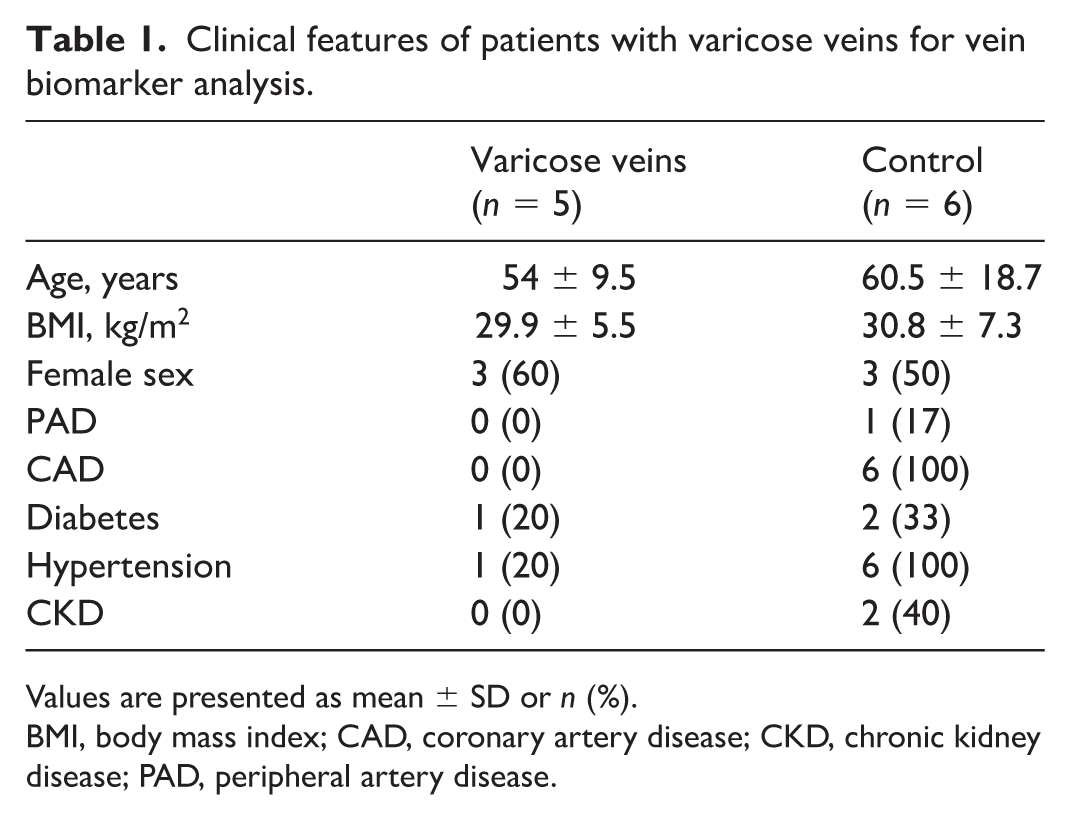
Values are presented as mean ± SD or n (%).
BMI, body mass index; CAD, coronary artery disease; CKD, chronic kidney disease; PAD, peripheral artery disease.
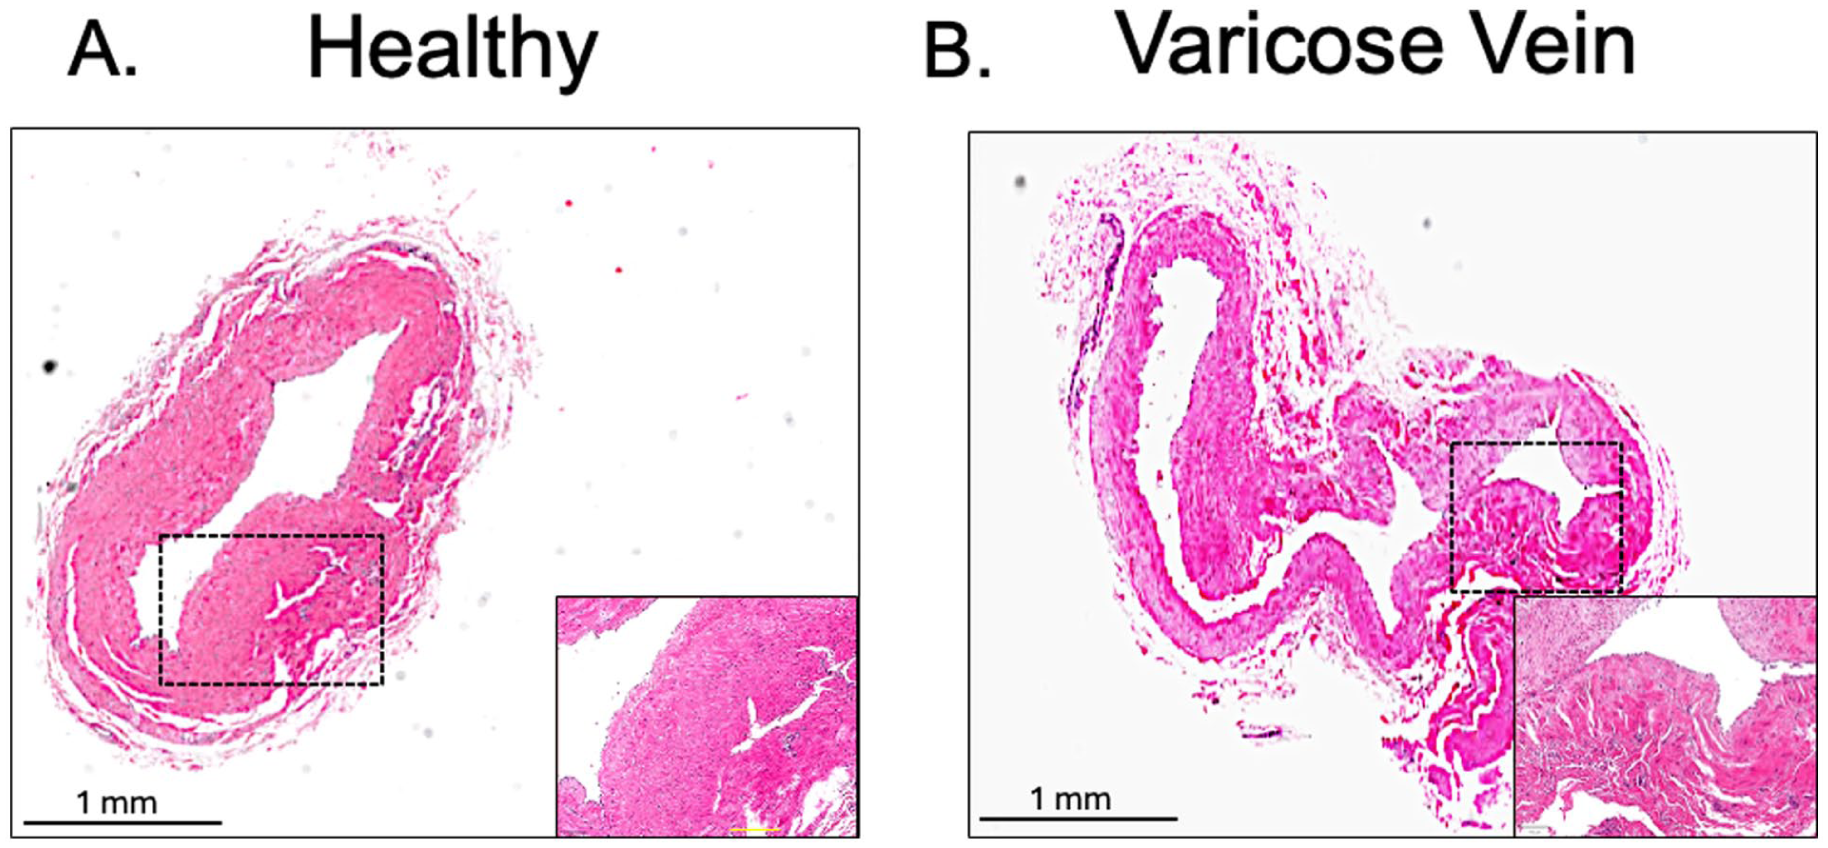
Architectural features of the great saphenous vein.
Transcriptomics of the great saphenous vein (GSV)
The expression of genes in the GSV active in inflammation and fibrosis was compared between incompetent GSV (varicose vein) and healthy GSV from patients undergoing CABG. Gene ontology (GO) analysis revealed an upregulation of biological pathways involved in angiogenesis, connective tissue replacement, and collagen biosynthesis in patients with varicose veins (Figure 2, Supplemental Figure S1). Of the changes in gene expression in varicose veins that met statistical significance (Figure 2, Figure S2), COL1A1, which is known to be present in the vein wall,12,13 was upregulated in the incompetent GSV by 3.9-fold compared to the healthy GSV. In contrast, interleukin-6 (IL-6), an inflammatory cytokine identified in the blood vessel wall in multiple vascular disorders,14–16 was downregulated by 20.7-fold in the incompetent GSV compared to the healthy GSV.
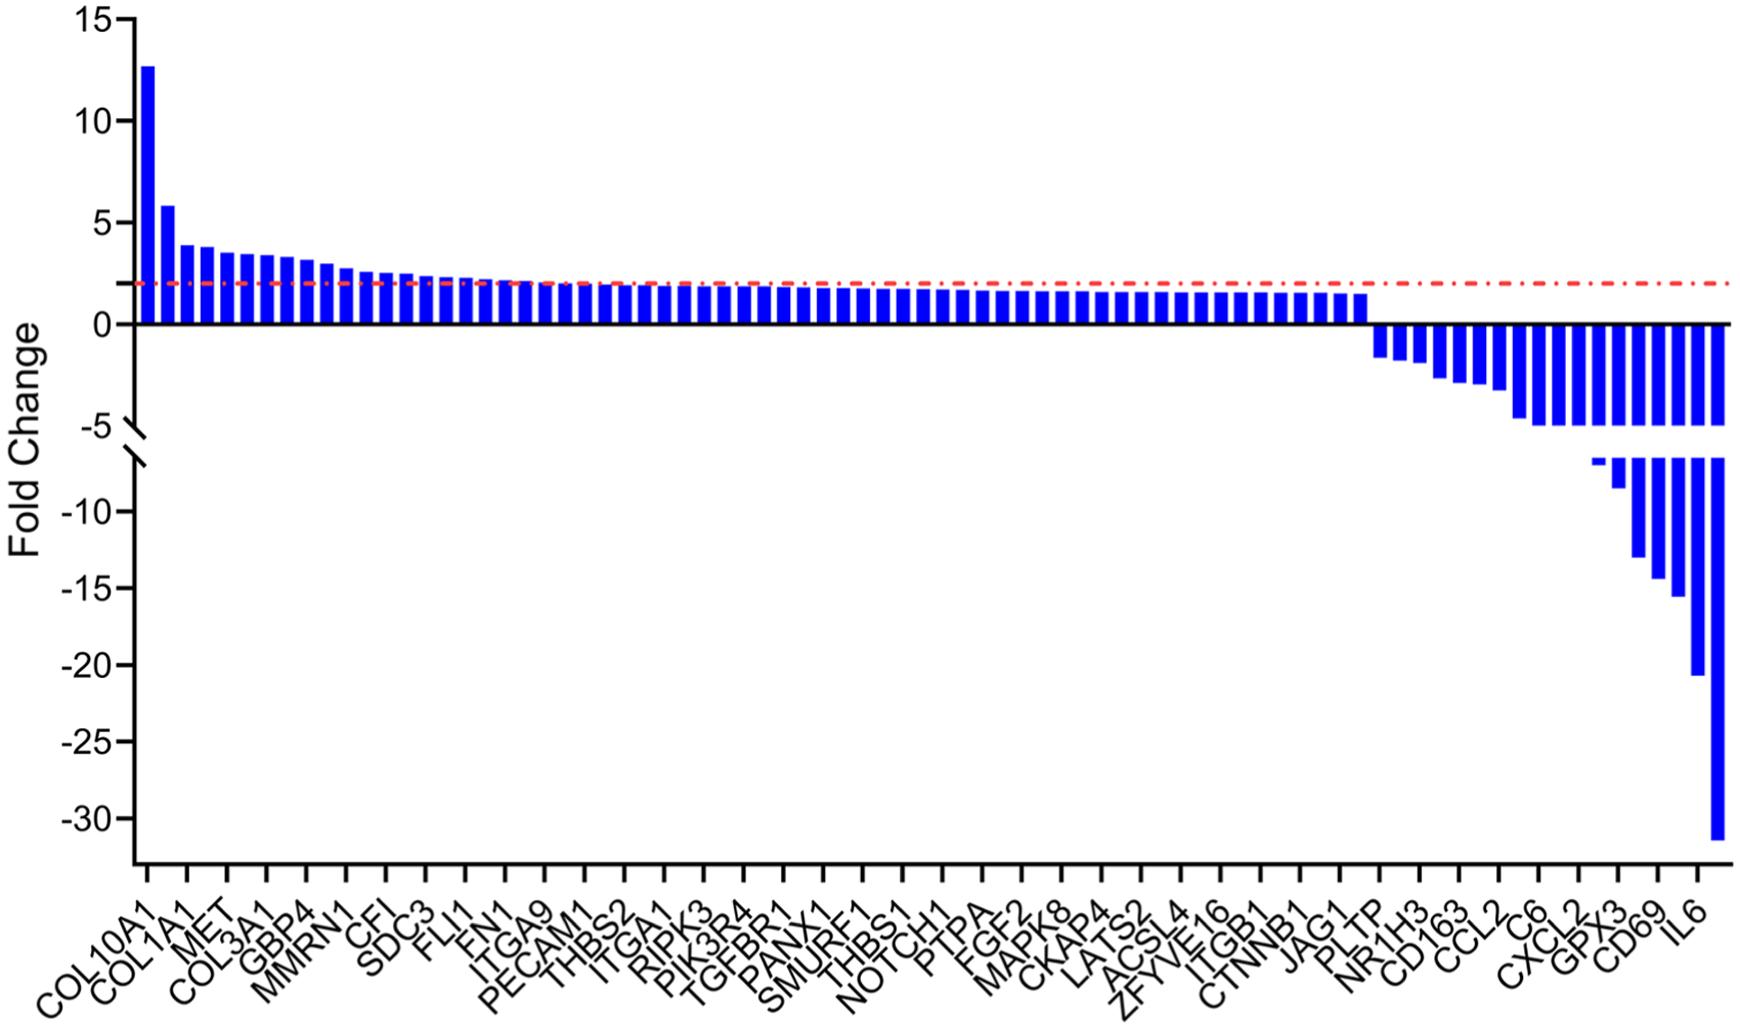
Transcriptomic analysis of the great saphenous vein. RNA was extracted and the expression of genes involved in inflammation and fibrosis was determined in healthy great saphenous veins from patients undergoing coronary artery bypass surgery (n = 6) and compared with those from patients with varicose veins (n = 5).
Immunostaining of GSV
To determine whether changes in the RNA of the vein wall correspond with the encoded protein expressed, we performed immunofluorescent staining of the incompetent GSV and healthy GSV for COL1A1 and for IL-6. In the healthy GSV, linear and organized staining for COL1A1 protein was apparent in the tunica media among smooth muscle cells; this distribution was markedly increased in the incompetent GSV from patients with varicose veins, with a more prominent immunofluorescent signal in the tunica intima and the tunica adventitia. Conversely, patchy staining for IL-6 was observed in the healthy GSV—again most prominently in the tunica media—with decreased intensity in the GSV from patients with varicose veins (Figure 3). Overall, the RNA signal noted by NanoString corresponded with protein staining in the vein wall by immunofluorescence.
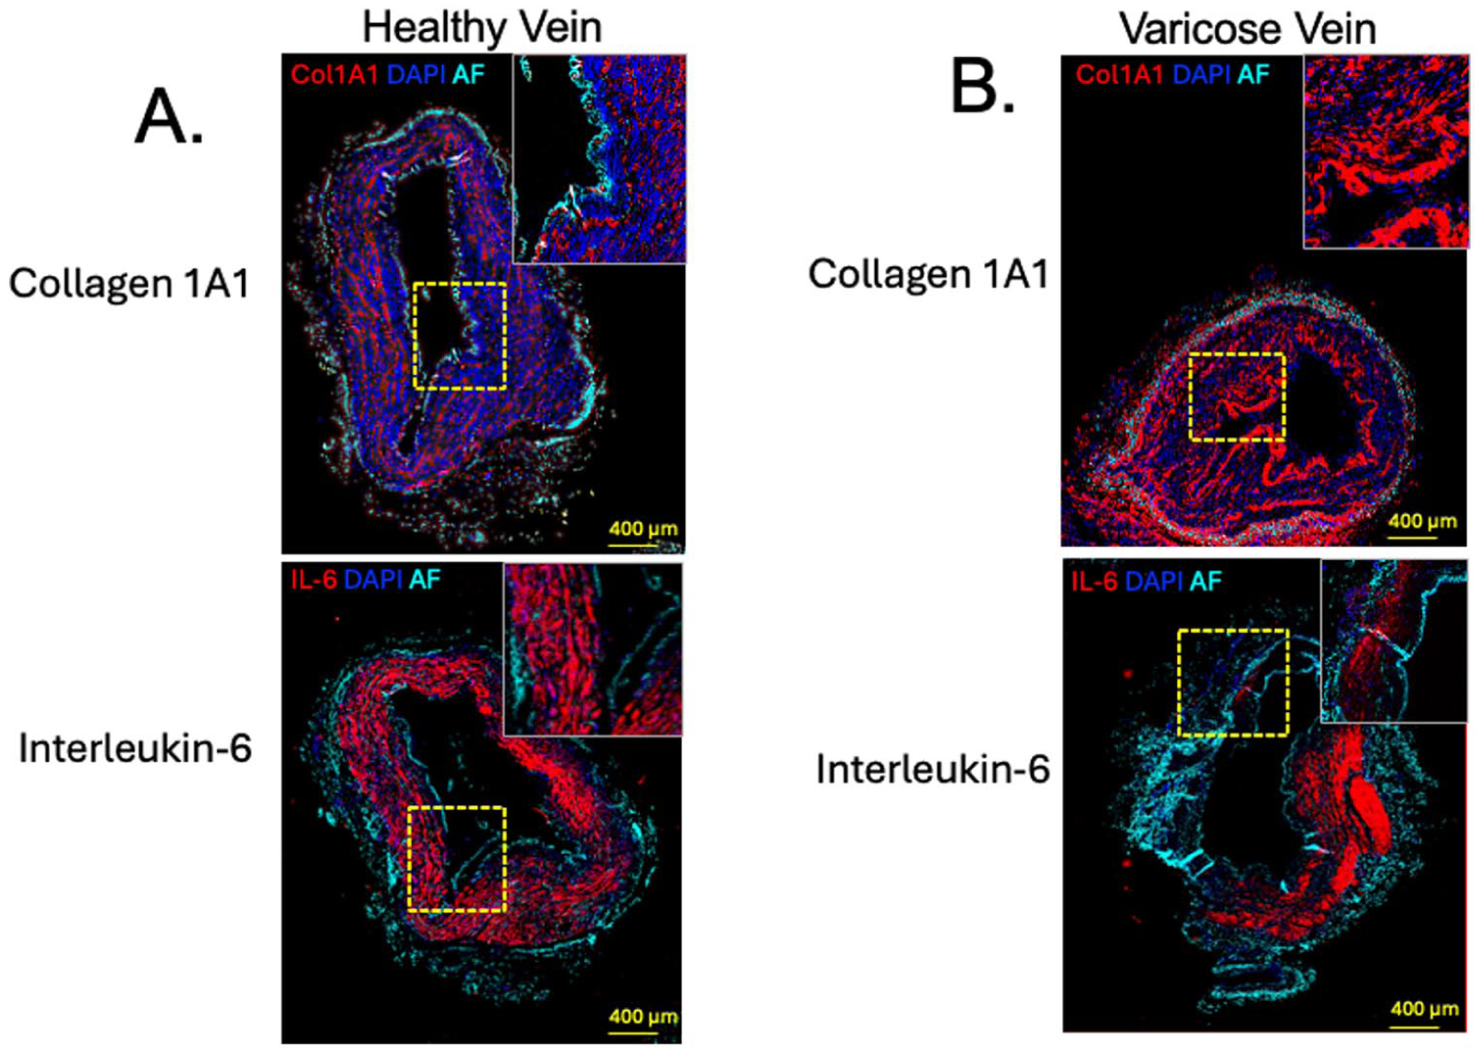
Protein expression of COL1A1 and IL-6 in the great saphenous vein.
Blood biomarkers in varicose veins
We next sought to determine whether the difference in levels of COL1A1 and IL-6 in the wall of the healthy GSV and the incompetent GSV was mirrored in the blood concentrations of COL1A1 and IL-6 using a larger nonselective validation cohort of patients in general clinical care (Table 2). Interestingly, there was significantly less circulating COL1A1 in patients with varicose veins compared with healthy patients (66,355 vs 82,661 pg/mL, p = 0.0497) and a higher concentration of IL-6 (4.8 vs 1.3 pg/mL, p = 0.0085) (Figure 4). Plasma COL1A1 concentration distinguished healthy individuals from patients with varicose veins with an AUC of 0.65 (95% CI: 0.51 to 0.00, p = 0.04). Plasma IL-6 concentration distinguished healthy individuals from patients with varicose veins with an AUC of 0.70 (95% CI: 0.57 to 0.80, p = 0.009). These data show a surprising but consistent inverse relationship between the COL1A1 and IL-6 proteins in the blood vessel wall relative to the systemic circulation.
Clinical features of patients with venous insufficiency for blood biomarker analysis.
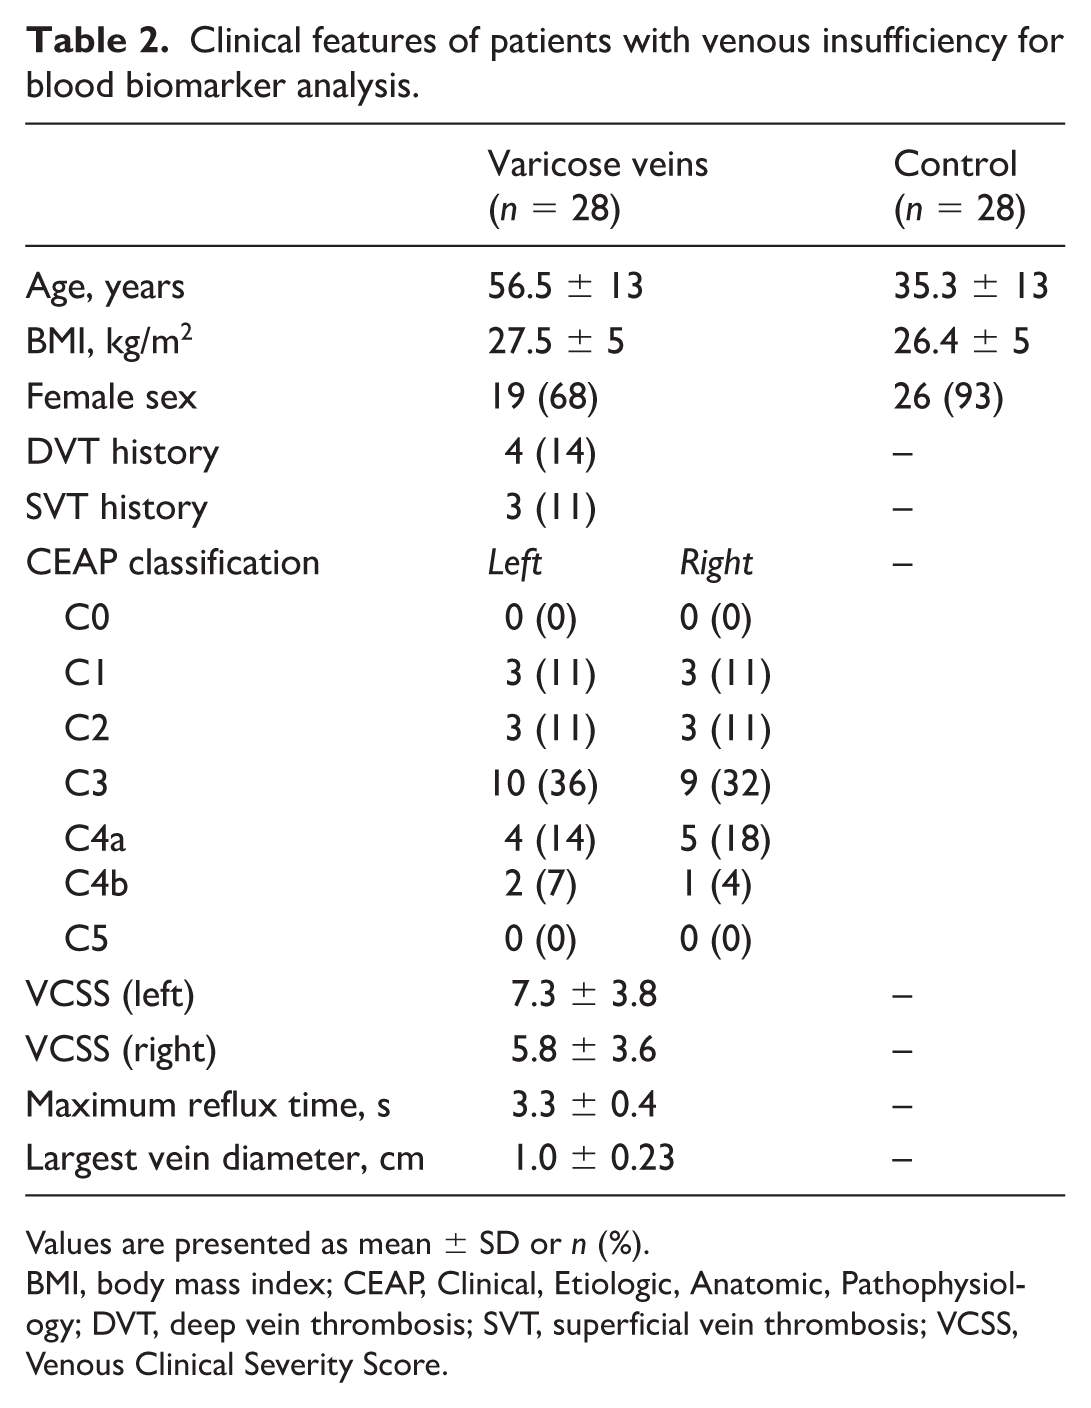
Values are presented as mean ± SD or n (%).
BMI, body mass index; CEAP, Clinical, Etiologic, Anatomic, Pathophysiology; DVT, deep vein thrombosis; SVT, superficial vein thrombosis; VCSS, Venous Clinical Severity Score.
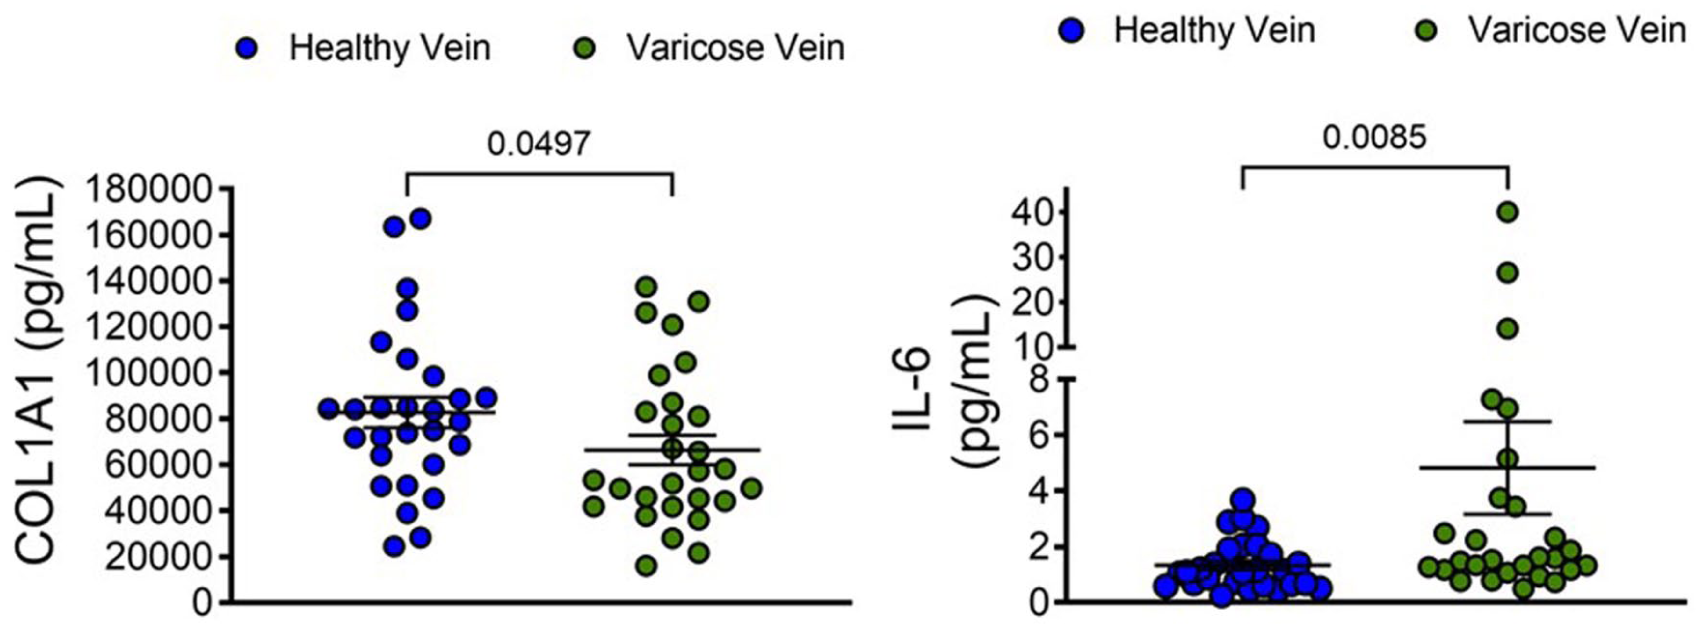
Validation of biomarkers in the blood of patients with varicose veins. Blood samples from 28 controls and 28 patients with varicose veins were evaluated by ELISA for interleukin-6 (IL-6) and for fragments of collagen-1 (COL1A1).
To provide pathophysiological context for circulating blood biomarker concentrations in relation to their presence within the vessel wall of patients with varicose veins, we examined associations between the Venous Clinical Severity Score (VCSS) and blood levels of COL1A1 and IL-6. A mild positive correlation was observed between the VCSS and circulating COL1A1 (r = 0.36, 95% CI: –0.07 to 0.68, p = 0.049), whereas no correlation was detected with the IL-6 (Figure S2). Furthermore, neither COL1A1 nor IL-6 concentrations were associated with reflux times in insufficient GSVs or with superficial vein diameter (Figures S2–S4). Most notably, no correlation was observed between venous reflux times and the VCSS (r = −0.14, 95% CI: −0.58 to 0.36, p = 0.28).
Discussion
In this study, we performed transcriptomic profiling of the GSV wall in patients with varicose veins and validated key findings using protein staining. We also measured circulating levels of these biomarkers in plasma samples from an independent cohort of patients with varicose veins and healthy control subjects. By combining RNA sequencing, immunostaining and plasma analyses, we describe a complex relationship between local tissue remodeling as a pathological consequence of varicose veins and systemic biomarker concentration. In clinical practice, the decision to intervene on patients with chronic venous insufficiency and venous reflux is largely determined by patient symptoms in conjunction with ultrasound-derived cut-points to determine the degree of superficial vein reflux.
Transcriptomic analysis, not unexpectedly, revealed upregulation of genes associated with extracellular matrix deposition (COL1A1, COL3A1), angiogenesis (THBS1, THBS2), and fibrotic signaling (TGFBR1, NOTCH1, and CTNNB1). The upregulation of COL1A1 and THBS1 protein was described in a previous study utilizing mass spectrometry to identify proteins that may be signatures of superficial venous disease, and COL1A1 synthesis was increased in cultured endothelial cells from patients with varicose veins compared to controls—a pattern consistent with our observation following staining of varicose veins in situ.12,17 This pattern corresponds with an established paradigm of structural remodeling and changes in collagen concentration.13,18 Moreover, upregulation of TGFBR1, NOTCH1, and CTNNB1 suggests involvement of the profibrotic signaling pathways, TGFβ, Notch, and Wnt/β-catenin, which have also been implicated in vascular remodeling and endothelial-to-mesenchymal transition in varicose veins.19,20 Angiogenic and endothelial signaling, as demonstrated by genes such as MET, FGF2, PECAM1, and SDC3, 21 and stress and apoptotic pathways, demonstrated by RIPK3 and MAPK8, are also dysregulated. 22
On the other hand, downregulated genes included those with roles in immunomodulation and inflammation such as IL-6, CXCL2, CCL2, CD163, and CD69. The suppression of these cytokines and chemokine pathways suggests a maladaptive inflammatory response in chronically diseased venous tissue. Downregulation of GPX3, a key antioxidant enzyme, suggests reduced antioxidant capacity, which could further contribute to tissue damage.
Immunofluorescent staining confirmed major transcriptional findings in the GSV from relatively healthy patients compared with patients with symptomatic varicose veins. COL1A1 protein was enriched particularly in the endothelium, supporting the idea of structural remodeling of the intima in varicose veins. The IL‑6 protein concentration is elevated in the systemic circulation of patients with varicose veins, a pattern that likely reflects a more chronic inflammatory state. In contrast, IL‑6 expression within the varicose vein wall was reduced overall but remained detectable in regions where the structural integrity of the vessel wall was preserved. This finding is consistent with the biology of IL‑6, which—unlike COL1A1—is not highly expressed by healthy venous tissue. Rather, IL‑6 is predominantly secreted by circulating leukocytes, which may be less likely to adhere to a chronically remodeled vein wall that has lost normal physiological function. This heterogeneity across different regions of the vein likely reflects infiltration by leukocytes involved in venous remodeling, rather than changes in local COL1A1 production by fibroblasts and smooth muscle cells, these cell populations are predominantly present in a healthy tunica media.23,24
Interestingly, serum biomarker levels displayed inverse trends compared with the vessel wall, with lower COL1A1 and higher IL-6 in the circulation of patients with varicose veins. A possible explanation is that improved sequestration and crosslinking of collagen reduced its release into the circulation in heavily remodeled varicose veins.
Increased circulating COL1A1 has been associated with a poorer prognosis in heart failure, 25 with the same study identifying common transcriptomic pathways between heart failure progression and varicose vein formation. Although this may reduce the specificity of COL1A1 as a diagnostic biomarker, it may retain value as a monitoring biomarker for patients with varicose veins in whom decreased release of COL1A1 from the vessel wall is noted in proportion to the degree of venous remodeling. A significant and direct association was observed between circulating COL1A1 concentrations and the VCSS, suggesting that elevated blood COL-1A1 may reflect pathological remodeling of the GSV and progression toward varicose vein disease. This relationship warrants prospective evaluation to determine its potential role as a biomarker of disease severity and progression. As no correlation was observed between venous reflux times and the VCSS, this raises concern regarding the pathological relevance of this commonly used noninvasive measure.
IL-6 is secreted by cells involved in innate immunity, but also directly by smooth muscle under certain conditions. 26 A previous study showed that the IL-6 concentration in blood from the antecubital fossa vein was elevated in patients with varicose veins compared with healthy controls, but also in the leg veins of healthy patients compared with their own antecubital fossa. 27 This suggests that the increase in circulating IL-6 may be driven by pressure, which was confirmed in a study of endothelial cells on an elastic membrane subjected to uniaxial stretch. 28 This would support circulating IL-6 as a monitoring biomarker in direct proportion to the degree of pathological remodeling in varicose veins and therefore may be useful to monitor following conservative and invasive therapies to treat CVI.
Overall, our results validate previous findings of a coordinated program of ECM remodeling and profibrotic signaling in varicose veins; however, they present a discordant picture when the vessel wall is compared with circulating protein levels. Previous studies have mainly focused on circulating levels of inflammatory markers and the ECM constituents of vessel walls, but ours is the first, to our knowledge, to examine both the circulation and the vessel walls. These findings may shed light on the mechanisms of venous remodeling that were not previously known because of assumptions regarding levels in vessel walls based on circulating levels and vice versa. This emphasizes the need for caution when extrapolating local tissue pathology from circulating markers.
Future studies should build on these findings by incorporating longitudinal sampling and spatially resolved transcriptomic or proteomic techniques to delineate regional differences within the vessel wall. Additionally, other downregulated genes identified in our study, such as CD163, may hold diagnostic potential; although reduced in vessel tissue, its soluble form has been reported to be elevated in the circulation of patients with idiopathic portal hypertension compared with healthy controls. 29
Limitations of this study include the modest sample size for the transcriptomic and immunofluorescence studies, the use of frozen archival samples, which may compromise RNA integrity, and the use of patients undergoing CAGB for whom vascular disease is known, which may not reflect the general healthy population. Nevertheless, the BMI-matched design in the plasma analyses with healthy patients as controls and the multimodal validation strengthen the robustness of our observations.
Conclusion
In summary, our findings provide insight into the pathophysiology of varicose veins in terms of changes in fibrotic and inflammatory signals, and a discordance between vessel wall and systemic biomarker concentrations. We identified several differentially expressed genes in the wall of varicose veins and selected two of these, COL1A1 and IL‑6, for further evaluation as potential blood‑based biomarkers. These findings have important implications for understanding the pathophysiology of varicose vein disease and for advancing the development of diagnostic or monitoring biomarker assays for affected patients.
Supplemental Material
sj-tiff-1-vmj-10.1177_1358863X261434444 – Supplemental material for Transcriptomic profiling of varicose veins and associated blood biomarkers
Supplemental material, sj-tiff-1-vmj-10.1177_1358863X261434444 for Transcriptomic profiling of varicose veins and associated blood biomarkers by Anu Aggarwal, Muzammil Arif Din Abdul Jabbar, Meghann McCarthy, Sandra Cole, Mariya Ali, Pulkit Chaudhury, Leben Tefera, Alliefair Scalise, Douglas Joseph, George Anton, Doran Mix and Scott J Cameron in Vascular Medicine
Supplemental Material
sj-tiff-2-vmj-10.1177_1358863X261434444 – Supplemental material for Transcriptomic profiling of varicose veins and associated blood biomarkers
Supplemental material, sj-tiff-2-vmj-10.1177_1358863X261434444 for Transcriptomic profiling of varicose veins and associated blood biomarkers by Anu Aggarwal, Muzammil Arif Din Abdul Jabbar, Meghann McCarthy, Sandra Cole, Mariya Ali, Pulkit Chaudhury, Leben Tefera, Alliefair Scalise, Douglas Joseph, George Anton, Doran Mix and Scott J Cameron in Vascular Medicine
Supplemental Material
sj-tiff-3-vmj-10.1177_1358863X261434444 – Supplemental material for Transcriptomic profiling of varicose veins and associated blood biomarkers
Supplemental material, sj-tiff-3-vmj-10.1177_1358863X261434444 for Transcriptomic profiling of varicose veins and associated blood biomarkers by Anu Aggarwal, Muzammil Arif Din Abdul Jabbar, Meghann McCarthy, Sandra Cole, Mariya Ali, Pulkit Chaudhury, Leben Tefera, Alliefair Scalise, Douglas Joseph, George Anton, Doran Mix and Scott J Cameron in Vascular Medicine
Supplemental Material
sj-tiff-4-vmj-10.1177_1358863X261434444 – Supplemental material for Transcriptomic profiling of varicose veins and associated blood biomarkers
Supplemental material, sj-tiff-4-vmj-10.1177_1358863X261434444 for Transcriptomic profiling of varicose veins and associated blood biomarkers by Anu Aggarwal, Muzammil Arif Din Abdul Jabbar, Meghann McCarthy, Sandra Cole, Mariya Ali, Pulkit Chaudhury, Leben Tefera, Alliefair Scalise, Douglas Joseph, George Anton, Doran Mix and Scott J Cameron in Vascular Medicine
Footnotes
Acknowledgements
We are grateful to Dr Peter Knight and Dr. Michael Swartz from the University of Rochester for providing the discarded great saphenous vein samples.
Declaration of conflicting interests
The authors declared no potential conflicts of interest with respect to the research, authorship, and/or publication of this article.
Funding
The authors disclosed funding from the National Heart, Lung, and Blood Institute (K99HL181079 to Dr Aggarwal and HL128856 to Dr Cameron). The views and conclusions contained in this document are those of the authors and should not be interpreted as representing the official policies, either expressed or implied, of the National Institutes of Health.
Supplemental material
Supplemental material for this article is available online.
References
Supplementary Material
Please find the following supplemental material available below.
For Open Access articles published under a Creative Commons License, all supplemental material carries the same license as the article it is associated with.
For non-Open Access articles published, all supplemental material carries a non-exclusive license, and permission requests for re-use of supplemental material or any part of supplemental material shall be sent directly to the copyright owner as specified in the copyright notice associated with the article.