
Abstract
Body dissatisfaction is a relevant aspect in both eating disorders and sexuality. Using Stice’s model, this study aimed to evaluate the relationship between these variables in eating disorder patients compared with healthy controls. Statistically significant correlations between body dissatisfaction and sexuality were found in the whole sample. The clinical group had higher rates of body dissatisfaction and sexual impairment. Within the clinical group, the participants with a greater drive for thinness showed higher sexual dysfunctions. These results suggest that sexuality should be systematically explored in eating disorders. Higher rates of drive for thinness may be associated with greater sexual impairment.
Introduction
There is currently little empirical evidence demonstrating a relationship between eating disorders (EDs) and problems with sexual functioning (Pinheiro et al., 2010). Although there is a growing body of literature that recognizes the importance of body image in sexuality in healthy women (Woertman and van den Brink, 2012), these variables have been vaguely explored within the context of ED. Apart from the context of sexual abuse and history of trauma, sexual functioning is rarely considered as an important component of treatment for ED patients (Carter et al., 2006; Gonçalves et al., 2016).
To date, research in this area has focused on the study of sexuality in women with anorexia nervosa (AN), describing the loss of sexual interest due to the physiological changes caused by hypogonadism, a consequence of pathological thinning that AN patients suffer from (Pinheiro et al., 2010). However, apart from physical deterioration, individuals with a lower body mass index (BMI) also suffer from more severe clinical symptomatology and poorer response to treatment (Wales et al., 2016). The few studies assessing sexuality in women with ED report a higher probability of sexual dysfunction (SD) compared to controls (Beerens et al., 2014; Castellini et al., 2012; Mazzei et al., 2011; Pinheiro et al., 2010).
Therefore, while malnutrition can provoke sexual impairments, other variables may also interfere with the sexuality of ED patients (Pinheiro et al., 2010). Extensive research has shown that higher body image distortion predicts lower sexual satisfaction (SS) levels and the frequency of sexual intercourse in healthy women (Ackard et al., 2000; Calado et al., 2004; Pujols et al., 2010). Body image distortion is strongly associated with eating pathology. It has been described not only in women with ED but also in male samples (Dakanalis et al., 2015), in trans individuals (Witcomb et al., 2015), and in pregnant samples (Shloim et al., 2015). One of the strongest factors in ED is body image distortion, which usually persists for years, even though ED pathology has subsided. As long as sexuality is linked to body image, problems in sexual functioning persist despite the “recovery” of the ED (Morgan et al., 1999).
The cognitive distraction caused by the discomfort of showing one’s body during sexual activity may be a factor behind the increased prevalence of SD in this group (Cash and Smolak, 2011; Mazzei et al., 2011). Some years ago, Masters and Johnson (1970) described the “Spectatoring” phenomenon (live sex as a spectator) when studying sexual intercourse in healthy couples. This can in fact increase their body dissatisfaction (BD), body distortion, depression, and discomfort with physical contact, all of which may be associated with the loss of libido and elevated sexual anxiety (Pinheiro et al., 2010).
More recently, contradictory conclusions about the impact of these variables on sexuality have been found in the literature: BD and ED symptoms present different associations between sexuality, depending on the ED diagnosis. Castellini et al. (2012) reported that subjects with AN restrictive type (AN-R) showed the strongest association between figure concern and SD, while in bulimia nervosa (BN) and AN binge-eating/purging type (AN-B/P), there was a significant negative association between ED severity and the Female Sexual Function Index (FSFI; Rosen et al., 2000).
Several of the studies exploring sexuality in ED, suffer from methodological pitfalls, such as the non-inclusion of a control group. Previous studies in the field have failed to consider possible mediating variables, which are common in ED and might interfere with sexuality, skewing the results. Low BMI (Pinheiro et al., 2010;), presence of amenorrhea (Pinheiro et al., 2010), history of sexual abuse (Carter et al., 2006; Leonard and Follette, 2002; Vaz-Leal et al., 2005), psychiatric comorbidities, such as depression (Lin et al., 2012), personality borderline disorder (Allilaire, 2012), or taking antidepressant drugs (Zemishlany and Weizman, 2008), could have an impact on sexuality. However, much of the research up to now has not controlled for these factors, hence this fact could have bias results.
Considering previous literature, we decided to use Stice’s model in this research (Stice, 2001). Stice’s model provides several diagnostic groups based on BD and eating psychopathology levels. The model, focusing on drive for thinness (DT) and depression, has established another method of categorizing ED so that most diagnoses are distributed similarly in all subtypes. Four groups were derived by combining the different gradients of the two dimensions: DT-depressive, moderate DT (absent depression), moderate depressive-DT, and pure DT (absence of depression). Among the results that concern us in reference to this study, it was reported that the moderate DT subtype showed a lower rate of psychopathology and lower scores on eating pathology. Contrarily, the pure DT group showed higher BD and higher psychopathology. This innovative model of classification of ED has been supported by the scientific community (Peñas-Lledo et al., 2009; Van Strien et al., 2005). Classifying ED with this method has shown clinical utility in predicting the disorder severity, comorbidity with other disorders, progress, and outcome (Peñas-Lledo et al., 2009, 2013).
Much uncertainty still exists about the relationship between ED, BD, and sexuality. This study therefore set out to assess the effect of BD, eating pathology, and sexuality in ED, while controlling for possible external variables. Moreover, as a pilot study, we used an alternative classification system to assess its validity and usefulness in this line of research.
The specific aims of this study were (1) to describe the interplay between BD, SD, SS, and ED severity; (2) to compare ED patients with healthy controls with regards to BD, SD, and SS; and (3) to compare pure DT and moderate DT groups in terms of BD, ED severity, SD, and SS. Our results could shed light on whether sexuality should be systematically assessed and treated in ED patients and guide the development of clinical intervention protocols in ED.
Methods
Participants
The clinical sample was recruited from three private institutions dedicated to ED assessment and intervention, between October 2013 and May 2014. Patients were assessed by expert and experienced clinical psychologists and psychiatrists in the field of ED and diagnosed according to Diagnostic and Statistical Manual of Mental Disorders (4th ed.; DSM-IV; American Psychiatric Association, 2000) criteria. The same protocol was carried out in each institution and the exhaustive inclusion and exclusion criteria led to a homogenization of the sample; for this reason, the results could be treated as a single clinical group. The initial clinical sample included 27 women diagnosed with ED (clinical diagnosis based on Diagnostic and Statistical Manual of Mental Disorders (4th ed., text rev.; DSM-IV-TR) diagnosis criteria established and the specific psychometric tests: Eating Attitudes Test (EAT-40), Bulimic Investigatory Test Edinburgh (BITE), and Eating Disorders Inventory-2 (EDI-2)).
The control group was recruited in the same time period through ads placed in several establishments in the province of Barcelona (Spain) and through social networks. Six individuals were excluded from the control group due to meeting some of the exclusion criteria. The final control sample consisted on 24 participants and the same inclusion and exclusion criteria as the clinical group were established, adding the criteria of not presenting an ED (evaluated through EAT-40 and BITE). The ethics committee of our institution approved this study and informed consent was obtained from all participants.
Taking previous literature into account, some data were controlled to avoid biases. Criteria for selecting the subjects were as follows: female sex, age between 18 and 28 years, a BMI between 18 and 25, having normal menstrual cycles (absence of amenorrhea), and meeting ED diagnosis criteria (for the clinical group).
Exclusion criteria were as follows: to be a victim of sexual abuse, have a personality disorder diagnosis (Personality Disorder Questionnaire-4 (PDQ-4), specific cut-off point for each disorder), severe depressive symptoms (greater than 2 in depression subscale scores on Symptom Checklist revised (SCL-90-R)) or taking antidepressant medication, surgical intervention, or previous condition that prevents sexual intercourse and/or being in gestation.
Measures
SCL-90-R
This questionnaire is widely used for the measurement of self-reported overall psychological distress and psychopathology (Derogatis, 1994). It comprises 90 items, each rated on a 5-point scale of distress. Psychometric evaluations have reported good internal consistency (alpha coefficients .77–.90). The Spanish version has shown good psychometric properties (De las Cuevas et al., 1991). Additionally, the scores on the depression subscale were used to classify the sample through Stice’s model (Peñas-Lledo et al., 2009).
PDQ-4
This self-administered questionnaire, adapted, and validated in Spanish, (Calvo et al., 2012) allowing for screening Axis II personality disorders (Hyler, 1990). Mean α of the instrument is .61, ranging from .41 to .73.
EDI-2
This is a 91-item multidimensional self-report questionnaire that assesses characteristics related to ED and shows a good internal consistency (alpha coefficients above .70 in the majority of dimensions and in total score) (Garner, 1991). The Spanish version has shown good psychometric properties (Garner, 1998). DT allows for the classification of the sample based on Stice’s model (Peñas-Lledo et al., 2009). The DT subscale specifically examines preoccupation about weight and is useful for differentiating clinical and non-clinical groups. A cut-off score of 14 in this subscale detects individuals at risk of an ED (Garner, 1991).
EAT-40
This questionnaire contains 40 items and is widely used to assess symptoms and common behavior within EDs (Garner and Garfinkel, 1997). It also provides a global index of the severity of the disorder. The Spanish version of this questionnaire has shown good psychometric properties, as well as high levels of sensitivity: 88.2 % specificity: 62.1 % positive predictive value: 17.7 percent, and negative predictive value: 62.1 percent with a cut-off point of 21. (Peláez-Fernández et al., 2014).
BITE
This questionnaire contains 33 items that measure the presence and severity of bulimic symptoms. The Spanish translation of this questionnaire has shown good psychometric properties, with reliability between items of .96 in the symptoms scale and .62 in the severity scale (Rivas et al., 2004).
Female sexual function
An instrument, developed with a Spanish sample, which facilitates the diagnosis of female SD by showing the grade of deterioration in the areas of desire, arousal, lubrication, penetration, and orgasm (Sánchez et al., 2004). The alpha coefficient of .89 shows good internal consistency (Sánchez et al., 2004).
Psychosexual history and other sociodemographic and clinical variables were assessed through a semi-structured questionnaire.
Statistical analysis
Analyses were carried out with SPSS 21.0.0 for Windows. Continuous variables were described using mean and standard deviation, while categorical variables were expressed with frequencies and percentages; except the SD variable that despite being ordinal was transformed into a numerical calculation from the average scores of each SD.
To analyze the correlations between the variables under study, Pearson correlation coefficient was used (for continuous variables) and Spearman’s rho (for continuous and ordinal variables). For comparison between groups, t-tests were used for independent measures (for continuous variables with normal distribution), the statistical Mann–Whitney U test (non-parametric test for continuous variables when the normality assumption is not met) and Chi-square test for ordinal variables. To test the assumption of normality and the distribution of the variables Kolmogorov–Smirnov test and Levene’s test were used, respectively.
Results
Three participants were excluded from the initial sample due to meeting some of the exclusion criteria. The final clinical sample consisted of 24 individuals. In total, the study sample comprised 48 female participants, aged between 18 and 27 years (M = 21.85, SD = 2.04), none were married, nor had children. Regarding employment status, 33 were students (68.8%) and 15 were working (health field: 16.7%, education: 6.3%, communication: 4.2%, administration and management: 2.1%, and services area: 2.1%). Assessed by SCL-90-R, 10.4 percent of the sample reported a psychopathological history of anxiety and depression. Although the total sample had a menstruation cycle without relevant abnormalities, 43.8 percent reported delays in some occasions and 4.2 percent had a diagnosis of polycystic ovarian syndrome. In total, 28 participants maintained a stable relationship (58.3%), 4 had regular sexual intercourse with the same mate (8.3%), 3 had a sporadic sexual partner (6.3%), and 13 did not have any kind of intimate relationship (27.1%). They had a mean BMI = 21.18 (SD = 2.1). In the clinical group, 4 participants were diagnosed with AN (16.6%), 7 with BN (29.2%), and 13 with eating disorder not otherwise specified (EDNOS) (54.2%) following DSM-IV-TR criteria.
The results shown are based on the correlations between variables. They are followed by the results of the comparisons between groups. Finally, the results of differences between groups in the clinical sample following Stice’s classification (pure DT = 13/moderate DT = 11) are also reported.
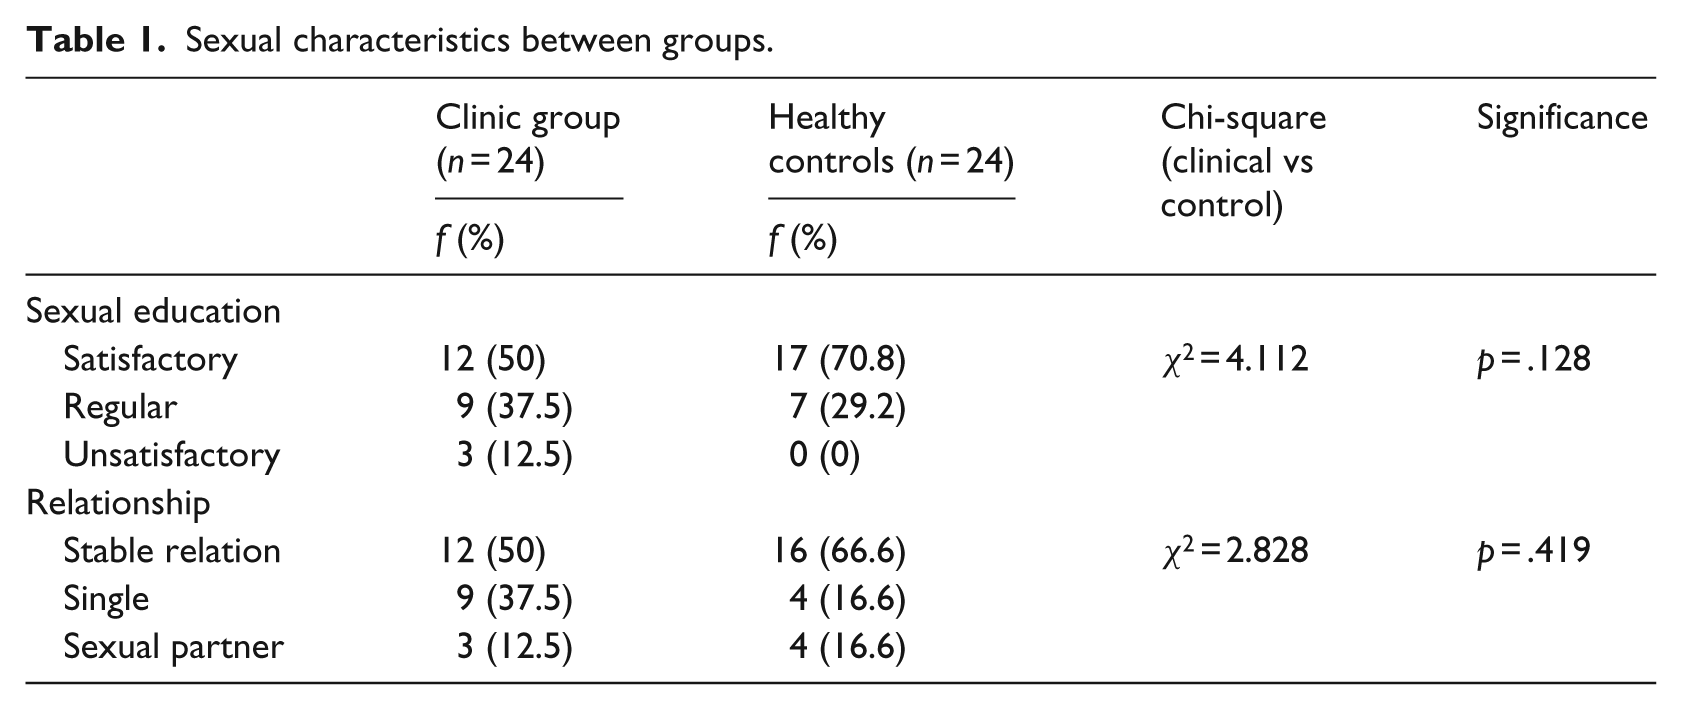
Prior to hypothesis testing, it was verified that both groups (clinical and control) were comparable in terms of sex awareness and relationship type (Table 1). It was found, as expected, that both sex awareness (χ2 = 4.112, p > .05) and partner (χ2 = 2.828, p > .05) were independent variables of the condition (clinical/control), and therefore there were no differences between groups.
Sexual characteristics between groups.
Studying the relationships between variables in the whole sample
Analyzing the associations between BD and SD
Table 2 shows the results of Pearson’s correlation coefficients between BD and SD. A positive correlation was found between BD and SD, statistically significant at .05 (alpha level).
Body dissatisfaction/eating disorder symptoms and sexual dysfunction.
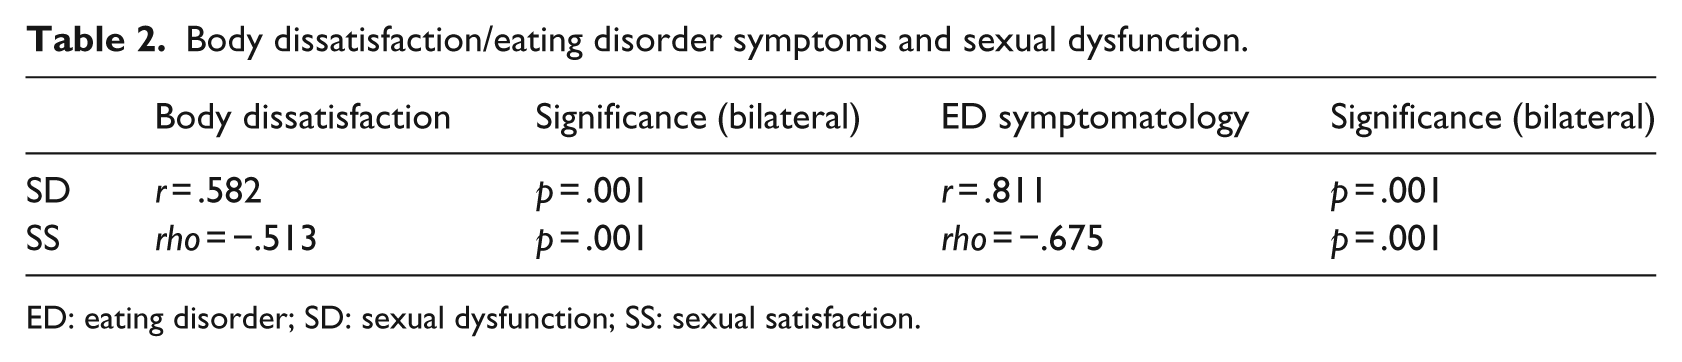
ED: eating disorder; SD: sexual dysfunction; SS: sexual satisfaction.
Analyzing the relationship between BD and SS
Due to the feature of SS, as an ordinal variable, Spearman’s rank correlation coefficient was used. A negative, statistically significant moderate correlation was found between BD and SS (Table 2).
Analyzing the relationship between ED symptoms and SD
As shown in Table 2, there was a statistically significant positive correlation among the variables.
Analyzing the relationship between ED symptoms and SS
Spearman’s rank correlation coefficient showed a medium to high negative correlation between symptomatology and SS that was statistically significant (Table 2).
Comparison between clinical and control groups
Studying the differences in BD according to condition (clinical/control)
The first set of analyses examined the distribution of BD: a normal distribution was found (Kolmogorov–Smirnov Z = 945, p = .334). Therefore, t-tests were carried out, with the condition variable (clinical/control) as the group variable and BD as the dependent variable. The assumption of homogeneity of variance between groups (Levene’s F = 678, p > .05) was also fulfilled. The mean difference between the groups was statistically significant (t = 5.52, p = .001); the clinical group had a higher degree of BD (M = 15.56, SD = 6.9) compared to the control group (M = 5.17, SD = 5.96).
Studying the differences in SD depending on the condition (clinical/control)
The assumption of normality could not be assumed in SD variable (Kolmogorov–Smirnov Z = 1.789, p = .03), therefore, a non-parametric Mann–Whitney U test was performed. The difference between the ranks of the groups was statistically significant (U = 51, p = .001). The clinical group (ED) showed higher levels of SD (M = 0.66, SD = 0.47) than the control group (M = 0.06, SD = 0.097).
Analyzing the differences in SS depending on the condition (clinical/control)
The assumption of normality of the SS variable could not be assumed (Kolmogorov–Smirnov Z = 2.752, p = .001); hence, the non-parametric Mann–Whitney U test was performed. The difference between the ranks of the groups was statistically significant (U = 103.5, p = .001), with the clinical group presenting lower levels of SS (Table 3).
SS frequencies (clinical/control).
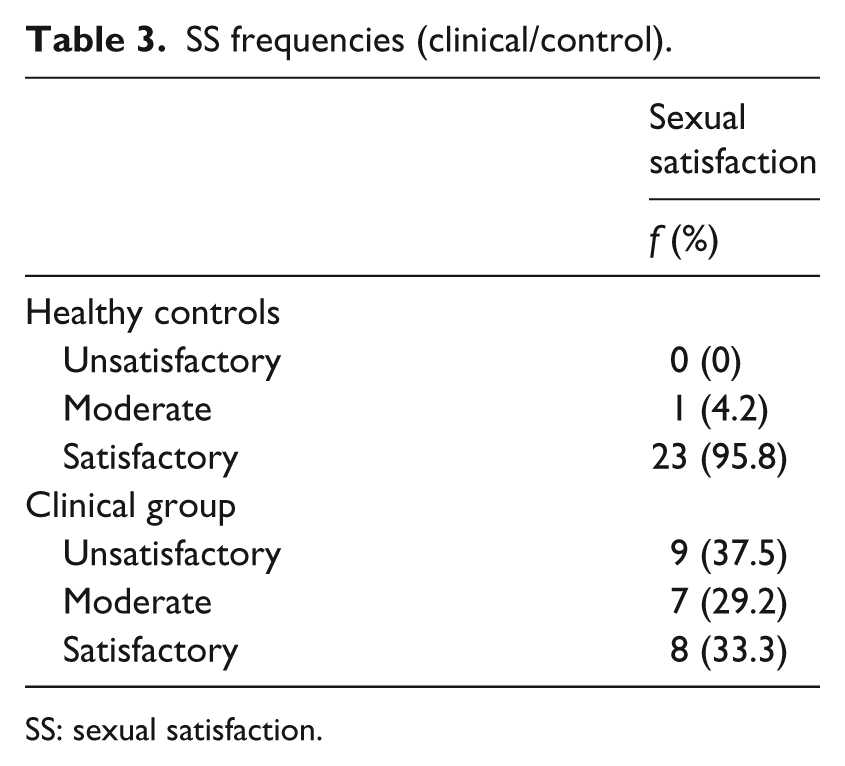
SS: sexual satisfaction.
Comparisons between the subgroups within the clinical group (pure DT/moderate DT)
Studying the differences in BD and ED symptoms depending on the condition (pure DT/moderate DT)
The assumption of normality of the BD variable within the clinical sample could not be assumed (Kolmogorov–Smirnov Z = 1.656, p = .008), thus, a non-parametric Mann–Whitney U test was performed. Mann–Whitney U = 33.5 (p = .001) showed that the difference between the ranks of the groups was statistically significant; the pure DT group showed greater BD (M = 19.5, SD = 4.2) compared to the moderate DT group (M = 6.9, SD = 6.5).
ED severity, measured by standardized EAT-40 questionnaire, was found not to follow a normal distribution (Kolmogorov–Smirnov Z = 1.553, p = .016). Using the Mann–Whitney U test, the difference between the groups was statistically significant (U = 15.5, p = .001). The pure DT group had a higher degree of ED symptomatology (M = 64.1, SD = 25.6) compared to the moderate DT group (M = 31.1, SD = 13.9).
Analyzing the differences in SD according to condition (pure DT/moderate DT)
Mann–Whitney U = 59 (p = .001) showed that the difference between groups was statistically significant. The pure DT group presented more prevalence of SD (M = 0.88, SD = 0.4) compared to the moderate DT group (M = 0.42, SD = 0.4).
Analyzing the differences in SS depending on the condition (pure DT/moderate DT)
No significant differences in SS were found between groups (U = 68, p = .83).
Discussion
This study further supports the association between BD and sexuality in both healthy women and women with ED. Moreover, a strong association was found between ED symptomatology and female sexuality (SD and SS). Studying the whole sample, BD was positively associated with SD and negatively with SS. Therefore, higher BD is linked to a higher rate of SD and lower SS.
As mentioned above, the significant role of BD in sexuality is extensively described in healthy women samples (Ackard et al., 2000; Lykins et al., 2006; Paredes and Pinto, 2009; Pujols et al., 2010). The results of this study further support the idea of BD influencing SD and SS in both ED patients and healthy women. This observation upholds the hypothesis that cognitive distraction because of body appearance and discomfort generated by showing one’s body during sex negatively affects female sexuality (Cash and Smolak, 2011; Mazzei et al., 2011).
Greater levels of ED symptomatology were found to be associated with a higher prevalence of SD and lower SS; this finding seems to be consistent with previous research (Pinheiro et al., 2010). The clinical group diagnosed with ED showed increased BD, a higher rate of SD and lower SS, compared with the control group. These results are in line with those of previous studies (Castellini et al., 2012; Dakanalis et al., 2016; Mazzei et al., 2011; Peñas-Lledo et al., 2009; Pinheiro et al., 2010).
Within the clinical group, the pure DT group, based on Stice’s (2001) Model, presents greater BD and ED symptomatology. These results are in agreement with those obtained by Peñas-Lledo et al. (2009). It can thus be suggested that this more aggravated state might be a major factor, if not the only one, leading to a greater prevalence of SD in this group compared with the moderate DT group.
However, contrary to our expectations, no significant differences in SS were found between groups. A possible explanation for this finding may be our small sample size. Differences can therefore be expected in SS between groups in future analyses with a greater sample. Nevertheless, it could be hypothesized that SS in ED patients is lower than in healthy controls, independently of whether they have SD or not. Therefore, inherent ED symptomatology would affect SS more than the SD itself.
Moreover, the results of this study suggest that both BD and ED symptoms are two explanatory variables of sexuality impairment in ED patients. In previous research (Morgan et al., 1999), BD is described as the variable that best explained SD over time. In their study, sexual disturbances continued occurring even having obtained ED remission. However, Castellini et al. (2012) report that depending on the ED diagnosis (restrictive/purgative AN or BN), there are different associations between BD/ED symptoms and sexuality disturbances. This study has found that ED symptomatology shows higher associations with SD and SS in comparison with BD. According to these data, we can conclude that, in the sample studied, levels of ED symptomatology could explain SD and low SS to a greater extent than BD levels. These data must be interpreted with caution; further research through longitudinal studies is needed to corroborate these findings.
This study has several limitations that need to be considered when interpreting its findings. The major limitation of this study is the small sample size, especially when making comparisons within the clinical group. The recruitment of the participants in the clinical sample at different stages of ED treatment is another drawback of this study. Although personality disorder diagnosis was an exclusion criterion, qualitative personality traits were not evaluated, and they could have biased the results. Keeping very strict inclusion and exclusion criteria increased the internal validity (within the parameters that allowed a selective study) and homogenized the groups, but consequently the external validity was decreased. This fact makes the generalizability of these results not applicable to the ED general population; they must be interpreted according to the sample and their characteristics. In future research, the sample size needs to be increased in order to report more generalizable results. Personality traits may also be explored to describe the characteristics among groups more accurately and their interaction with sexuality. More data and longitudinal studies are required to make general recommendation in clinical interventions.
This research extends our knowledge of sexuality among ED patients. In addition, it is the first study to use Stice’s classification system to assess sexuality in this area. This work contributes to existing evidence on the usefulness of Stice’s model in both clinical and research areas. Patients in the pure DT group, who present a higher rate of ED symptomatology and higher BD, have a greater risk of alterations in their sexual life. Therefore, these results may show clinical utility in the early detection of SD and/or sexual dissatisfaction in women with ED and/or body image disorder. Moreover, they also emphasize the need to assess these variables (BD and ED symptomatology) in patients with SD.
Finally, since BD and ED symptomatology have been described as possible explanatory variables of SD and SS, an intervention based on these variables (regular intervention in patients with ED under cognitive behavioral therapy) may report an improvement in sexuality. However, previous literature has reported higher rates of difficulties in sexuality after the remission of ED (Morgan et al., 1999). All in all, these findings suggest that a specific sexuality-based intervention should be included in the protocols of ED treatment, though an intervention focused only on ED-specific components (including BD and ED symptomatology) may be insufficient to generate a sustained improvement in sexuality of these patients over time.
Footnotes
Declaration of Conflicting Interests
The author(s) declared no potential conflicts of interest with respect to the research, authorship, and/or publication of this article.
Funding
The author(s) received no financial support for the research, authorship, and/or publication of this article.