
Abstract
Food recommendations increasingly focus on sustainability in addition to nutritional value. By providing participants with standard versus sustainable (plant-based) dietary recommendations for 3 weeks, the present research tested the impact of recommendations on dietary compliance. Furthermore, predictors of food intake were tested across food categories. Participants in the sustainable diet condition complied less with recommendations as compared to those in the standard diet condition and were less motivated to continue complying after the intervention. Taste was the main predictor of intake across food categories. Together, this stresses the importance of considering factors stimulating consumers’ compliance when formulating food recommendations.
Food consumption lays a heavy burden on the earth. By 2050, the human population is expected to rise to 9 billion which all need to be fed, calling for a shift for a more sustainable planet (Food and Agriculture Organization of the United Nations (FAO), 2009). Consumers are thought to play a pivotal role in this by purchasing and consuming more sustainable food products (Asscheman-Witzel, 2015; Grunert et al., 2014). However, although many campaigns and product labels arise to increase consumer awareness and motivation to consume more sustainably, sustainability is competing with other food intake motives, such as health or tastiness (Steptoe et al., 1995; Verain et al., 2016). To turn the tide, sustainable consumption has become an important policy objective on national and global levels (Auestad and Fulgoni, 2015).
One approach that multiple countries are currently starting to explore is to base official dietary guidelines or food recommendations not only on nutritional value but also taking the sustainability of diets into account (Verain et al., 2016). For example, it is increasingly argued that food recommendations should reduce the amount of animal-based and increase plant-based food items (Sonigo et al., 2012). There is considerable debate, however, regarding what sustainable diets may look like in practice (Auestad and Fulgoni, 2015)
Apart from nutritional and sustainability considerations, consumer behavior should also get a pivotal role when discussing guidelines for food recommendations. Establishing excellent knowledge about food sustainability should provide the basis for sustainable new diets. However, if consumers are inflexible and stick to their eating habits, these new insights do not translate into behavior change among consumers. This is well illustrated in the domain of healthy food intake. Most people across all age groups do not meet the recommended vegetable and fruit intake levels (Rossum et al., 2011). In other words, compliance with recommendations is often problematic.
Adapting dietary recommendations to a more sustainable diet may entail quite strong deviations between those recommendations and consumer’s food consumption habits. This leaves us with the question how this affects compliance and consumers’ motivation to try to meet recommendations. Recent consumer research on sustainable eating leaves this question largely unanswered since it mostly focuses on consumer attitudes and intentions (see e.g. Verain et al., 2012) rather than actual behavior and compliance. Since national food recommendations are provided in order to direct consumers toward healthier and more sustainable behavior, the question as to how different types of recommendations affect compliance and consumer motivation is crucial. In this article, consumers’ compliance with a diet comparable to current food recommendation (relatively small deviation from current eating behavior) versus a nutritionally equivalent but more sustainable plant-based diet (larger deviation from current behavior) is therefore compared. Furthermore, in addition to literature identifying drivers of more sustainable behavior (e.g. Boer et al., 2016; Verain et al., 2012, 2015) that could provide directions as to how increase compliance with dietary recommendations, we explored how such drivers of eating behavior differ between food categories.
Theoretical and empirical background
Even though many people try to eat healthy or aim to adopt a healthier lifestyle, most people do not meet food recommendations (Rossum et al., 2011). For sustainability, a similar picture arises, and in that, although many people care about the environment and are positive toward sustainable eating, they may not succeed in actually implementing a sustainable eating pattern (Grunert et al., 2014). One approach that received considerable attention in literature and policy making is to increase the sustainability of diets by replacing animal-based nutrients with plant-based nutrients (e.g. reducing meat intake), thus reducing carbon footprint and land use of a diet (Sonigo et al., 2012). Such changes would entail quite strong deviations from current eating habits, which are already not in line with existing recommendations. This may further reduce compliance with such recommendations.
Indeed, although some discrepancies between an individuals’ current behavior and the desired behavior can be motivating to attain (health) goals (Cullen et al., 2001; Locke and Latham, 2002), when the distance between current and desired behavior becomes large, this can reduce effectiveness of achieving (health) goals (Locke and Latham, 2002) and result in disengagement, demotivation, and negative emotions (Baron et al., 2016; Carver and Scheier, 1990). In addition, substantial deviations from current habits are expected to be challenging to consumers, since research showed that eating and drinking habits are difficult to break (Neal et al., 2011; Riet et al., 2011). Thus, although there is no empirical evidence regarding sustainable diets, it is hypothesized that food recommendations that are more sustainable but also strongly deviating from current food intake will result in lower compliance and motivation as compared to a less deviating (but less sustainable) recommendation.
In order to optimize compliance with dietary recommendations, it is important to better understand what drives food intake in the first place. Knowledge in this area would provide insight into what factors to focus on when aiming to increase compliance with, for example, sustainable—more plant-based—diets. Especially regarding healthy eating behavior, many studies aimed to uncover the determinants of eating behavior and diets (for a recent special issue on this topic, see Marks, 2015). Meta-analyses showed four main categories of determinants, namely, physiological needs and sensory preferences, cognitive and affective characteristics, environmental and cultural characteristics, and automatic tendencies such as consumption habits (Kremers et al., 2006; Sleddens et al., 2015). Recent studies confirmed for each of these dimensions that they apply to sustainable food consumption as well.
Regarding sensory preferences, it was shown that the taste of food products has a key role in product choice and intake (Guillaumie et al., 2010; Renner et al., 2012; Verain et al., 2016). This may pose a challenge regarding sustainability, as consumers can expect more sustainable, organic products to taste worse (Lee et al., 2013; Schuldt and Hannaman, 2013).
Peoples’ beliefs, attitudes, intentions, and motivation are key drivers of food intake (Guillaumie et al., 2010; McClain et al., 2009; Shaikh et al., 2008; Sleddens et al., 2015). Regarding sustainable food choices, for example, it was shown that the willingness to reduce meat consumption was related to consumers’ belief that eating less meat was effective for climate change (Boer et al., 2016).
In addition, the place and culture where one was raised may affect social norms related to food and intentions to follow healthier or more sustainable diets (Larsen, 2015), the affordability of food (Sleddens et al., 2015), and the type of food one likes (Sato et al., 2016). For example, people with a higher socioeconomic status (SES) and income level follow healthier diets and spend more on organic products as compared to people with lower incomes or SES (Giskes et al., 2010; Kamphuis et al., 2006; Krystallis et al., 2006).
Finally, consumers’ habits and routines have a major influence on dietary intake, at least as strong as those of peoples’ intentions, attitudes, or social norms (Gardner et al., 2011; Neal et al., 2011; Riet et al., 2011). In the area of sustainable food consumption, for example, the most important barrier to reduce meat intake was consumers’ degree in which eating meat was habitual (Zur and Klöckner, 2014).
Systematic differences between consumer groups (segments) on the aforementioned factors like habits, motives, or attitudes are linked to different sustainable food consumption behaviors (Verain et al., 2015) and are therefore crucial to increase sustainability of consumers’ diets. However, it is currently unknown which of these drivers would be most relevant to target if one would aim to increase the sustainability of a diet. What is more, their impact may differ depending per food category. For example, the influence of the motivation to consume healthy products could be more pronounced for vegetable and fruit intake than for other food categories, since vegetables and fruits are most strongly associated with “health” in the consumers’ mind (Bucher et al., 2015; Chrysochou et al., 2010). Similarly, research showed that consumption habits are stronger for breakfast and lunch than for dinner (Khare and Inman, 2006), which may increase the importance of habits for food categories typically consumed at breakfast and lunch moments (e.g. bread).
Differences between food categories regarding the impact of drivers of eating behavior are relevant in the current context, since increasing the sustainability of a diet affects multiple food categories. In the case of a plant-based diet, for example, consumers’ would need to increase not only vegetable and fruit intake but soy and nuts as well, in order to compensate for the nutrients they would normally get from meat, dairy, and fish (Thompson et al., 2013). If one would aim to increase compliance with more sustainable food recommendations, the approach to get there may then depend on the food category of interest. As a starting point to gain knowledge in this area, this research therefore included a measurement of the relative importance of various drivers of food intake for exploratory reasons.
Methods
Design and hypotheses
Two food recommendations were created with similar nutritional quality, while significantly differing in sustainability. Specifically, a standard food recommendation was compared with a more sustainable—plant-based—diet and participants were asked to comply with recommendations for 3 weeks. The recommendations in the standard diet condition were more in line with the average Dutch diet (see Rossum et al., 2011) than in the sustainable diet condition. Specifically, in both conditions, vegetable and fruit intake recommendations were higher compared to the average Dutch consumption. However, recommendations for soy and nuts were higher in the sustainable, but not standard diet condition compared to average Dutch consumption patterns. In contrast, meat, dairy, and fish consumption recommendations were much lower than average consumers’ intake in the sustainable but not standard diet condition (for an overview and hypotheses per food category, see Table 1).
Recommended intake (portion size/day—e.g. 200 grams/day) and hypotheses of expected differences between conditions.
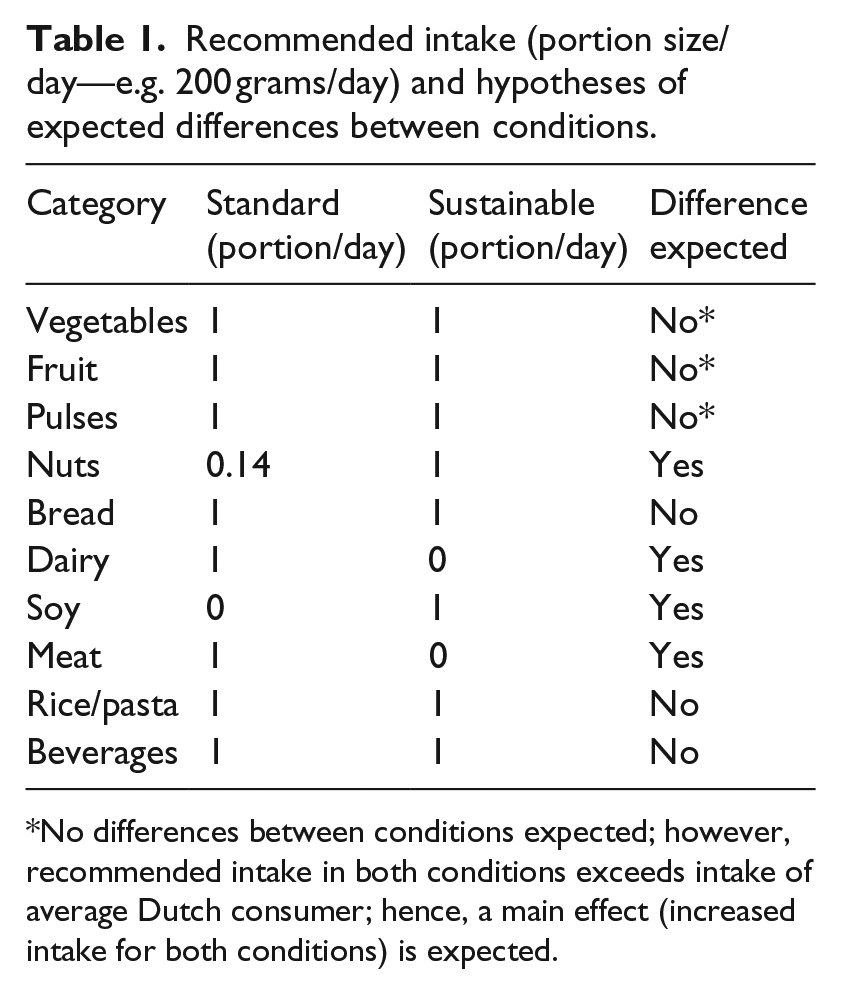
*No differences between conditions expected; however, recommended intake in both conditions exceeds intake of average Dutch consumer; hence, a main effect (increased intake for both conditions) is expected.
Both before and following the intervention, questionnaires were provided to participants. In order to test eating behavior in a natural setting, there were no intermediate—potentially disruptive—measurements. Food recommendations were presented in a format comparable to that used by the Dutch government. The questionnaires measured participants’ self-reported intake per food category and the motivation to comply with the diet, to test the hypothesis that the sustainable diet would be less complied with than the standard diet. In addition, the questionnaires measured factors that were expected to be important drivers of food intake. These were added to test the hypothesis that the importance of the various predictive variables would differ per food category. Specifically, based on earlier research, it was expected that at least for vegetables, the motivation to eat healthy would be more important than for other foods (Bucher et al., 2015), and that habits would be more impactful for bread (typically consumed at breakfast and lunch in The Netherlands) than for other foods (Khare and Inman, 2006).
Participants
Participants (340, 221 females) were randomly assigned to either a standard diet or a sustainable diet condition. 1 Participants were recruited online via research panel of the Dutch market research agency Direct Research, consisting of >70,000 Dutch inhabitants. To allow keeping food recommendations identical, participants were between 25- and 50-years old (M = 38.2; standard deviation (SD) = 7.47). People currently following specific diets could not participate. In the invitation to participate, it was mentioned that participation included trying to change food intake behaviors during a period of 3 weeks. It was made explicitly clear that the study involved food recommendations supporting a healthy and sustainable diet and not to lose weight.
In total, 1970 respondents across The Netherlands were invited, of which 541 were willing to participate. Of those, 413 participants downloaded and read the food recommendation provided to them, and were invited to participate in the follow-up measurement, of which 359 completed. Participants with food allergies (n = 19) were excluded from data analysis, resulting in a total of 340 participants (170 in each condition).
Procedure
Participants received an email containing a link to an online 20-minute questionnaire (T0 measure). Food intake over the last week, consumption habits, motivation, availability, and liking of various food products in the main food categories were measured. Participants who completed this T0 measure were then randomly assigned to either the standard or the sustainable diet condition and received another email containing a link to download their food recommendations. In both conditions, the recommendation was introduced as being a “healthy and sustainable diet that will provide you daily with the nutrients and energy that you need.” They were asked to indicate whether they had read the recommendations. Participants who downloaded and read recommendations were asked 3 weeks later to fill out a 15-minute online questionnaire (T1 measure). Again food intake over the last week was assessed, together with attitude and motivation to continue following the food recommendations, and a social desirability scale was added to control for social desirable responses. Participants were thanked for participating and received tokens from the market research agency, which they could collect to save for gifts.
Food recommendations
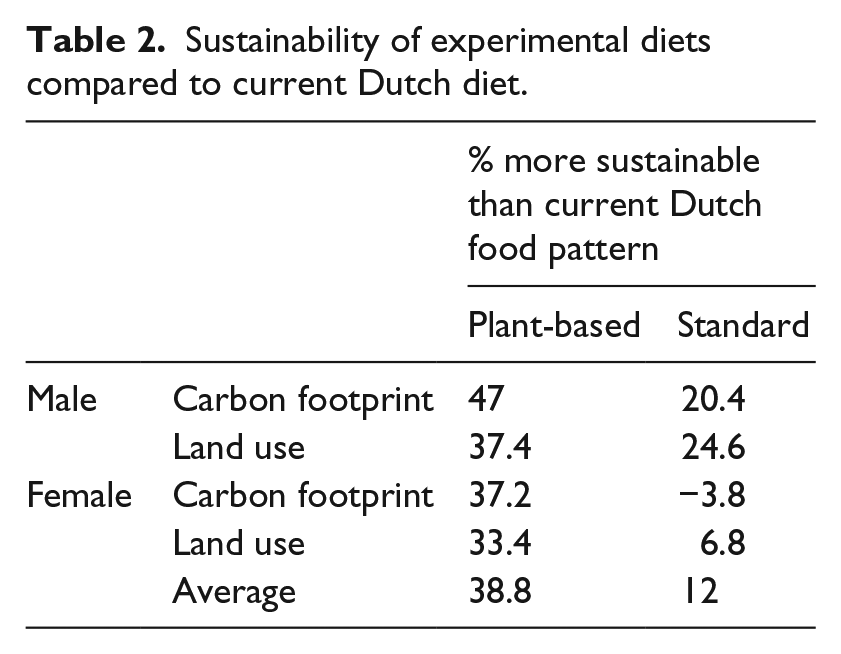
Recommendations were calculated using Optimeal software (see e.g. Kramer et al., 2014) which allows to manually set criteria which diets should meet. For the standard diet condition, no specific criteria were set; while for the sustainable (plant-based) diet condition, it was indicated that meat, dairy, and fish should be excluded. The tool calculates diets with similar nutritional quality and provides carbon footprint and land use as sustainability indicators (since they are currently most often used as indicators), as well as the amount of food items changed compared to the average Dutch diet (Rossum et al., 2011), as an indicator of required deviation from consumers’ current diet. On average, the plant-based diet was 39 percent more sustainable than the average Dutch diet, and the standard recommendations were 12 percent more sustainable (see Table 2). To comply with the sustainable diet while still maintaining nutritional quality, the program required 71 deviations from the average Dutch diet, as compared to 30 in the standard diet.
Sustainability of experimental diets compared to current Dutch diet.
Recommendations were presented to participants in line with what was being used by The Netherlands Nutrition Centre at the time of the study. That is, for the main food categories fruits, vegetables, potatoes/rice/pulses, bread, cheese, milk products, meat/fish/poultry, butter/oil, margarine, and beverages, the daily recommended intake was provided both in grams or milliliters as in a more consumer-friendly indication (e.g. 200 grams fruits → 2 pieces of fruit). Since the plant-based diet resulted in a substantial increase in the recommended intake of nuts and we aimed to keep the recommendations as similar as possible across conditions, it was decided to add this as a separate category in the recommendations.
While for most food categories, recommendations were comparable across diets, for nuts, meat, dairy, fish, and soy there were substantial differences. In the plant-based diet, recommendations for meat/fish/poultry and dairy/cheese were 0 grams per day, versus, respectively, 80 grams and 480 mL in the standard recommendations. Contrary, daily recommendations were higher in the plant-based diet for soy-products and nuts (450 mL and 45 grams daily), as compared to the standard diet (0 mL and 10 grams weekly, respectively).
Measures
Compliance: food consumption and motivation
Consumption
As a rough indication of compliance in food intake, participants were asked at T1 to self-report the total number of weeks they had actually tried to comply with recommendations (0–3).
To measure in more detail the extent in which participants consumed foods in line with their recommendations, they were asked both at T0 and T1 per food category to indicate how many days they consumed foods in that category over the last week (score between 0 and 7 days) and how much of those foods they consumed on average during those days (7-point Likert scale; 1 = less than recommended; 4 = as recommended; 7 = more than recommended (as a reminder, the recommended daily intake was given); for similar measurements, see, for example, Kreausukon et al. (2012) and Martin et al. (1997)). These scores were combined into a single portion per day score ranging from 0 (not consumed) to 1.5 (consumed daily and more than recommended), by multiplying consumption per day (from 0 days per week = 0 to 7 days a week = 1) with portion size (from less than recommended = 0.5 to more than recommended = 1.5; see, for example, Kristal et al. (1994)).
Compliance motivation and feasibility
To assess whether the motivation to eat healthy would differ as a result of the intervention, the motivation to keep complying to the recommendations following the intervention was assessed at T1 using a 3-item motivation questionnaire (motivation to continue; importance to continue; importance for health to continue; on 7-point Likert scales: α = .78). In order to control for potential pre-existing differences in motivation to eat healthy, at T0, a 3-item questionnaire was included (motivation to eat healthy; importance to eat healthy; willingness to put effort into eating healthy; α = .77). Results indicated that there were no such differences (Mstandard = 5.52; SD = 1.01; Msustainable =5.57; SD = .95, ns).
Finally, in order to get an impression of the feasibility of complying to the food recommendations, participants were asked to indicate how feasible they experienced the recommendations to comply with in daily life (using 5-point Likert scales; 1 = not at all; 5 = very much).
Predictors of food consumption
Sensory preferences: liking
As an indication of overall liking of the taste of products for each of the 12 food categories (e.g. vegetables), participants were asked at T0 to indicate their general liking on a 7-point Likert scale (1—not tasty at all; 7—very tasty).
Cognitive and affective factors: motivation and efficacy
The Food Choice Questionnaire developed by Steptoe et al. (1995) was included at T0 in order to test to what extent the importance to eat sustainably (“ethical concern”) and the importance to eat healthy were predictive of food intake. As an indicator of peoples’ feelings of self-efficacy, two questions using a 7-point Likert scale were added at T0 (r = .74), asking to what degree they found it difficult to eat healthy and follow healthy dietary recommendations.
Environmental characteristics: availability and income
As an indication of the perceived physical availability of products in the food categories (e.g. vegetables) in the participants’ environment, they were asked at T0 to indicate perceived availability in a regular supermarket (1—not at all; 7—very). In addition, income level (below modal (N = 72), modal (N = 119), above modal (N = 114)) was measured as another environmental factor shown to affect consumption behavior (Krystallis et al., 2006).
Automatic tendencies: habits
Food habit strength was measured using the 4-item Self-Report Habit Index (SRHI; Gardner et al., 2012), which was provided at T0 for main meal moments (breakfast, lunch, and dinner; for example, “Taking products for breakfast is something I do automatically”), and subsequently averaged into a single habit score (α = .93).
Social desirability
Self-report measures can be prone to social desirable responding with regard to food intake, with participants overreporting the intake of healthy products (e.g. Hebert et al., 1995). In order to control for this potential confound, at T1, a shortened version of the Marlowe–Crowne Social Desirability Scale was included (Ray, 1984; e.g. “Are you quick to admit making a mistake?”). All questions were averaged to obtain a social desirability score (α = .63).
Analyses
To test the hypothesis that compliance and motivation to continue with sustainable food recommendations would be lower as compared to standard recommendations, analyses of covariance (ANCOVAs) were conducted, testing (1) number of weeks one followed the recommendations and (2) motivation to continue the diet, as dependent variables, with experimental condition as independent variable, while controlling for social desirable responding.
Regarding self-reported food intake, compliance with recommendations was calculated prior to further analyses by calculating the difference between self-reported intake per day and the recommended intake per day for both T0 and T1(see Table 1). Complete compliance would then result in a score of 0, while negative scores indicate lower consumption than recommended and positive scores more than recommended (for analyses on food intake across food categories, all negative values were transformed to a positive deviation score, in order to prevent positive and negative deviations to cancel each other out). Subsequently, a repeated measures ANCOVA with experimental condition as independent variable was conducted (controlling again for social desirable responding) to test (1) whether compliance increased between T0 and T1 and (2) to test the hypothesis that participants following a sustainable diet would deviate more from recommendations as compared to participants in the standard recommendations condition. Since the hypothesis differed depending on the food category (see Table 1), this analysis was run for the overall diet, as well as on a food category level.
Finally, to test the hypothesis that the factors driving food intake differ depending on the food category of interest, regression analyses were conducted. This was done per category (e.g. vegetables), where food intake at the post-intervention measurement was predicted by (1) liking, (2) motivation to eat sustainable, (3) motivation to eat healthy pre-intervention, (4) self-efficacy, (5) availability, (6) income, and (7) habit.
Results
Compliance: food consumption and motivation
Consumption
To test the hypothesis that participants would comply more with standard as compared to sustainable food recommendations, it was tested whether the self-reported number of weeks they tried to follow recommendations differed between conditions, while controlling for social desirable responding. Confirming expectations, participants followed the sustainable diet for a shorter period of time (M = 1.92 weeks, SD = 0.83) as compared to those in the standard diet condition (M = 2.19 weeks, SD = 0.75; F(1,337) = 10.68, p < .01, η2 = .03).
When comparing the experimental groups on average self-reported intake across all food categories, while controlling for social desirable responding, a significant interaction effect between time of measurement and condition was found, F(1,337) = 21.52, p < .01, η2 = .06, showing that there was no change in intake in the standard diet condition (Mpre = .32; Mpost = .30), intake did change in the sustainable diet condition (Mpre = .54; Mpost = .47); in that, participants reported to behave more in line with recommendations. Importantly, however, a between-subject main effect for condition was observed, F(1,337) = 330.63, p < .01, η2 = .50, indicating that participants receiving the standard diet (M = .31, SD = 0.10) complied significantly better to recommendations than those receiving a sustainable diet (M = .50, SD = 0.12) at both measurement moments.
Since differences between conditions were hypothesized to depend on specific food categories, the change in intake and level of compliance was subsequently tested on category level (for an overview of degree in which people comply with recommendations at T0 and T1, see Figure 1). For vegetables, fruit, and pulses intake, the expected main effect of increased consumption over time was observed upon first analyses. Importantly, however, after controlling for social desirable responses, all main effects disappeared (Fvegetables(1,337) = 1.72, p = .19; Ffruit(1,337) = 2.07, p = .15; Fpulses(1,337) = .49, p = .49), indicating that consumption did not change as a result of the intervention.
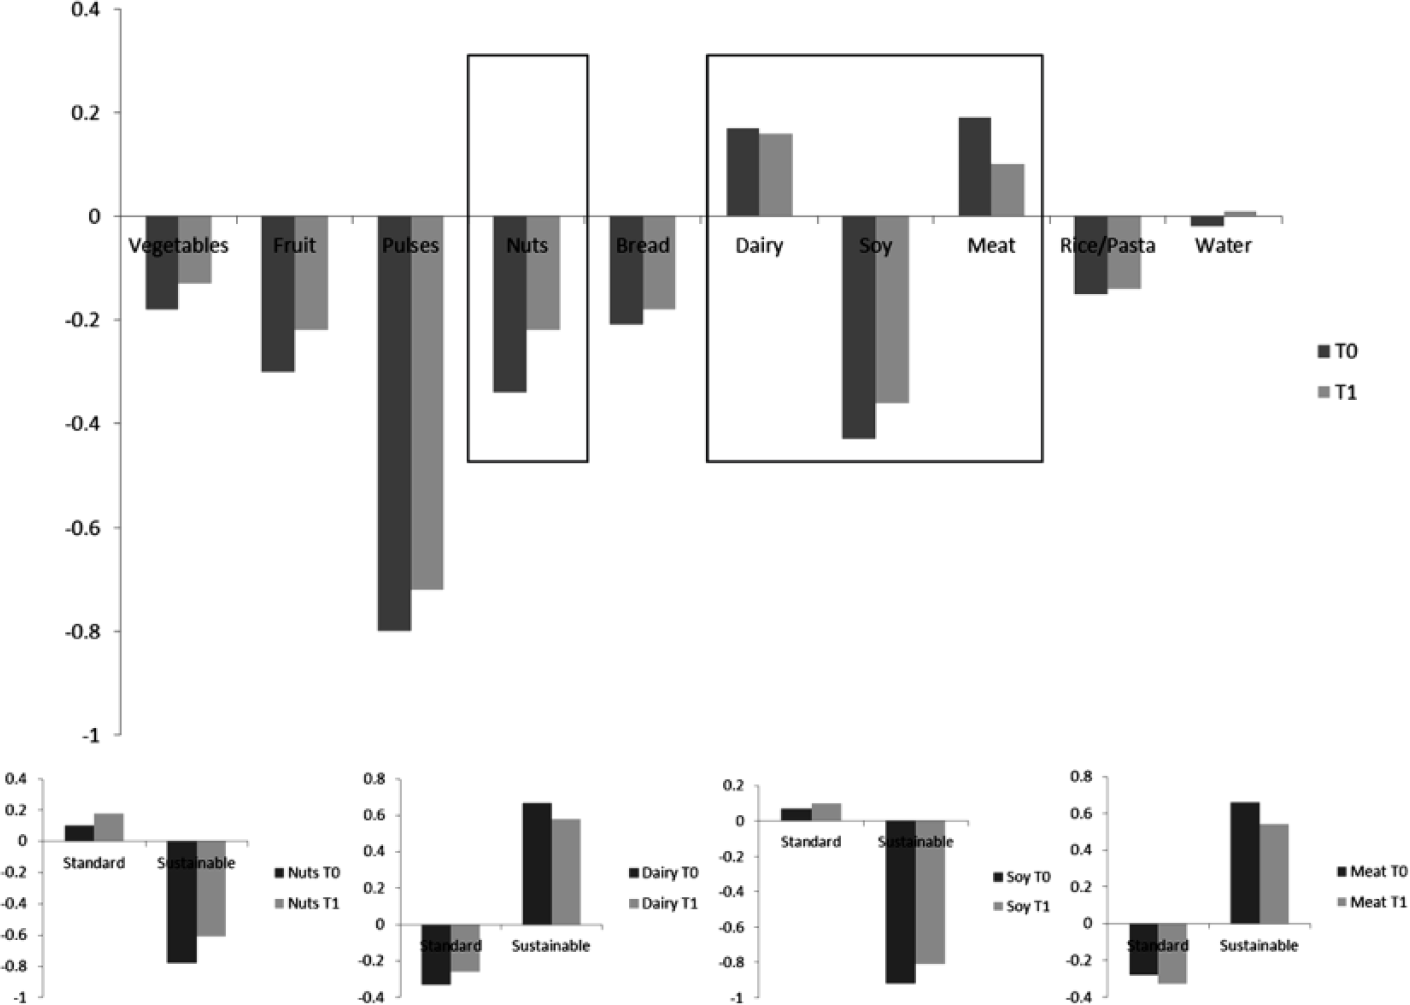
Intake per food category before and after receiving food recommendations.
The hypotheses that compliance regarding nuts, dairy, soy, and meat intake would be higher for participants in the standard as compared to the sustainable diet condition were confirmed. Nuts intake deviated significantly more from recommendations in the sustainable condition (Mpre = −.70; SD = 0.33) than the standard diet condition (Mpre = .14; SD = 0.30; F(1,337) = 781.38, p < .01, η2 = .70). The same was found for dairy (F(1,337) = 588.31, p < .01, η2 = .64), soy (F(1,337) = 2032.49, p < .01, η2 = .86) and meat intake (F(1,337) = 708.23, p < .01, η2 = .68; see Figure 1 for mean scores). Importantly, repeated measure analyses for these four categories all resulted in a significant interaction between experimental condition and time of measurement, also when controlling for social desirable responses. In all cases, while there were no significant changes in reported intake over time within the standard diet condition, participants in the sustainable diet condition behaved more in line with recommendations at the post-measurement as compared to the pre-measurement (mean scores are displayed in Figure 1; Fnuts(1,337) = 6.18, p = .01, η2 = .02; Fdairy(1,337) = 16.26, p < .01, η2 = .05; Fsoy(1,337) = 8.99, p < .01, η2 = .03; Fmeat(1,337) = 5.16, p = .02, η2 = .68).
Compliance motivation and feasibility
It was tested whether the motivation to continue follow recommendations after the intervention would differ between the standard and sustainable diet condition, while controlling for the motivation to eat healthy at T0 and for social desirable responding. The motivation to continue was lower for participants in the sustainable diet (M = 3.40, SD = 1.05) than in the standard diet condition (M = 4.02, SD = 0.90; F(1,336) = 37.34, p < .01, η2 = .10). In addition, when comparing the standard and sustainable diet regarding the self-reported feasibility of participants to comply with recommendations, participants in the standard diet perceive these to be more feasible (M = 3.22, SD = 0.86) as compared to those in the sustainable diet condition (M = 2.63, SD = 1.08; F(1,337) = 33.70, p < .01, η2 = .09.
Predictors of food consumption
To test the hypothesis that the factors that drive food intake may differ depending per food category and explore what drives the intake of categories relevant for sustainable diets, regression analyses were conducted. An overview of regression coefficients and significance levels can be found in Table 3.
Regression coefficients of intake for standard, sustainable, and total groups.
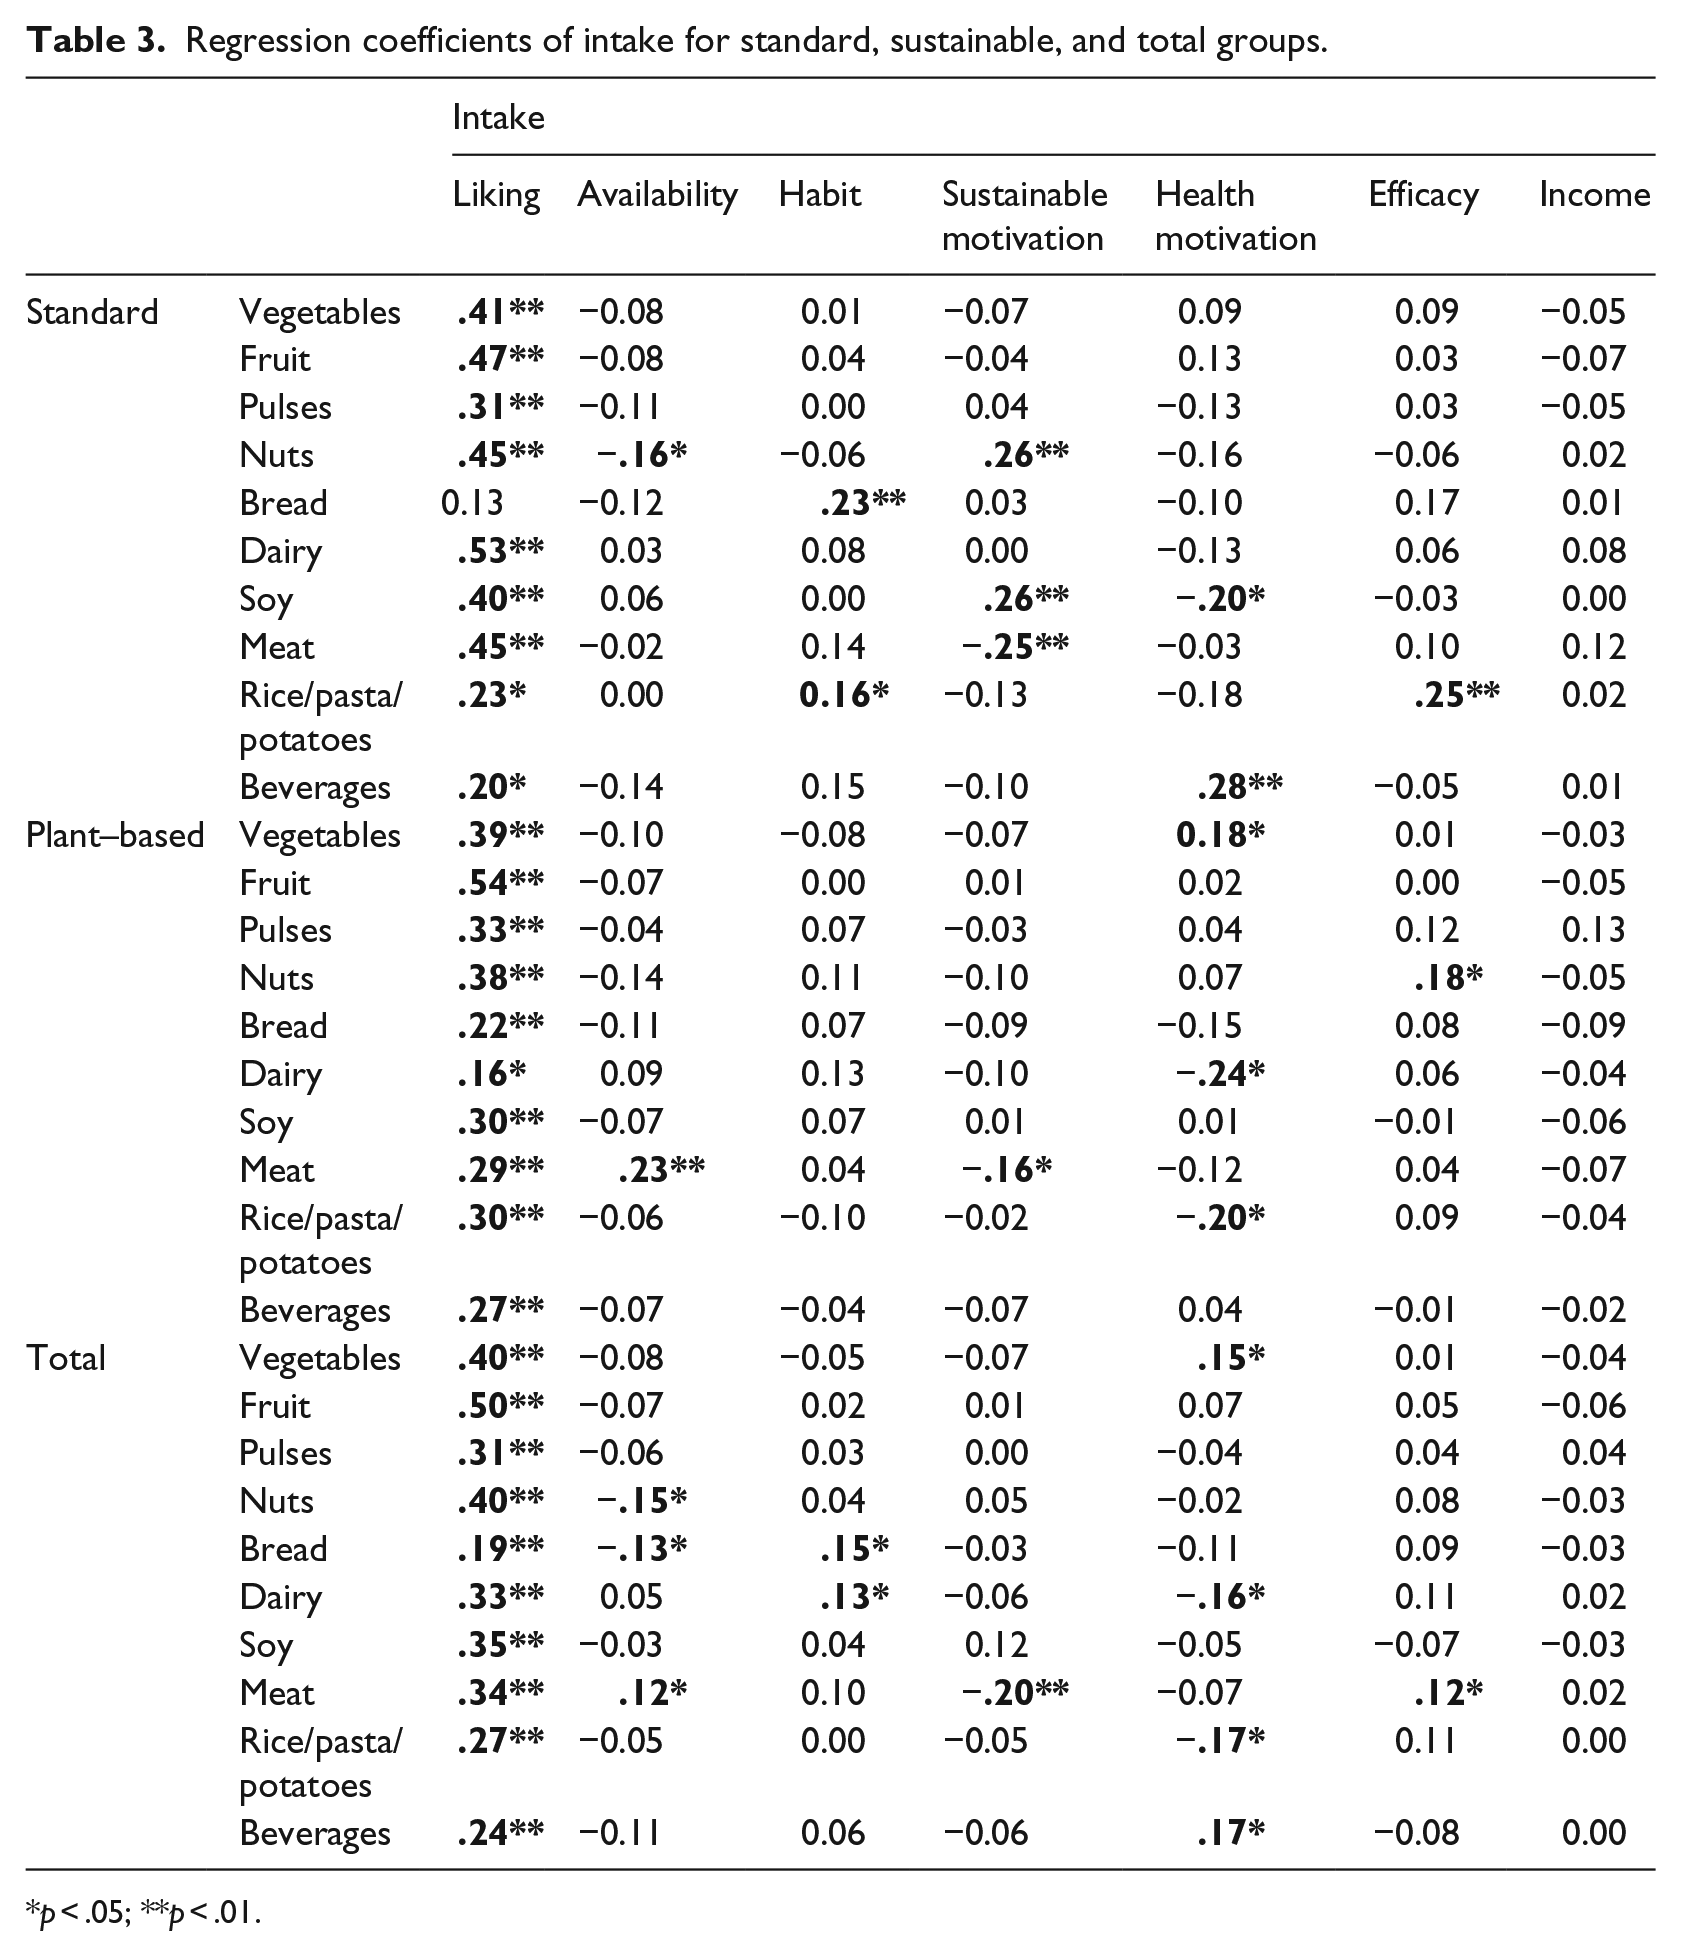
p < .05; **p < .01.
Results showed that across food categories, the single most important predictor of consumption was the liking of typical products in that category (βrange = .19–.50, p < .01). In line with this finding, the category with the lowest reported intake—soy—also had lowest liking ratings (Msoy = 2.5; Mrange other categories = 4.52–5.54). Importantly, there was support for the hypothesis that the weight of some predictors of food intake was category-dependent. Specifically, the hypothesis that consumption habits are especially important for the bread category (β = .15, p < .05) was confirmed. In addition, habits were also a significant predictor of dairy intake (β = .13, p < .05). Regarding motivation, it was found that respondents with higher health motivation reported consuming more vegetables (β = .15, p < .05) and beverages (β = .17, p < .05), but—especially for participants with a sustainable diet—less dairy (β = −.16, p < .05) and rice, pasta, and potatoes (β = −.17, p < .05). Participants with a higher motivation to consume sustainably reported to consume less meat (β = −.20, p < .01). In addition, for participants receiving standard food recommendations, nuts (β = .26, p < .01) and soy (β = .26, p < .01) intake were also related to the motivation to eat sustainable. The expectation that the perceived availability of products is related to a higher intake was not confirmed, except for meat consumption (β = .12, p < .05). No clear relation between income, perceived self-efficacy, and intake was observed.
Discussion
This research compared compliance with dietary recommendations that were of equal nutritional value but differed significantly in sustainability and explored drivers of eating behavior across food categories that would be of relevance to increase compliance. It was shown that self-reported food intake was less in line with recommendations for those following a sustainable diet as compared to those receiving standard recommendations. In addition, people who received sustainable recommendations attempted to comply for a shorter time period reported it to be less feasible to comply with and were less motivated to continue following recommendations after the intervention. These findings stress the importance of considering consumer compliance when reformulating dietary recommendations.
Across all food categories in this research, the most important driver of eating behavior was the expected liking of products in that category. Similar findings have been reported elsewhere (e.g. Guillaumie et al., 2010; Renner et al., 2012; Verain et al., 2016). This is a potential challenge when aiming to increase sustainable consumption, as earlier research showed that products perceived to be more sustainable are expected to be less tasty (Lee et al., 2013; Schuldt and Hannaman, 2013). Thus, consumers’ personal product preferences should be taken into account when providing recommendations. Also, interventions affecting taste expectations of sustainable food products (e.g. tasting and trials) could be considered.
Importantly, however, in line with hypotheses, there was variance between categories. Although the dimensions that have previously been shown to affect food intake were replicated, this research extends those findings by showing that their relative importance are food category–dependent (cf. McClain et al., 2009). For example, habits were a key driver for bread and dairy intake, but not for other food categories. This specific result may be related to dairy and bread being typically and consistently consumed at breakfast and lunch in The Netherlands. These are meal moments with the strongest consumption habits (Khare and Inman, 2006). As another example, the motivation to consume sustainable products was related only to meat consumption but not to other food categories. This suggests that in order to design interventions to increase compliance with dietary recommendations, one needs to distinguish between food categories. To lower meat consumption, for example, increasing knowledge on the environmental impact of meat consumption could be an efficient trigger linking to consumers’ motivation (see also e.g. Zur and Klöckner, 2014). Altering bread intake, however, would require a different approach, focusing primarily on methods to alter consumer habits, as that food category is more habit-driven.
The observation that food recommendations with a greater distance to consumers’ current eating behavior are less complied with and result in a lower motivation to continue trying to follow such recommendations is in line with research on self-control. Studies in that area showed on a more generic level that too challenging tasks can result in disengagement and demotivation, especially for people who are not particularly committed to the task in the first place (Baron et al., 2016; Carver and Scheier, 1990; Locke and Latham, 2002). This may be functional as it allows people to switch their efforts toward other goals they are more likely to succeed in or find more important (Wrosch et al., 2007). The current findings seem to extend those findings to the domain of dietary behavior. It should be noted, however, that this research is not able to fully separate required effort from the motivation to change. Although it is clear that the sustainable diet condition required more effort for participants to comply with than the standard diet, the commitment to follow a sustainable diet is also more important. Future research could therefore test to what extent highly committed consumers are able to comply with recommendations that are significantly different from their eating habits. If they would be able to comply, then interventions aiming to increase consumers’ commitment to sustainable eating would be an interesting avenue to increase the sustainability of diets.
Limitations
Given the increased consideration of plant-based diets to increase sustainability of consumers’ diets (Sonigo et al., 2012), this study focused on plant-based consumption as a sustainable diet. There are, however, other manners to increase the sustainability of consumers’ diets that might be less invasive, like replacing regular versions of products with sustainable choices or reducing rather than removing meat consumption. Such variants might be less demanding for consumers and more feasible (see e.g. Boer et al., 2016; Verain et al., 2015). Indeed, according to goal-setting theory (Locke and Latham, 2002), small steps might be more motivating and effective to change behavior as opposed to the single large step tested in this study. Further research on such a step-by-step approach to increase sustainable consumption is needed however.
Another limitation of this work is that sustainability was operationalized as carbon footprint and land use. Although these sustainability indicators are also the most common in public debate and consumer communication, they are definitely incomplete. Taking into consideration factors like air quality or animal welfare might result in different dietary recommendations and compliance. It should be noted, however, that notwithstanding the operationalization of sustainability, large deviations from consumers’ current diet—such as the sustainable diet in this study—are still expected to be less complied with as compared to smaller deviations—such as the standard diet in this study.
Related to the sustainability operationalization is the measurement of sustainability. In order to create an overview of multiple drivers of food intake, it was chosen to include the Food Choice Questionnaire (Steptoe et al., 1995) to measure both health and sustainability motivation. However, the “ethical concern” factor as an indication of sustainability motivation in that questionnaire may not optimally capture the full aspect of consumers’ conceptualization of sustainability. Although there is a direct link to environmental friendliness, the scale also includes political approval which links to aspects of sustainability not related to the operationalization adopted in this research. Future research could help to further unravel the different consumer facets of sustainability and whether they differentially impact eating behavior.
Finally, it is important to acknowledge the risk of social desirable responses affecting results in food research. Although social desirability did not affect all data, it did regarding the reported intake of several food categories, like vegetables, fruits, or nuts. This emphasizes the need to include social desirability checks in research regarding food interventions, which is currently not common practice. The importance of using such checks is especially important in studies focusing on vegetable and fruit intake, since these categories are stereotypical health categories in the consumers’ minds (Bucher et al., 2015; Chrysochou et al., 2010) and consequently intake of products belonging to these categories are especially prone to be overreported.
Practical implications
This research compared food recommendations with similar nutritional profiles but differing significantly in sustainability. The more sustainable recommendations were less complied with. This stresses the importance of the compliance factor in providing dietary guidelines to consumers. Based on the current insights, it is suggested that attempts to increase the sustainability of diets should preferably not deviate too much from current consumer diets (e.g. by adopting a gradual step-by-step approach in changing the recommendations), take into account that the change strategy may be different depending on the food category (e.g. habit strength), and make sure that the recommendations are directing consumers to alternative products that they like.
Footnotes
Declaration of conflicting interest
The author(s) declared the following potential conflicts of interest with respect to the research, authorship, and/or publication of this article: The first author is employed within the food industry, which could be perceived a potential conflict of interest. All other authors have no conflicts of interests to declare.
Funding
The author(s) disclosed receipt of the following financial support for the research, authorship, and/or publication of this article: This work was financially supported by Friesland Campina.