
Abstract
Rasch modeling was used to examine the 25-item Connor-Davidson Resilience Scale within adults (n = 410) in a weight management program. Rasch analysis assessed model-data fit, item difficulty and person’s resilience level, an item-person map to evaluate relative distribution items and persons, and rating scale function. Four misfit items were identified and removed. Item difficulty ranged from 1.25 to 1.19 logits (higher logit values indicate more difficult items). Persons’ resilience level had wide distribution (resilience = 2.27 ± 1.56 logits). Item difficulty levels did not adequately assess higher resilience levels. An improved inventory that measures a wider range of resilient behaviors would improve measurement quality.
Many people who seek treatment for obesity are able to lose weight; however, relatively few are able to successfully sustain the behavior changes required to maintain results long term (Cooper et al., 2010) resulting in weight regain (Wadden et al., 2004). Several factors have been linked to successful long-term outcomes such as program adherence, weight loss expectations, and self-efficacy/social support (Elfhag and Rossner, 2005; Perri et al., 1993; Varkevisser et al., 2019; Windle, 2011). Identifying new behavioral and psychological factors that predict individual weight loss and weight loss maintenance success can inform intervention strategies and improve effectiveness of behavioral weight loss interventions.
Resilience is an individual’s capacity to negotiate, manage, and adapt to significant sources of stress (Windle, 2011) or “bounce back” when confronted with significant physical or emotional experiences (Block and Kremen, 1996; Lazarus, 1993). To examine the relationship between resilience and interoceptive awareness (perception of bodily signals), one study divided participants into three groups (low resilience, normal resilience, and high resilience) using percentiles of the 10-item Connor-Davidson Resilience Scale (CD-RISC). Findings indicated low resilience participants reported lower levels of interoceptive awareness and lower attention to bodily signals than participants categorized in the normal and high resilience groups (Haase et al., 2016). Interoceptive awareness has implications for patients with eating disorders, including those with binge eating disorder with obesity (Fassino et al., 2004). Lutz et al. (2017) sought to understand the relationship between dietary quality (as measured by the Healthy Eating Index-2010) and psychological resilience (as measured by the CD-RISC 25) with male and female Army and Air Force recruits. Participants were divided into high and low resilience groups based on CD-RISC 25 scores and dietary quality was assessed between groups. Better diet quality was positively associated with resilience, and for every 10-point increase in the Healthy Eating Index, there was a 22 percent increase in the likelihood of being in the high resilience group (Lutz et al., 2017). Unlike a static trait, resilience is a dynamic process that can be learned and cultivated by the individual (Bonanno, 2004; Luthar et al., 2000; Masten, 2001). To examine whether resilience training enhances resilience and well-being within breast cancer survivor mentors in a peer support group, participants (n = 24) were randomly assigned in a single-blind, wait-list controlled clinical trial to a SMART (stress management and resilience training) intervention or waitlist control group for 12 weeks (Loprinzi et al., 2011). Participants assigned to the active arm received two 90-minute group training sessions, an individual session, and three follow-up phone calls, and both active and control groups were assessed using several instruments including the CD-RISC 25 at baseline and at the end of the 12-week intervention. Results indicate a significant change in resilience from baseline to 12 weeks in the active arm, while no changes were observed in the control group (Loprinzi et al., 2011).
The CD-RISC is a 25-item questionnaire that yields an overall score representative of psychologically resilient tendencies (Connor and Davidson, 2003). The CD-RISC-25 has been widely used in multiple populations including, but not limited to, a federally recognized Native American tribe (Goins et al., 2013), medical students (Peng et al., 2014), and patients with spinal cord injuries (Kilic et al., 2013). The CD-RISC 25 has multiple studies providing validity evidence to support its use (Connor and Davidson, 2003; Johnson et al., 2011; Steinhardt et al., 2009; Sutherland et al., 2009). However, resilience using CD-RISC 25 has not been examined within an adult weight management population. Because resilience interacts with temporal and contextual variables, the factors associated with resilience in a weight management population might differ from those previously identified in other populations. To date, minimal evidence exists that explores resilience in weight management and dietary behavior change space with an overweight and obese adult population.
Furthermore, there is limited evaluation of the CD-RISC using advanced measurement theory, which can overcome measurement limitations of traditional approaches based on classical test theory. González et al. (2015) examined the CD-RISC 25 using Rasch analysis on Spanish university students with a Spanish version of the inventory. To date, Rasch analysis has not been applied to a US adult population. In addition, Windle et al. (2011) reviewed the psychometric precision of 15 psychological resilience measurement scales developed for use in general and clinical populations through examining content validity, internal consistency, criteria validity, construct validity, reproducibility, responsiveness, presence of floor and ceiling effects, and interpretability. Evaluators scored inventories by assigning points of 2 (“fulfilled”), 1 (“doubtful”), or 0 (“not met”) to each criterion and found that the CD-RISC 25 and Resilience Scale for Adults were ranked highest, but that all measures required further validation work (Windle et al., 2011).
The Rasch Model (Rasch, 1960, 1980), regarded as a one-parameter item response theory, provides a more effective approach for examining psychometric quality of rating scales. Rasch analysis has several advantages over classical test theory, including the ability to account for the difficulty level of individual items as well as the non-additive feature of ordinal data (Kang and Kang, 2006). Because ordinal data are not additive, the total resilience score may be biased and an inadequate measure to use for analysis. The Rasch model accounts for this by changing the CD-RISC 25 ordinal scale items into an interval scale using logits (a unit of measure that calibrates items and persons). Another capability of Rasch analysis is the examination of resilience items for spread, redundancy, and gapping across a wide range of person ability scores through an item-person map (Brinthaupt and Kang, 2012).
The purpose of this study was to assess the psychometric properties of the CD-RISC 25 using Rasch Analysis in a population enrolled in a weight management program. Establishing evidence in this group using modern measurement theory may provide greater insight into the utility of psychological resilience as a mediator of successful long-term weight management and provide direction for more effective interventions.
Methods
Participants
This sample consisted of 410 participants (males = 51 and females = 359) with an average age of 45.89 (standard deviation (SD) = 11.06) years. Participants were enrolled in a behavioral weight management program (Profile by Sanford®) that emphasizes making sustainable nutrition, activity, and lifestyle changes. The average body mass index (BMI) is 30.12 kg/m2, and 80 percent of participants (n = 327) were either overweight or obese. The majority of participants were White (94%) and obtained bachelor’s degree or above (63%). Table 1 indicated demographic characteristics in this study.
Demographic characteristics (N = 410).
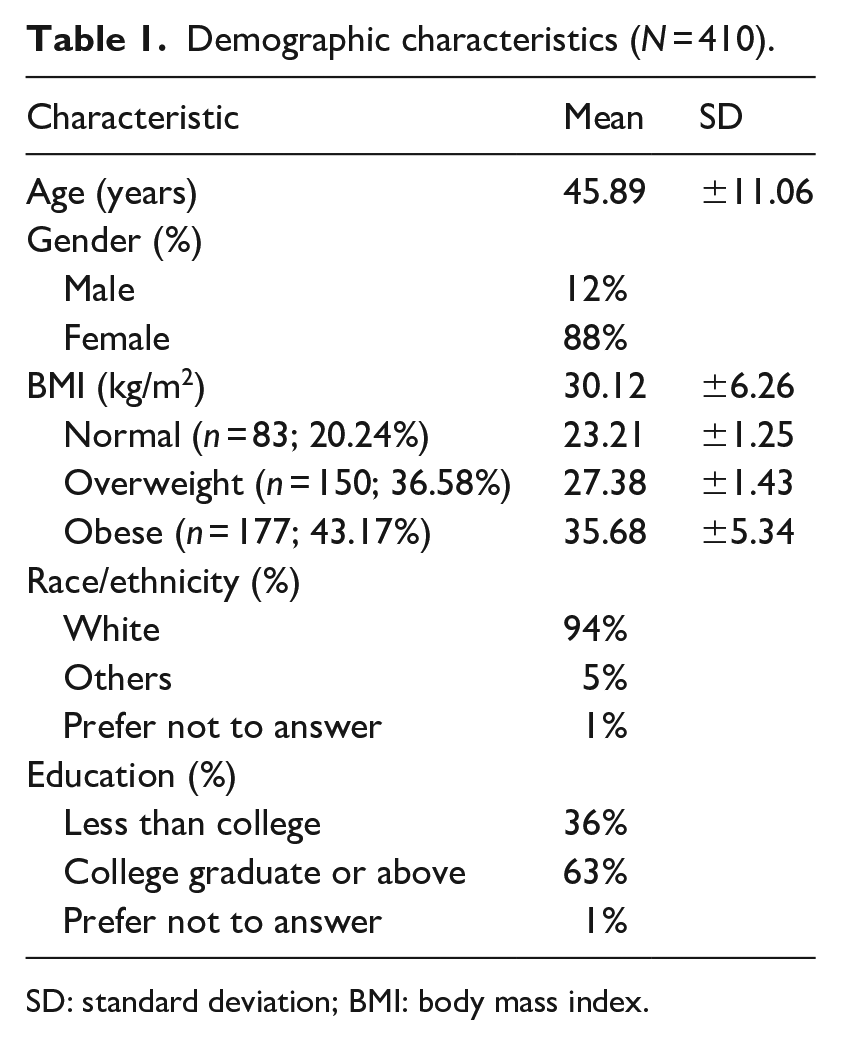
SD: standard deviation; BMI: body mass index.
CD-RISC
The CD-RISC 25 (Connor and Davidson, 2003) is a simple, self-rated measure of resilience that is a 25-item scale that measures the ability to cope with adversity with sound psychometric properties. The 25-item scale includes five subscales: (1) personal competence, high standards, and tenacity; (2) trust in one’s instincts, tolerance of negative affect, and strengthening effects of stress; (3) positive acceptance of change and secure relationships; (4) control; and (5) spiritual influences. Respondents rate the item as 0 (not true at all) to 4 (true nearly all the time). In the literature, studies on the psychometric properties of CD-RISC in non-clinical, general populations and clinical, patient samples have shown acceptable internal consistency (Cronbach’s alpha = 0.89), test–retest reliability (intraclass r = 0.87), and convergence (Pearson r = 0.83) evidences (Johnson et al., 2011; Steinhardt et al., 2009; Sutherland et al., 2009).
Data analysis
The Rasch measurement computer program, Winsteps (3.65), was used to perform Rasch analysis. A two-facet Rasch model was estimated, including the item (difficulty level of resilience items) and person (individually determined resilience level) parameters in logits.
First, model-data fit was evaluated by examining Infit and Outfit statistics in the Rasch model (Linacre, 2002b). The Infit and Outfit measures indicate the information-weighted mean square residuals between observed and expected responses, but Outfit measure is more sensitive to the outlier results. Infit and Outfit measures with a value closer to 1 indicate an adequate model-data fit. If Infit and Outfit statistics are less than 0.5 or greater than 1.5, it should be considered a misfit (Linacre, 2002b). Infit and Outfit values greater than 1.5 show inconsistent responses and values less than 0.5 indicate little variation.
Second, the function of the rating scale was analyzed to determine whether existing instrument category (i.e. five categories) was appropriate for the inventory. The evaluation criteria were as follows: (1) Was there regular observation distribution such as unimodal, bimodal, or slightly skewed distribution? (2) Did the average logit score measured for each category increase as the category increase? (3) Was the Outfit mean square residual appropriate for each category (Outfit statistics < 2.0)? (4) Were the category thresholds (i.e. boundaries between rating categories) ordered? (Anshel et al., 2013; Linacre, 2002a).
Third, an item-person map distribution was examined. The item-person map visually describes logit scores of both item and person on the same numerical scale while allowing comparison among both measures. The map shows each person’s resilience level, the order of each resilience items’ difficulty, and the relative position of a person’s resilience level for the CD-RISC items in logits.
Fourth, CD-RISC items difficulty was calculated during the calibration process in logits. The higher the logit score, the more difficult the resilient item is perceived by the participants. Item separation index and item separation reliability were examined. The item separation index determines how well the items were separated along the measurement scale (separation index > 2.0) (Bond and Fox, 2013). The item separation reliability is plausible to replicate item placements along the pathway if these same questions were given to another sample (reliability scores are close to 1.00 denote high confidence) (Fisher, 1992).
Fifth, the person’s level of resilience was estimated in which the higher the logit score, the higher the person’s resilience level is. Person’s separation index and separation reliability were also performed. The person separation indicates how well people are spread along the measurement scale (separation index > 2.0) (Bond and Fox, 2007). The person separation reliability is measured by the reproducibility of person when they responded to another set of items measuring the same resilience construct. The closer the reliability of person separation is to 1.00, it indicates more high confidence (Wright and Masters, 1982).
Sixth, a differential item functioning (DIF) analysis was performed to verify that items in CD-RISC functioned differently by gender. DIF means that the item difficulty between groups is different, but it might be biased toward a specific group and question the validity of the instrument (Myers et al., 2006). Items were considered to be biased if they exhibited both substantive (i.e. Mantel-Haenszel (M-H) DIF size > 0.64 logits) and statistical significance (p < .001) (Zwick et al., 1999). If the M-H DIF is larger than 0.64 logits, the functions were different among the groups. The significance level of the DIF analysis was set to 0.001 to account for potential inflation at the alpha level in multiple comparisons.
Finally, to establish the evidence of convergent validity of the CD-RISC, we also collected stress level data using the Perceived Stress Scale (PSS) from the participants and correlated resilience scores (in logits) with perceived stress level scores using Pearson correlation coefficient, r. PSS consists of 10 items, using a 5-point Likert-type format, ranging from 0 (never) to 4 (very often). Satisfactory reliability evidence of PSS was provided across different samples with Cronbach’s alphas ranging from 0.58 to 0.72 (Roberti et al., 2006). To establish the evidence of known-group difference validity, the resilience scores were also compared to physical activity level (low vs moderate to vigorous) using independent t-test. Single Response Physical Activity questionnaire was used to measure participants’ level of physical activity. Satisfactory reliability evidence of Single Response Physical Activity questionnaire was provided when the Kappa coefficient was 0.82 (Jackson et al., 2007). The validity studies were performed using SPSS (version 25; SPSS INC, Chicago, IL, USA) with the alpha level set at 0.05.
Results
Model data fit
Three items were indicated unacceptable Infit and Outfit statistics in the initial analysis: item 3 had an Infit value of 3.07 and Outfit value of 3.24, item 9 had an Infit value of 1.75 and Outfit value of 1.81, and item 2 had an Infit value of 1.74 and Outfit value of 1.61, respectively. In the second Rasch analysis without item 3, 9, and 2, item 6 also had unacceptable Infit value of 1.56 and Outfit value of 1.63. Therefore, a total of four items were removed from a further analysis. The final analysis indicated fit statistics were all acceptable for 21 items (M Infit mean square residuals (MNSQ) = 0.99 ± 0.18; M Outfit MNSQ = 1.01 ± 0.18). The Infit statistics ranged from 0.73 to 1.29, and the Outfit statistics ranged from 0.71 to 1.34. The results showed a satisfactory model-data fit, which further provides evidence of a unidimensional structure of CD-RISC.
Rating scale functioning
Table 2 indicates a summary of the rating scale function of the CD-RISC. Overall, the rating scale function fit well. The data were compared to the following four evaluation criteria. First, the observed counts used indicated regular distribution such as unimodal distribution. Second, each value of average measure increased when the category score increased. Third, the Outfit mean square residuals of five categories ranged from 0.99 to 1.30, which were within the acceptable range of < 2.0. Finally, the values of category thresholds were ordered when the category score was larger. Figure 1 depicts the category probabilities of the CD-RISC. The logits measures are along the x-axis, and the y-axis represents the probability of each response category across the scale. Figure 1 indicates that clearly defined thresholds for the categories are increasing.
Summary of Connor-Davidson Resilience Scale rating scale function.
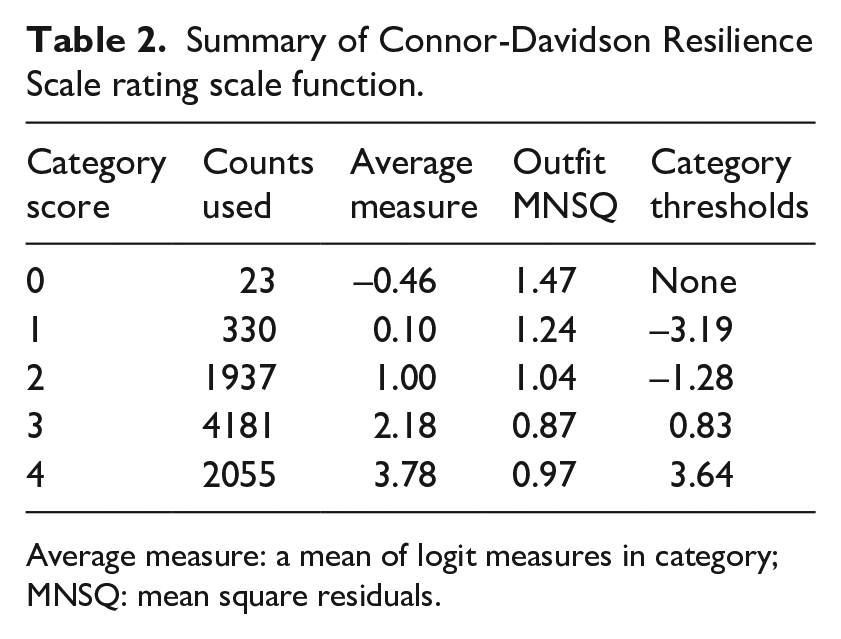
Average measure: a mean of logit measures in category; MNSQ: mean square residuals.
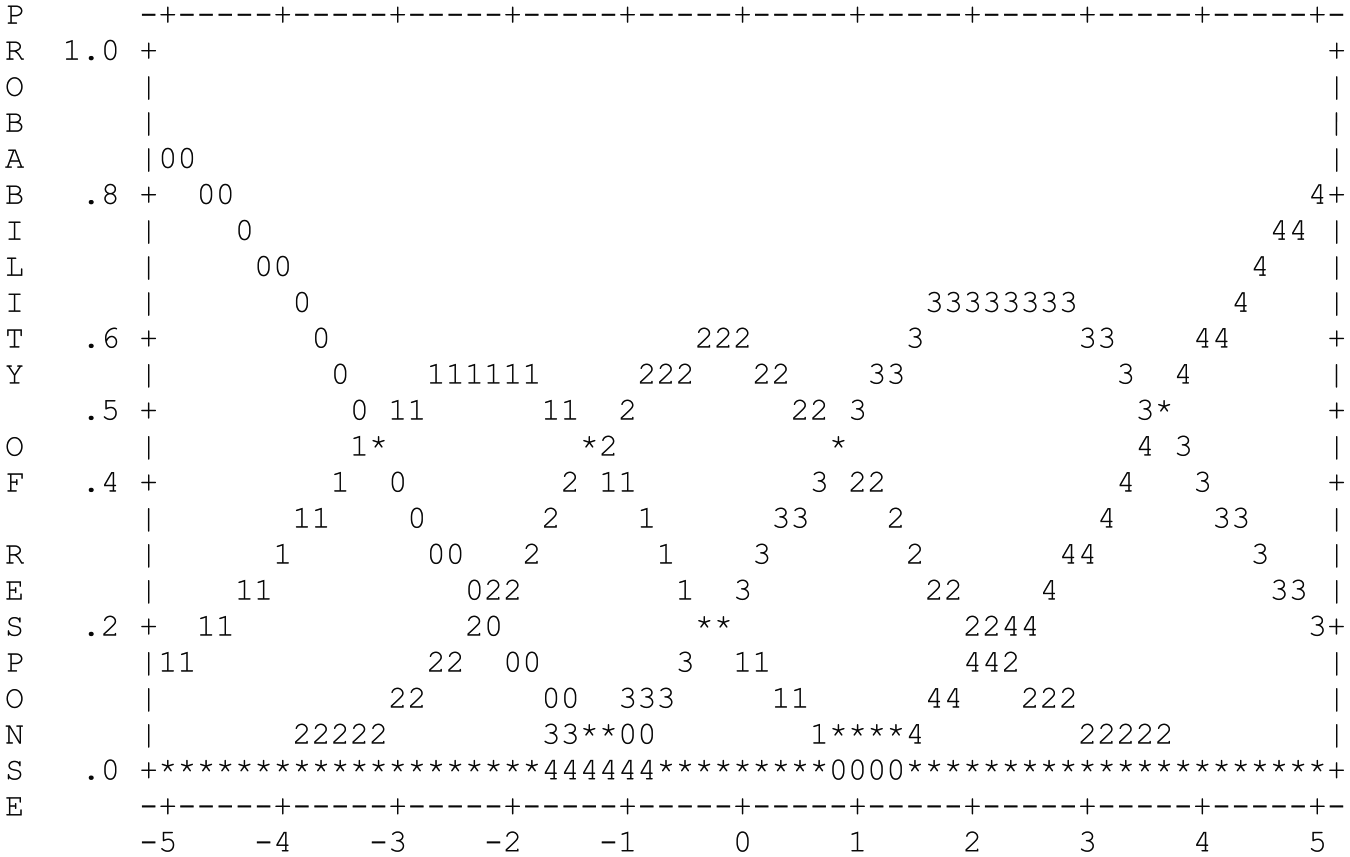
Category probabilities for Connor-Davidson Resilience Scale.
Item-person map
Figure 2 indicates the item-person map for the CD-RISC. The distribution displays the logit measures for resilience item difficulty and resilience level. The logit score for resilience is shown on the right side of the map indicated by question number. The logit scale on the left of the map, indicated by “#” and “.” signs, displays resilience level of persons. The map indicates that, although persons’ resilience level had wide distribution, the item difficulty levels of CD-RISC showed slightly biased toward low to a moderate level and did not provide coverage for higher levels of resilience. These results indicate higher levels of resilience were measured less accurately (>1.20 logits). It would have resulted in a better discrimination if more difficult items that could measure high resilience levels were included in the CD-RISC.
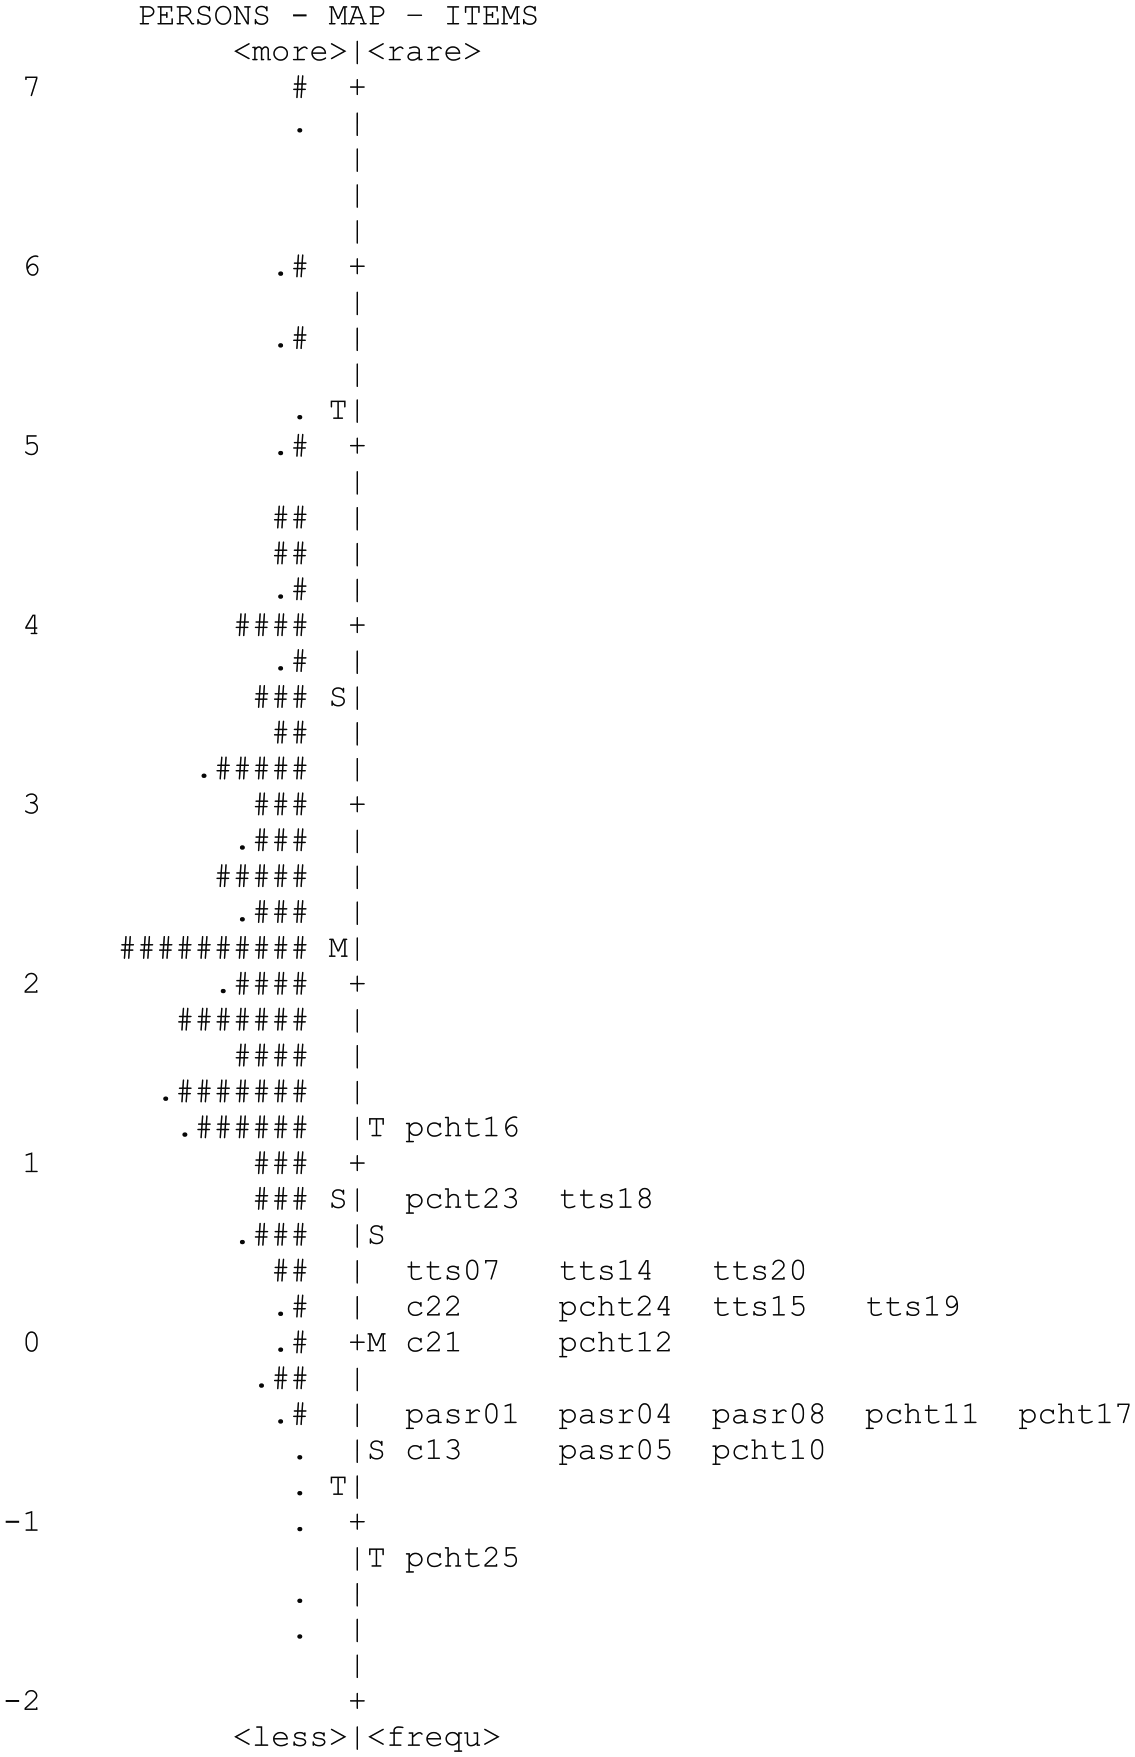
Item-person map of Connor-Davidson Resilience Scale.
CD-RISC 25-item difficulty
The CD-RISC item difficulty, standard errors (SEs), and associated Infit and Outfit statistics are shown in Table 3. A higher logits score indicated a more difficult resilient item. The resilience item difficulty estimates ranged from −1.25 to 1.19 logits. The most difficult resilient item was question 16 (“I am not easily discouraged by failure”) with a 1.19 logit (SE = 0.08). The least difficult resilient item was question 25 (“I take pride in my achievements”) with a −1.25 logit (SE = 0.09). The item separation index was 6.51, indicating that the CD-RISC items were well distributed across the measurement scale. The separation reliability was 0.98, indicating a high degree of confidence in replicating the position of the items within measurement error for another sample.
Item difficulty summary of Rasch calibration in Connor-Davidson Resilience Scale.
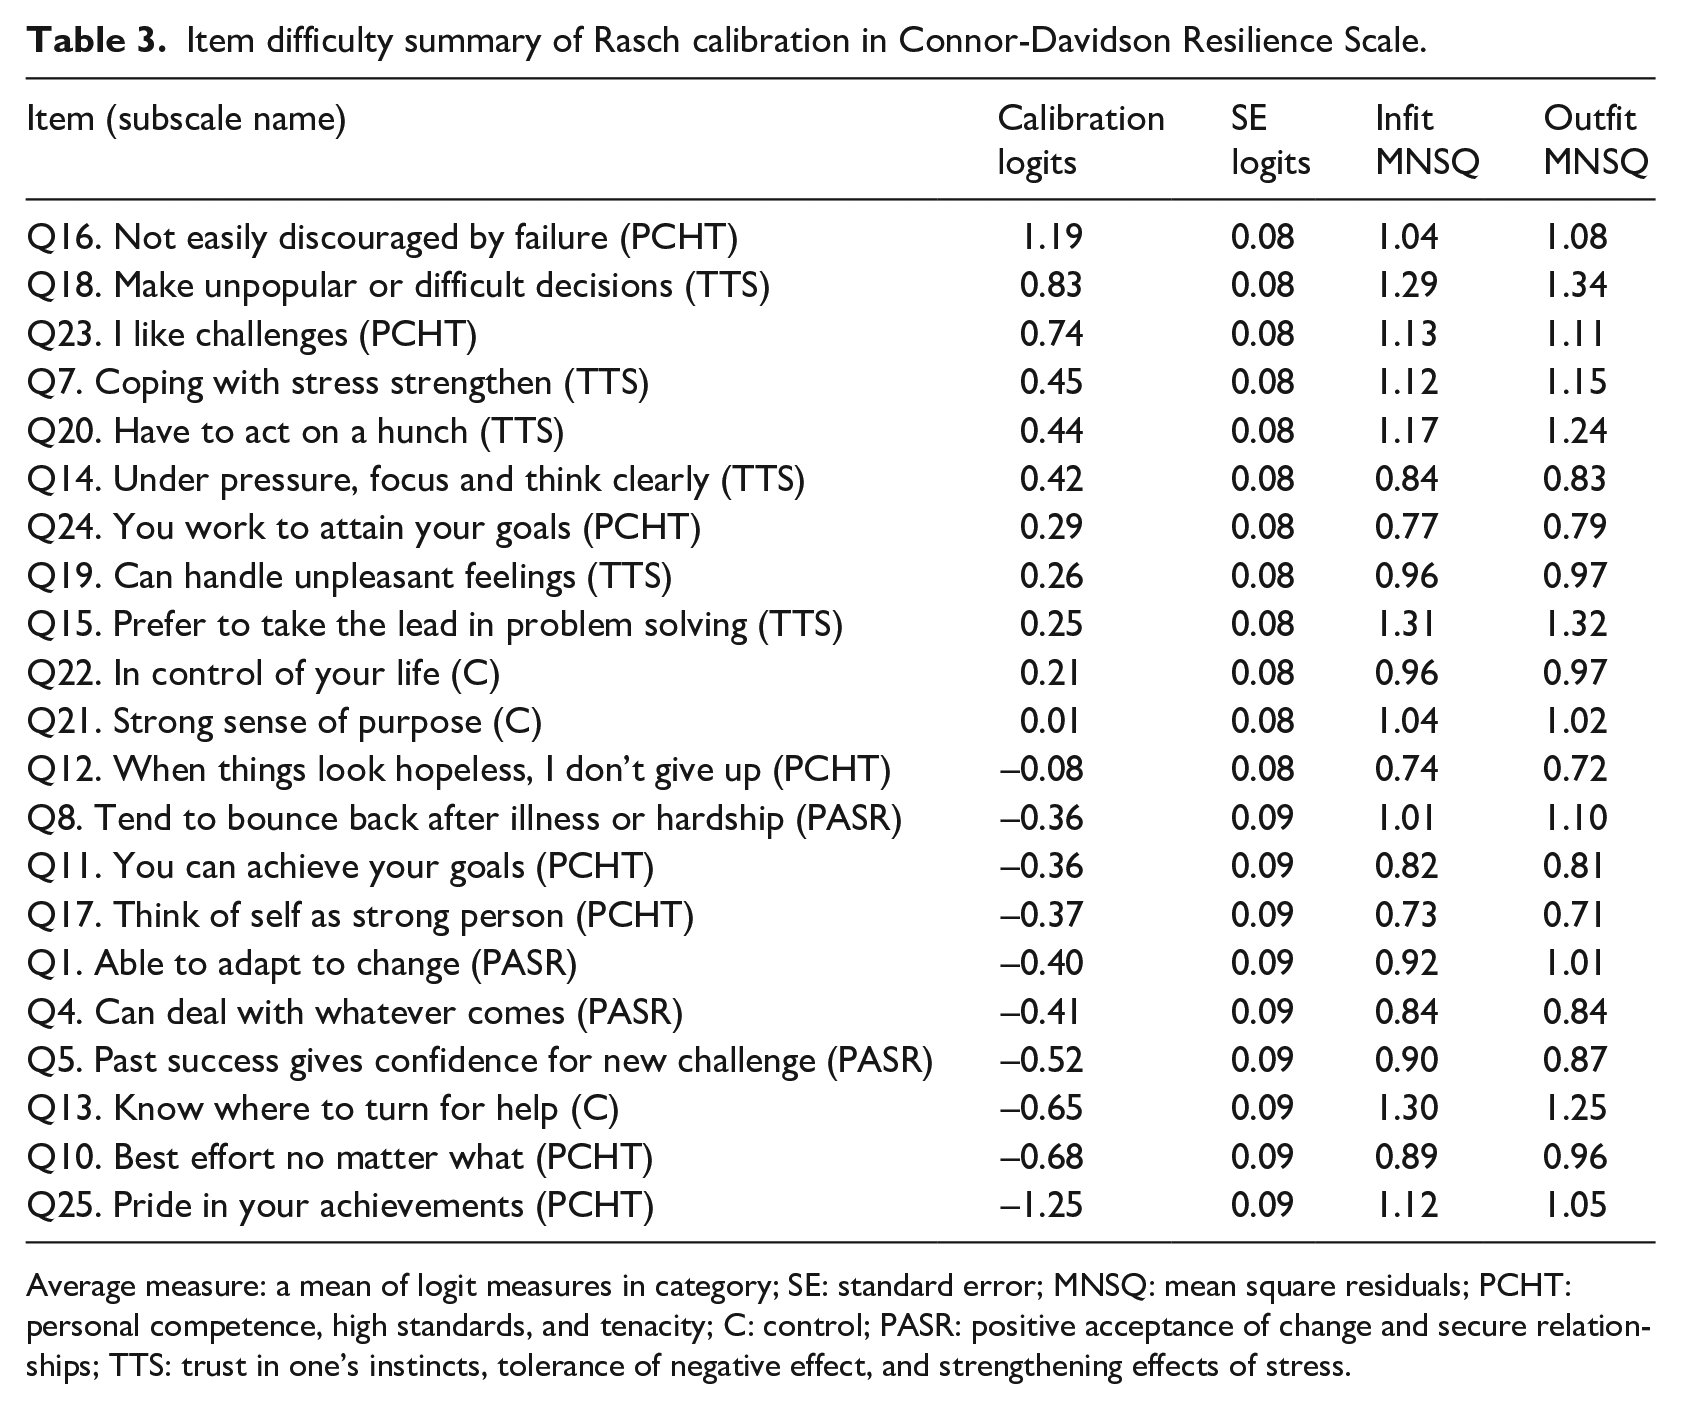
Average measure: a mean of logit measures in category; SE: standard error; MNSQ: mean square residuals; PCHT: personal competence, high standards, and tenacity; C: control; PASR: positive acceptance of change and secure relationships; TTS: trust in one’s instincts, tolerance of negative effect, and strengthening effects of stress.
Individual level of CD-RISC 25
The individual level of the resilience was estimated by logit, where a higher logit represented a higher resilience level. The average of resilience levels was 2.27 (SD = 1.56). The individual level of the resilience estimates ranged from −1.69 to 8.03 logits. Person separation was 3.27, which indicates that person’s ability varied well spread out along the continuum. Person separation reliability was 0.91, which indicated a good degree of confidence in replicating placement of persons within measurement error.
DIF
According to the DIF analysis, there were no items flagged by gender, reflecting that the items function properly regardless of the gender. Another word, the items are equivalent in assessing resilience level of people for male and female.
Convergent validity and known-group difference validity evidence
The resilience level and perceived stress level were compared to establish further validity evidence in this study. There was a moderately negative relationship (r = −0.57) between the two scores, which supported the convergent validity evidence of the resilience scale. To examine a known-group difference validity, the resilience level was compared to physical activity level (low and moderate to vigorous). Results of independent t-test indicated a significant difference between levels of physical activity, t = −3.42, p = 0.001, d = 0.39. A low physical activity level group (M logits = 1.83) has a lower resilience level than a moderate to vigorous level physical activity group (M logits = 2.40), which supported the known-group difference validity evidence. Table 4 indicates the descriptive statistics for the resilience by physical activity level groups.
Resilience logit score by physical activity level.
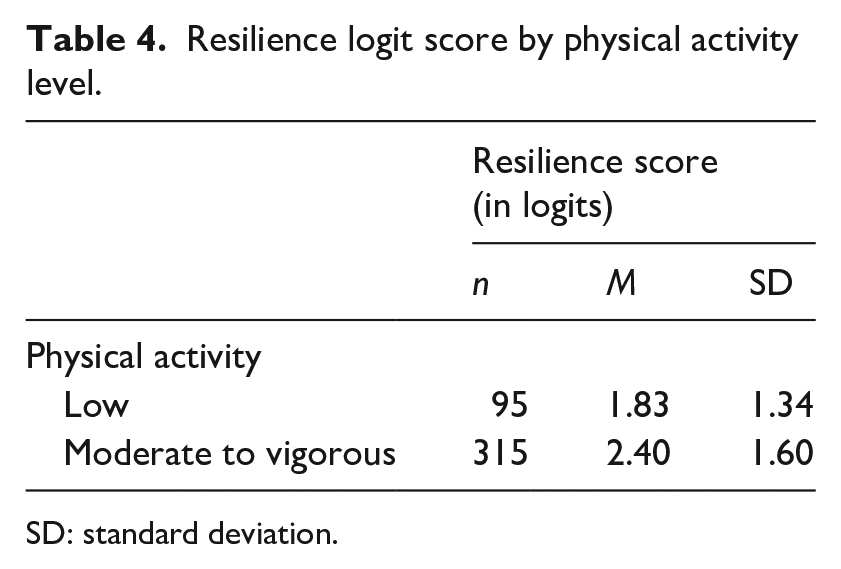
SD: standard deviation.
Discussion
The purpose of this study was to examine the psychometric properties of the CD-RISC 25 using Rasch Analysis in a population of overweight and obese US adults. Model data fit demonstrated four items were unacceptable (item 3, “When there are no clear solutions to my problems, sometimes fate or God can help me”; item 9, “Good or bad, I believe most things happen for a reason”; item 2, “I have at least one close and secure relationship that helps me when I am stressed”; and item 6, “I try to see the humorous side of things when I am faced with problems”) and were removed from analysis. In doing so, the Spiritual Influences subscale of the CD-RISC 25 was removed. Elimination of items 3 and 9 mirrors the findings of Gonzalez et al. (2015) that evaluated the Spanish version of the 25-item CD-RISC using Rasch Analysis (Gonzalez et al., 2015). Once items 3, 9, 2, and 6 were removed, the remaining 21 items exhibited fit appropriate to the expectations of the model.
The CD-RISC 25 item-person map in Figure 2 reveals significant limitations and a mismatch in person ability level and item difficulty level. Furthermore, the difficulty level of many items and subscales are nearly the same providing limited utility in discriminating ability levels. For example, the difficulty level of three items in the Positive Acceptance of Change and Secure Relationships subscale (PASR01, PASR04, and PSAR08) had a limited range of −0.36 to −0.41 indicating that most respondents would answer these items in a similar fashion. Next, there is a skewed distribution of item difficulty toward lower levels of resilience indicating a ceiling effect potentially limiting accurate baseline assessment and a reduced ability to measure change over time. More difficult items will need to be included to mitigate the ceiling effect and to adequately differentiate those with higher levels of resilience. This is a critical first step for this inventory to be used effectively in situations where detection of higher levels of resilience is of interest (e.g. in identifying possible protective factors and behaviors those with higher levels of resilience engage in that are conducive to long-term health behavior change).
Table 5 indicates a scoring table that converts ordinal-level, raw CD-RISC total scores into interval-level, logit scores. This was done to evaluate if different items contribute equally to the CD-RISC total score. Total CD-RISC scores ranged from 27 to 84. The results show that different items do not contribute equally to the CD-RISC total scores.
Rasch logits conversion values for CD-RISC total scores.
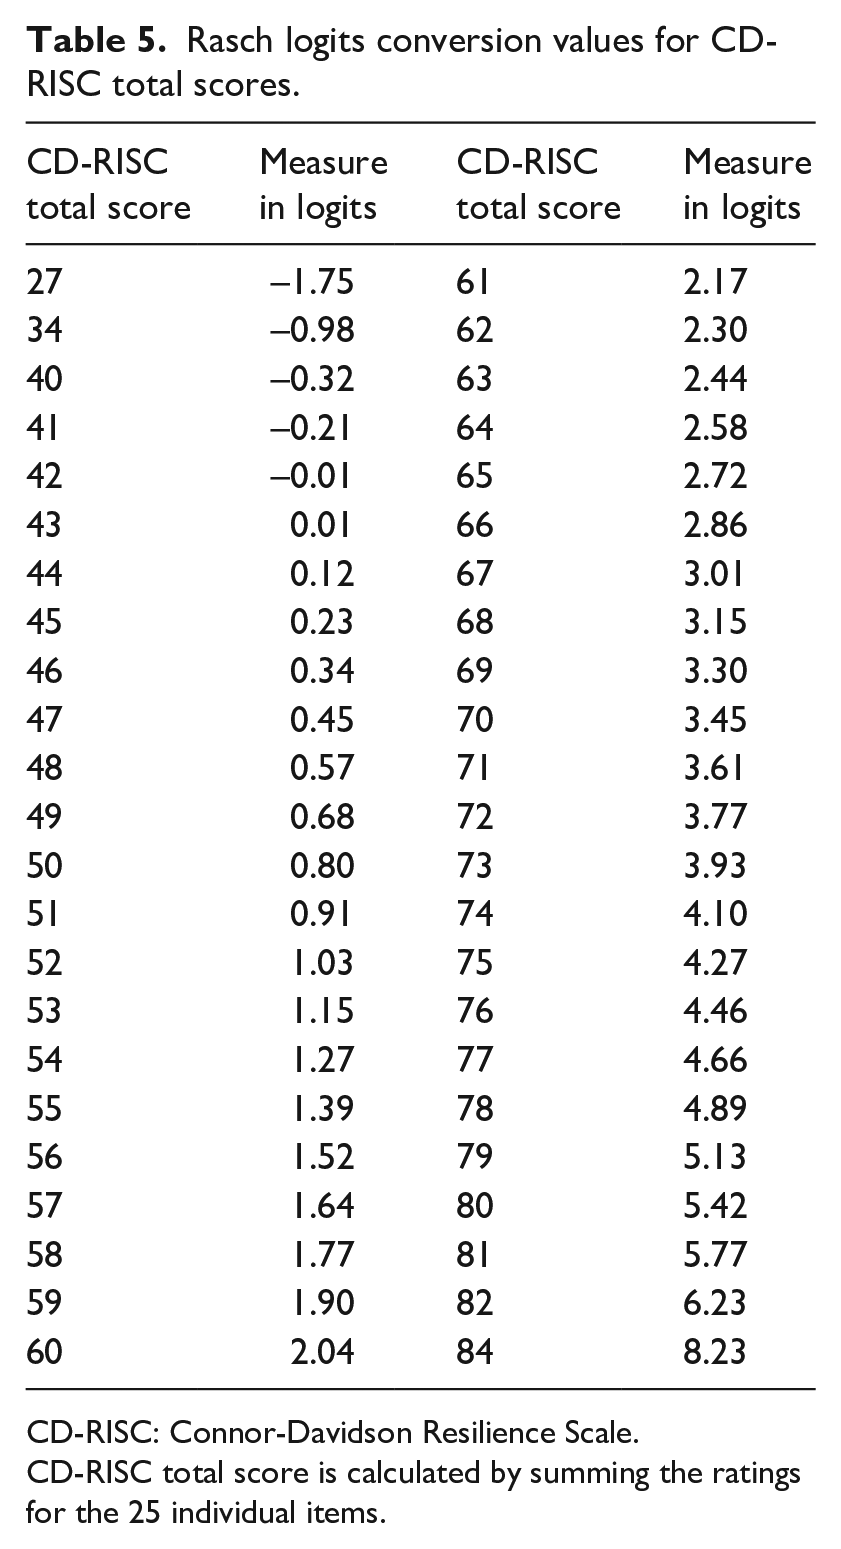
CD-RISC: Connor-Davidson Resilience Scale.
CD-RISC total score is calculated by summing the ratings for the 25 individual items.
It is recommended that people who administer the CD-RISC use the logit values because the results show that different items do not contribute equally to the CD-RISC total scores. The total scores of ordinal-level items are not additive, which is a limitation from traditional classical test theory approaches. Therefore, people who are interested in overall CD-RISC scores should recommend using the conversion table and read logit scores.
To establish evidence of convergent validity, the PSS was administered and found to be moderately negatively correlated with resilience scores. This aligns with findings from original psychometric testing of the scale that reported a significant negative correlation between the CD-RISC 25 and PSS indicating higher levels of resilience corresponded with less perceived stress (Connor and Davidson, 2003). Significant negative correlations between perceived stress and resilience were reported in Japanese students (Ito et al., 2015), Korean participants (Baek et al., 2011), and in individuals with multiple sclerosis (Senders et al., 2014). In support of known group validity, we found differences in resilience between low and moderate physical activity level groups, where the lower physical activity group reported lower resilience level than those in the moderate physical activity group. This is consistent with previous research that found cancer patients with higher resilience reported higher levels of physical activity (Matzka et al., 2016) as well as observed differences in Japanese employees where resilience was significantly higher in the group with regular physical exercise than in the group without regular physical exercise after controlling for age, education, marital status, and job status (Yoshikawa et al., 2016).
There are several limitations of this study. One limitation is the generalizability of the sample of this study (87.5% female; 94% White; 63% bachelor’s degree or higher) to the larger population. Given our interest in understanding how resilience may mediate outcomes within adults enrolled in a weight management program, our sample is representative of the population of interest and may not apply to other clinical and nonclinical populations. The similarity between our sample and larger population of interest is demonstrated through a systematic review that examined the effectiveness of weight loss interventions between men and women where 71 percent of studies (n = 41) had greater than 50 percent female distribution while another 21 percent (n = 13) had 70 percent or greater female distribution (Williams et al., 2015).
Another limitation is the impact of social desirability bias on the observed ceiling effect. We acknowledge that it is possible participants may have responded in a way that positions them in a favorable light. Previous work suggests participants are most likely to occur in response to socially sensitive questions (King and Bruner, 2000). Otto et al. (2010) noted a significant positive correlation between the CD-RISC and Marlowe-Crowne Social Desirability scale, indicating that higher levels of resilience are associated with higher levels of social desirability, or need for social approval and positive portrayal, in college-aged students. Some scholars suggest the probability of responding in socially desirable ways is dependent on the population of study, with Park and Lessig (1977) specifically noting that social influence decreases with age. Younger, college-aged adults (Otto et al., 2010) may be more prone to respond in socially acceptable ways than our sample with a mean age of 49.8 years. Measures taken to minimize social desirability bias in this study include anonymity of participants and reducing evaluation apprehension by informing participants of no correct or incorrect answers and encouraging respondents to answer as honestly as possible (Podsakoff et al., 2003). In the future, administering a scale such as the Martin-Larsen Approval Motivation Scale or Marlowe-Crowne Social Desirability Scale to detect social desirability bias and minimize this source of bias is recommended (King and Bruner, 2000).
In conclusion, significant limitations of the CD-RISC 25 were revealed using Rasch analysis, particularly in the ceiling effect identified. These limitations should caution the use of this instrument in overweight and obese adults. Additional modification and research is necessary to support the use of a resilience measure that adequately measures a wider range of ability levels in this population. Resilience could be an important mechanism through which individuals can achieve sustainable behavior change; however, more work is needed to have an assessment that accurately identifies a wider range of ability.
Footnotes
Declaration of conflicting interests
The author(s) declared no potential conflicts of interest with respect to the research, authorship, and/or publication of this article.
Funding
The author(s) received no financial support for the research, authorship, and/or publication of this article.