
Abstract
This study aims to identify risk and protective factors associated with the stress perceived by online university students, and to establish profiles based on healthy or unhealthy life patterns. A cross-sectional online survey was conducted on a sample of 9155 students. To determine the elements linked to academic burnout, multiple logistic regression and GLM Univariate analysis tests were performed. The results show high burnout scores for the emotional exhaustion dimension, while scores for cynicism and efficacy dimensions were moderate. However, life satisfaction and resilience scores were adequate. The element most strongly associated with stress scores was developing a healthy life pattern. According to the interaction study comparing healthy/unhealthy life patterns, having children, leading an unhealthy life pattern, and being a woman are the characteristics that further raise the risk of burnout. These results allow for academic policies to be defined accordingly and provides a guide for student support services.
Introduction
Stress is present in different areas of people’s lives, and the academic field is one of these. In recent years, students’ perceptions of stress and overload has become a very widely studied topic (Robotham and Julian, 2006). Above all, research has indicated that academic stress seems to be a psychosocial risk factor when assessing students’ well-being and life satisfaction (Campbell et al., 2022; Cilli et al., 2023; Franzoi et al., 2023; Hanson et al., 2024; Khan and Shamama-Tus-Sabah, 2020; Kökçam et al., 2022; Slimmen et al., 2022). In line with this, the definition of stress posited by Lazarus and Folkman (1986) remains fully valid: the effect on well-being caused by the feeling that the demands of the environment exceed one’s own resources.
The different challenges posed by undertaking a university degree explain some of the emotional discomfort that students may present (Robotham and Julian, 2006). Thus, it would be logical to think that those students who are more vulnerable or have other stressors would be more affected than others. Some of the stressors implicit in university studies are: (a) the demands of achieving results and workload (Cilli et al., 2023; Franzoi et al., 2023; Khan and Shamama-Tus-Sabah, 2020; Slimmen et al., 2022); (b) a lack of experience (Khan and Shamama-Tus-Sabah, 2020); (c) possible changes and family and social adaptations, as well as readjustments in times and availability for other areas of the student’s life (these being especially relevant in students with family and work responsibilities beyond university—Franzoi et al., 2023; Kökçam et al., 2022; Slimmen et al., 2022); (d) family or personal conflicts resulting from the above (beyond those that may already be present in each individual—Kökçam et al., 2022); e) creating new friendships and other social support networks (this can be emotionally demanding for some people—Campbell et al., 2022; Cilli et al., 2023); (f) loneliness and feelings of not belonging (Campbell et al., 2022; Slimmen et al., 2022); (g) financial problems and scholarships (Campbell et al., 2022; Franzoi et al., 2023; Slimmen et al., 2022); and (h) problematic habits and unhealthy lifestyles (non-regular sleeping patterns, dietary changes, less dedication to physical exercise) that can have emotional repercussions (Campbell et al., 2022; Franzoi et al., 2023). In addition to these stressors typical of the academic environment, we cannot underestimate other sources of stress present in the life of each individual according to their circumstances (Bianchi and Brisson, 2017; Hanson et al., 2024). In fact, it is estimated that approximately 70% of the world’s population has experienced a shocking and potentially traumatic event in their lifetime (Benjet et al., 2016).
Beyond stressors or risk factors, some of the available research has included studies that focus on determining the possible protective factors (Brooker and Vu, 2020; Campbell et al., 2022; Renshaw et al., 2016) that identify less vulnerable students. These investigations all contribute to one another and must be embraced by the university environment as an area of support and inclusive development for individuals. Within this context, the university has a great opportunity to provide preventive support and care (Campbell et al., 2022; Liu et al., 2021) by activating the resources available to each student and helping them face stress in a more adaptive and active way. This will undoubtedly result in students feeling a greater sense of competence and reduce other risks, such as those related to well-being and life satisfaction (Aldwin, 2007; Demerouti et al., 2001).
To date few studies have carried out complete investigations that seek to simultaneously measure all of these variables, determining both risk and protective factors. In addition, to the best of our knowledge the available research has not been conducted with online universities or outside the context of Covid-19. The purpose of the present study is to identify factors associated with students’ perception of stress, differentiating between risk and protective factors, and to establish profiles based on healthy or unhealthy life patterns among students.
Considering the typical profile of an online university student, who works and has personal, family, and financial responsibilities, the research hypothesis would be to find high levels of academic stress among online university students. Specifically, working more hours per week, having children, having attention and/or learning problems, mental health issues, depression risk, low life satisfaction, getting little exercise, insufficient sleep, substance use and a perception of an unhealthy diet will be predictors of academic burnout.
The above variables can constitute profiles based on healthy or unhealthy life patterns. These patterns include core components such as classic healthy habits (balanced nutrition, sufficient sleep, regular psychological activity, and avoiding harmful substance use), but also more intrapsychic categories (such as life satisfaction and risk of depression), which is why they go beyond healthy lifestyles. The different pillars work interdependently, and the healthy life pattern construct provide a structure to build and maintain both physical and emotional well-being. Previous frameworks have already emphasized that the promotion of healthy lifestyles is influenced by cognitive, perceptual, and emotional factors, such as well-being, satisfaction, and self-efficacy (Pender et al., 2015; Ryan and Deci, 2001). The inclusion of resilience is critical, as it is recognized as a fundamental resource for coping with adversity (Aldwin, 2007; Luthar et al., 2000), as is academic stress. Thus, the healthy life pattern variable operates as an aggregate measure of personal and behavioral resources that buffer the impact of stressful demands. This aligns with a holistic, resource-based approach that has been shown to be more explanatory and powerful in the study of adaptation and stress in academic populations (Demerouti et al., 2001), offering a more comprehensive view of the university student as an active agent in their own health and stress management.
Methods
Study design and participants
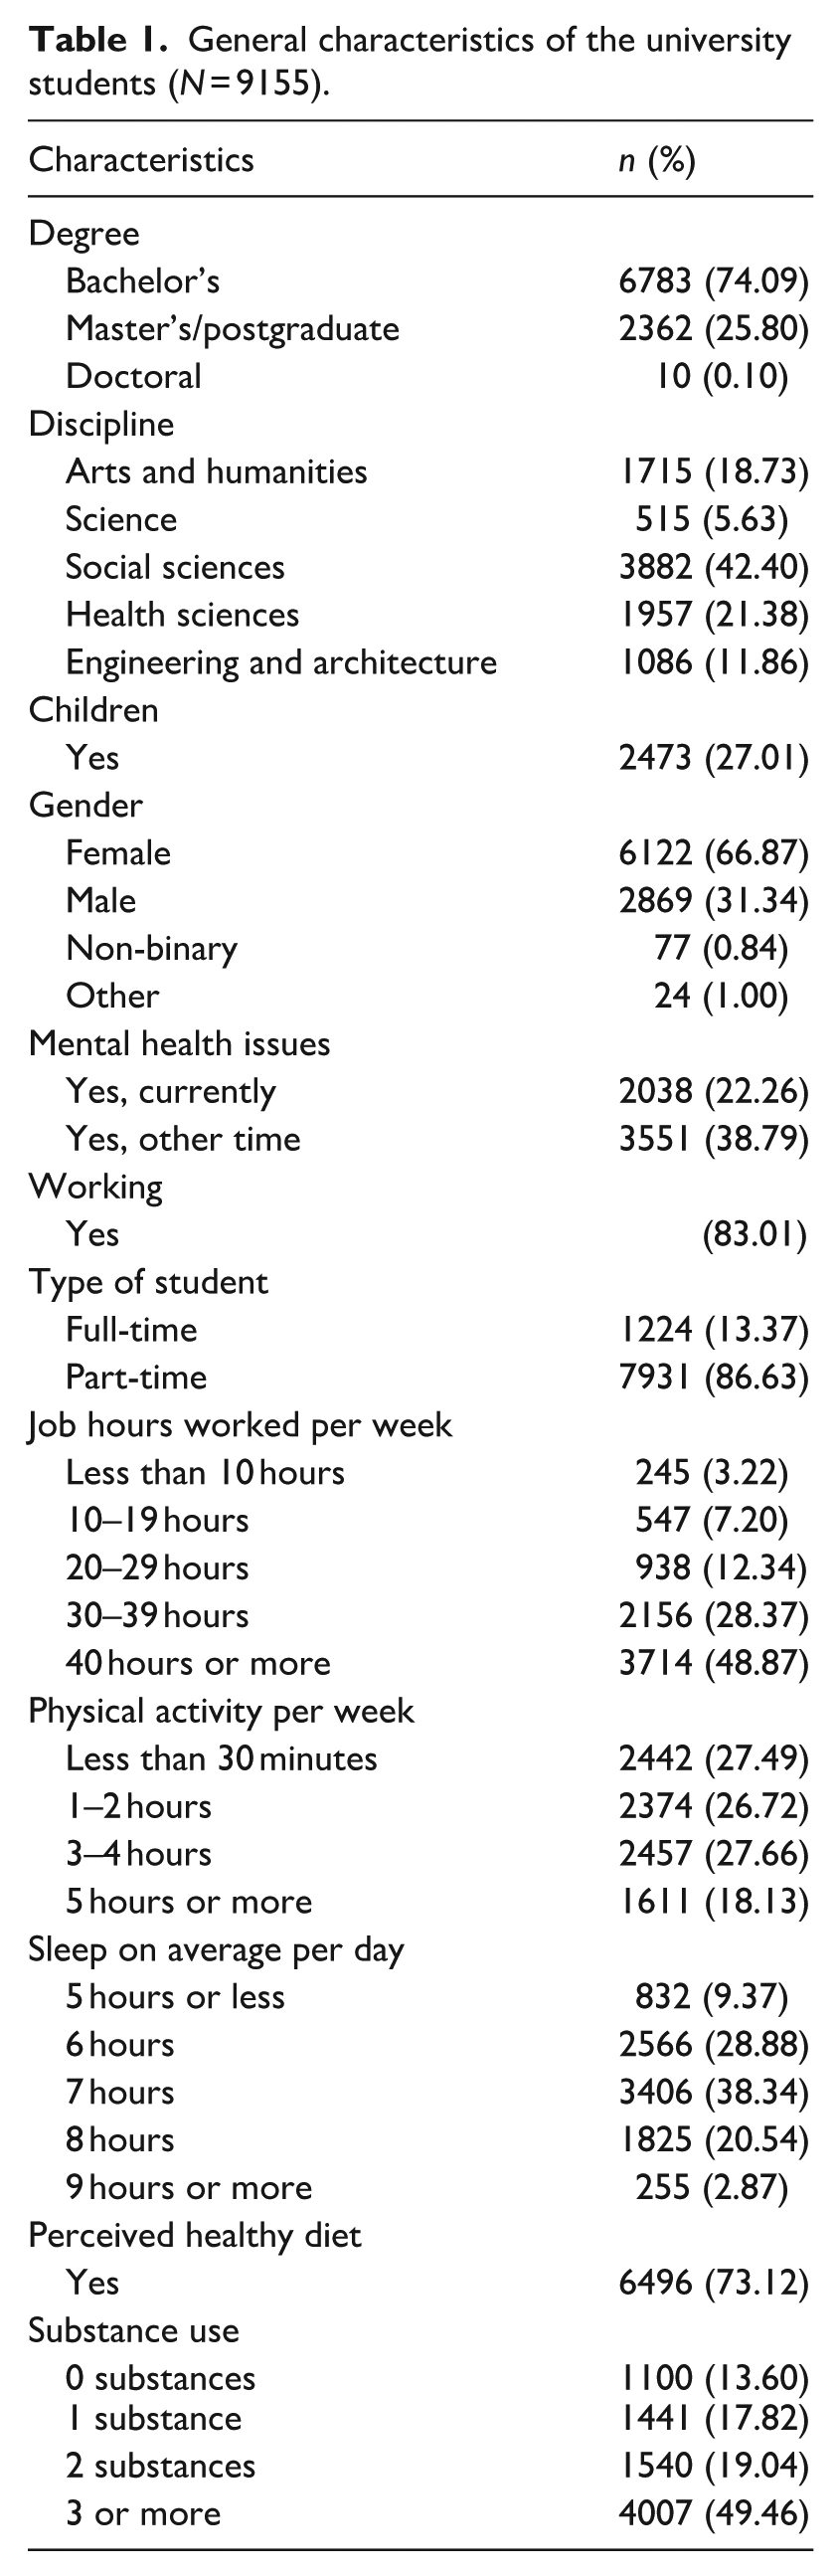
This cross-sectional study was conducted at the Universitat Oberta de Catalunya (UOC), an online university in Catalonia (Spain), with a pedagogical model mainly based on written and asynchronous communication. The study was part of a preliminary research project carried out by the Interuniversity Council of Catalonia (CIC) and with the participation of different universities. Convenience sampling was employed to select participants for the study. The survey was administered to the full student body of the online university (N = 57,792). A total of 9155 students completed the questionnaire, resulting in a response rate of 15.84%. Students were asked to participate and then complete the online survey, which took around 20 minutes. They all signed the informed consent. A total of 66.87% were female, 31.34% male, 0.84% non-binary and 1% other. The mean age was 34.31 years (SD = 10.78). The sample included students from Bachelor’s (74.09%), Master’s/Postgraduate (25.80%) and Doctoral (0.10%) degrees. With regard to degree subject, the majority of students were enrolled in Social Sciences (42.40%), followed by Health Sciences (21.38%), Engineering and Architecture (11.86%), Arts and Humanities (18.73%) and Science (5.63%). Table 1 contains a summary of other personal data corresponding to the subjects who took part, described further in the Results section.
General characteristics of the university students (N = 9155).
Measures
Instruments were used which assessed sociodemographic and academic data, perceived stress, difficulties related to learning and social interaction, and personal and coping characteristics.
Sociodemographic and academic data
Social and academic variables: an ad-hoc questionnaire was used to assess age, gender, marital status and family situation (family and personal responsibilities). It also collected data on students’ academic situation (field of studies, type of studies and course, studying part-time or full-time, etc.) and employment status (paid work, hours per week of work, etc.).
Physical well-being and health variables: an ad-hoc questionnaire was employed that addressed physical well-being, habits, and health, assessing physical activity, sleep, diet and Internet use.
Variables reflecting history of mental health problems: an ad-hoc questionnaire was used that collected data on any history of mental health problems; it assessed both the presence of mental health problems and different types of treatment received.
Consumption of psychoactive substances and gambling: comprising a questionnaire based on the Ministry of Health, Consumption and Social Welfare’s Survey on alcohol and drugs in Spain 2019–20 (EDADES) assessing behaviors revolving around drug consumption, gambling and betting. Items are rated on a five-point scale (Never = 1; Rarely = 2; Sometimes = 3; Often = 4; Very often = 5).
Perceived stress
Academic burnout (burnout syndrome): measured using the Maslach Burnout Inventory-Student Survey (MBI-SS; Schaufeli et al., 2002), which consists of 15 items scored on a Likert scale with 7 response alternatives from 0 (Never) to 6 (Every day). The scale assesses three dimensions of academic burnout syndrome: emotional exhaustion; cynicism; and personal efficacy. High scores in the dimensions of emotional exhaustion and cynicism and low scores in the dimension of personal efficacy are indicators of burnout. The risk of burnout is found in scores above 2.8 in the emotional exhaustion dimension, above 2.3 in the cynicism dimension, and below 3.8 in personal efficacy.
Life satisfaction: using the Satisfaction with Life Scale (SWLS; Diener et al., 1985), which consists of five items on a Likert scale, with seven response options between 1 (Strongly disagree) and 7 (Strongly agree). Scores range from 5 to 35, with higher scores indicating greater satisfaction with life and a score below the 15–19 range indicating that the person is not very satisfied with life. An analysis of the reliability of the Spanish version of the scale indicated that it has good internal consistency (α = 0.84; Atienza et al., 2000).
Difficulties related to learning and social interaction
Symptoms of attention-deficit/hyperactivity disorder (ADHD): the self-reported ADHD Screening Questionnaire was used (Adult ADHD Self-Report Scale, ASRS-V1.1, Kessler et al., 2005), which consists of 18 items rated on a 5-point scale (Never = 0; Rarely = 1; Sometimes = 2; Often = 3; Very often = 4) to assess symptoms of ADHD. An abbreviated version of six items was developed from this questionnaire and used in this survey. Higher scores indicate greater frequency and intensity of ADHD symptoms (Kessler et al., 2005, 2007).
Specific learning problems: the authors developed their own measure consisting of three items rated on a five-point scale (Never = 1; Rarely = 2; Sometimes = 3; Often = 4; Very often = 5). This brief screening measure was designed to detect learning difficulties such as dyslexia and dyscalculia. Higher scores indicate greater frequency and intensity of symptoms related to learning problems.
Personal and coping characteristics
Resilience: measured using the Connor-Davidson Resilience Scale (CD-RISC-10; Campbell-Sills and Stein, 2007; Notario-Pacheco et al., 2011), which consists of 10 items in Likert format with 5 response options (0 = Never; 4 = Almost always) to assess psychological resilience. A score of less than or equal to 23 indicates a higher risk of depression; higher scores indicate greater resilience.
Procedure
This was coordinated by the Interuniversity Council of Catalonia (Consell Interuniversitari de Catalunya), the vice-rector of students at the university sent students a link to the survey to collect their responses via email on March 27, 2023. On April 17 of the same year, a reminder email was sent to those who had not yet participated. Access to the survey was closed on May 2, 2023. The survey was managed through the Qualtrics platform. In all cases, administration followed the current regulations on data protection, and the procedure was approved by the Ethics Committee of the Universitat Autònoma de Barcelona and endorsed by the Ethics Committee of the Universitat Oberta de Catalunya (number CEEAH 6139). The sample did not receive any type of compensation for their participation.
Data analysis
All statistical analyses were completed using SPSS Statistics for Windows Version 29.0 (SPSS Inc., Chicago, IL, USA). Descriptive statistics (percentages, mean, median or DT, depending on the measurement scale of each variable) were used to describe the study population and gain insight into the scores obtained for the main concepts.
Next, factors associated with the three dimensions of academic burnout among university students were analyzed by means of multiple logistic regression using the backward method. The level of significance for the statistical tests was established as p-value < 0.05. To this end, the dichotomous variables generated from the cut-off points indicated the risk of burnout exhaustion (>2.8), burnout cynicism (>2.3) and burnout efficacy (<3.8), as well as low satisfaction with life (⩽19) and depression risk/resilience (⩽23), as previously defined in the measurements section. In addition, predictor variables were entered into the analysis as previously generated dummy variables. Different response categories were used for this, including gender, history of mental health problems, studying part-time or full-time, employed, children, hours worked per week, physical activity, sleep hours, healthy diet perception, and substance use. Multicollinearity was assessed by running a linear regression with the same set of predictors used in the logistic models. All tolerance values were above 0.20 and all VIFs were below 5, indicating no evidence of problematic multicollinearity.
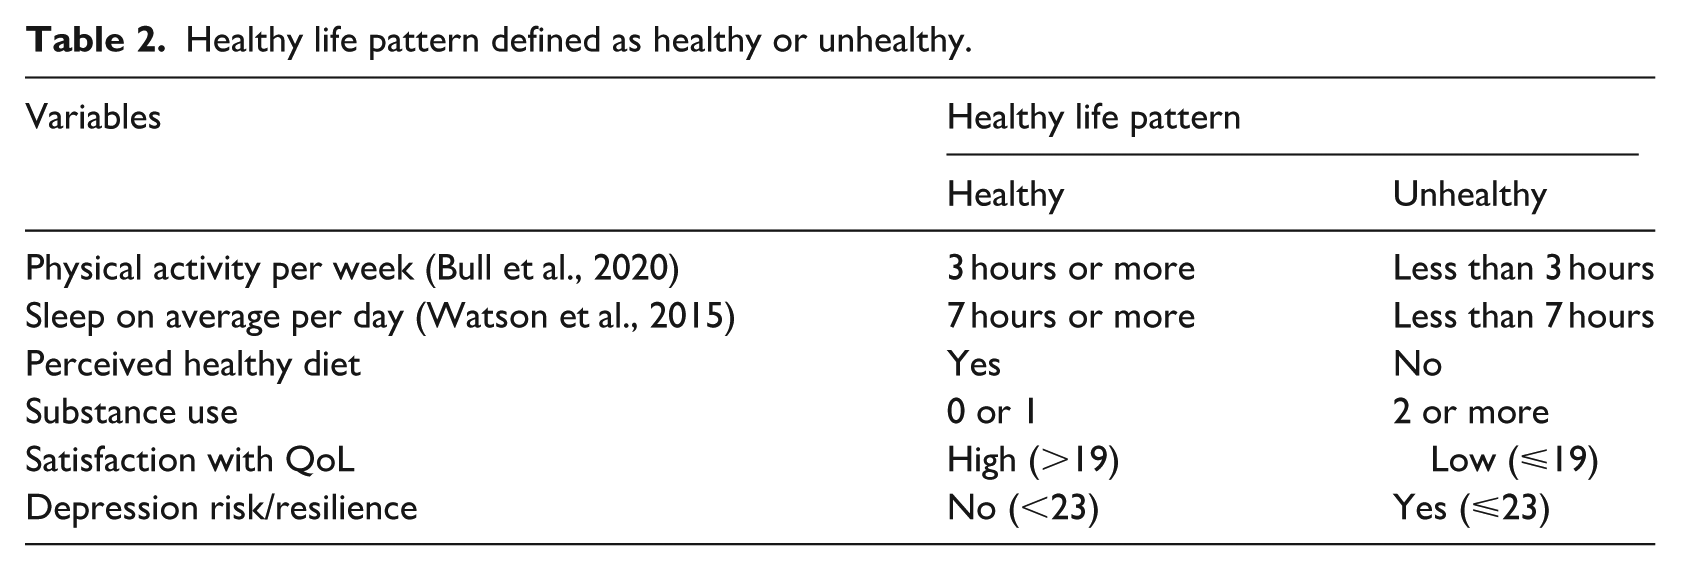
Lastly, a variable called “healthy life pattern” was created, with two extreme values: healthy and unhealthy. Values related to routines surrounding exercise, sleep duration, food, substance use, life satisfaction, and depression risk were used (see Table 2). Two extreme subgroups of online university students with healthy life patterns were compared to analyze the impact on academic burnout scores. The GLM Univariate analysis (UNIANOVA) was conducted to compare the academic burnout scores of students with different demographic characteristics and healthy life patterns; p < 0.05 indicated statistically significant differences, and effect sizes were calculated, meaning adjusted R square and partial eta squared is provided as an estimate of variance explained within the sample.
Healthy life pattern defined as healthy or unhealthy.
Results
Descriptive statistics
Table 1 presents a specific breakdown of participants’ personal variables (demographics and health behaviors) that play the role of possible predictors of academic burnout.
The majority of the participating students were studying part-time (86.63%) and employed (83.11%), and a significant portion of them worked 40 hours or more per week (48.87%). Additionally, 27.01% had children. Furthermore, 22.26% were experiencing mental health issues at the time of the study, and 38.79% had mental health issues in the past. Notably, only 27.49% of respondents reported doing less than 30 minutes of physical activity per week, while 26.72% stated that they did 1 or 2 hours. A total of 61.45% reported sleeping 7 hours or more every day on average, while 73.12% claimed to have a healthy diet. However, only 13.60% reported consuming no substances at all, while 17.82% stated that they consumed one substance (such as alcohol, tobacco, narcotics, etc.). The remaining 68.58% of respondents said they regularly consumed multiple substances.
Table 3 provides a summary of the descriptive statistics for each dimension and the questionnaires mentioned in the measures section, together with the total mean, SD, median, minimum, and maximum scores for each. With regard to academic burnout, the students surveyed scored high in burnout exhaustion (m = 3.28; SD = 1.70), but obtained very satisfactory scores for burnout cynicism (m = 1.54; SD = 1.75) and efficacy (m = 4.24; SD = 1.19).
Descriptive statistics for academic burnout dimensions and predictor scales scores.
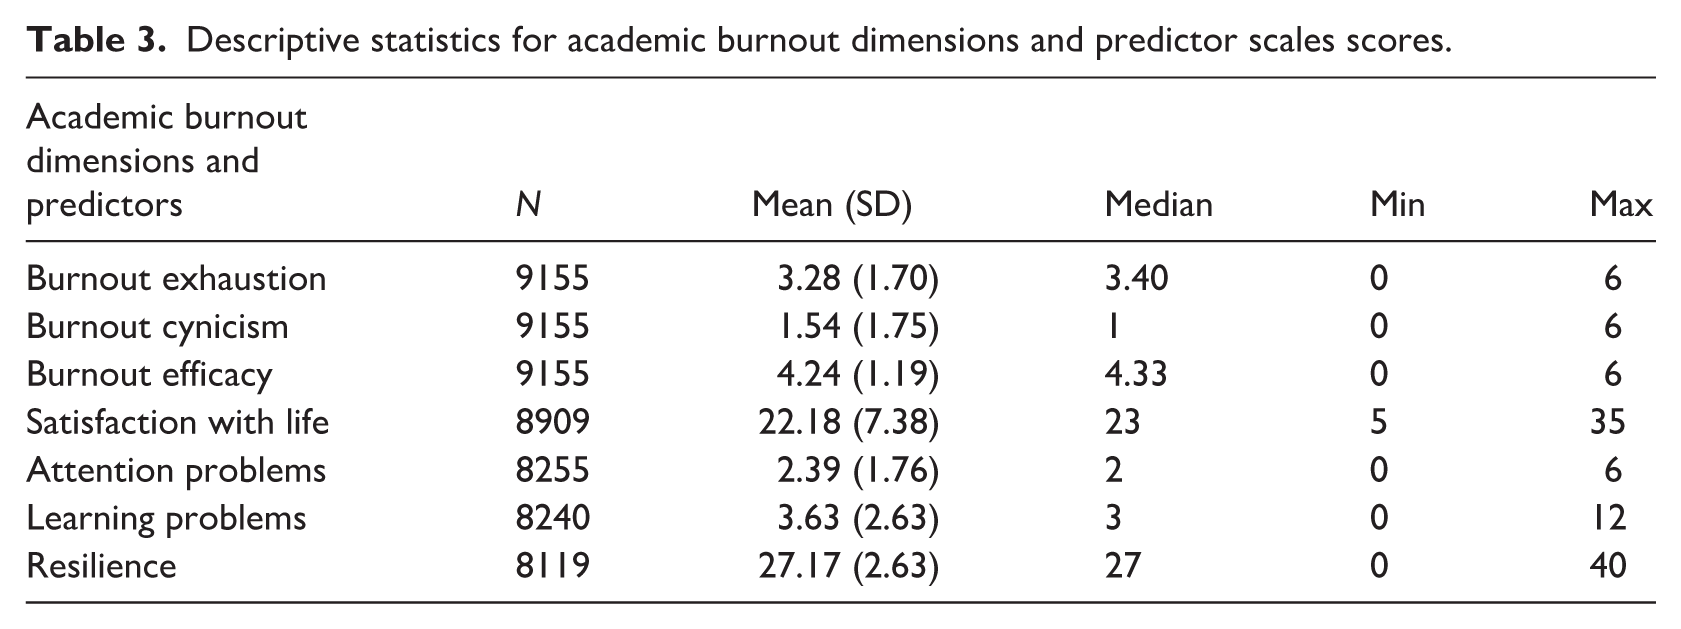
Furthermore, the students exhibited a modest degree of resilience (m = 27.17; SD = 2.63) and life satisfaction (m = 22.18; SD = 7.38), as well as lower scores for learning difficulties (m = 3.63; SD = 2.63) and attention problems (m = 4.24; SD = 1.19).
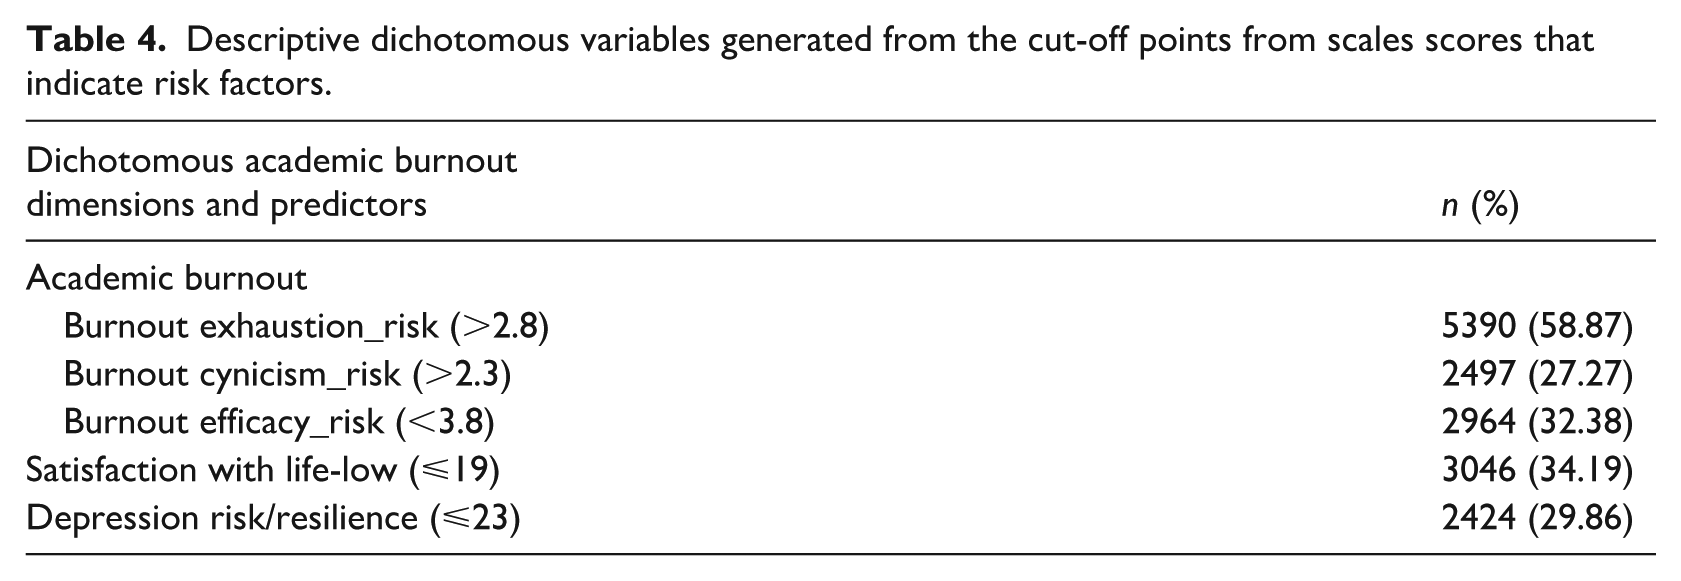
Table 4 summarizes the descriptive dichotomous academic burnout dimensions and predictors generated from the cut-off points.
Descriptive dichotomous variables generated from the cut-off points from scales scores that indicate risk factors.
Predictors of academic burnout in online university students
Logistic regression was used to analyze the impact of risk and protective factors on the surveyed university students’ stress, measured using the three dimensions of academic burnout (Tables 5–7). Using the backward model, the main risk factors related to burnout exhaustion risk were found to be getting little sleep, especially less than 5 (OR = 2.51; 95% CI 2.00–3.14) and less than 6 hours a day (OR = 1.61; 95% CI 1.39–1.88). The next most important risk factors were having low satisfaction with their quality of life (OR = 1.57; 95% CI 1.38–1.79), being female (OR = 1.24; 95% CI 1.10–1.39), and getting little exercise (30 minutes or less: OR = 1.24; 95% CI 1.09–1.41 and 1–2 hours: OR = 1.27; 95% CI 1.11–1.44). A further finding was that higher scores on attention difficulties (OR = 1.19; 95% CI 1.15–.24) and learning problems (OR = 1.13; 95% CI 1.10–1.16) had little impact on academic burnout, while working hours (less than 20 hours: OR = 1.22; 95% CI 1.03–1.46) and depression risk (low resilience; OR = 1.20; 95% CI 1.05–1.38) had relatively little influence. On the other hand, having children was observed to be a protective factor (OR = 0.70; 95% CI 0.62–0.78). It is worth noting that having mental health issues at the time of the survey was not significant (p = 0.075). Although the proposed model of burnout exhaustion risk, was statistically significant, it only explained 18% of the variance in burnout exhaustion (chi-square = 940.62; df = 13, p < 0.001; Cox & Snell R2 = 0.13; Nagelkerke R2 = 0.18). See all statistics in Table 5.
Backward logistic regression predictors of burnout exhaustion risk (N = 6604 cases).
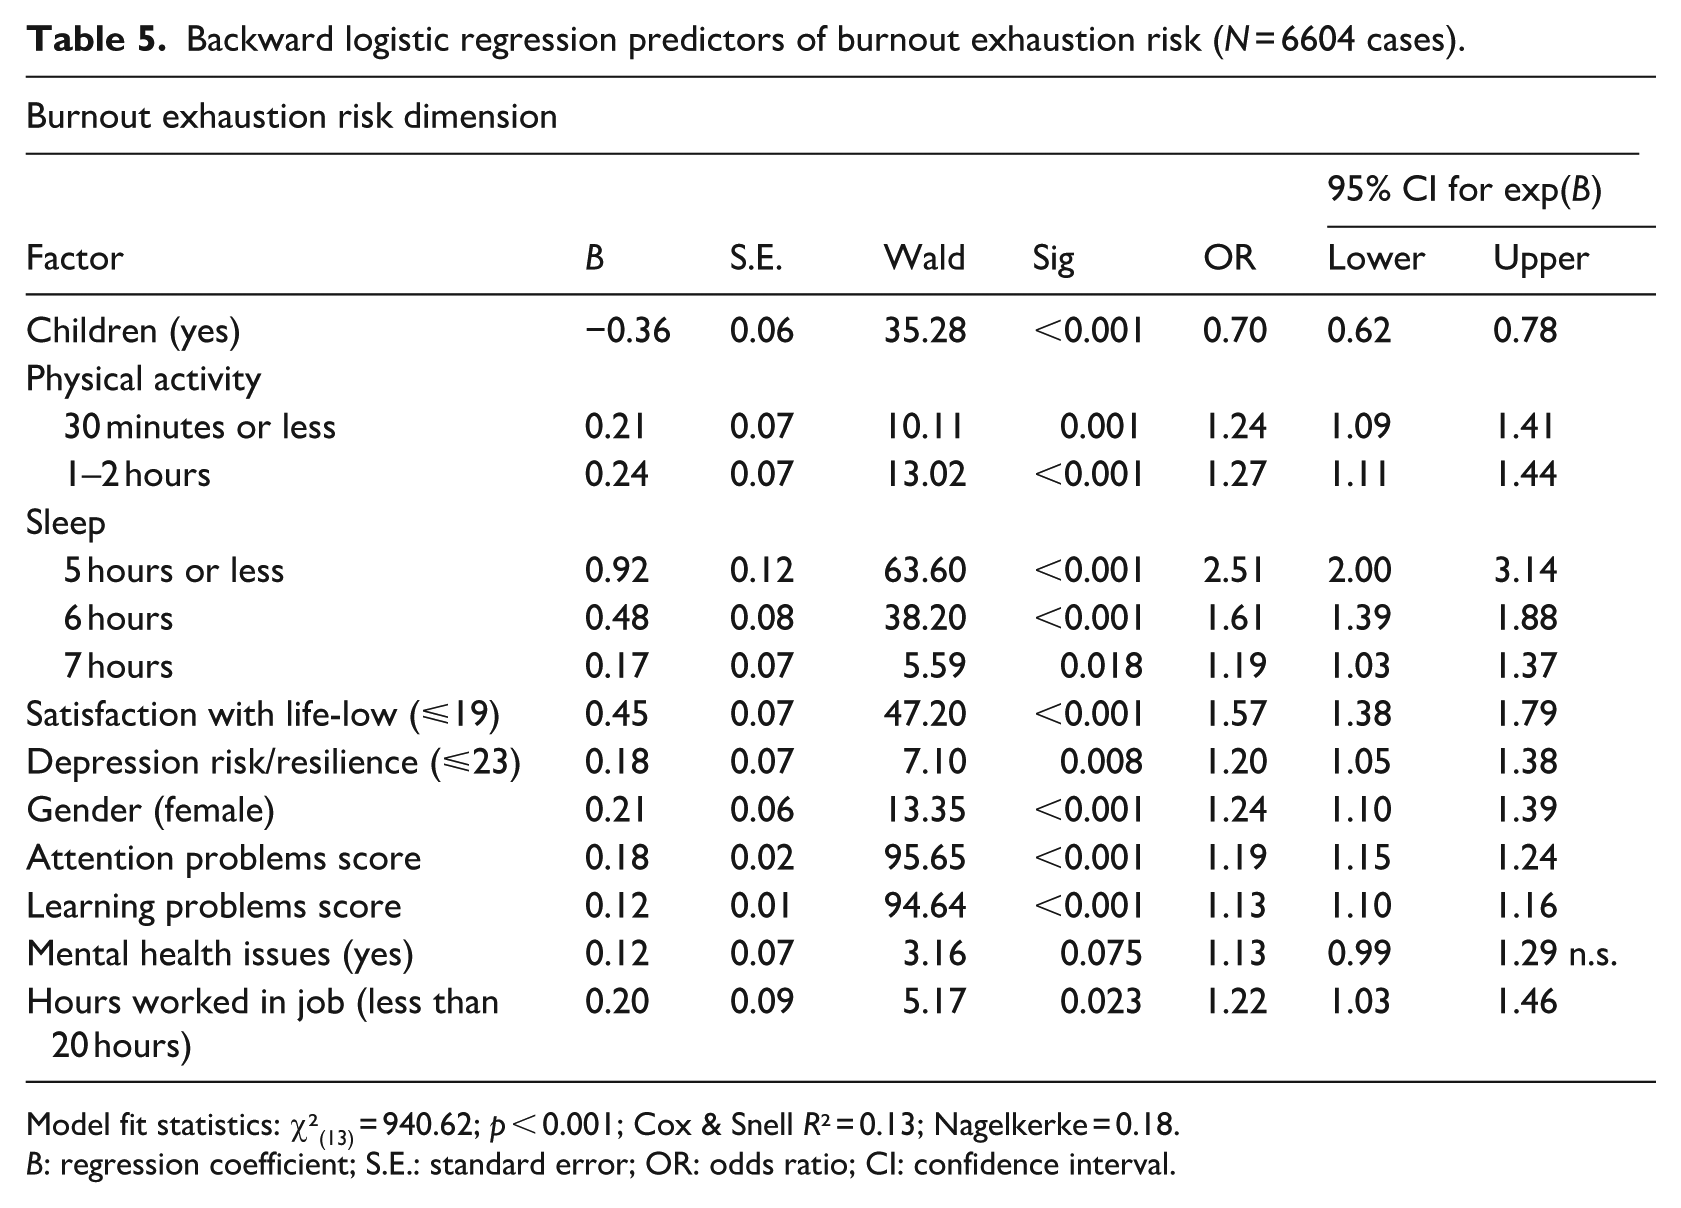
Model fit statistics: χ²(13) = 940.62; p < 0.001; Cox & Snell R² = 0.13; Nagelkerke = 0.18.
B: regression coefficient; S.E.: standard error; OR: odds ratio; CI: confidence interval.
Backward logistic regression predictors of burnout cynicism risk (N = 6604 cases).
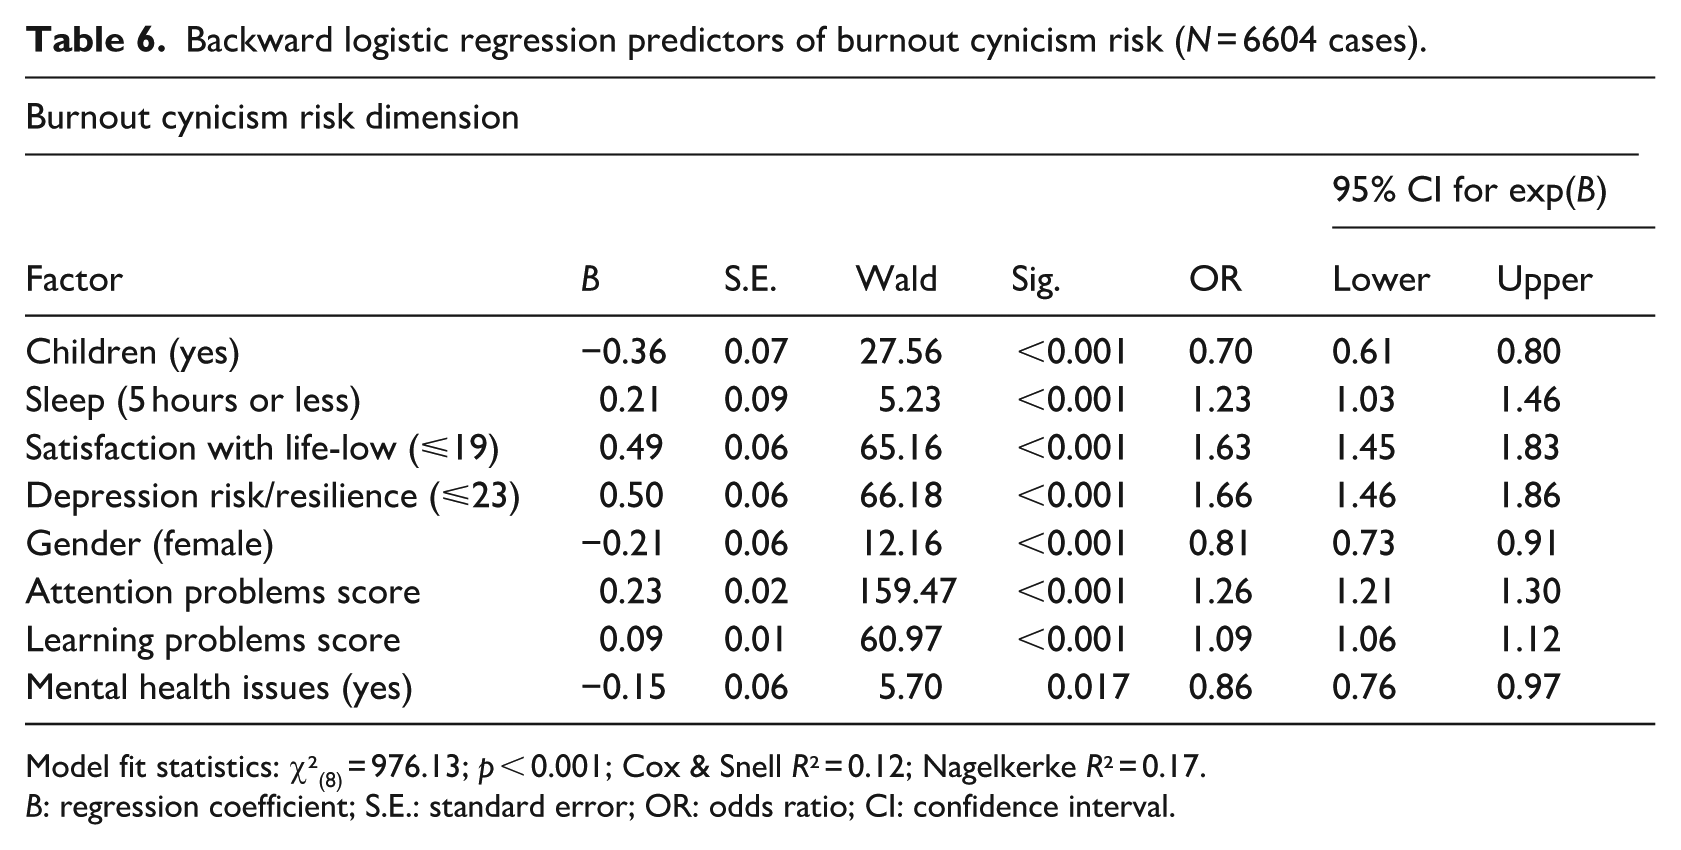
Model fit statistics: χ²(8) = 976.13; p < 0.001; Cox & Snell R² = 0.12; Nagelkerke R² = 0.17.
B: regression coefficient; S.E.: standard error; OR: odds ratio; CI: confidence interval.
Backward logistic regression predictors of burnout efficacy risk (N = 6604 cases).
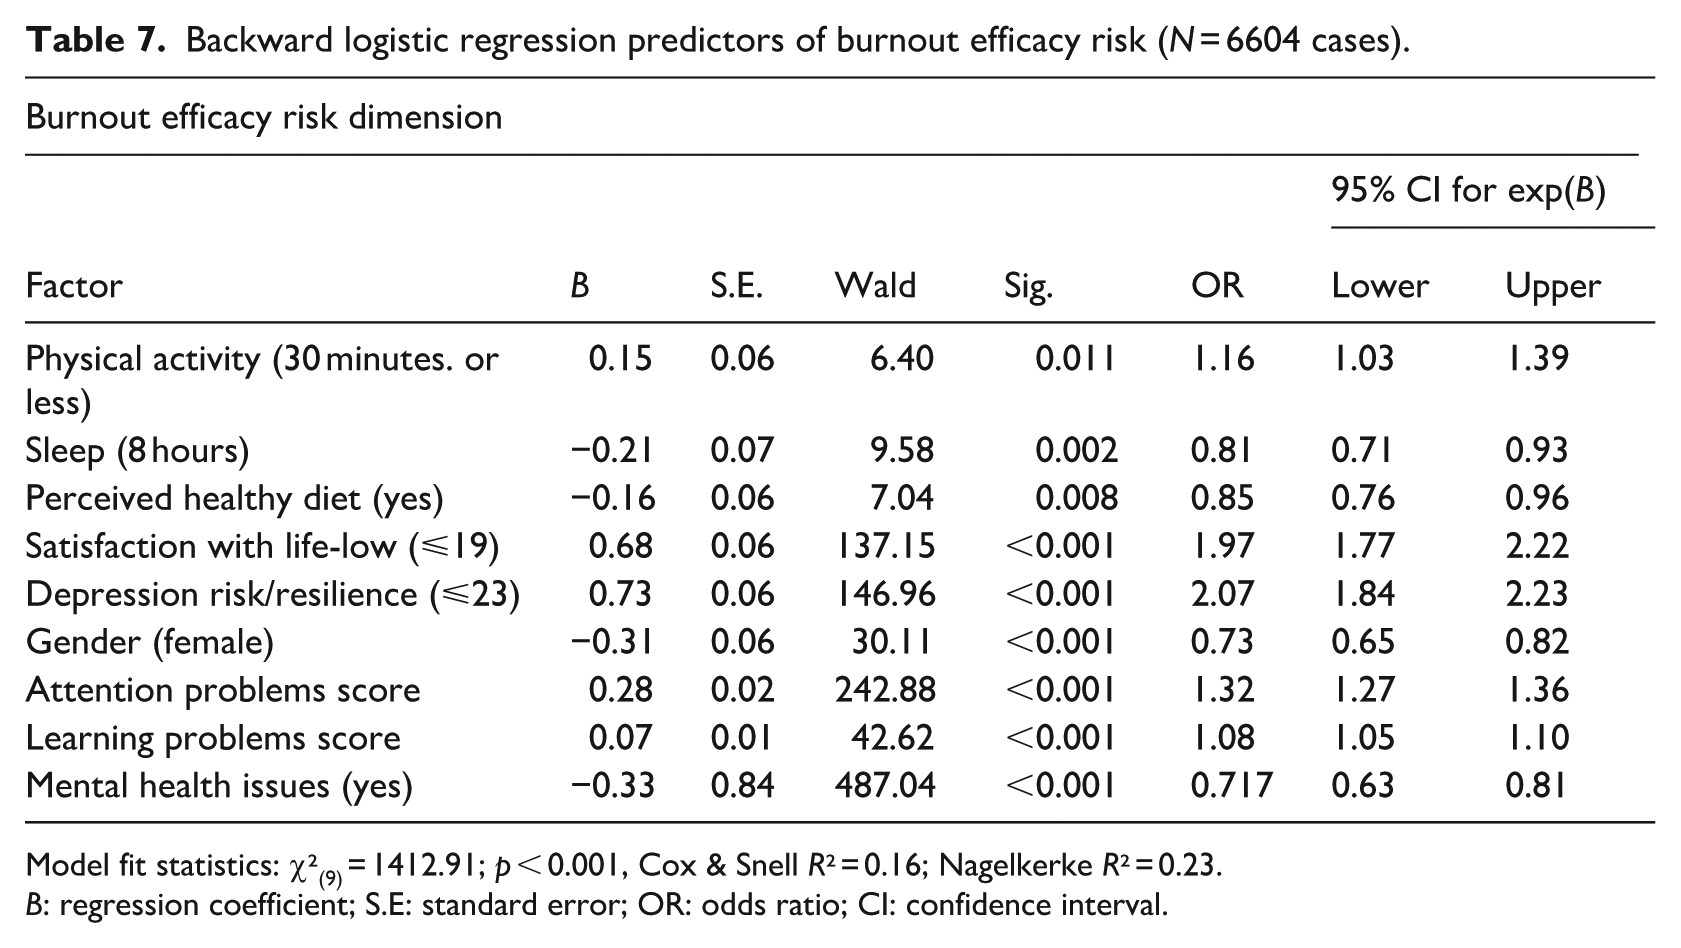
Model fit statistics: χ²(9) = 1412.91; p < 0.001, Cox & Snell R² = 0.16; Nagelkerke R² = 0.23.
B: regression coefficient; S.E: standard error; OR: odds ratio; CI: confidence interval.
Table 6 shows that having low satisfaction with quality of life (OR = 1.63; 95% CI 1.45–1.83), depression risk (OR = 1.66; 95% CI 1.46–1.86), and attention problems (OR = 1.26; 95% CI 1.21–1.30) were the key risk factors when it came to the risk of burnout cynicism. Though less significant, having less than 5 hours of sleep per day (OR = 1.23; 95% CI 1.03–1.46) and learning difficulties (OR = 1.09; 95% CI 1.06–1.12) were also observed to have an effect. Having children was found to be a protective factor (OR = 0.70; 95% CI 0.62–0.78), while, in complete contrast to burnout exhaustion, being a woman (OR = 0.70; 95% CI 0.62–0.78) was also a protective factor with regard to burnout cynicism. Having mental health issues at the time of the survey was significant (p = 0.017) and also had the tendency to be a protective factor (OR = 0.86; 95% CI 0.76–0.97), although it had little impact. The proposed model of risk of burnout cynicism accounted for 17% of the variance with regard to the risk of burnout cynicism (chi-square = 976.13; df = 8; p < 0.001; Cox & Snell R2 = 0.12; Nagelkerke R2 = 0.17). See all statistics in Table 6.
The results of the third component, burnout efficacy risk, suggest that depression risk (low resilience; OR = 2.07; 95% CI 1.84–2.23), low satisfaction with quality of life (OR = 1.97; 95% CI 1.77–2.22), and attention difficulties (OR = 1.32; 95% CI 1.27–1.36) were the primary risk factors. Fewer effects were found for learning difficulties (OR = 1.13; 95% CI 1.10–1.16) and getting little exercise (30 minutes or less: OR = 1.16; 95% CI 1.03–1.39). Additionally, having the perception of a healthy diet (OR = 0.71; 95% CI 0.71–0.93), being a woman (OR = 0.73; 95% CI 0.65–0.82), sleeping for at least 8 hours a day (OR = 0.81; 95% CI 0.71–0.93), and currently experiencing mental health issues seemed to lower the score of burnout efficacy and act as protective factors. In this instance, 23% of the variance in burnout efficacy risk can be explained by the proposed model (chi-square = 1412.91; df = 9, p < 0.001, Cox & Snell R2 = 0.16; Nagelkerke R2 = 0.23). See all statistics in Table 7 and a summary of the factors predictors of the three dimensions of academic burnout in Table 8.
Summary of the factors predictors of the three dimensions of academic burnout.
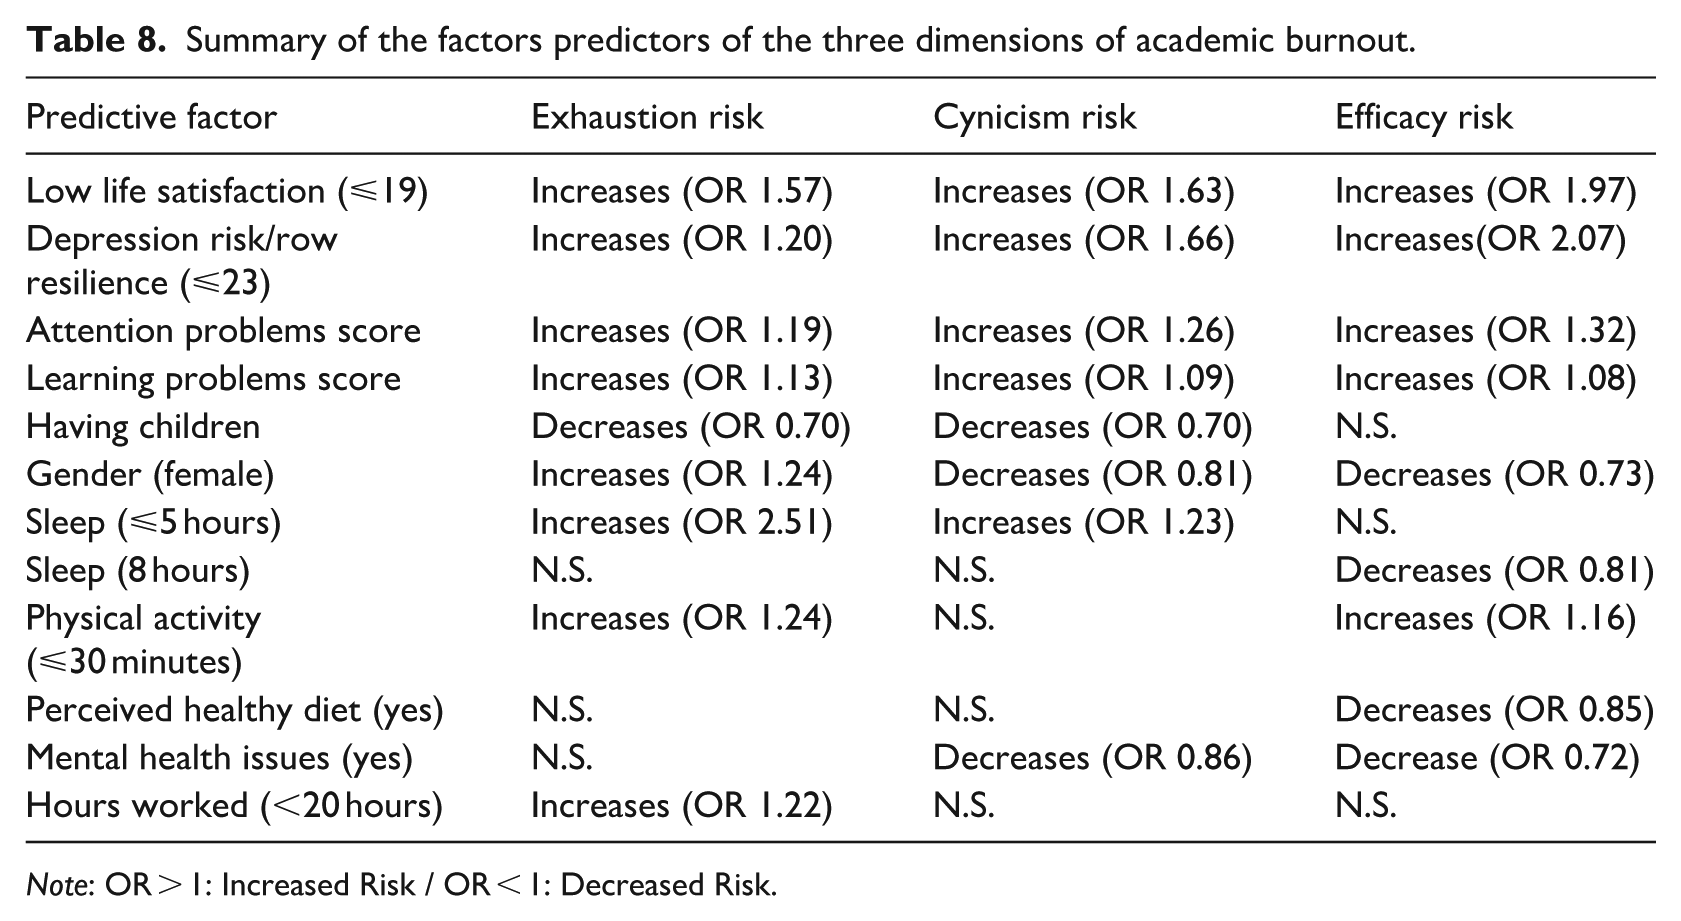
Note: OR > 1: Increased Risk / OR < 1: Decreased Risk.
How a healthy life pattern influences burnout scores in online university students
Once the key stress indicators had been identified, a comparative study was conducted with two extreme subsample groups of participants based on their adherence to a life pattern classified as more or less healthy. Values deriving from the students’ routines related to exercise, sleep duration, diet, substance use, life satisfaction, and depression risk were used to define these groups (see Table 2). Other predicted characteristics were also added to the ANOVA test model, including gender and having children.
Figure 1 shows the mean and confidence interval (95%) for burnout exhaustion scores, as well as the interaction effect according to having children and a healthy life pattern (F = 5.12; df = 1, 643; p < 0.024; η2 = 0.008). The most significant factor was observed to be the healthy life pattern (F = 130.75; df = 1, 643; p < 0.001; η2 = 0.17).
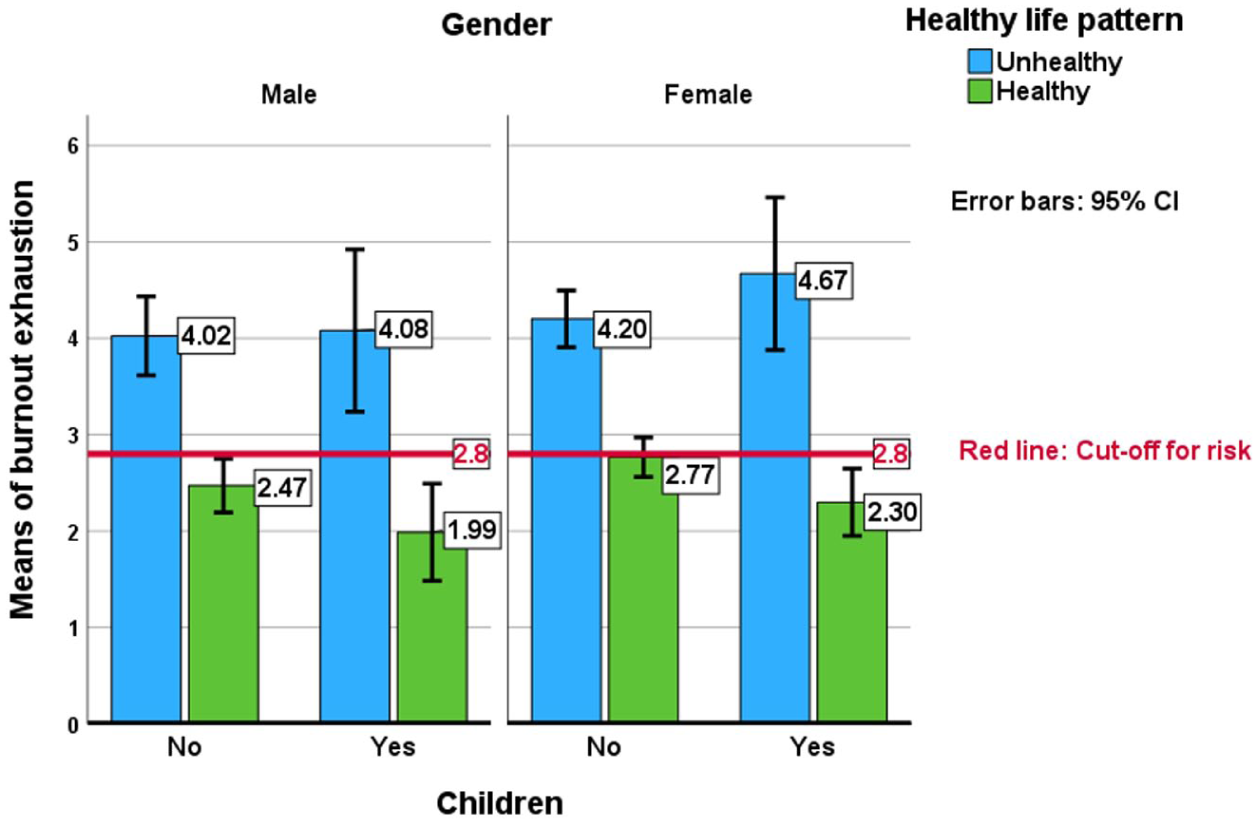
Burnout exhaustion scores, mean and confidence interval (95%) by gender, children, and healthy life pattern (N = 651 cases).
If we analyze simple effects, we see that the combination of being female, having an unhealthy life pattern, and having children are the factors that most significantly increased burnout exhaustion scores (M = 4.67; 95% CI 3.99–5.35), exceeding the cut-off point (2.8). On the other hand, being a man, having a healthy life pattern, and having children is the combination of factors that most reduced burnout exhaustion scores (M = 1.99; 95% CI 1.56–2.42) below the cut-off. The result of the adjusted R2 of the ANOVA model was 0.20.
Figure 2 shows the mean and confidence interval (95%) for burnout cynicism scores, as well as the interaction effect according to the three factors: gender, having children, and a healthy life pattern (F = 6.49; df = 1, 643; p < 0.011, η2 = 0.01). Again, the most significant factor was observed to be the healthy life pattern (F = 295,16, df = 1, 643, p < 0.001, η2 = 0.16).
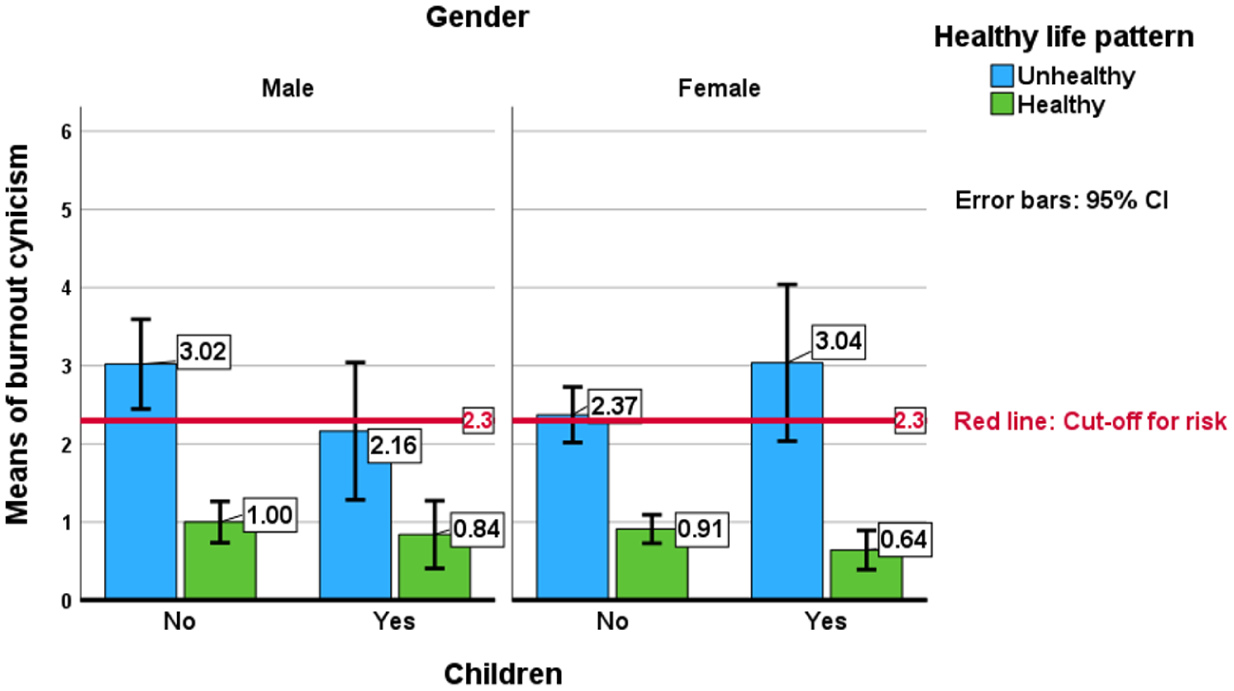
Burnout cynicism scores, mean and confidence interval (95%) by gender, children, and healthy life pattern (N = 651 cases).
The combination of being a woman, having an unhealthy life pattern, and having children was what increased burnout cynicism scores the most (M = 3.04; CI 95% 2.7–3.71), with most exceeding the cut-off (2.3) according to the analysis of simple effects. Conversely, having children lowered the score for men’s burnout cynicism scores (M = 2.16; CI 95% 1.49–2.83). However, the healthy life pattern, where all means and confidence intervals (95%) were below the cut-off, was again found to be the most relevant factor. The ANOVA model’s adjusted R2 was 0.21.
Lastly, Figure 3 displays the mean and 95% confidence interval for burnout efficacy scores. The healthy life pattern is also the primary significant factor in this instance, with no interaction impact identified (F = 240.71; df = 1643; p < 0.001; η2 = 0.27). Subjects with a healthy life pattern, regardless of gender or having children, had positive burnout efficacy ratings over the cut-off point (3.8), while those with an unhealthy life pattern had lower scores and were below the cut-off point. The adjusted R2 of the ANOVA model was 0.35.
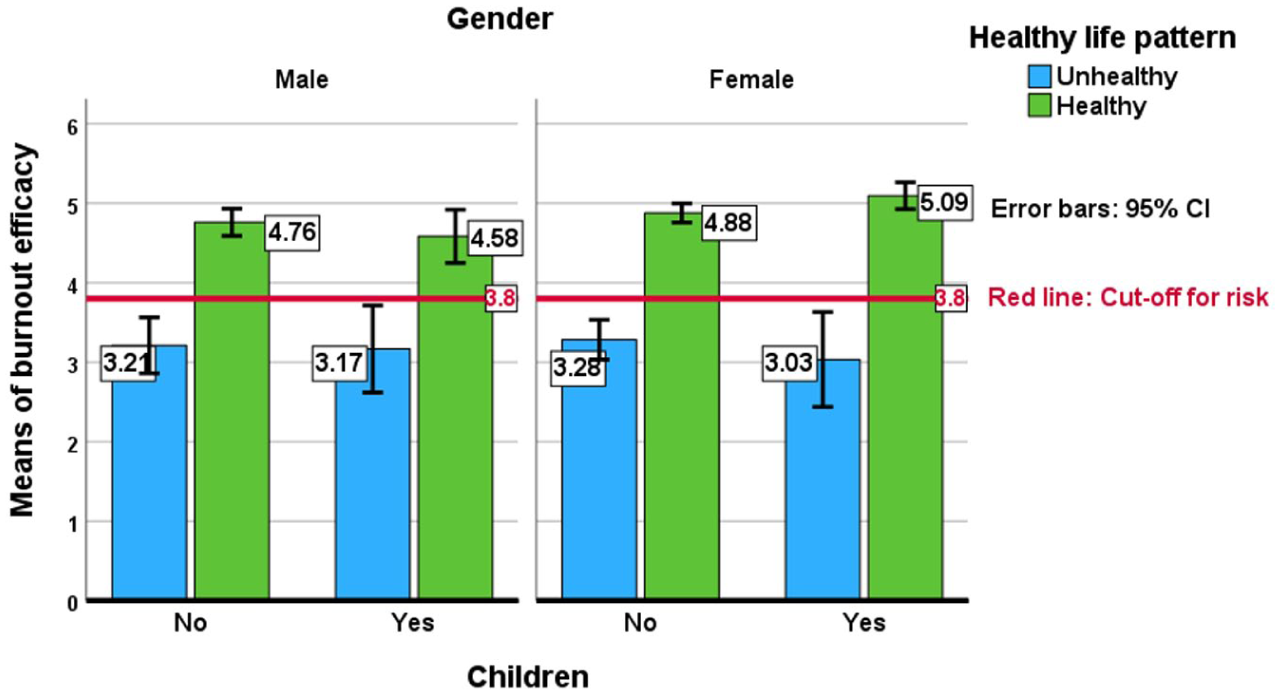
Burnout efficacy scores, mean and confidence interval (95%) by gender, children, and healthy life pattern (N = 651 cases).
Discussion
The objectives of this study were to identify the risk and protective factors associated with stress perceived by online university students and establish profiles based on healthy or unhealthy life patterns.
The demographic characteristics of the sample participants allow us to determine the profile of those students who choose an online university. Unlike the student profile of other face-to-face universities, the vast majority of students study part-time, combining their university studies with other work (mostly full-time) and family responsibilities (Sánchez-Gelabert, 2020). This fact highlights the social function of the online university, expanding the professional and life opportunities of a large part of the population who would not otherwise be able to begin or continue their university studies and undoubtedly addressing the issues of accessibility, diversity and equity in higher education (Bologna Followup Group (BFUG), 2020).
Despite these benefits, online education is not without its difficulties; for example, some research has highlighted the need for self-organization, responsibility, and perseverance in individual work (Shaikh and Asif, 2022; Vonderwell and Savery, 2004) as variables of success in students continuing in online education and attaining academic achievement, as well as the greater probability of their dropping out (Bağrıacık Yılmaz and Karataş, 2022; Shaikh and Asif, 2022). Among the most widely studied variables in this regard is perceived stress (Robotham and Julian, 2006). The findings of the present study reveal high burnout scores for the emotional exhaustion dimension, while the dimensions of cynicism and efficacy were moderate. The former results are in line with the prevalence data previously obtained by other studies for the dimension of emotional exhaustion (Ishak et al., 2013; Olson et al., 2025; Rosales-Ricardo et al., 2021), being even lower than the data obtained in samples of students in face-to-face universities in the same context (Generalitat de Catalunya. Departament de Recerca i Universitats, 2023). However, the results obtained for the dimensions of cynicism and efficacy are comparatively better than those of previous research (Almutairi et al., 2022; Liu et al., 2023; Rosales-Ricardo et al., 2021), even taking as a reference studies on the prevalence of perceived academic burnout during the COVID-19 pandemic (Abraham et al., 2024).
In parallel with these findings on perceived stress, the students’ assessment of their life satisfaction and resilience was adequate. These indicators are particularly relevant when assessing the risks that may arise from students’ perception of stress, as they reflect their belief that they have available resources to overcome stress and that this stress does not significantly impact their level of life satisfaction. It may therefore be viewed as a manageable form of stress, limited to a specific academic situation, which allows students to have a functional and appropriate response to it (Lazarus and Folkman, 1986). At a societal level, the desirable outcome is not for students to avoid all sources of stress, since these are an inevitable part of life, but rather to possess sufficient resources to cope with them effectively. Moreover, stressors should not become the central focus of their lives; instead, students should be able to assign them an appropriate level of importance and confine their stress responses to the specific areas where such stress occurs.
These results can also be interpreted as a sample of the students’ levels of perception regarding their self-efficacy. Previous research has highlighted the mediating role of self-efficacy in the relationship between academic stress and emotional distress (Kamal et al., 2022; Kristensen et al., 2023; Oberst et al., 2022), as well as its potential in effectively preventing student drop-out (Marôco et al., 2020). This may also explain some interesting findings, such as having children as a protective factor in some models. Parenting responsibility can foster a student’s self-efficacy and provide a deeper sense of purpose and motivation, which can protect against academic stressors. In this sense, the relationship between a good parent-child relationship, academic self-efficacy, and academic stress has been very well-defined (Li et al., 2022).
For all these reasons, it would be beneficial for universities to promote two key lines of action in supporting students. The first would involve student support services, including care services and also psychological helplines. These interventions should follow models that promote active coping among students, focusing less on the problem itself and more on identifying and implementing potential solutions. Such an approach aims to enhance students’ self-assessment of their skills and strengthen their sense of self-efficacy (Cilli et al., 2023; Singla et al., 2023). The second key line of action would comprise all those activities that can be promoted in the academic environment to facilitate students’ life satisfaction (cultural activities, theme days, healthy living campaigns, ongoing education courses in other disciplines, etc.; Campbell et al., 2022).
Studying the interaction between the above variables led to the comparison of healthy and unhealthy life patterns, together with the gender variable and having or not having children. This allowed us to develop a better understanding of the effects these factors have on the perception of academic burnout. The results indicated that being a woman, having an unhealthy lifestyle (in terms of hours of sleep, diet, physical exercise, substance use, life satisfaction, and depression risk/resilience), and having children, are the factors that further increase the risk of burnout - emotional exhaustion and burnout-cynicism. In contrast, being a man, having a healthy life pattern, and having children are factors that reduce the risk of burnout in these two dimensions. For the burnout-efficacy dimension, the healthy or unhealthy life pattern was the most relevant factor, above gender and children.
Regarding the interaction between the variables of gender and having children, we believe that a reasonable explanation is that other variables directly related to gender roles and their differences intervene, such as family, sociocultural, and academic variables. Thus, it is common for women to experience family responsibilities (children, dependent relatives, household chores) differently to men due to the greater burden in terms of time, effort, and mental work that they represent (Reich-Stiebert et al., 2023). Women also face greater difficulties in academic development and job promotion (Azmat et al., 2025), and a higher burden derived from emotional work (Grandey, 2000), which translates into greater perceived stress. This must be assessed as a risk factor and taken into consideration by student support services.
Taking these findings into account, the interaction analysis highlights the relevant role of a healthy/unhealthy life pattern above all else, as similarly observed by previous research in other contexts (Verhavert et al., 2024). This has important implications for understanding stress within tertiary education. Demonstrating that a high healthy life pattern is associated with low stress requires university interventions to be designed to be holistic, addressing both students’ habits (sleep and nutrition workshops) and internal resources (life satisfaction and resilience development). On the one hand, it provides clear and straightforward intervention objectives that focus on principles of psychoeducation and behavioral change related to adopting a healthy life pattern, promoting goals that are achievable and implementing appropriate work on motivation and ability (Fogg, 2008). This also means that students themselves must take responsibility for applying these changes and assessing their results, which in turn has effects at the level of self-efficacy (Kamal et al., 2022; Kristensen et al., 2023; Oberst et al., 2022). In this regard, universities play a crucial role in implementing health promotion programs to address the following areas: physical exercise, healthy diet, sleep habits, and substance use. This is particularly important given that healthy habits tend to deteriorate during the academic years (Puente-Hidalgo et al., 2024). Likewise, all those activities and dynamics (open days, courses, workshops, etc.) organized by the university and oriented toward skills training and promoting active coping will have an impact on the perception of self-efficacy, life satisfaction, and resilient coping in the face of adversity.
The above assertions undoubtedly pose a challenge for various health promotion agents, from policies that favor sports and healthy eating on university campuses, benefits and discounts, competitions to increase motivation, dissemination campaigns, and training workshops.
Limitations
First, the cross-sectional approach used to obtain data prevents us from establishing causal relationships between variables. Longitudinal studies will be necessary to assess the influence and course of predictive factors on academic burnout in university students. Furthermore, in these longitudinal studies, it would be appropriate to relate the variables to academic performance. Due to confidentiality issues in the responses, the academic performance variable could not be included in the current study. Nor has it been possible to address the relationship between other confounding factors, such as socioeconomic status or situations of risk and vulnerability, since this would require expanding the data collected on the students’ backgrounds, making the survey and response time longer.
Another limitation to consider is the potential bias of the sample. Firstly, although the sample was very large and the survey was sent to all the students, it is possible that those who responded were particularly interested in or sensitive to issues related to academic stress, emotional distress/well-being, and lifestyles habits. Even so, the response rate obtained (15,85%) is similar to other studies that use extensive online surveys on mental health aimed at university students, without strong incentives or exhaustive follow-up (Wu et al., 2022). Secondly, it should be noted that although the online university has students from all over the world, the results obtained limit their generalizability to other cultural and educational environments.
Finally, the explanatory power of the statistical models was modest, as indicated by Nagelkerke’s R² values (0.17–0.23). Such levels are common and well documented in the behavioral and educational sciences, particularly in large-scale, nonexperimental studies of complex human outcomes (Cohen, 1988). This modest explained variance reflects the inherent complexity of student behaviors, which are influenced by numerous unmeasured and interacting factors, as also reported in previous research on academic burnout (Cuevas-Caravaca et al., 2024; Ye et al., 2021). While the predictors identified produced statistically precise and practically meaningful effects, the findings underscore the need for future research that incorporates additional, nuanced variables and complementary methodological approaches.
Conclusion
The results suggest that a healthy/unhealthy life pattern may play a relevant role, potentially above other factors, in predicting academic burnout. This allows for academic policies to be defined accordingly and provides a guide for student support services. We believe that all the results obtained in the present study reinvigorate the field of health psychology (Garzón and Caro, 2014), which has always been interested in and worked on these issues, but which in our opinion has possibly been ignored in recent years in favor of -not always necessary- more clinical approaches.
Footnotes
Ethical considerations
This study followed the current regulations on data protection, and the procedure was approved by the Ethics Committee of the Universitat Autònoma de Barcelona and endorsed by the Ethics Committee of the Universitat Oberta de Catalunya (number CEEAH 6139).
Consent to participate
All participants provide informed consent before completing the survey.
Consent for publication
Consent for publication is not applicable to this article as it does not contain any identifiable data.
Funding
The authors received no financial support for the research, authorship, and/or publication of this article.
Declaration of conflicting interests
The authors declared no potential conflicts of interest with respect to the research, authorship, and/or publication of this article.
Author contributions
First author participated in the study design, collected the data, and wrote the paper. Second author was responsible for the statistical analysis and wrote the paper. Third author wrote the paper.
Data availability statement
The data that support the findings of this study are available from the corresponding author, upon reasonable request.