
Abstract
This study aimed to adapt and validate the Reward-Based Eating Drive Scale (RED-13) for Brazilian Portuguese and assess its psychometric properties and predictive validity. The adaptation process followed established cross-cultural guidelines, including translation, synthesis, back-translation, expert committee review, and pilot testing. Content validity was evaluated using the Content Validity Index. A total of 452 adults aged 18–59 years, recruited online, participated in the psychometric assessment. Confirmatory factor analysis supported the scale’s three-dimensional structure (RMSEA < 0.0001, SRMR = 0.041, TLI = 1.000, CFI = 1.000). Internal consistency was high (α = 0.921, ω = 0.922). RED-13 BR scores showed moderate correlations with food cravings and weak correlations with body mass index (rho = 0.266, p < 0.001). Receiver operating characteristic analysis indicated predictive ability for pre-obesity and obesity. These findings suggest that the RED-13 BR is a valid and reliable instrument for assessing reward-based eating behavior in Brazilian adults.
Introduction
The global rise in pre-obesity and obesity has highlighted maladaptive eating patterns and reinforced that their causes are complex and multifactorial (Annesi, 2022).
In this context, individuals who have already developed obesity often seek some form of intervention. However, most programs fail to sustain long-term weight loss, which indicates that obesity is still not fully understood by science (van Dillen et al., 2013).
Recent studies indicate that increased hedonic eating, in which food is consumed to relieve or react to emotional states, enhance the pleasure of palatable flavors, or respond to motivational reward and punishment process, promotes eating behaviors that exceed the body’s needs (Berthoud, 2012; Ünal et al., 2025). This pattern leads to higher energy intake. Frequent consumption for hedonic reasons, combined with persistently elevated energy intake, contributes to weight gain and the development of obesity (Annesi, 2022; Sutton et al., 2022).
Individuals with persistent difficulty losing weight and experiencing chronic relapses often report a lack of control overeating, eating quickly without feeling satisfied, and excessive preoccupation with food (Kessler, 2010). These experiences resemble what has been described as reward-based eating (Epel et al., 2014). Reward-based eating is closely related to uncontrolled eating but is conceptualized as a developing pathophysiological state driven by excessive activation of brain reward circuits (Le Moal and Koob, 2007; Volkow et al., 2013). As individuals repeatedly seek highly rewarding foods, this process contributes to an increasing loss of control and a greater likelihood of chronic relapses. Recent studies have also associated reward-based eating with the diagnosis and prediction of metabolic alterations (Epel et al., 2014; Mason et al., 2017; Vainik et al., 2019b).
Despite recent advances in eating behavior assessments, until the creation of the 13-item RED, there was no known self-reporting tool designed to encompass the thoughts and behaviors characterizing reward-based eating across its entire spectrum and related to weight or weight gain (Epel et al., 2014; Mason et al., 2017; Vainik et al., 2019a).
The RED-13 aims to identify the pursuit of gratification in eating across a spectrum ranging from milder stages to the most severe on the continuum (Epel et al., 2014; Mason et al., 2017; Vainik et al., 2019a). At the lowest extreme of the spectrum, eating behavior can occur in the absence of impulsive symptoms and be considered as “passive overeating.” At the opposite extreme, excessive eating is characterized by episodes of binge eating and severe loss of control over food intake (Davis, 2013). When associated with reward sensitivity, uncontrolled eating has a higher propensity for seeking and experiencing pleasurable sensations (Lucas et al., 2000).
The Reward-Based Eating Drive Scale was initially developed as a nine-item instrument (Epel et al., 2014) and later expanded into a 13-item version with enhanced psychometric performance (Mason et al., 2017). Since then, the RED-13 has gained increasing international attention. The Turkish adaptation was recently validated by Yavuz et al. (2025). A Spanish version is currently being implemented in two randomized controlled trials (Bernat-Villena et al., 2025; Solier-López et al., 2022), and German adaptations of both the RED-9 and RED-13 have been developed and preliminarily evaluated in a preprint (Herhaus et al., 2024).
The aim of this study was to perform the cross-cultural adaptation and validation of the Reward-Based Eating Drive Scale (RED-13) into Brazilian Portuguese and examine its ability to relate to pre-obesity or obesity status, so that we can make timely interventions and, in the future, identify individuals at risk of weight gain over time, helping to control the growing obesity epidemic.
This is a cross-sectional methodological study focused on the cross-cultural adaptation and validation of the RED-13 scale, conducted in two distinct stages. The initial stage encompassed translation and cross-cultural adaptation and content validity. The subsequent stage involved validation, reliability assessment, and an evaluation of the Brazilian Portuguese version of the RED-13′s ability to relate to pre-obesity or obesity status, as clinically defined. The Reward-Based Eating Drive Scale (RED-13), originally developed by Mason et al. (2017), was included in this study with the authors’ authorization.
Stage 1
The aim was to cross-culturally adapt the RED-13 to Brazilian Portuguese, in accordance with the semantic, idiomatic, cultural, and conceptual characteristics of the Brazilian population, and to then evaluate its content validity.
Materials and methods
The cross-cultural adaptation was performed as described by Beaton et al. (2007), from July to August 2022 and therefore followed the following steps: translation (1), synthesis of translations (2), back-translation (3), expert committee (4), pre-test (5), and feedback on the final version (6). The first step consisted of the translation of the scale (1) from English to Brazilian Portuguese, which was performed by two translators who are native speakers of Portuguese and fluent in English, and they produced two versions, T1 and T2. After the first process was complete, the translated versions were compared and combined (2), producing a single translation, T12. In the back-translation step (3), the T12 version was translated back into English by two translators who are native speakers of English and fluent in Portuguese, RT1 and RT2, and generated version RT12. This was carried out to ensure that the translated version had the same meaning as the original. This version was sent to the original authors for approval.
The material was then sent to Committee of Experts (4), which was composed of professional experts in the subject matter from all the regions of Brazil (South, Southeast, Midwest, North, Northeast). They analyzed the previously translated version according to the degree of equivalence: semantic, idiomatic, cultural, and conceptual, and recorded the results in the equivalence analysis form to calculate the Content Validity Index (CVI, explained in more detail below). This index allowed us to perform the first validity analysis, the content validity. Afterward, the pre-final version was applied to a diverse sample of 37 subjects in the pilot test stage (5). These included research group members, students, professors, university staff, family members, and healthcare professionals. They answered the scale and subsequently filled out a questionnaire assessing the clarity and comprehensibility of the items. After all stages were complete, the tool was reviewed and the final version (6) of the scale was created. The originals authors received this, along with all the documentation from the process, to provide their input.
Tools
During this stage, the following questionnaires were administered to the Committee of Experts (a) and the participants (b). The original authors (c) received a file containing the final material:
(a) Equivalence Analysis form: The Expert Committee had the original version, T12, and RT12 and final version for semantic, idiomatic, cultural, and conceptual equivalence. The CVI index was employed to assess the Content Validity. The response options were: 1 = not equivalent, 2 = impossible to evaluate equivalence without revision, 3 = equivalent but requires minor changes, 4 = absolutely equivalent.
(b) Questionnaire on item clarity and understanding: In the pilot test stage, participants completed a form that was developed specifically for this study, in which they recorded how clearly, they understood each item in the current version. This form contained options for recording whether an item was clear, unclear, or not clear, as well as for any questions or suggestions.
(c) Questions sent to the original authors: The original authors received a file containing a table with all materials generated throughout the process, including translations, back-translations, expert committee considerations, and pilot test results. The table also included justifications for adjustments made to the Brazilian Portuguese version of the RED-13 scale.
Data analysis
Content validity was assessed by considering the expert’s responses on semantic, idiomatic, cultural, and conceptual equivalence. The CVI is the proportion or percentage of judges who agree on certain aspects of the tool or items. The CVI score is calculated by adding up the agreement on items marked as “3” or “4” by the experts, divided by the total number of responses (Wynd et al., 2003). The scale is valid if the agreement score is at least 0.80 (Davis, 1992; Grant and Davis, 1997).
Ethical procedures
The study was conducted in accordance with the Declaration of Helsinki and approved byEthics and Research Committee of PUCRS - Approval No. 58718022.6.0000.5336. The study adhered to the ethical principles of Resolution No. 466/12 of the National Health Council.
Participants were invited to voluntarily take part in the study, without any form of compensation. They completed the forms and questionnaires only after confirming their understanding and agreeing of the Informed Consent Form.
Results
Throughout the process of translation, translation combining, expert evaluation, and pre-testing, some items required linguistic modification to ensure they were clear and coherent and could be understood by respondents in Brazil.
Translation and combining translations
In item 1 “I feel out of control in the presence of delicious food,” when T1 and T2 were combined into T-12, the term “out of control” was changed to “lose control.” In item 4 “When it comes to food I love, I have no willpower,” the word “willpower” was replaced by “self-control”. “Willpower” in English refers to a desire, intention or willingness to make a change, and in the context of the sentence, it refers to the ability to resist food. When translated into Portuguese, culturally the expression “willpower” refers to overcoming something with great vigor, requiring great inner strength to act, compared to desire, while “self-control” refers to the ability to resist something. It is more consistent with the intention of the word “willpower” chosen by the original authors and culturally better understood.
Committee of experts
Item 9, “Food is always in my mind” was changed to “I am always thinking about food,” as suggested by members of the Committee of Experts.
Pilot test
Item 3, which refers to loss of control, showed the greatest divergence between cultures. The original statement was “It is difficult for me to leave food on my plate” and left respondents confusing about how to answer and showed that the item was unclear. When answering the questionnaire, participants stated difficult to leave food on the plate, not for lack of control, but to avoid wasting food. The sentence “leave food on your plate” in Brazilian culture can be associated with waste and that is a morality question for population. To avoid confusion and make the item clearer, the final version became “It is difficult for me to stop eating while there is food on my plate.” In item 9, “I don’t get full easily,” participants in the pilot test stated that the question was unclear, and they were confused about the intended meaning of the word “full” in the sentence. They had difficulty understanding if “full” was supposed to be positive or negative in this item. To avoid confusion and make it clearer, the final version became “I don’t get satisfied easily.”
Original authors
The original authors (three) did not request any changes and agreed with the Committee of Experts in their change to Item 9.
The Content Validity Index (CVI) for the Committee of Experts
The CVI measures the proportion or percentage of judges who agree on certain aspects of the tool or its items. Table 1 presents the content validity data on the semantic, idiomatic, cultural, conceptual, and total validity of each item.
Content Validity Index (CVI) among the Committee of Experts, RED-13, Brazil, 2022.
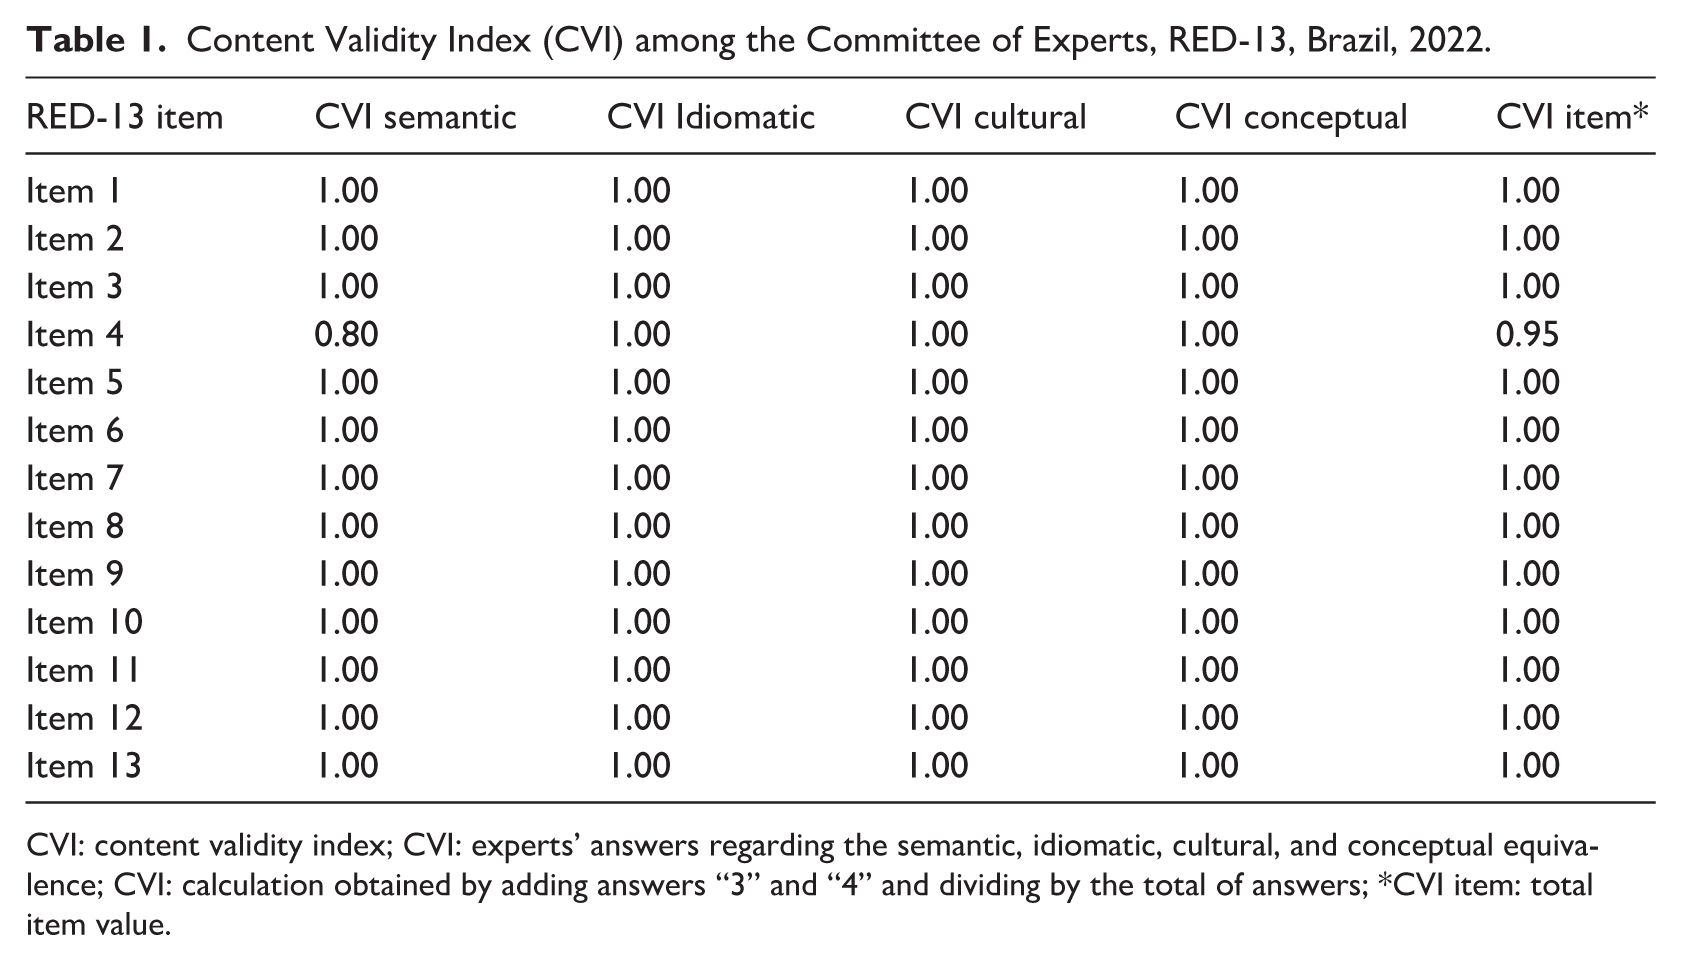
CVI: content validity index; CVI: experts’ answers regarding the semantic, idiomatic, cultural, and conceptual equivalence; CVI: calculation obtained by adding answers “3” and “4” and dividing by the total of answers; *CVI item: total item value.
After completing the cross-cultural adaptation process, all data and documents from the process were compiled together and sent to the original authors of the scale to approve the changes. Table 2 shows the final adaptation and final back-translation.
Cross-cultural adaptation process RED-13: original version, final adaptation, and back-translation, Brazil, 2022.
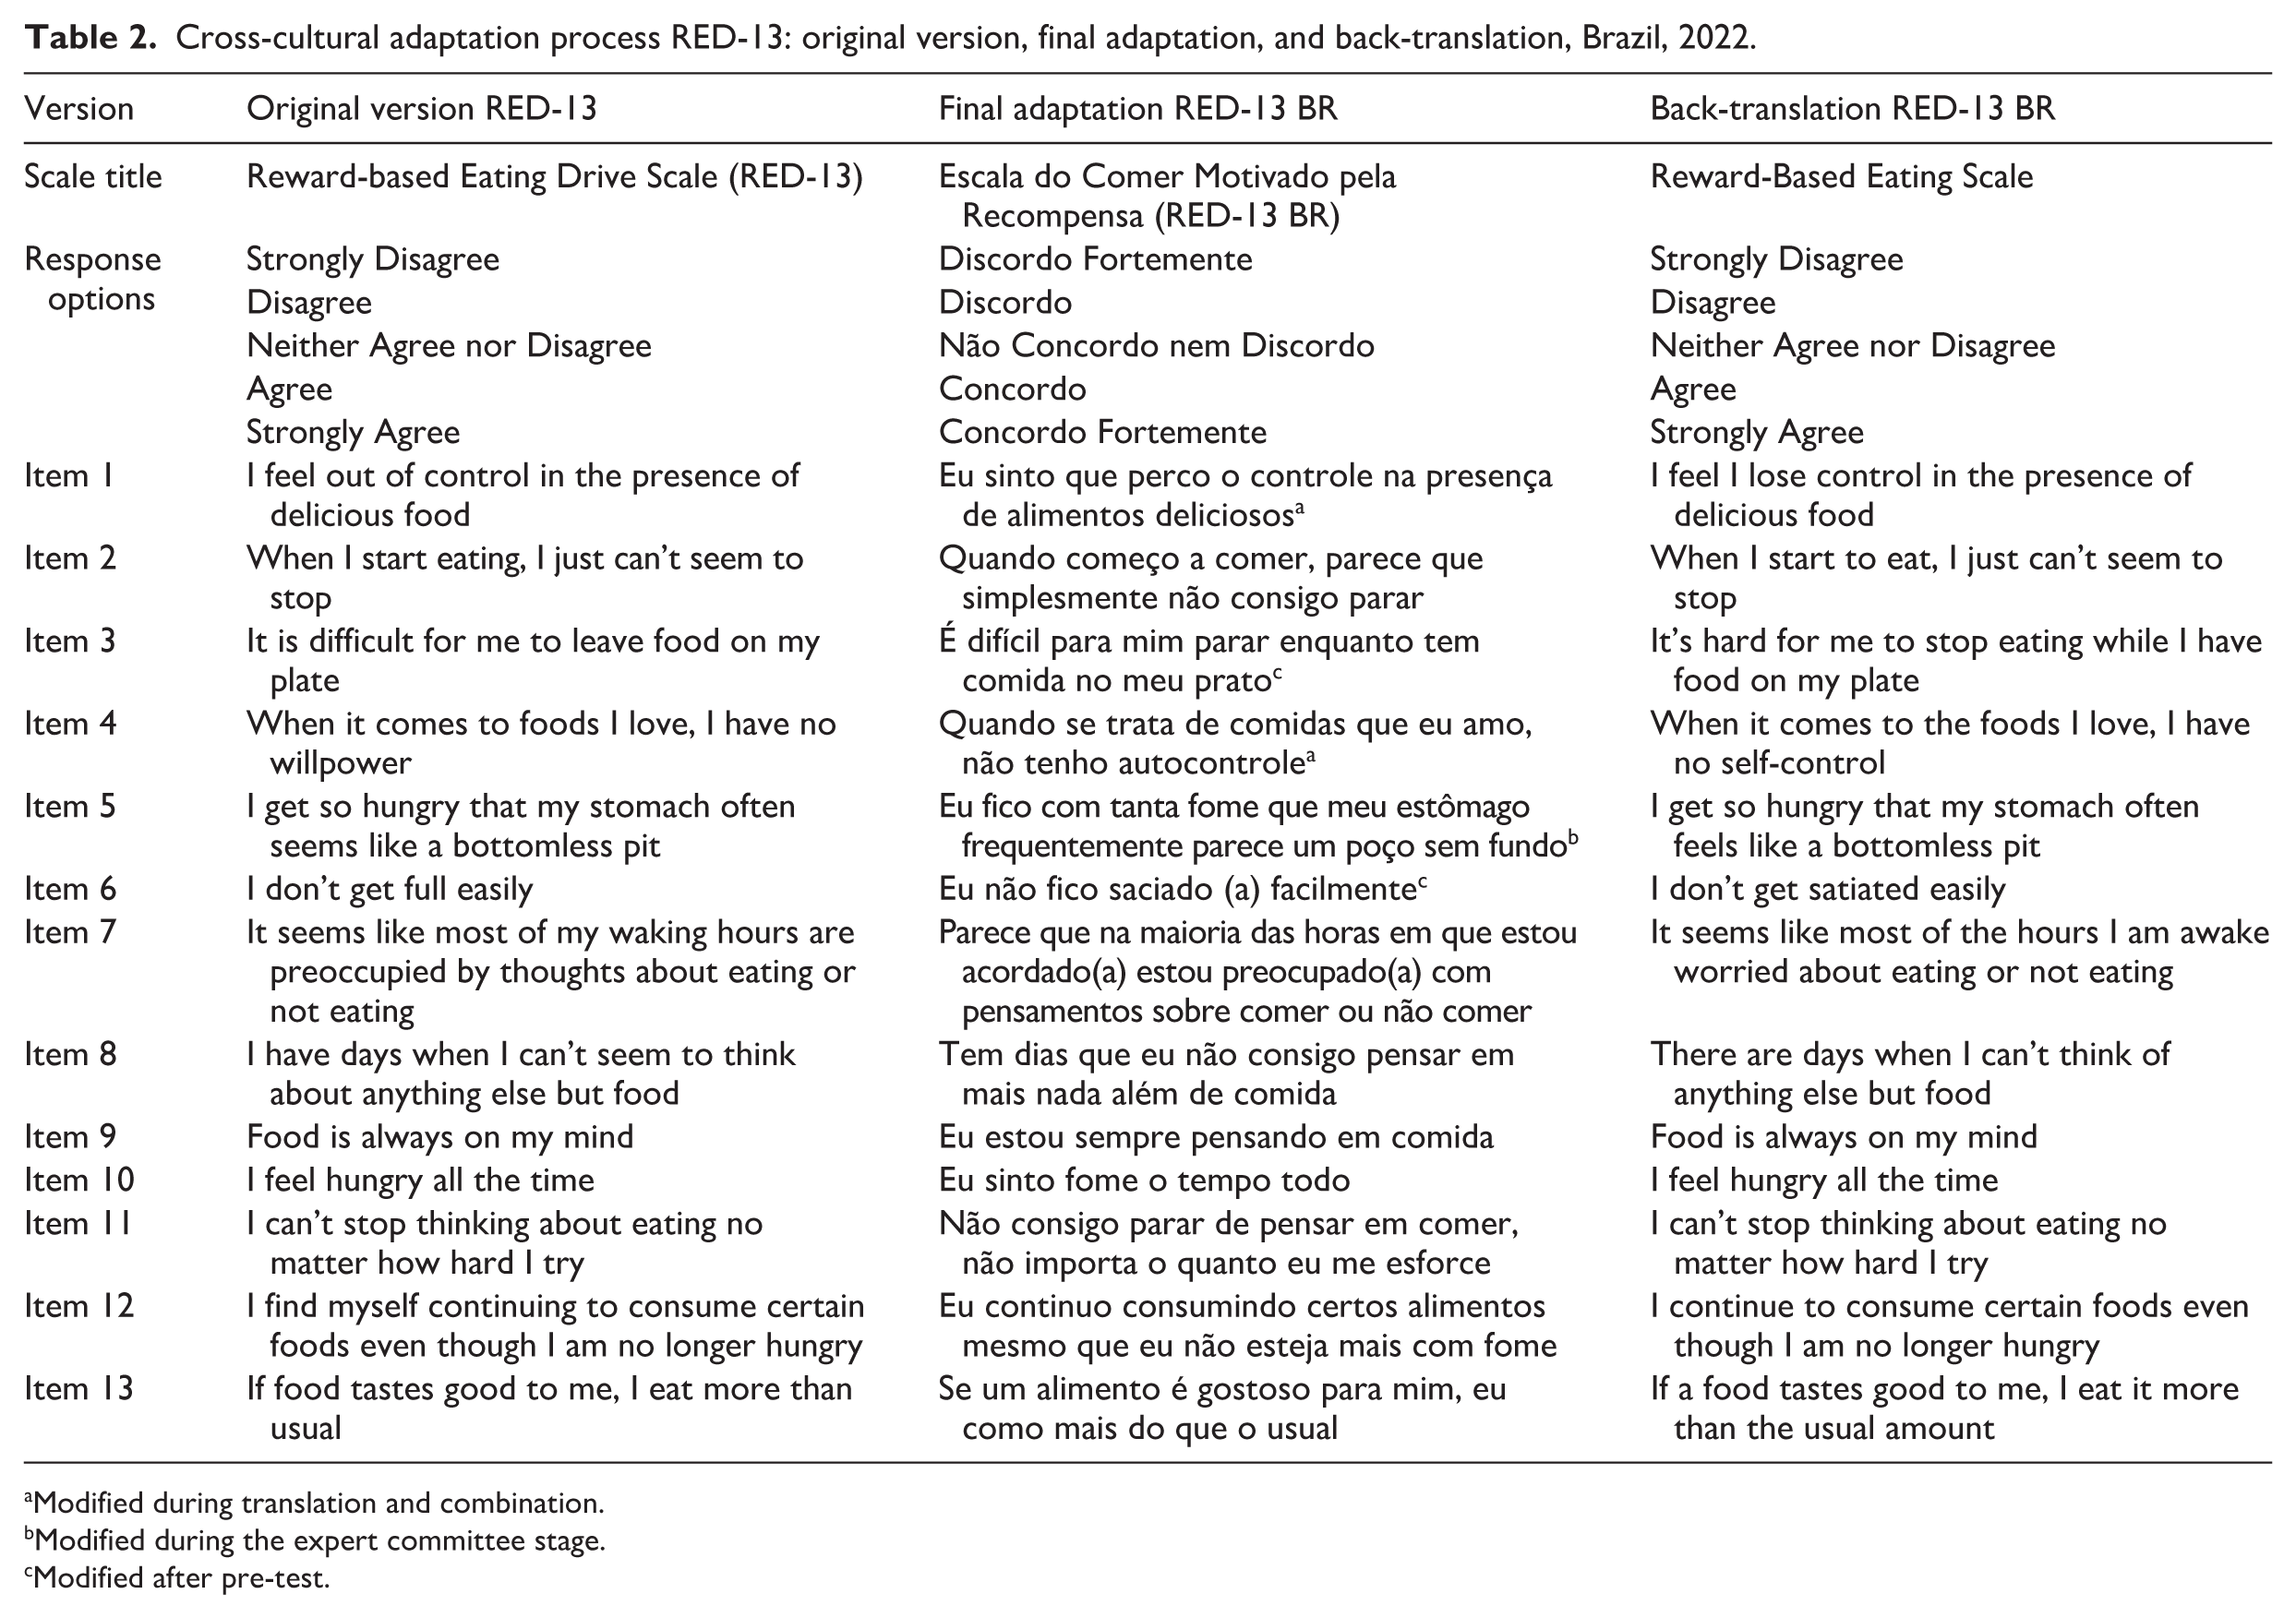
Modified during translation and combination.
Modified during the expert committee stage.
Modified after pre-test.
Stage 2
The aim was to validate the RED-13 BR that was adapted to Brazilian Portuguese in Stage 1, through a psychometric analysis of the data and reliability tests.
Materials and methods
Participants
Participants were recruited by convenience through social media platforms between September and December 2022. A total of 680 adults aged 18–59 years accessed the survey. Of these, 452 were included in the analyses. Participants were excluded if they did not complete all required questionnaires in full.
Tools
The participants completed an online questionnaire on the QualtricsXM platform covering their sociodemographic details and answered the transcultural version adapted for Brazilian Portuguese. The following tools were used for this stage:
(a) Sociodemographic questionnaire: It was created specifically for this research and contained questions on age, gender, weight, height, education level, marital status, living situation, medical conditions, use of regular medication and monthly family income, “How often do you crave sweet foods (cakes, sweets, cookies, etc.)?” and “How often do you crave starchy foods (bread, pasta)?.” These items were written for this study and were conceptually inspired by examples used in the original RED-13 validation study (Mason et al., 2017) and in the Control of Eating Questionnaire (CoEQ; Dalton et al., 2015).
Family income was reported in multiples of the Brazilian minimum wage, which during the data collection period corresponded to R$1.212,00 per month (year 2022). BMI categories was calculated from self-reported weight and height, and participants were subsequently classified according to the official World Health Organization categories for adult weight status (World Health Organization, 2000).
(b) Reward-Based Eating Drive Scale, 13 items, Brazilian version (RED-13 BR): This tool is a self-reporting scale consisting of 13 items with 5-point Likert-type response options. The scores range from 0 “strongly disagree” to 4 “strongly agree.” The higher the score, the greater the respondent’s reward-based eating drive and their desire for gratification from food.
Data analysis
The skewness and kurtosis analyses indicated that the data was not normally distributed. The Shapiro-Wilk statistic was also used to examine the fit of the distribution to the normal curve, and this determined that Spearman’s Coefficient should be used to analyze the correlation between items.
A Confirmatory Factor Analysis (CFA) was performed to test the internal sctructure of the RED-13 BR. The model fit was evaluated using the Comparative Fit Index (CFI), Tucker Lewis Index (TLI), Standardized Root Mean Square Residual (SRMR), and Root Mean Square Error of Approximation (RMSEA). By convention, a CFI and TLI > 0.900 indicate an adequate model fit, and a CFI and TLI > 0.950 indicate a good fit. An SRMR < 0.08 is considered a good fit. RMSEA values < 0.050 represent a close fit, while values between 0.050 and 0.080 represent a reasonably close fit, and values > 0.080 represent an unacceptable fit (Hu and Bentler, 1999). Reliability was measured by applying Cronbach’s alpha and McDonald’s omega tests with 95% confidence intervals. Values are considered adequate when ⩾0.70 (Terwee et al., 2007). The Spearman correlation test was used to assess the convergent validity between RED-13 BR and BMI.
For access the scale’s ability to predict pre-obesity or obesity status, the area under the Receiver Operating Characteristic Curve (ROC Curve) was estimated to measure the instrument’s sensitivity and specificity, and the Youden Index (J) was used to determine the cutoff point. The Youden Index (J) is equal to sensitivity plus specificity minus 1 (Schisterman et al., 2005). To confirm the cutoff point, the McNemar test was performed. The cutoff point is considered appropriate and has predictive ability when p > 0.05.
A Percentile Curve analysis was used to identify potential cutoff points for classifying reward-based eating drive scores as low, moderate, or high-risk, and to examine their association with pre-obesity and obesity status. This classification system enables further studies to focus on participants from different positions on the trait continuum and allows for correlations with different diagnoses and characteristics. The Percentile is a descriptive statistical measure that aims to divide the sample content in an ordered manner into 100 parts. Two percentiles (P25 and P75) were used to divide the sample into three groups: <P25 low risk, P25 to P75 moderate risk, and p > 75 high risk.
The Pearson chi-square test was used to conduct bivariate analyses, and the Analysis of Variance (ANOVA) was used to compare continuous variables. The significance level adopted was 5% (p < 0.05), with a 95% confidence interval.
Statistical program
Statistical analyses and tests were performed using JASP 0.10.1.0 software.
Ethical considerations
The study was conducted in accordance with the Declaration of Helsinki and approved byEthics and Research Committee of PUCRS, and to the Ethics and Research Committee of PUCRS, Approval No. 58718022.6.0000.5336. The study adhered to the ethical principles of Resolution No. 466/12 of the National Health Council, and all participants agreed to participate in the research without any form of compensation, providing their consent through the Informed Consent Form for online research.
Results
The sample consisted of 452 individuals, of whom 403 were women (88.9%), with a mean age of 34.1 years old (SD = 10.27) and a mean BMI = 26.65 kg/m2 (SD = 5.62), which was calculated from their self-reported height and weight. Table 3 presents the characteristics of the sample.
Participants characteristics (N = 452).
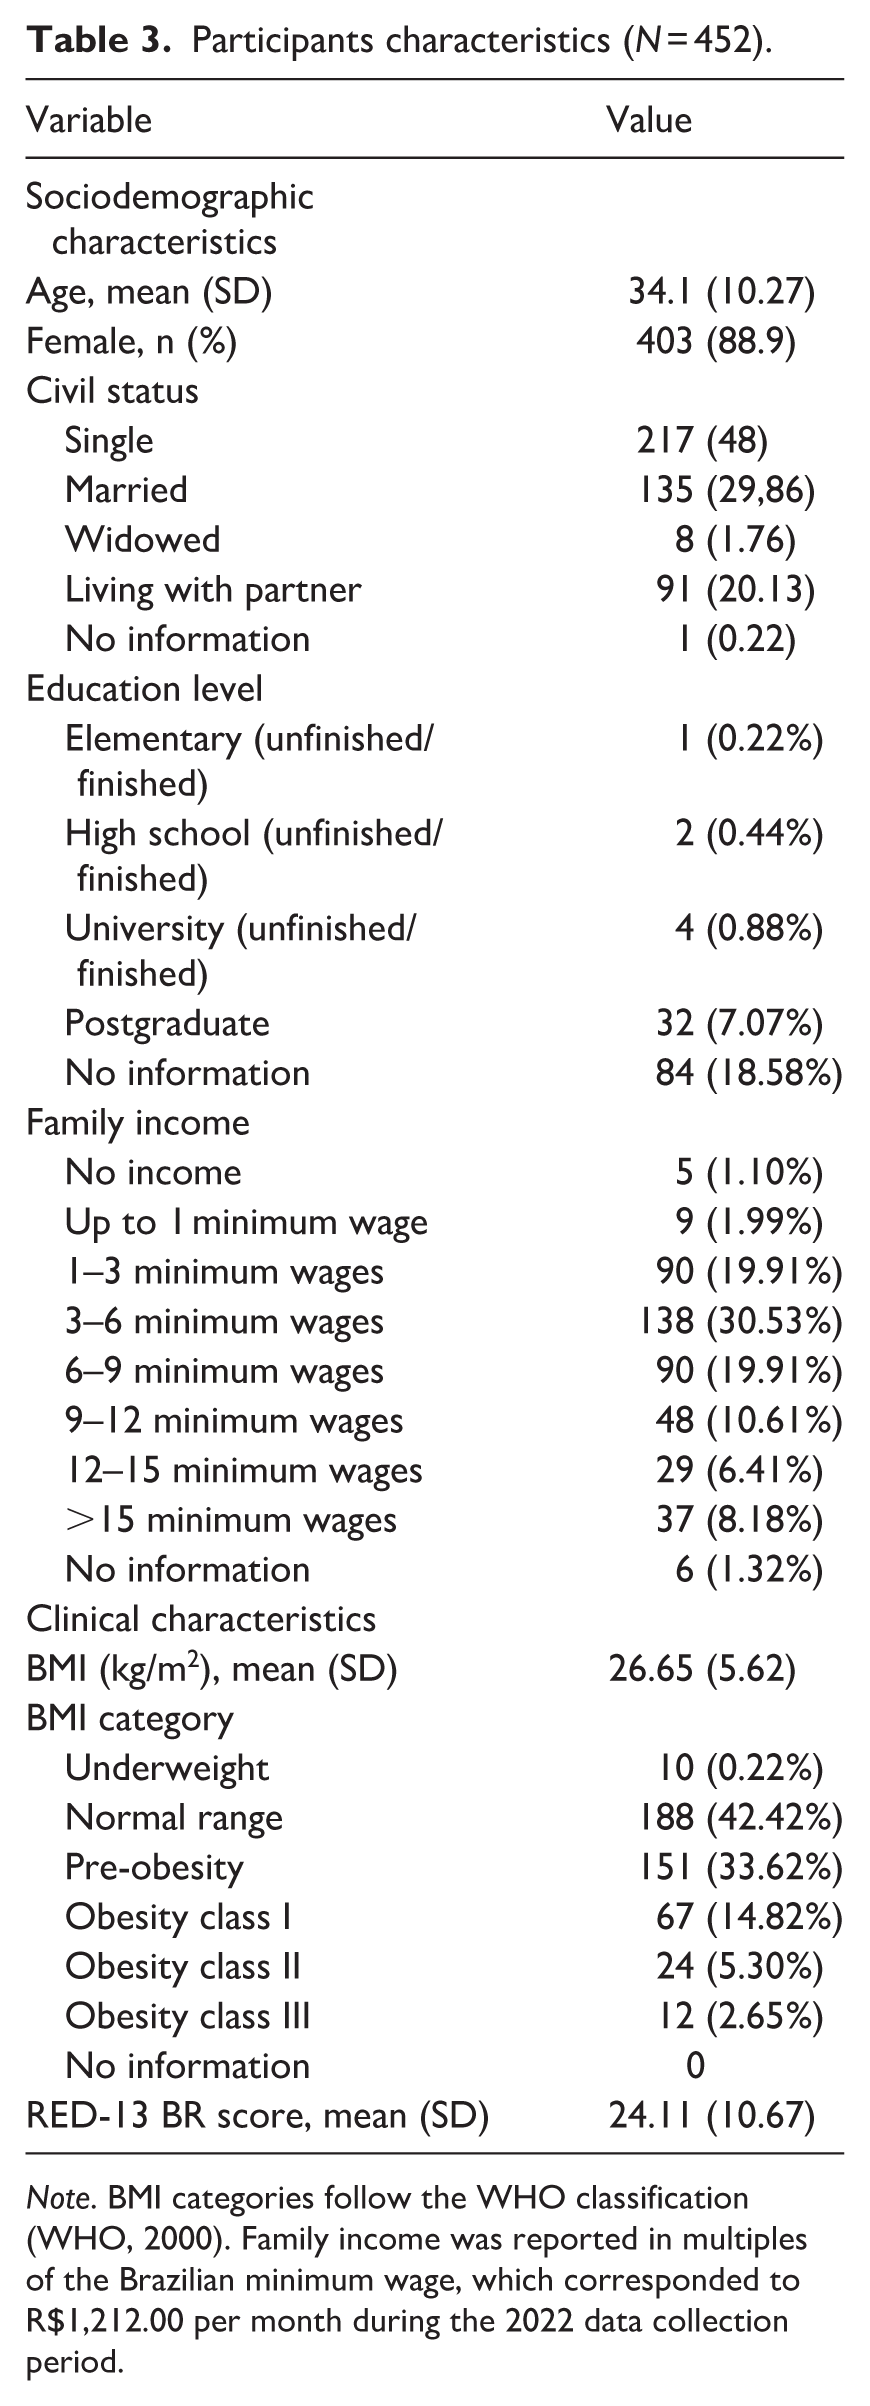
Note. BMI categories follow the WHO classification (WHO, 2000). Family income was reported in multiples of the Brazilian minimum wage, which corresponded to R$1,212.00 per month during the 2022 data collection period.
Participants who responded to the questionnaires on QualtricsXM, including the RED-13 BR, had an average score of 24.11 (SD = 10.67). The minimum score was 0 and the maximum was 52, which is the maximum score on the scale. The following scores were obtained for the categories suggested by the authors: lack of satiety, mean score = 5.43 (SD = 4.06), with a minimum of 0 and a maximum of 16; loss of control, mean score = 14.20 (SD = 5.46), with a minimum of 0 and a maximum of 24; and food preoccupation, mean score = 4.48 (SD = 2.48), with a minimum of 0 and a maximum of 12.
Internal Structure
Confirmatory Factor Analysis (CFA)
The results of the CFA conducted for RED-13 BR demonstrate an excellent fit with the three-factor model, as indicated by the following fit indices: RMSEA = < 0.0001 [95% CI 0.000–0.026], SRMR = 0.041, TLI = 1.000, and CFI = 1.000. In contrast, the fit indices for the one-factor model are less favorable, with RMSEA = < 0.085 [95% CI 0.075–0.095], SRMR = 0.090, TLI = 0.965, and CFI = 0.971. You can see the distribution of the loadings across the factors, comparing the one-factor version with the three-factor version in Table 4. This shows that the model’s hypothesis is supported by the data and that the theoretical model can reproduce the correlation structure in the original data.
CFA: the factorial loading for the items in the RED-13 BR.
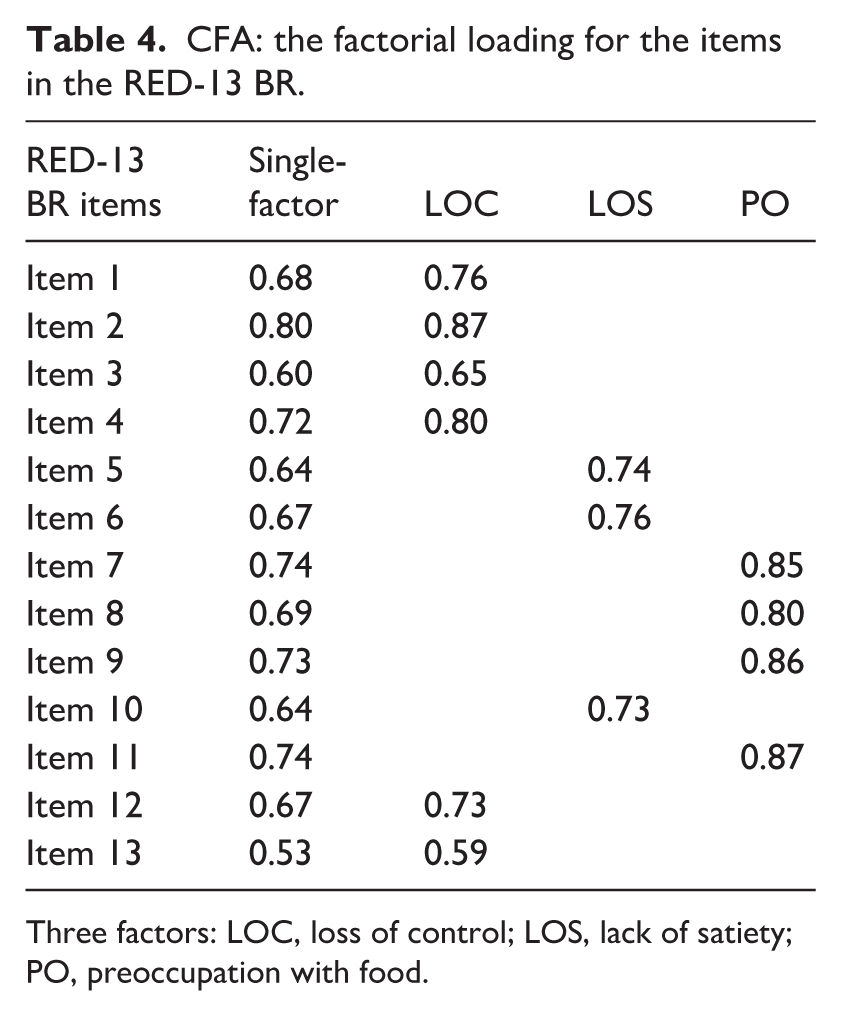
Three factors: LOC, loss of control; LOS, lack of satiety; PO, preoccupation with food.
Reliability
The internal consistency total for the RED-13 BR was high (Cronbach’s α = 0.921, 95% CI 0.910–0.931; McDonald’s ω = 0.922, 95% CI 0.911–0.932). Food preoccupation (Cronbach’s α = 0.792, 95% CI 0.757–0.823; McDonald’s ω = 0.799, 95% CI 0.767–0.831), lack of satiety (Cronbach’s α = 0.908, 95% CI 0.894–0.921; McDonald’s ω = 0.911, 95% CI 0.897–0.924), and loss of control (Cronbach’s α = 0.876, 95% CI 0.857–0.892; McDonald’s ω = 0.880, 95% CI 0.863–0.898) also showed high levels of internal consistency.
Relations to other variables
Data analysis identified that high scores on the RED-13 BR had a moderate positive correlation with a craving for sweet and salty foods (sweet: rho = 0.437, p < 0.001; salty: rho 0.390, p < 0.001). When we compared the scale’s scores with BMI, the results showed that high values on RED-13 BR had a weak to moderate positive correlation with BMI, with rho = 0.266; p < 0.001.
Criterion Validity: the ability of the RED-13 BR to predict the likelihood of pre-obesity or obesity status
In these results, the area under the curve (AUC) was 0.638 (95% CI 0.585–0.690), which indicates that if individuals were chosen at random, 63.8% of those with pre-obesity or obesity would be expected to score higher on the RED-13 BR than individuals with appropriate or lower body weight.
Previously, we had no cutoff points for the scale’s scores. The original authors only mention that high scores indicate a higher tendency to eat for the reward. According to the Youden Index (J) = 0.243, the best cutoff point for the scale is 25 (sensitivity (S) is 0.571 and specificity (E) is 0.672). The best results in the McNemar test for the product (S × E) were between the values 24.5 and 25.5, with products of 0.383 and 0.370, respectively. This supports the conclusion that a good cutoff point would be a score of 25. Therefore, scores above this mark on the scale are more likely to indicate the presence of pre-obesity or obesity status.
The Percentile Curve identified two possible cut-off points that could establish a classification. We decided to use the P25 and P75 percentiles and divide the sample into three groups. The P25 percentile was 16 and the P75 cut-off point was 32. Therefore, we concluded that <16 was a low risk for pre-obesity or obesity status, 16–32 was a moderate risk for pre-obesity or obesity status, and >32 was a high risk for pre-obesity or obesity status. The Pearson chi-square test identified a significant association (p < 0.001). ANOVA was used to compare BMI with the RED-13 BR classification cut-off points identified (p < 0.001). Table 5 shows the distribution of the respondents according to the RED-13 BR classifications and their mean BMI compared to the three groups generated from the P25 and P75 cut-off points. For more details, see the illustrative gradient developed, available in Figure 1 of the supplementary material.
Distribution of respondents into the risk groups from the percentile analysis.
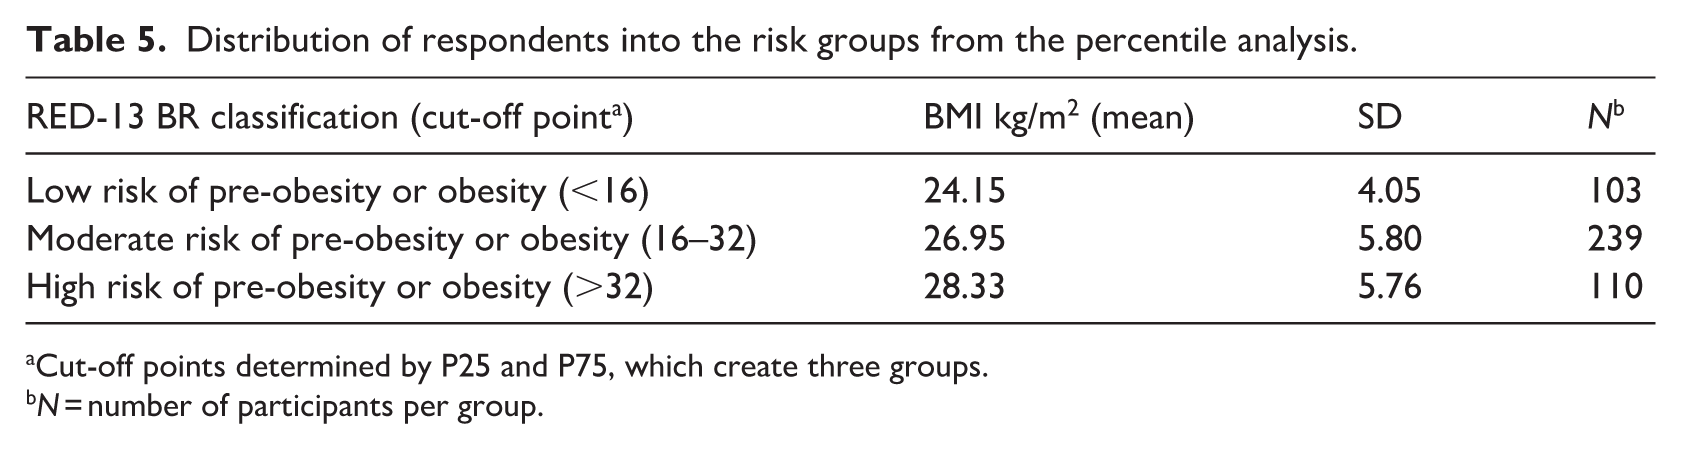
Cut-off points determined by P25 and P75, which create three groups.
N = number of participants per group.
Discussion
This study successfully developed a cross-culturally adapted and psychometrically validated version of the Reward-Based Eating Drive Scale, RED-13, in Brazilian Portuguese, which we have named the “Escala do Comer Motivado pela Recompensa Versão Brasileira (RED-13 BR).” This adapted tool retains all 13 original items in the same order. The translated version demonstrated semantic, idiomatic, cultural, and conceptual appropriateness for the Brazilian population and Portuguese language, while also exhibiting high reliability and strong psychometric properties, supporting de tree-dimensional structure from de original instrument.
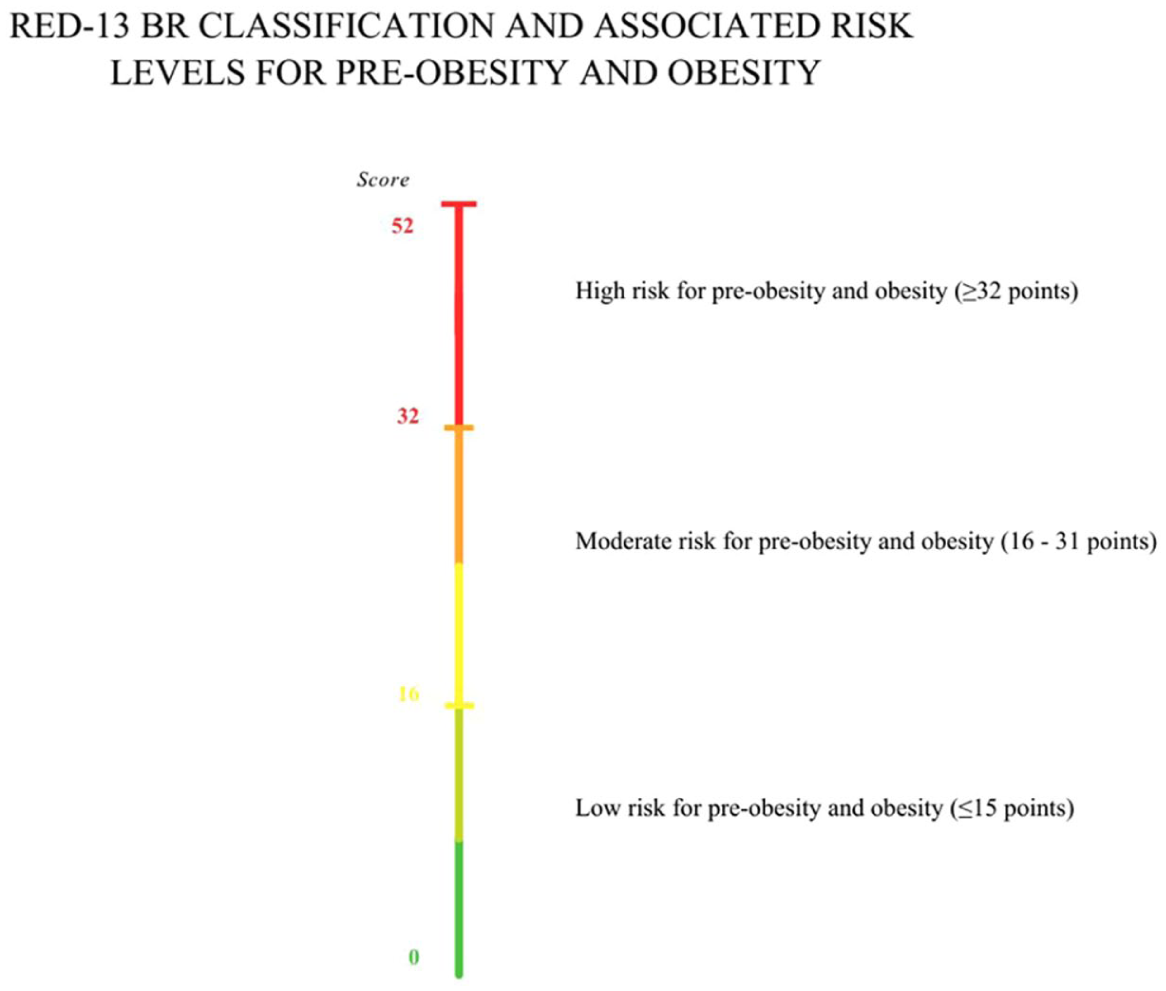
Graphical gradient with cut-off points for the RED-13 B.
Cross-cultural evidence further reinforces the robustness of the RED-13: the Turkish version reported excellent internal consistency, with a total alpha of 0.906 and factor alphas of 0.879 (Loss of control), 0.846 (Lack of satiety), and 0.848 (Preoccupation with food; Yavuz et al., 2025). Similarly, the German version showed acceptable reliability for the total scale (alpha = 0.84), Loss of Control (alpha = 0.77), and Lack of satiety (alpha = 0.82), although the Preoccupation with food factor demonstrated lower reliability (alpha = 0.54; Herhaus et al., 2024)
Our research findings align with previous studies, corroborated the findings of previous studies on the correlation between high scores on the RED-13 BR and BMI, and the desire for sweet or salty foods (Epel et al., 2014; Mason et al., 2017; Vainik et al., 2019b). Moreover, Rivera-Iñiguez et al. (2022), uncovered a connection between rewarding behavior and unhealthy dietary patterns among Mexicans. Their investigation revealed that high score on the nine-item Reward-Based Eating Drive Scale (RED-9) was significantly associated with increased fat intake.
Our extensive psychometric and reliability analyses consistently yielded strong results, further establishing the adapted Brazilian Portuguese version as a reliable tool for identifying the pursuit of gratification through eating and its association with pre-obesity or obesity status.
Characteristics of the scale
We emphasize that the RED-13 BR version captures reward-based eating on a continuum, nonetheless, it was feasible to establish a specific threshold at with the scale exhibits a better correlation with pre-obesity or obesity. Each item in the original tool has the capability to capture the level of severity (low, intermediate, or high) to comprehensively assess the spectrum of reward-based eating.
If we analyze the data from each respondent who scored 25, the majority cut-off point, at which point the scale has a better ability to correlate with pre-obesity or obesity, we can see that those who fit into this point answered “agree” or “strongly agree” to those RED-13 BR items that capture the lower or intermediate stages of the continuum. This demonstrates how much those individuals who present a low or intermediate level of reward-based eating are already at higher risk for weight-related change over time. It also demonstrates how sensitive the scale is to variations at these levels, which that can be useful for clinical practice.
Item 13 “If a food tastes good to me, I eat it more than the usual amount” captures the variation at the lowest level of the continuum; while item 12 “I continue to consume certain foods even though I am no longer hungry” captures the variation at the low to intermediate level. Of the 452 participants, 371 answered “agree” or “strongly agree” to item 13 and 230 to item 12, including those who had a low score on the total score for the scale. This suggests that there is somewhere on this gradient that is common to most people who end up subject to reward-based eating.
However, the highest scores on the scale do not inherently signal greater susceptibility to reward-based eating or potential weight gain over time.
There are three items on the scale that capture the most severe and highest degree of gratification from eating: item 7 “It seems like most of the hours I am awake worried about eating or not eating”; item 8 “There are days when I can’t think of anything else but food”; item 10 “I feel hungry all the time.” When the respondents scores are around 32, they tend to answer “agree” or “strongly agree” to at least one of these three questions that reflect the severe end of the continuum, and as the score increases, so does the number of items (7, 8, and 10) answered affirmatively.
Predictive capacity for pre-obesity or obesity status
The condition of pre-obesity or obesity results from a multifaceted interplay of various factors, encompassing psychosocial, biological, behavioral, and environmental influences. Typically, these domains are examined in isolation when seeking to predict and address obesity. However, it’s important to recognize that each of these domains can be further deconstructed into intricate networks influenced by additional variables (MacLean et al., 2018; Sutin et al., 2018) like shows the ADOPT project.
We identified an AUC = 0.638 for the area under the curve analysis (AUC), for criterion validity, indicating that 63.8% of individuals with pre-obesity or obesity are likely to score higher on the scale than individuals with appropriate or lower body weight. An AUC > 0.8 is considered more precise. We know that the causes of obesity are complex and many factored, and therefore, we believe it is relevant that we can identify this percentage of individuals who could be diagnosed with or are at risk for these conditions, based solely on the reward-based eating impulse. This impulse is part of only one of the domains, the psychosocial, when it was addressed in the ADOPT project (Sutin et al., 2018). Our intention is not to explain or encompass the entire set of complex and multifactorial determinants of obesity through the pursuit of gratification from eating. Individuals may engage in reward-based eating without presenting pre-obesity or obesity, and individuals with pre-obesity or obesity may not necessarily exhibit elevated reward-based eating.
Clinical applications
Although other scales capture different facets of reward-based eating, the RED-13 BR captures the whole spectrum of the behavior using more normative language (rather than more clinical language, such as querying about binge-eating). The first version with nine items (RED-9) was limited to the extent that it did not assess reward-related eating behavior at the top and bottom ends of the spectrum as well as the RED-13 (Mason et al., 2017). The addition of four extra items was able to reduce the gaps in the middle and lower ranges of the continuum and enabled the RED-13 to be more consistent across the entire spectrum of reward-based eating.
Researchers and healthcare professionals may find the RED-13 BR useful for identifying individuals who may be subject to reward-based eating and at risk of metabolic changes. We have developed an illustrative gradient (Figure 1 available in Supplemental Materials) that is more useful for research or clinical practice. In this, it is possible to identify low, moderate, and high-risk classifications for pre-obesity or obesity status based on the scale’s scores.
Final remarks
The culturally adapted and cross-culturally validated RED-13 BR for Brazilian Portuguese has proven to be a valuable tool for identifying reward-driven eating and its association with pre-obesity and obesity, conditions that are highly prevalent not only in Brazil but also in many other countries. The analyses, including psychometric testing, were solid and robust, and they identified a majority cut-off point and three levels of risk for pre-obesity or obesity status.
Limitations
Online data collection is increasingly common (Buhrmester et al., 2011), but it suffers from certain limitations associated with online and self-reported research (Goodman et al., 2013). For example, our study relied on self-reported weight. The accuracy of such reporting depends on the BMI status because the higher the BMI, the less accurate the estimated body weight is (Visscher et al., 2006). Therefore, this data may provide a conservative estimate of the association between BMI and RED-13 BR.
These analyses were cross-sectional, which precludes causal claims: that is, although increased reward-driven eating may lead to weight gain, it is also possible that metabolic changes such as excess body weight may lead to more interest in gratification from food because of dysregulated appetite hormones (Mietus-Snyder and Lustig, 2008). However, the original RED development paper (Epel et al., 2014) reported longitudinal associations between RED-9 scores and weight gain over time. Additionally, Mason et al. (2016) identified correlations between reductions in RED scores and decreases in weight.
We did not examine whether the RED-13 provides explanatory power beyond measures of uncontrolled eating or binge-eating symptoms. Future studies should explore this incremental validity.
The primary strength of this study lies in the rigorous methodology employed and meticulously followed throughout the research process, as detailed in this article.
Conclusion
Following a rigorous methodological process, the scale proved to have good content validity and to be psychometrically sound for the Portuguese language and Brazilian culture. It is also a quick solution that captures the variation across the entire spectrum of reward-driven eating. Researchers and health professionals can use the RED-13 BR to identify individuals who seek gratification from food, which, by allowing doctors to recognize individuals at risk of gaining weight over time, by detecting reward-seeking at the intermediate and lower ranges of the spectrum, may help to contain the growing obesity epidemic.
Supplemental Material
sj-docx-1-hpq-10.1177_13591053261420602 – Supplemental material for Psychometric properties and predictive validity of Brazilian reward-based eating drive scale
Supplemental material, sj-docx-1-hpq-10.1177_13591053261420602 for Psychometric properties and predictive validity of Brazilian reward-based eating drive scale by Tainá Lopes da Silva, Uku Vainik, Ashley Mason, Janete de Souza Urbanetto and Ana Maria Pandolfo Feoli in Journal of Health Psychology
Footnotes
Ethical considerations
The Ethics and Research Committee of PUCRS approved this study (Approval No. 58718022.6.0000.5336).
Consent to Participate
All participants provided written informed consent prior to enrolment in the study and to their data being published anonymously. This research was conducted ethically in accordance with the World Medical Association Declaration of Helsinki and Resolution No. 466/12 of the National Health Council.
Consent for publication
Consent for publication is not applicable to this article as it does not contain any identifiable data.
Author contributions
In the present manuscript, the individual contributions of the authors have been distinctly outlined. TLS contributed to conceptualization, investigation, methodology, and writing – original draft. TLS and JSU were responsible for conducting data curation and formal analysis. AM and UV provided detailed feedback on the manuscript. AMPF assumed a guiding role by supervising the study and actively participating in all stages of the project. All authors collaborated in the creation of the original draft.
Funding
The authors disclosed receipt of the following financial support for the research, authorship, and/or publication of this article: This study was financed in part by the Coordenação de Aperfeiçoamento de Pessoal de Nível Superior - Brasil (CAPES) - Finance Code 001. This research was supported by a National Institutes of Health (NIH) grant from the National Heart, Lung, and Blood Institute (NHLBI) to Ashley E. Mason (K23HL133442).
Declaration of conflicting interests
The authors declared no potential conflicts of interest with respect to the research, authorship, and/or publication of this article.
Data availability statement
The data that support the findings of this study are available from the corresponding author upon reasonable request.
Supplemental material
Supplemental material for this article is available online.