
Abstract
There is no gold-standard method for measuring physical activity (PA), partly because it is a dynamic system shaped by interactions among behavioral and contextual attributes. Network analysis offers a systems-based framework to model these relationships. To illustrate its use, we modeled PA attributes, assessed gender invariance, and examined links with PA-related self-efficacy in 40 healthy adults (18 men, 22 women; mean age = 27.9 years) monitored for 1 week with self-report and smartphone accelerometry. Three network models were estimated: (1) relationships among PA attributes; (2) gender comparison; and (3) integration with self-efficacy variables. The latent structure revealed both positive and negative connections, with 53.42% being positive; the strongest positive edge linked weekday and weekend sitting time. Moderate PA, sitting time, and self-efficacy when access to facilities was limited emerged as central nodes, with some gender differences. Overall, network analysis provides a promising approach for modeling PA as an interacting system.
Introduction
A physical activity level which corresponds to the actual international guidelines has been consistently recognized as a protective factor against mortality (Ahmadi et al., 2022; Dempsey et al., 2020; Dougherty and Meyer, 2023; Lee et al., 2021; Rey-López et al., 2023), neoplasms (Kyu et al., 2016; World Cancer Research Fund, 2018), as well as being positive associated to psychological factors (Bailey et al., 2018; Josefsson et al., 2014) and quality of life (Marquez et al., 2020). This recognition is based on different studies showing a negative relationship between physical activity intensities and all-cause mortality. Recent studies have demonstrated a reduction of 18%–24% in all-cause mortality associated with 15–20 minutes per week of vigorous intensity physical activity, estimated through accelerometers (Ahmadi et al., 2022). Another study showed a hazard ratio (HR) of 0.83 associated with engaging in high (⩾25 metabolic equivalents per hour per week) versus low (little to no metabolic equivalents per hour per week) physical activity levels, estimated through questionnaires (Dougherty and Meyer, 2023).
As highlighted above, the body of evidence about physical activity and its correlations has been based on physical activity estimates obtained through objective measures such as inertial sensors or based on self-reporting tools. While objective measures usually include the capture of movement and acceleration of different parts of the body such as those obtained through inertial sensors (Chen and Bassett, 2005), the latter involves individuals’ judgments about their own physical activity behavior (Stevens, 1966) and is commonly used in epidemiological studies and guidelines (Rey-López et al., 2023). Importantly, despite of being used for the proposal of estimating physical activity, these measures represent only partial attributes of the physical activity phenomenon (Suppes et al., 1989).
For example, questionary-based measures may indicate only a limited part of the individual’s behavior associated with physical activity, named as an “attribute.” Attributes can be considered the simplest measurement units into which a phenomenon can be decomposed using functional variables. These attributes are necessary, but not sufficient causes for the estimation of the phenomenon. For example, we can consider the previously mentioned example. Physical activity can be broken down into attributes such as hip acceleration, wrist acceleration, or different other parts of the body, as well as the individual’s judgment of their behavior. When referring to physical activity, we cannot adequately describe it based solely on a single attribute, such as a person’s wrist acceleration, because although wrist acceleration is a subset of physical activity, it is not sufficient on its own to describe the entire domain of elements that represent physical activity. A comprehensive description of physical activity must consider all its attributes collectively.
In this sense, physical activity levels estimated through objective measures may substantially differ from estimations based on self-reported assessments, given that these measures may substantially differ in nature due to their isomorphic properties being representative of different attributes (To an introduction to the isomorphism concept refers to Berka (1982), Suppes et al. (1989) and to Appendix A of the Supplemental Material). For example, an accelerometer-based estimation of 70 minutes of moderate-intensity physical (indicating that the acceleration of the individual’s body part reached a classification cut-point for moderate physical activity) could not be compared to a questionary-based estimation of an individual engaged in a combination of physical activities at a moderate intensity. Consequently, this distortion may constitute a concern when using guidelines to promote adequate physical activity levels (Bull et al., 2020).
An alternative to improve the estimates of the physical activity level is to consider physical activity as a latent variable, as latent variables can capture the interaction between different attributes (e.g. data from accelerometers, questionnaires, diaries, etc.). Briefly, a latent variable is a not directly observable variable that can be estimated by means of a measurement model through observable variables/attributes using linear combinations, estimation of stochastic state matrices and other relational techniques (Borsboom et al., 2003; Cai, 2012). These approaches can enable us to explore interactions among different attributes of physical activity and potential influencers.
The application of a systems approach in the form of network analysis is a promising way to take into account the inherent complexity of physical activity estimation, thus revealing how attributes interact with each other, emerging a latent variable (Rutter et al., 2019). Network analysis is a statistical method that estimates the relationship (referred to as edges) between different variables (referred to as nodes) while taking into account the presence of all the other variables, usually in the form of partial correlations (Gomez et al., 2022; Heino et al., 2019; Rehermann, 2016). This approach makes possible to explore not only the interactions among various nodes but also to identify the nodes that shows greater significance within the system using centrality indices. Two of the most commonly used indices is strength centrality and betweenness. These indices measures the degree and strength of connection between a node and all other nodes linked to that particular node (Borsboom et al., 2021; Rehermann, 2016).
If applied in the study of physical activity, the systems approach would enable us not only to understand how the attributes of physical activity interact among themselves in a more holistic manner, giving rise to a latent system that can be referred to as physical activity, but also to comprehend how this system relates to different variables (i.e. age, sex, socioeconomic status) and/or other latent systems (i.e. motivation, self-efficacy, environment). It would also allow us to identify different behavioral networks, for example, distinguishing between network topologies for more and less physically active individuals, and determine the most significant variables within these networks, thereby delineating potential intervention variables.
Thus, the aim of the present study is to demonstrate the feasibility of a measurement model for physical activity grounded in the systems approach, specifically in the form of a network model, linking two of the most widely used techniques to estimate physical activity: a questionnaire and accelerometers; to demonstrate its invariance across genders; and its relationships with a psychological network (self-efficacy) that is usually highly associated with physical activity (Anderson and Feldman, 2020; Hsu et al., 2021; Ray and Henry, 2011). The hypothesis was that it would be possible to find relationships between physical activity attributes obtained from self-reporting and smartphone accelerometry within a defined measurement model; that this measurement model would be invariant across genders; and that it would be possible to find associations between this measurement model and self-efficacy measures related to physical activity.
Materials and methods
Participants
Forty Brazilian health adults (18 men and 22 women) participated in the present study. They were 27.9 years old (95% CI = 25.8–29.9), 25.2 kg/m2 body mass index (95% CI = 23.8–26.5), employed (85%), and holding a qualification degree (45%). These subjects were recruited through flyers shared on personal social media profiles and via email prompts. Importantly, there is no consensus on methods for estimating sample size in network analysis. Therefore, the sample size used in the present study was considered adequate, as the primary objective was to explore the empirical application of network analysis to physical activity attributes. In addition, bootstrapped estimates and 95% confidence intervals were reported to evaluate model accuracy as suggested in previous studies (Epskamp et al., 2018). Ethical approval for all procedures was obtained from the Ethics Committee at the University of São Paulo (reference number 58187822.5.0000.5390).
Measures
Self-reported physical activity
One of the attributes of the proposed model was the self-reported level of physical activity, in which the participants’ judgments about their own behavior were assessed using a modified version of the Brazilian Portuguese version of International Physical Activity Questionnaire (IPAQ-LONG; Matsudo et al., 2001). The IPAQ-LONG is a questionnaire comprising 27 questions divided into five sections such as occupational physical activity, transportation, household tasks, leisure time, and time spent sitting. The participants received instructions on how to interpret moderate and vigorous physical activities, in line with the definition given in the Brazilian guide of physical activity (Ministério da saúde do Brasil, 2021). The weekly amount of time spent in each of the physical activity intensities and domains was estimated by multiplying the reported weekly frequency by the reported weekly time (expressed in minutes per week).
Smartphone accelerometry
The center of mass acceleration was assessed using a smartphone app (Free-Living Energy Expenditure Monitoring System–Fleem System®). This app is an online platform that assesses the triaxial acceleration through inertial sensors, usually used to monitor health markers (Goroso et al., 2013, 2021). In the present study, the Fleem System® measured center of mass acceleration minute-by-minute at a 500 Hz sampling rate. The data were then subsampled to obtain minute averages and converted into “counts” by calculating the acceleration magnitude vector (AMV), as shown in equation (1) (van Hees et al., 2009).

Here, Δαj refers to subsequent accelerations in each of the accelerometer axes. These “counts per minute” were then used to estimate the time spent in light, moderate, and vigorous accelerations based on pre-defined cut-points for triaxial accelerometers. Light acceleration was defined as counts ⩽ 2690 counts/min, moderate between 2690 and 6166 counts/min, and vigorous as counts greater than or equal to 6167 counts/min (Sasaki et al., 2017). Data were valid for analysis if individuals had a daily monitoring time greater than 10 hours per day during five consecutive days, as previously recommended (Sasaki et al., 2017).
Physical activity self-efficacy
The level of the participants’ self-efficacy for physical activities was assessed through the Brazilian version of the Transtheoretical Model version of the physical activity self-efficacy scale (SES; Benisovich et al., 1998), comprising of six questions rated on a 1 (not at all confident) to 5 (completely confident) Likert scale. Participants indicated their levels in performing physical activity in various situations, such as during rainy or cold weather, when feeling stressed, or when they perceive a lack of time for physical activity and these responses were expressed in a psychological network.
Procedures
The dataset was derived from an unpublished observational longitudinal study in which participants were screened during online meetings. After being informed about the study’s objectives and procedures, participants provided informed consent and completed questionnaires containing questions about their characteristics (sex, age, height, body mass, occupational status, education level, readiness for physical activity, and physical activity self-efficacy). Afterward, participants were familiarized with a modified version of the full version of the International Physical Activity Questionnaire (IPAQ-LONG; Matsudo et al., 2001). They installed the app on their smartphones, and were instructed to keep them in their pockets for most of the following 7 days, only setting them aside in situations where it was not feasible to carry them such as when bathing. One week after the initial contact, participants filled the same IPAQ-LONG questionnaire considering the 7 days during which they were monitored through their smartphones.
Statistical analyses
We utilized estimated nomothetic contemporaneous networks with graphical representations in the JASP (version 0.17.1) and R studio (version 2022.07.2). We analyzed independent non-repeated, interconnected nodes (variables) through partial correlations.
Furthermore, we estimated three distinct models as the following. Model 1 delineated the relationship between IPAQ-LONG questionnaire and center of mass accelerometry data at intensity level of physical activity, then model 2 examined sex-based differences within the intensity-level measurement model while model 3 tested the relationship between these proposed intensity-level measurements and self-efficacy as obtained by the SES’s items. The network models were constructed by using partial correlation without specifying correlation cut-points, as we solely aimed at demonstrating the applicability of the proposed measurement models. However, we prioritized > 0.3 moderate correlations (Cohen, 1988, 1992), as approached in a previous study (Gomez et al., 2022). We used no regularization such as the Extended Bayesian Information Criterion Glasso (EBICglasso), which shrinks small correlations to 0 to return a sparse network (Epskamp and Fried, 2018).
We estimated the betweenness and strength measures as centrality metrics, with the centrality of a node increasing the likelihood of its influence on other nodes.
In the field of network analysis, there is no established method for making reliable inferences. In this regard, an alternative approach is to estimate the accuracy of edge-weight measures through bootstrapped 95% confidence intervals around the observed edge-weights (Epskamp et al., 2018). It is assumed that smaller intervals correspond to more accurate estimates. In the present study, we calculated nonparametric bootstrapped confidence intervals based on 200 bootstrap samples, resulting in a graphical representation of 95% confidence intervals around the edge-weights, similar to previous studies (Gomez et al., 2022).
Results
Accuracy of generated models
When interpreting the results presented below, it is essential to exercise caution for two reasons. First, our principal objective was to propose a measurement model and to illustrate its applicability. Second, our study is constrained by a relatively small sample size, which restricts the scope of inference, and is further compounded by the relatively wide 95% bootstrapped confidence intervals displayed in Appendix B, C and D of the Supplemental Material.
Model 1 latent structure
The nomothetic network built to represent measurement model 1 is depicted in Figure 1. Upon analyzing the resulting latent structure, various positive and negative relationships between the attributes became evident, in which 12 of the 28 found relationships were negative (42.85%), with the majority of the partial correlations being positive.
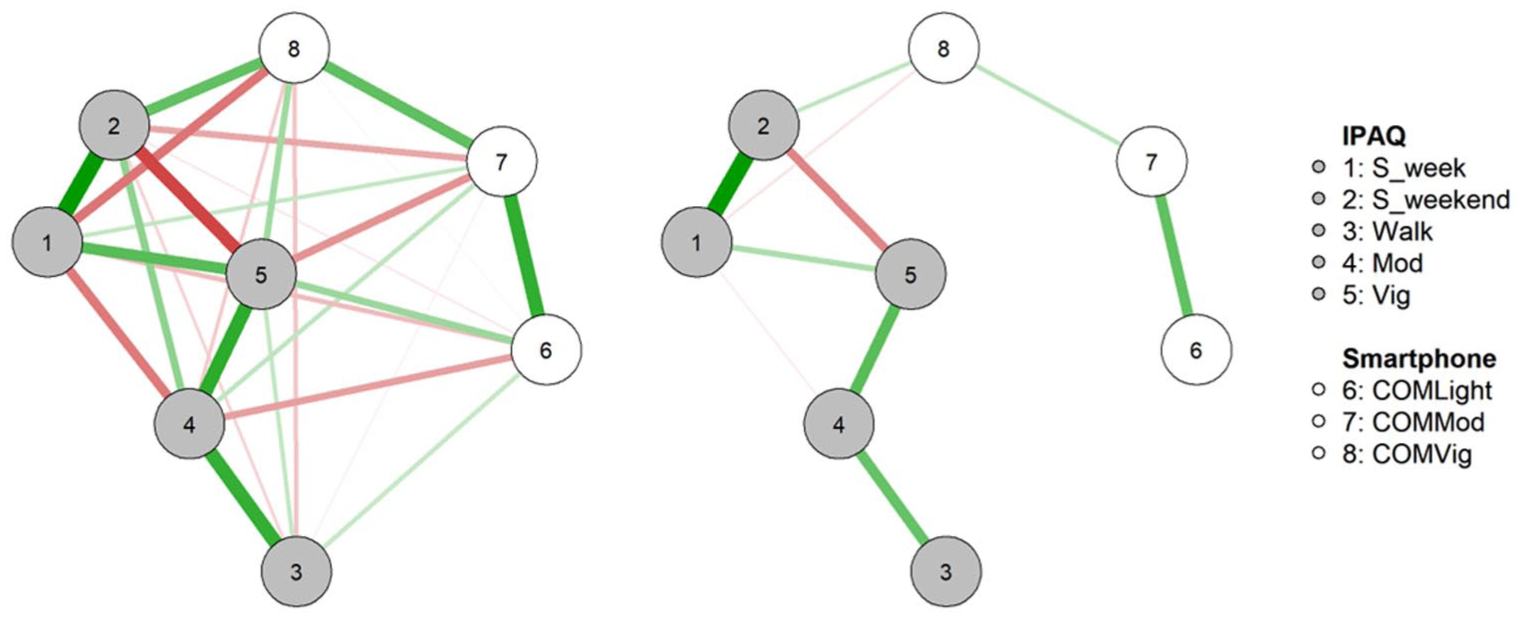
Proposed measurement model 1 network. The figure illustrates the network of Model 1, representing the proposed measurement model. Positive partial correlations are represented by green lines, while negative correlations are depicted in red. The left graph displays the fully connected network, and the right graph shows relationships equal to or greater than 0.3 to enhance interpretation.
Regarding positive relationships, it was observed a range between 0.024 and 0.613, being possible to see that the highest were between the minutes of self-reported sitting time during the week and the minutes of self-reported sitting time during the weekend.
Model 1 edge-weights
All the observed edge weights are presented in Appendix E of the Supplemental Material. For the sake of clarity and ease of interpretation, this section will only highlight the main positive and negative partial correlations greater than 0.3 (considered moderate).
Relationships meeting this criterion include a correlation of 0.613 between self-reported sitting time during the week and self-reported sitting time during the weekend, and a negative correlation of −0.321 between self-reported sitting time during the week and self-reported moderate-intensity physical activity.
Centrality of the attributes of model 1
For model 1, regarding betweenness, self-reported moderate-intensity physical activity ranked highest, followed by self-reported vigorous-intensity physical activity. This pattern remained consistent when considering the strength metric, as illustrated in Figure 2.
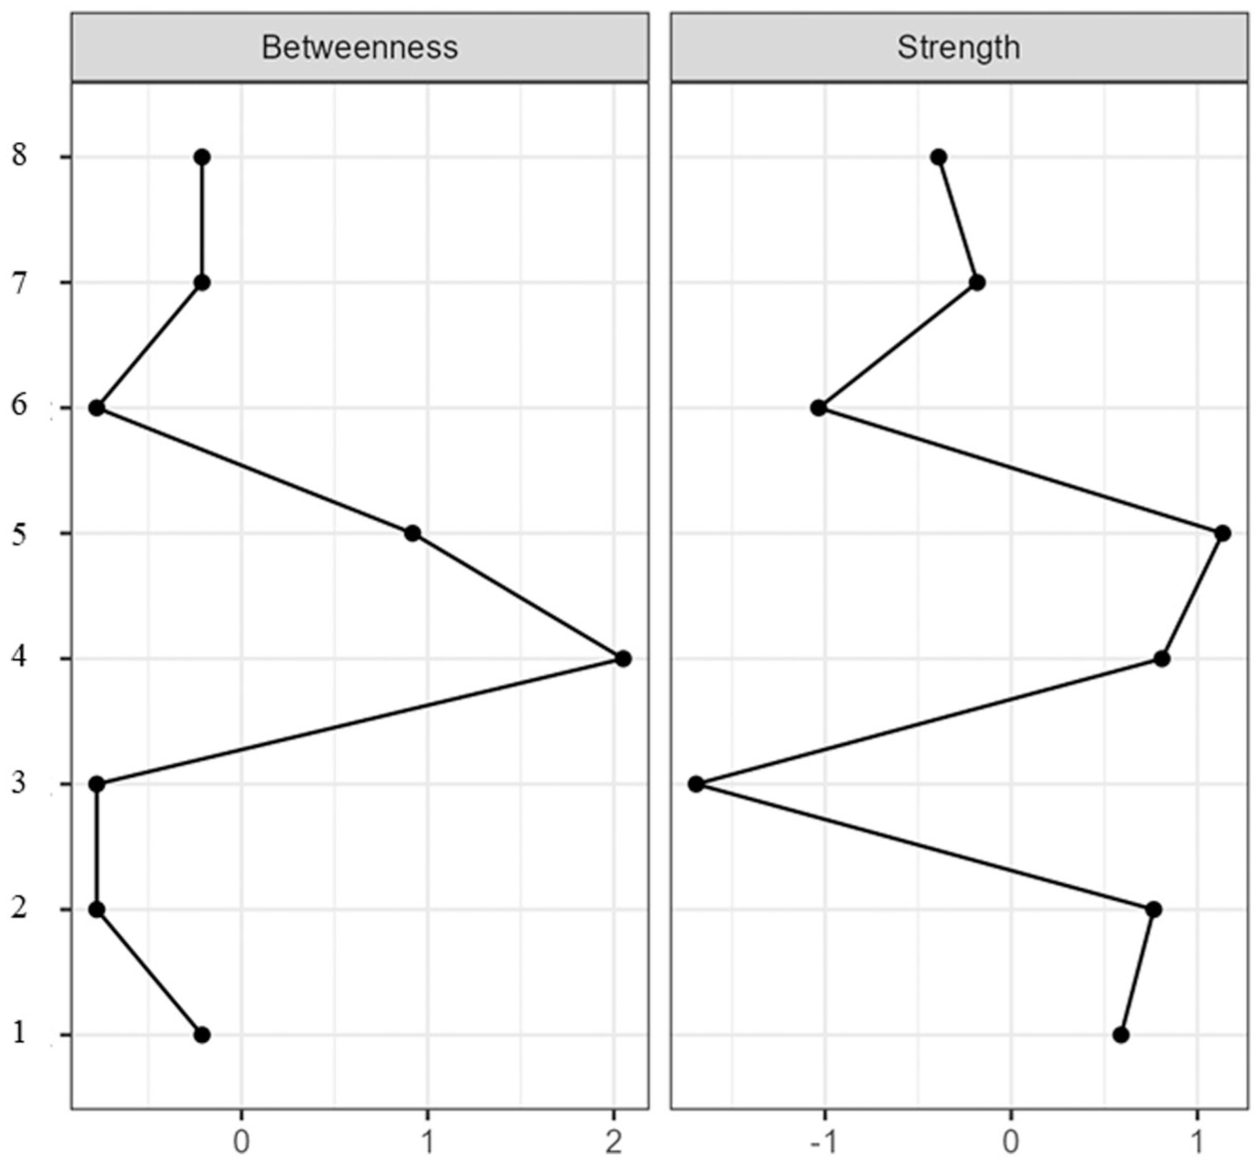
Centrality estimates for model 1. Centrality estimates for model 1. 8 = center of mass acceleration of vigorous intensity; 7 = center of mass acceleration of moderate intensity; 6 = center of mass acceleration of light intensity; 5 = self-reported minutes of vigorous intensity physical activity; 4 = self-reported minutes of moderate intensity physical activity; 3 = self-reported walking time, in minutes; 2 = time spent sitting during the weekend; 1 = time spent sitting during the week.
Model 2 latent structure
The nomothetic network model created to assess Model 2 is presented in Figure 3. Similar to Model 1, an analysis of the resulting latent structure reveals various positive and negative relationships between the attributes. Out of the 28 relationships among women, 12 were negative (42.85%), while among men, 10 out of 28 relationships were negative (35.71%). It is noteworthy that the majority of relationships were positive for both women and men.
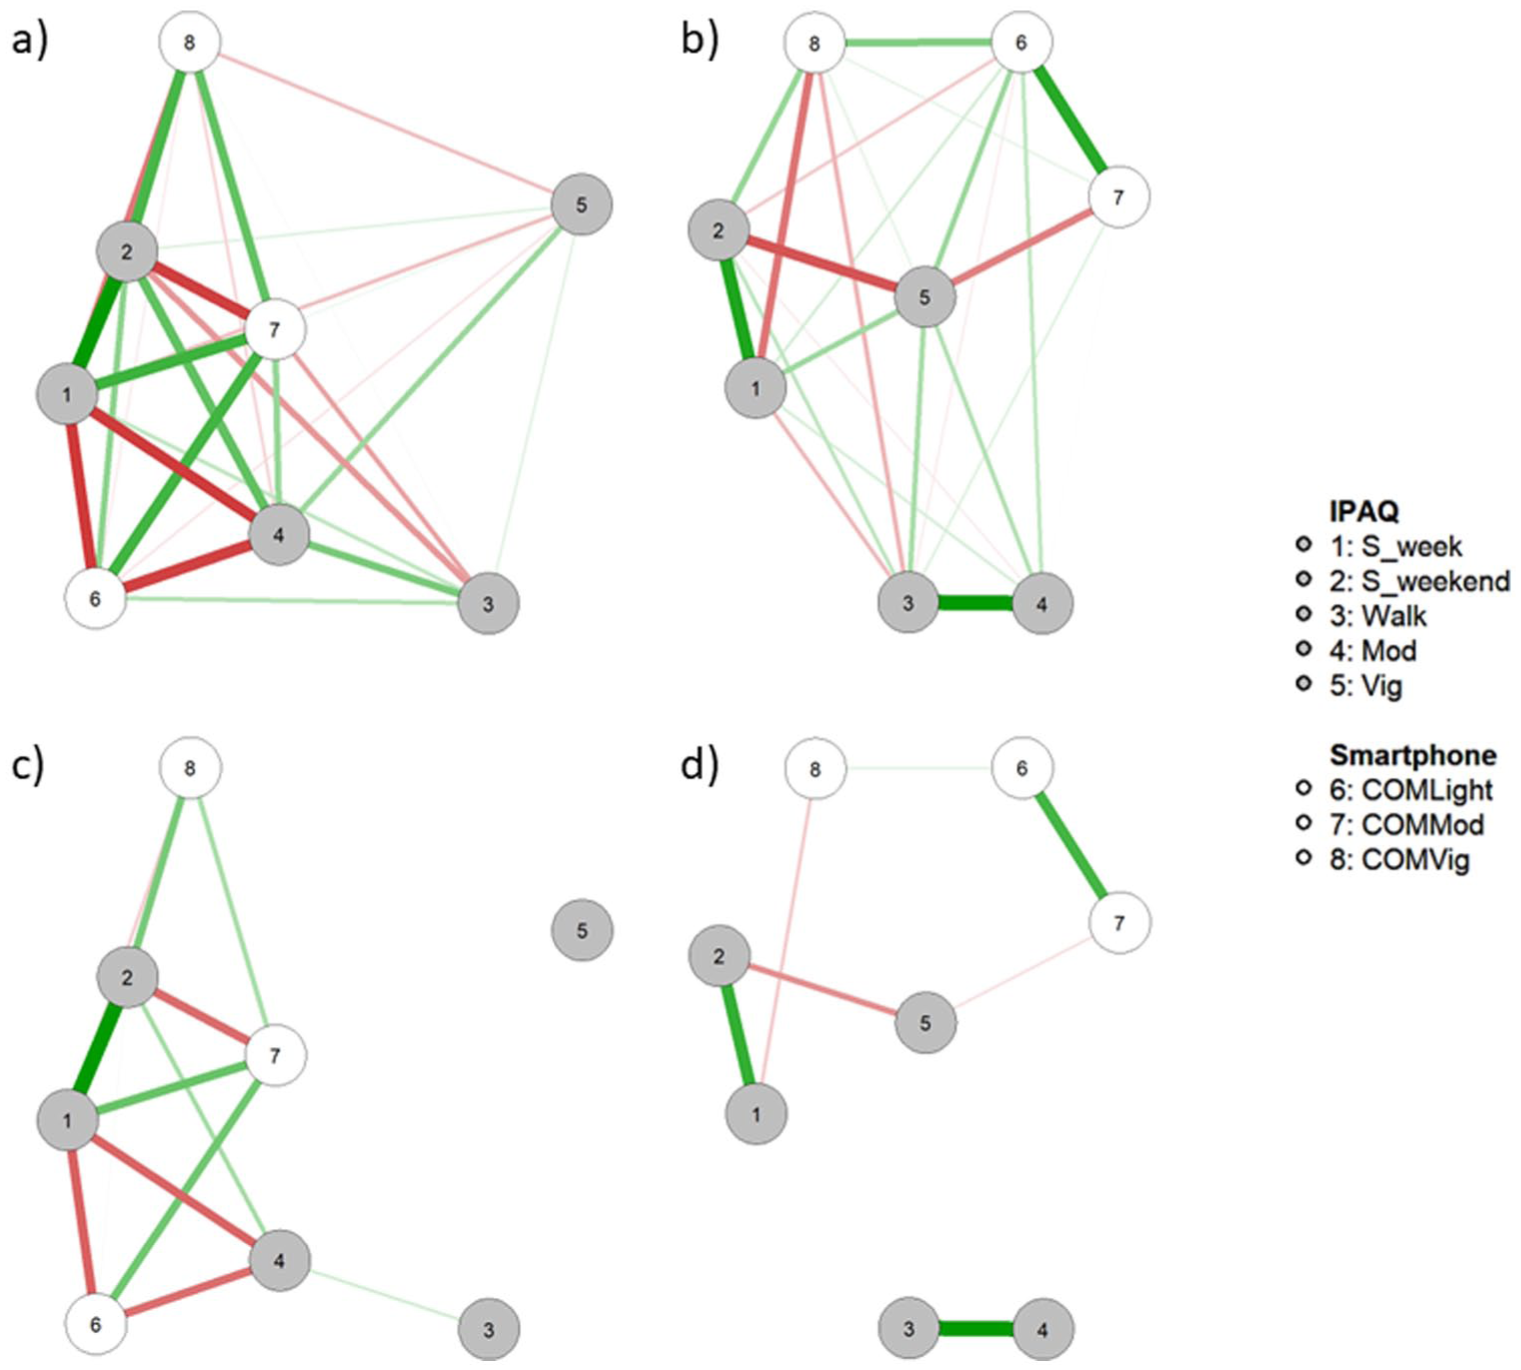
Proposed measurement Model 2 network. Green lines depict positive partial correlations and red lines depicts negative correlations. Green lines depict positive partial correlations, while red lines depict negative correlations. The graphs are categorized by gender, with Graph “a” depicting the network generated for women and Graph “b” illustrating the network generated for men. Graphs “c” and “d” present the same networks as “a” and “b,” respectively, but exclusively display partial correlations equal to or greater than 0.3 to enhance clarity.
In the case of positive relationships found within the latent structure generated for both women and men, notable differences emerge. For instance, among men, a positive relationship is observed between their self-reported vigorous intensity physical activity (5) and self-reported sitting time during the week (1), as well as with vigorous intensity center of mass acceleration (8). However, for women, these relationships exhibit a negative pattern, suggesting a potential divergence in the latent structure for the two genders. Furthermore, variations in the sign of relationships between attributes, as depicted in Figure 3, indicate potential non-invariance within the proposed measurement model.
Model 2 edge-weights and accuracy
For women, relationships meeting the cutoff of 0.3 include a positive relationship (r = 0.728) between self-reported sitting time during the week (1) and self-reported sitting time during the weekend, and a negative relationship (r = −0.556) between minutes of self-reported moderate-intensity physical activity (4) and self-reported sitting time during the week (1).
On the other hand, for men, relationships that met the threshold include a positive relationship (r = 0.640) between self-reported sitting time during the weekend (2) and self-reported sitting time during the week (1). There is also a negative relationship (r = −0.484) between self-reported vigorous-intensity physical activity (5) and self-reported weekend sitting time (2). All the observed relationships are depicted in Appendix F of the Supplemental Material.
Centrality of the attributes of model 2
The two genders also exhibited differences in centrality measures, as depicted in Figure 4. When considering betweenness, for women, the attribute with the most significant number of connections was self-reported minutes of moderate-intensity physical activity. In contrast, for men, the attribute with the highest number of connections was self-reported minutes of vigorous-intensity physical activity.
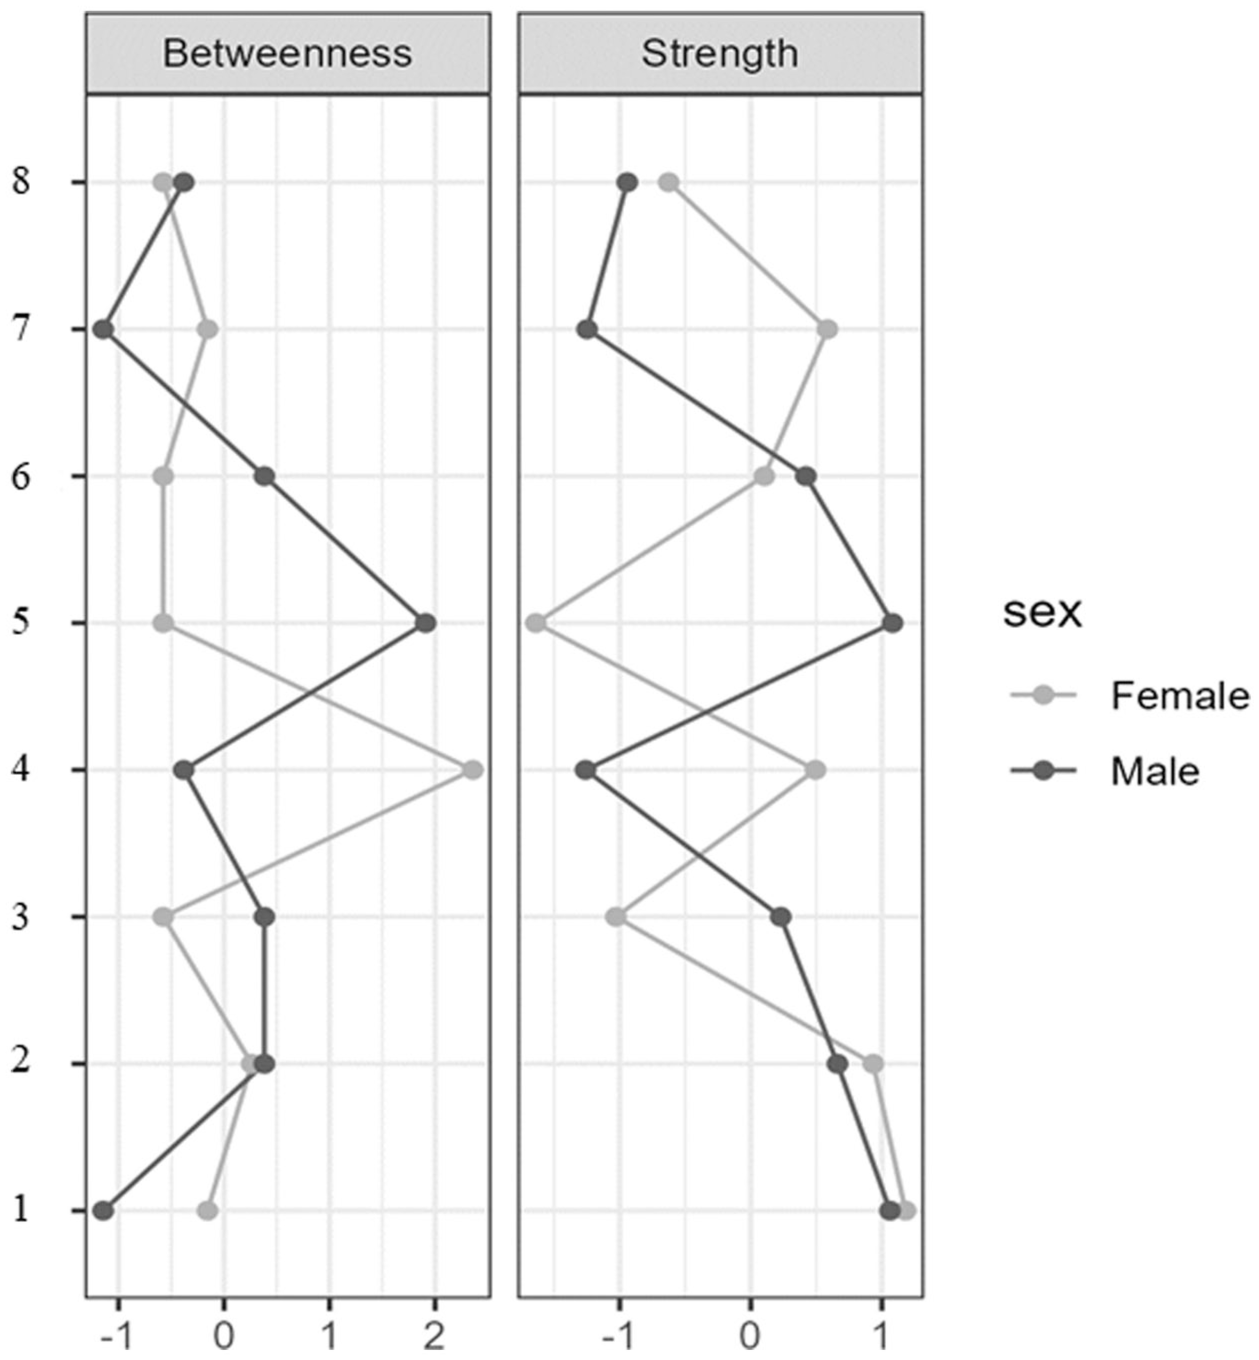
Centrality estimates for model 2. 8 = center of mass acceleration of vigorous intensity; 7 = center of mass acceleration of moderate intensity; 6 = center of mass acceleration of light intensity; 5 = self-reported minutes of vigorous intensity physical activity; 4 = self-reported minutes of moderate intensity physical activity; 3 = self-reported walking time, in minutes; 2 = time spent sitting during the weekend; 1 = time spent sitting during the week.
In terms of strength, women showed greater centrality in self-reported weekend sitting time and self-reported sitting time during the week. On the other hand, men displayed higher centrality in self-reported minutes of vigorous-intensity physical activity and self-reported sitting time during the week.
Model 3 latent structure
The nomothetic contemporaneous network created to assess model 3 is depicted in Figure 5. In this network, we observe numerous positive and negative edge-weights. Of the 91 relationships identified, 40 are negative (43.95%), with the majority of relationships being positive. The relationships within physical activity attributes mirror those in model 1. Due to the increased complexity of the network, this section will focus on the main relationships exceeding the 0.3 threshold for clarity, but a comprehensive analysis of the obtained edge-weights is available in Appendix G of the Supplemental Material.
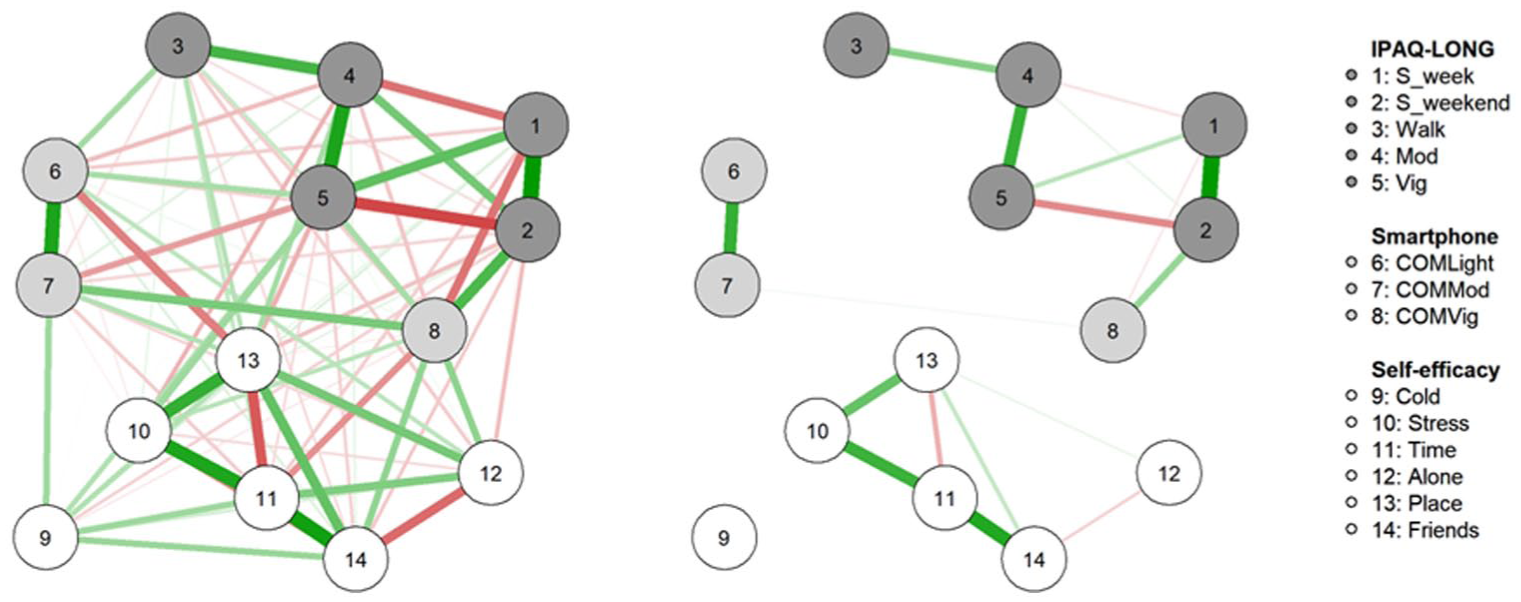
Network of the proposed measurement model 3. Green lines depict positive partial correlations and red lines depicts negative correlations. The left graph depicts the fully connected network while the right graph depicts the network with relationships greater or equal to 0.3 to facilitate interpretation.
In this context, the relationships exceeding this threshold are consistent with those observed in model 1, with the exception of the newly introduced attributes representing physical activity self-efficacy, in which we noted, for example a positive relationship (r = 0.521) between self-efficacy to engage in physical activity when facing time constraints (11) and self-efficacy to engage in physical activity when stressed (10).
Centrality of the attributes of model 3
For model 3, the attributes with the highest number of connections were minutes of vigorous intensity center of mass acceleration and self-efficacy level to do physical activity even when the individual do not have access to a place for it. For strength, the attributes with the highest edge-weights were self-efficacy level to do physical activity even when the individual do not have access to a place for it and minutes of self-reported vigorous intensity physical activity (Figure 6).
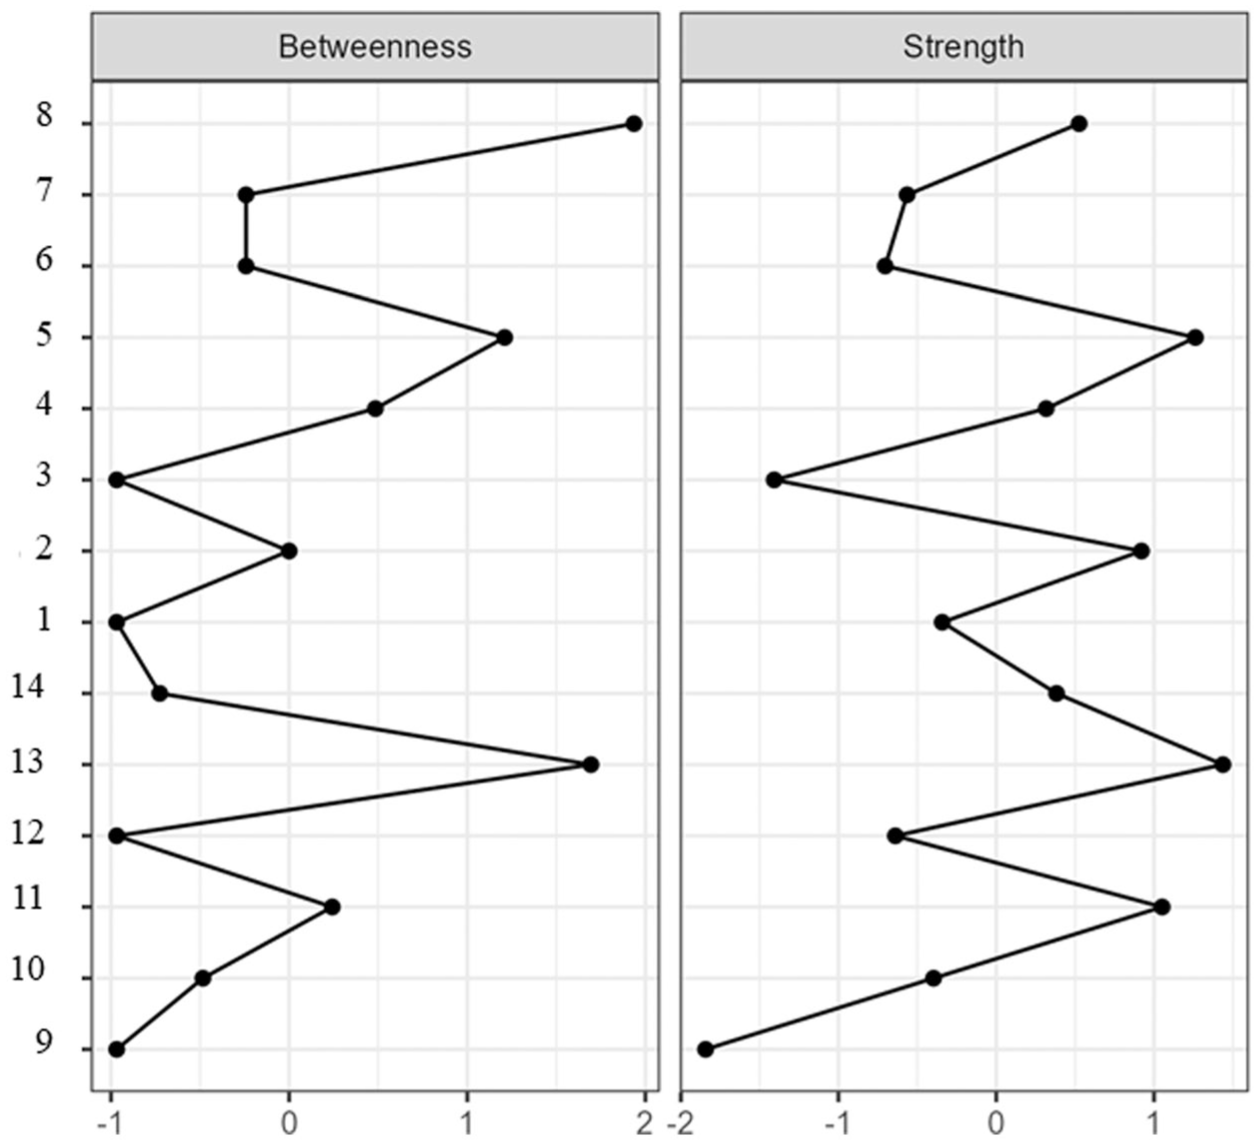
Centrality estimates for model 3. 8 = center of mass acceleration of vigorous intensity; 7 = center of mass acceleration of moderate intensity; 6 = center of mass acceleration of light intensity; 5 = self-reported minutes of vigorous intensity physical activity; 4 = self-reported minutes of moderate intensity physical activity; 3 = self-reported walking time, in minutes; 2 = time spent sitting during the weekend; 1 = time spent sitting during the week; 14 = self-efficacy to engage in physical activity when in the company of friends; 13 = self-efficacy to engage in physical activity when access to facilities is limited; 12 = self-efficacy to engage in physical activity alone; 11 = self-efficacy to engage in physical activity when time is limited; 10 = self-efficacy to engage in physical activity when stressed; 9 = self-efficacy to engage in physical activity when it is rainy or cold.
Discussion
While our study isn’t the pioneer in applying network analysis to physical activity estimates, it is the first to propose and test the feasibility of a measurement model and conceptualization for physical activity in terms of network analysis. Despite our small sample size, we successfully generated the proposed measurement models, each varying in complexity.
In the context of model 1, numerous positive and negative relationships within the latent structure were observed. However, when considering the strongest relationships (those exceeding 0.3), with the exception of self-reported sitting time during the weekend, which served as a bridging attribute connecting judgments and center of mass acceleration, all other attributes within IPAQ-LONG and center of mass accelerometry demonstrated only internal relationships. This indicates a weak direct association between the attributes of physical activity obtained through these two measurement tools. For instance, the most notable relationship between these measurement tools were found between self-reported vigorous intensity physical activity and moderate intensity center of mass acceleration, with a negative relationship of -0.260, falling below the threshold for moderate relationships.
These weak associations between measures obtained through IPAQ-LONG and center of mass acceleration it is not a new find, for example, in one of the first studies in which the criterion validity of the IPAQ-LONG were tested in different countries, a pooled correlation of 0.33 (varying between fair and moderate) were observed (Craig et al., 2003), being these low relationships highlighted in another studies (Troiano et al., 2014). But even with this questionable criterion validity the questionnaire was considered valid and a measure of the same phenomenon obtained through inertial sensors. In this sense, our results using network analysis only reproduce already known results, but in a more holistic way.
Centrality metrics in Model 1 revealed that self-reported minutes of moderate and vigorous physical activity were the most central attributes in the network, suggesting their significant contribution to the strength of relationships. Practically, this implies that if interventions are considered to alter the structure and strength of observed relationships, these attributes would be the most promising candidates. It allows us to enhance the complexity of models used to comprehend physical activity, encompassing variables of various natures (social, psychological, environmental). This approach seeks to better understand how different attributes interact in the presence of each other and which attributes hold greater importance in shaping the network topology.
In model 2, differences in the latent structure of the proposed measurement model between women and men became apparent. Specifically, positive relationships observed for men were negative when analyzing the latent structure generated for women, suggesting a lack of invariance in the proposed measurement model and potential gender-specific associations in how women and men perceive their engagement in physical activity during the week.
The results are consistent with the findings of Dos Santos Duque et al. (2025), who conducted a large-scale epidemiological study with a sample of 11,262 adults participating in the Brazilian Longitudinal Study of Adult Health (ELSA-Brasil). In that study, the authors identified distinct physical activity profiles among men and women, linking these differences to socioeconomic and behavioral variables, as well as to gender-specific barriers. They noted that women exhibited a higher prevalence of insufficient physical activity levels, whereas men demonstrated greater engagement in vigorous activities. These patterns underscore the need for differentiated public policies and targeted interventions to promote physical activity according to the specific characteristics of each group (Dos Santos Duque et al., 2025).
In this study, we assessed how the measurement model differs between women and men through subgroup analysis and focusing to demonstrate its feasibility only, however, such analyses could extend to testing differences between groups based on different variables, such as levels of physical activity. For example, we recommend future studies investigating differences between sufficiently and insufficiently active individuals, trying to identify attributes candidates for intervention through centrality metrics, and to alter the network structure by transitioning individuals from the insufficiently active group to the sufficiently active group.
In the third model, we delved into the interaction of the proposed measurement model with a psychological network—specifically, the one built using self-efficacy attributes. Similar to the relationships between attributes of the IPAQ-LONG and center of mass acceleration, our analysis yielded noteworthy insights. Despite self-efficacy being recognized as a significant construct in the context of physical activity practice (Anderson and Feldman, 2020; Hsu et al., 2021; Killey and Watt, 2006; Manley et al., 2014; Ray and Henry, 2011; Tucker et al., 2019), our network analysis demonstrated that the strongest relationship identified between a self-efficacy attribute and a physical activity attribute was a negative association (r = −0.292) between an individual’s confidence in performing physical activity even without access to a place for it and light intensity center of mass acceleration (Supplemental Material). This finding suggests that, within our sample and considering all other attributes in the system, the relationship between self-efficacy and physical activity falls below the threshold for a moderate relationship.
Additionally, self-efficacy was modeled as a system rather than being reduced to a single factor, as is typically done in factor analysis. This approach enabled the examination of interactions among individual variables, rather than limiting the analysis to the relationship between a single latent factor and physical activity.
Despite these exploratory findings, the third model enables us to recognize that using network analysis we can enhance the complexity of our models as much as desired, understanding that a corresponding increase in sample size is imperative. This approach allows us to seamlessly integrate network analysis with structural equation models, so we recommend studies investigating how physical activity, treated as a latent system, interacts with environmental, social, and attributes from various theoretical models such as the transtheoretical model (Prochaska and Di Clemente, 1982), social cognitive models (Bandura, 1998), and other previously highlighted models (Rhodes et al., 2019). Additionally, future research should consider work-related and daily demands, as previously explored within the field of health psychology (Abdel Hadi et al., 2021, 2022). This exploration aims to uncover diverse network topologies and comprehend the most pivotal attributes associated with each theoretical approach, as well as its level of matrix isomorphism.
Despite the present study limitations and its exploratory nature, our results suggest an intriguing approach to understanding physical activity in a more holistic manner, but it is important to note that the present study did not explicitly demonstrate certain aspects. Network analysis can potentially be leveraged to monitor how a system changes over time, and idiographic networks (Fisher et al., 2017; Molenaar, 2004; Rehermann, 2016) can be constructed to comprehend how individual-focused networks evolve over time, shedding light on the most critical attributes at this level. This approach facilitates interventions at both individual and public-health levels.
For example, identifying that an individual’s sitting time is negatively related to their time spent in moderate-to-vigorous physical activity suggests practical avenues for intervention. At the individual level, strategies grounded in behavioral theories such as the Transtheoretical Model (Prochaska and Di Clemente, 1982) could be used to emphasize the importance of reducing sedentary time and, consequently, increasing engagement in moderate physical activity. At a public health level, such findings can inform the development of policies aimed at decreasing sedentary behavior and promoting more active lifestyles.
Additionally, network analysis represents a promising approach to exploring measurement reactivity (Häusser et al., 2026), as it allows us to examine not only changes in mean levels over time but also changes in network topology. This approach enables the investigation of how being monitored may impact the connections between nodes within the network.
Finally, we recommend that future studies replicate the proposed measurement model, incorporating additional physical activity attributes (such as pedometers and diaries) and expected outcomes of physical activity, including direct or indirect measures of energy expenditure, incorporating this analysis into the structural equation model framework. We recommend too longitudinal studies as the conducted by Fried et al. (2022) exploring how these networks change over time and in response to interventions on attributes identified through centrality metrics and the exploration of physical activity tools in terms of levels different than the focused in the present study, which restricts to physical activity intensity.
Supplemental Material
sj-docx-1-hpq-10.1177_13591053261443208 – Supplemental material for Physical activity as a system: A network perspective on behavioral attributes and self-efficacy
Supplemental material, sj-docx-1-hpq-10.1177_13591053261443208 for Physical activity as a system: A network perspective on behavioral attributes and self-efficacy by Douglas Silva Alves, William Tsutomu Watanabe, Daniel Gustavo Goroso, Fernanda Ribeiro de Araujo, Flávio de Oliveira Pires and Ricardo Yukio Asano in Journal of Health Psychology
Footnotes
Acknowledgements
The author Douglas Silva Alves thanks for Coordenação de Aperfeiçoamento de Pessoal de Nível Superior - Brasil (CAPES) for possibility the study conduction through their scholarships (Finance Code–001).
Ethical considerations
Certificate of Presentation for Ethical Review (CAAE) number 58187822.5.0000.5390.
Consent to participate
All participants provided informed consent by signing a written consent form prior to their inclusion in the study.
Consent for publication
Consent for publication is not applicable to this article as it does not contain any identifiable data.
Author contributions
Study conceptualization: Alves, D.S.; design and protocol development: Alves, D.S; Goroso, D.G.; Pires, F.O.; and Asano, R.Y.; data collection: Alves, D.S.; data analysis: Alves, D.S.; manuscript writing: Alves, D.S.; proofreading: Watanabe, W.T.; Goroso, D.G.; Araujo, F.R.; Pires, F.O.; and Asano, R.Y. All authors have read and agreed to the published version of the manuscript.
Funding
The authors received no financial support for the research, authorship, and/or publication of this article.
Declaration of conflicting interests
The authors declared no potential conflicts of interest with respect to the research, authorship, and/or publication of this article.
Data availability statement
Data sharing not applicable to this article as no datasets were generated or analyzed during the current study.
Supplemental material
Supplemental material for this article is available online.
References
Supplementary Material
Please find the following supplemental material available below.
For Open Access articles published under a Creative Commons License, all supplemental material carries the same license as the article it is associated with.
For non-Open Access articles published, all supplemental material carries a non-exclusive license, and permission requests for re-use of supplemental material or any part of supplemental material shall be sent directly to the copyright owner as specified in the copyright notice associated with the article.