
Abstract
This study analyzed data from the 2009 to 2018 National Health and Nutrition Examination Survey involving 6765 Young adults aged 18–44 (mean age: 32.11 ± 7.16 years; 51.44% male) to examine independent and joint associations of sleep duration and physical activity with hypertension risk. Short sleep (<7 h/day) and no physical activity were significantly associated with increased hypertension risk (OR = 1.28 and 1.15). Short sleep remained a significant risk factor among those with sufficient physical activity (OR = 1.38), while no physical activity increased risk regardless of sleep duration (OR = 1.33). Long sleep and insufficient physical activity showed no significant associations. In conclusion, both short sleep and insufficient physical activity independently increase hypertension risk in young adults, without attenuating each other’s effects. These findings highlight the need for integrated strategies promoting adequate sleep and regular physical activity to mitigate hypertension risk in young adults. Due to the cross-sectional design, causal relationships cannot be established.
Introduction
In recent decades, hypertension in Young adults has metamorphosed from a relatively rare clinical occurrence into a staggering global public health challenge. Emerging epidemiological data indicate that its prevalence among individuals aged 18–44 has risen sharply worldwide, with the age of onset consistently trending younger (GBD 2019 Risk Factors Collaborators, 2020). This early onset is particularly disturbing, as it translates into a prolonged lifetime exposure to elevated blood pressure, thereby significantly escalating the risk of premature cardiovascular events, such as stroke and myocardial infarction, in younger cohorts. As a paramount risk factor for cardiovascular diseases, early-onset hypertension is associated with an adverse long-term prognosis, a burden further exacerbated by the persistently low awareness and suboptimal control rates observed in this population (Yang et al., 2025). While traditional factors such as obesity and genetic predisposition contribute to hypertension, emerging evidence highlights the role of modifiable lifestyle behaviors, including sleep duration and physical activity (PA). For instance, a meta-analysis of young and middle-aged adults revealed that both short (<7 hours) and long (⩾9 hours) sleep durations are significantly associated with increased hypertension risk, particularly in Asian populations (Yang et al., 2025). Similarly, cross-sectional studies in general U.S. adults have demonstrated that short sleep duration, poor sleep quality, and other sleep disturbances are independently linked to higher hypertension prevalence (Li et al., 2023; Ogugu et al., 2022). Moreover, No PA has been identified as a contributor to hypertension, and its joint effect with sleep duration may further modulate risk. A study using U.S. national data reported that only the combination of sufficient PA and healthy sleep duration (7–8 hours) was associated with reduced hypertension odds, whereas either factor alone did not show significant effects (Cheng et al., 2024). This synergistic relationship is further supported by research in adolescents, where coexisting short sleep and obesity substantially increased hypertension risk (Choi et al., 2024). However, most existing studies focus on general adult populations or specific ethnic groups, with limited exploration of these associations in Young adults (Metlock et al., 2026; Tian et al., 2025). Additionally, the interplay between sleep, PA, and other lifestyle factors (e.g. smoking and sedentary behavior) may vary by age, underscoring the need for targeted investigations in younger cohorts to clarify these relationships and inform early intervention strategies (Valenzuela et al., 2023; You et al., 2021).
Methods
Study population
The National Health and Nutrition Examination Survey (NHANES) is a comprehensive study designed to assess the health and nutritional status of adults and children in the United States via a survey covering a wide range of topics (Petrova et al., 2021). NHANES conducts annual surveys, with approximately 5000 individuals selected to ensure national representativeness. Participants are first interviewed in their homes to collect data on demographics, socioeconomic status, dietary habits, and health-related issues. Subsequently, participants are transported to a Mobile Examination Center for comprehensive medical assessments (Wolffenbuttel et al., 2020). Since 1999, NHANES has routinely made survey data publicly available on a biennial basis. The survey protocol was approved by the Institutional Review Board of the National Center for Health Statistics. All participants provided informed consent, and all procedures adhered to applicable laws and regulations.
This study utilized data from individuals aged 18–44 years, collected across five cycles between 2009 and 2018 (World Health Organization, 1986). A total of 13,604 participants were initially included. We first excluded 79 participants with missing data, including 30 with unavailable sleep duration data, 48 with missing PA information, and 1 with missing hypertension data from the mobile examination center. Considering that participants may change their sleep habits due to their health conditions, we excluded participants if they have a history of cancer, cardiovascular disease, major depression, or pregnant women at enrollment (n = 1629; Hu et al., 2024). Cardiovascular disease was diagnosed using self-reported physician diagnoses obtained during an individual interview using a standardized medical condition questionnaire. The participants were asked, “Has a doctor or other health expert ever informed you that you have congestive heart failure/coronary heart disease/angina pectoris/heart attack/stroke?” A participant was regarded as having cardiovascular disease if he or she replied “yes” to any of these questions. Current symptoms of depression were measured using the Patient Health Questionnaire, which consists of nine questions on depression symptoms over the past 2 weeks. The Patient Health Questionnaire total score ranges from 0 to 27 and a cutoff score of 10 points suggests probable major depressive disorder. After removing 5132 participants with missing covariates, a total of 6765 participants were included in the main analysis (Figure 1).
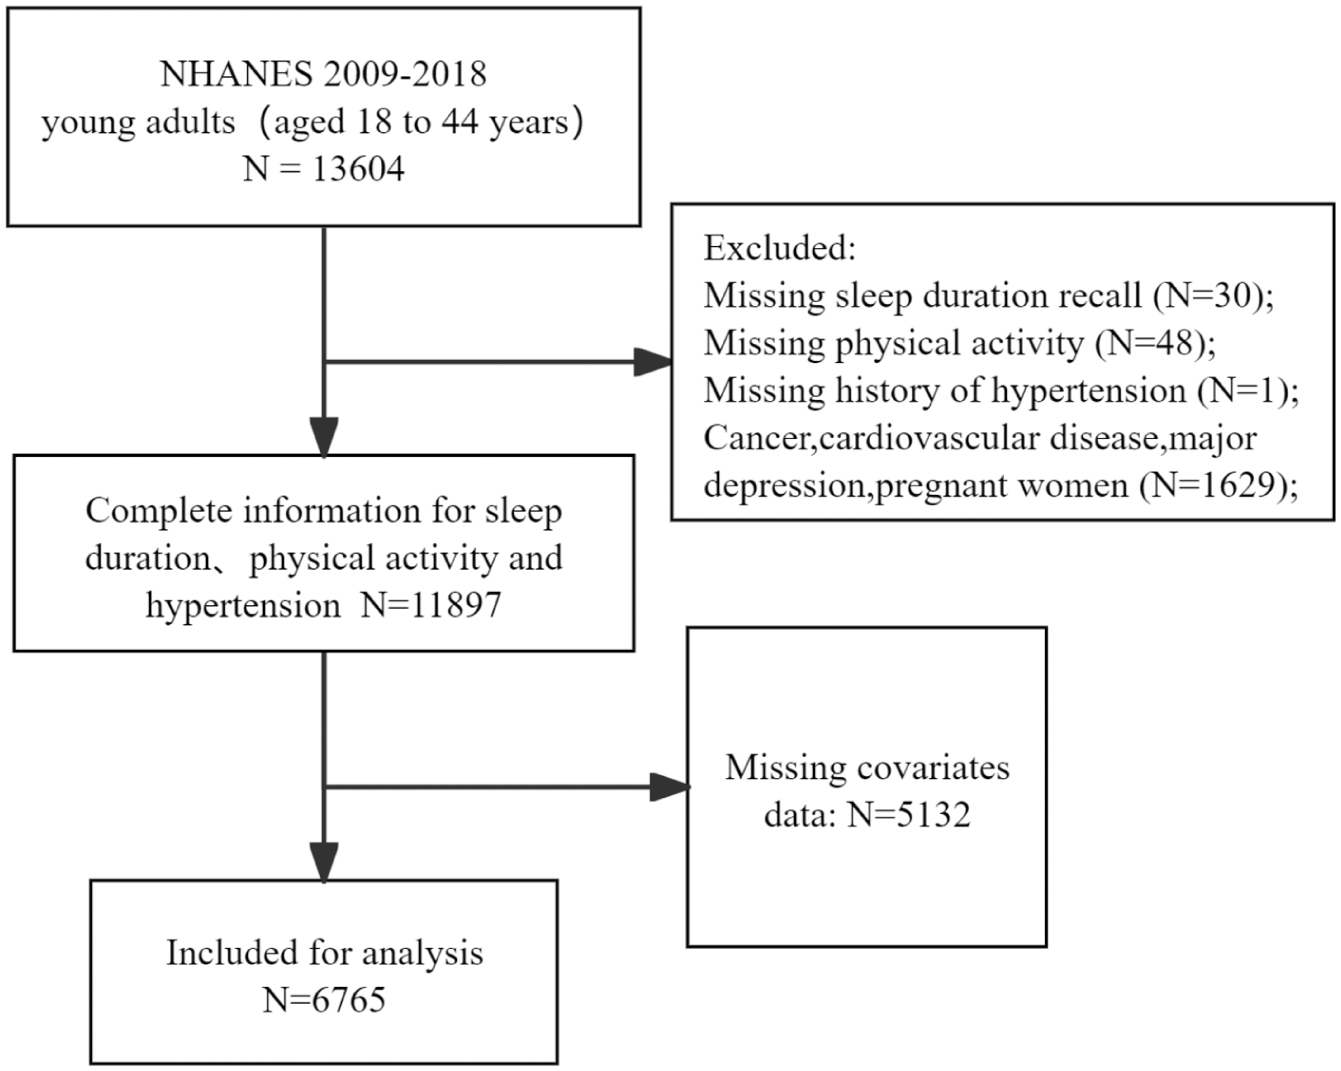
Flow diagram of inclusion criteria and exclusion criteria.
Hypertension
Between 2009 and 2018, NHANES implemented a standardized blood pressure measurement protocol in accordance with American Heart Association guidelines. Following a 5-minute seated rest, three consecutive blood pressure measurements were obtained at 30-second intervals using a manual sphygmomanometer. Systolic and diastolic blood pressure values were calculated as the mean of these three readings. Hypertension was defined as either average systolic blood pressure ⩾ 130 mmHg, diastolic blood pressure ⩾ 80 mmHg, self-reported physician diagnosis of hypertension, or current use of antihypertensive medications (Cheng et al., 2024; Jones et al., 2025; Valenzuela et al., 2023).
Sleep duration
Trained interviewers collected sleep-related data in participants’ homes via face-to-face Computer-Assisted Personal Interviewing (CAPI). Sleep duration was assessed using the question: “How much sleep do you usually get at night on weekdays or workdays?” This single-item self-reported measure is valid, reliable, and widely adopted for evaluating habitual sleep duration in large-scale population-based epidemiologic studies, including NHANES and other nationally representative surveys. On the basis of clinical guidelines from the American Academy of Sleep Medicine, sleep duration was classified into three categories: short (<7 hours), normal (7–8 hours), and long (⩾9 hours; Hu et al., 2024; Watson et al., 2015).
Physical activity
Self-reported PA was assessed using a standardized questionnaire administered in NHANES, which has been widely validated for population-level PA surveillance. The questionnaire ascertains the frequency and intensity of moderate and vigorous activities in a typical week (Santos-Lozano et al., 2021). According to World Health Organization guidelines, participants were classified into three groups: “No PA” (no moderate or vigorous activity), “Insufficient PA” (not meeting minimum recommended levels), and “Sufficient PA” (meeting or exceeding recommended thresholds; Valenzuela et al., 2022a).
Covariates
All participant characteristics were systematically collected and categorized into several domains. Demographic information included age, sex, and race/ethnicity, with the latter classified as non-Hispanic White, Mexican American, non-Hispanic Black, or other groups. Socioeconomic factors encompassed educational attainment (grouped as less than high school, high school graduate, or college and above), marital status (dichotomized as married/cohabitating or single), and the family income-to-poverty ratio (categorized as <1.0, 1.0–3.0, or >3.0). Health behaviors assessed were smoking status (defined as having smoked at least 100 cigarettes in life: yes/no), alcohol intake (defined as consuming at least 12 alcoholic drinks per year: yes/no), and total daily sedentary time (hours/day). Clinical measures included diabetes (defined by self-reported diagnosis, hypoglycemic medication use, HbA1c ⩾ 6.5%, fasting plasma glucose ⩾ 7.0 mmol/L, or 2-hour post-OGTT glucose ⩾ 11.1 mmol/l; Zhang et al., 2024), dyslipidemia (based on self-reported diagnosis or lipid-lowering medication use), and body mass index (BMI, calculated as weight in kilograms divided by height in meters squared). BMI was analyzed as normal weight (<25.0 kg/m2), overweight (25.0–29.9 kg/m2), or obesity (⩾30.0 kg/m2; Valenzuela et al., 2023). Finally, systolic and diastolic blood pressure represented as the mean of three consecutive measurements。
Statistical analysis
Statistical analyses were performed using the R statistical programming language (version 4.3.1, R Foundation for Statistical Computing, Vienna, Austria) and EmpowerStats software. Accounting for NHANES’ complex multistage stratified clustered sampling design, all analyses incorporated survey weights, strata, and primary sampling units (PSUs) to adjust for unequal selection probabilities and clustering. For the pooled analysis of five 2009–2018 cycles, 10-year combined mobile examination center (MEC) weights were constructed by dividing cycle-specific 2-year MEC weights by 5, per official NHANES guidelines. Categorical variables were presented as weighted percentages (%) and compared via weighted chi-square tests; continuous variables were expressed as weighted mean ± standard deviation and analyzed using weighted t-tests or analysis of variance, as appropriate. A directed acyclic graph (DAG; DAGitty version 3.0) guided covariate selection, distinguishing confounders from potential mediators (sedentary time, BMI, diabetes, dyslipidemia; Supplemental Text S1). Covariates identified as common causes of exposures (sleep duration/physical activity (PA)) and the outcome (hypertension) were included in multivariable models, while potential mediators were addressed via sensitivity analyses and formal mediation testing. Notably, systolic and diastolic blood pressure (SBP/DBP)—calculated as the mean of three consecutive measurements—are components of the hypertension definition (outcome-related measurements) and were never included as covariates in regression models to avoid outcome contamination or over-adjustment. To assess joint effects, a combined exposure variable was created with nine categories (all sleep duration (short: <7 hours; normal: 7–8 hours; long: ⩾9 hours) and PA level (No PA, insufficient PA, sufficient PA) combinations), with “normal sleep and sufficient PA” as the reference group. Associations with hypertension were examined using multivariable weighted logistic regression (odds ratios (ORs) and 95% confidence intervals (CIs)), with three sequential models: Model 1 (unadjusted); Model 2 (minimally adjusted for age, sex, race/ethnicity); and Model 3 (fully adjusted, retaining Model 2 covariates plus educational attainment, marital status, family poverty-income ratio, smoking status, alcohol intake, diabetes, dyslipidemia, BMI, and sedentary time). Stratified analyses were conducted by age, sex, race/ethnicity, and BMI categories to evaluate association consistency. Multiplicative interactions between sleep duration and PA were tested via cross-product terms in the fully adjusted model. Supplementary analyses addressed potential biases: (1) multiple imputation (10 datasets via chained equations) to mitigate selection bias from excluding 5132 participants with missing covariates; (2) a mediator-excluded sensitivity model (adjusting for all confounders except diabetes, dyslipidemia, BMI, and sedentary time) to avoid over-adjustment and isolate direct effects (Supplemental Tables S4-S5); and (3) the minimally adjusted model to assess effect estimate robustness. A two-tailed p-value <0.05 was considered statistically significant.
Results
Demographic and clinical characteristics of the participants
The final analytical sample comprised 6765 Young adults, with 5132 participants excluded due to missing covariate data (accounting for 37.7% of the initial 13,604 participants). To assess potential selection bias and sample representativeness, baseline characteristics of included and excluded participants were compared (Supplemental Table S3). Minor but statistically significant differences were observed between the two groups: excluded participants were slightly older (33.50 ± 7.20 vs 32.11 ± 7.16 years, p = 0.012), had higher proportions of short sleep (42.11% vs 38.60%, p = 0.005), No PA (27.81% vs 22.40%, p < 0.001), hypertension (23.40% vs 18.70%, p < 0.001), and higher mean BMI (29.70 ± 7.30 vs 28.30 ± 6.10 kg/m2, p < 0.001). However, sensitivity analyses confirmed that these differences did not materially affect the robustness of study findings (Supplemental Table S4).
As detailed in Table 1, the mean age of the total included population was 32.11 ± 7.16 years, with 51.44% being male. The racial/ethnic composition was 37.38% Non-Hispanic White, 24.27% Mexican American, 20.95% Non-Hispanic Black, and 17.40% Other Race. The majority of participants (64.49%) had attained college or above education level.
Participant demographic characterization of the prevalence of sleep-exercise combinations.
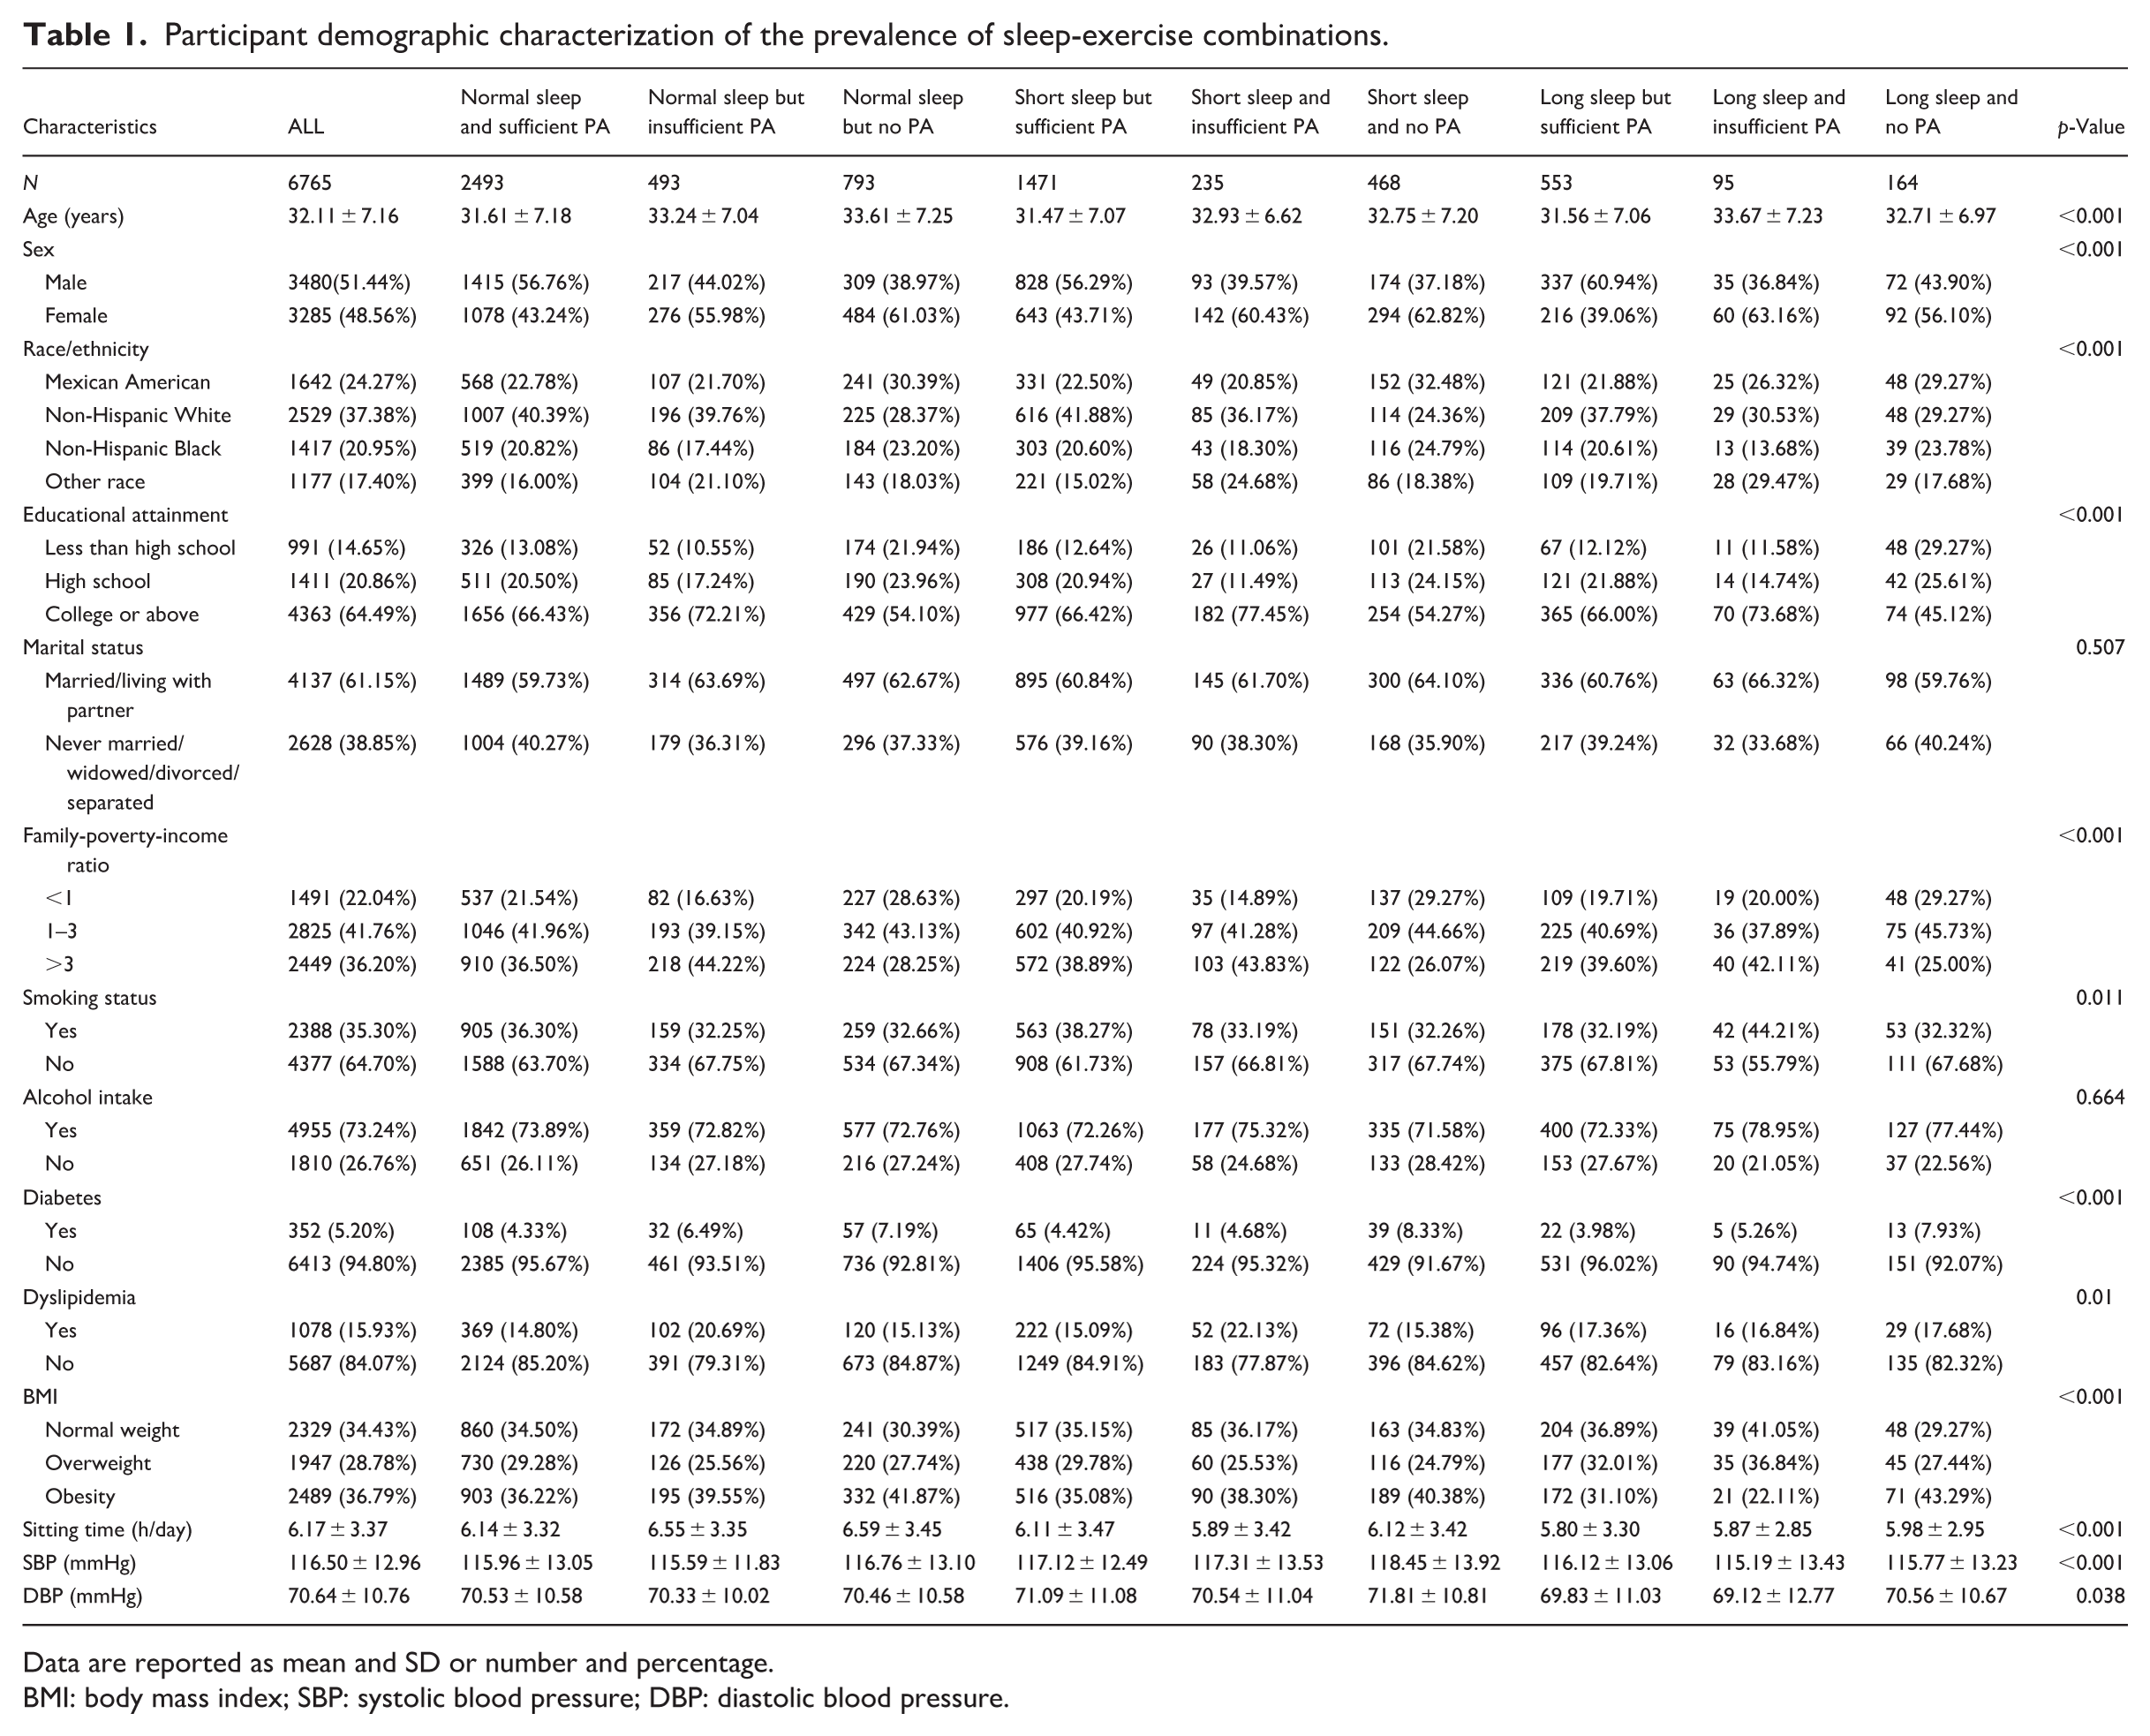
Data are reported as mean and SD or number and percentage.
BMI: body mass index; SBP: systolic blood pressure; DBP: diastolic blood pressure.
The study population was further categorized into nine groups based on combinations of sleep duration (normal: 7–8 h/day, short: <7 h/day, long: ⩾9 h/day) and PA level (sufficient PA, insufficient PA, No PA). Significant heterogeneity was observed across the groups for most variables. The “Normal sleep and sufficient PA” group was the largest (N = 2493), while the “Long sleep and insufficient PA” group was the smallest (N = 95). Groups with insufficient or No PA, regardless of sleep duration, tended to be older. Furthermore, the distribution of sex, race/ethnicity, educational attainment, and family-poverty-income ratio varied significantly across the groups (all p < 0.001). For instance, groups with No PA consistently had a lower proportion of individuals with a college or above education. The prevalence of cardiometabolic conditions also differed, with significant variations observed for diabetes, dyslipidemia, BMI (all p < 0.001). The “Short sleep and No PA” group exhibited the highest mean systolic blood pressure (118.45 ± 13.92 mmHg) and one of the highest prevalences of diabetes (8.33%).
When stratified by hypertension status (Supplemental Table S1), significant differences were observed in blood pressure measurements between the non-hypertensive and hypertensive groups, as expected by the group definition. The hypertensive group had substantially higher mean systolic blood pressure (127.15 ± 12.73 vs 110.48 ± 8.42 mmHg, p < 0.001) and diastolic blood pressure (78.86 ± 10.72 vs 66.00 ± 7.53 mmHg, p < 0.001). However, no statistically significant differences were found in demographic, socioeconomic, and clinical characteristics categories (all p > 0.05).
Analysis of factors associated with hypertension
The distribution of PA, sleep duration, and their combinations, stratified by hypertension status, is presented in Table 2. A significant difference was observed in the distribution of sleep duration categories between the hypertensive and non-hypertensive groups (p < 0.001). A higher proportion of individuals with hypertension reported short sleep duration compared to those without hypertension (35.72% vs 30.11%). Conversely, the proportion of individuals with normal (53.46% vs 57.22%) or long sleep duration (10.82% vs 12.67%) was lower in the hypertensive group.
Hypertensive status by level of sleep duration, physical activity, and combined effects.
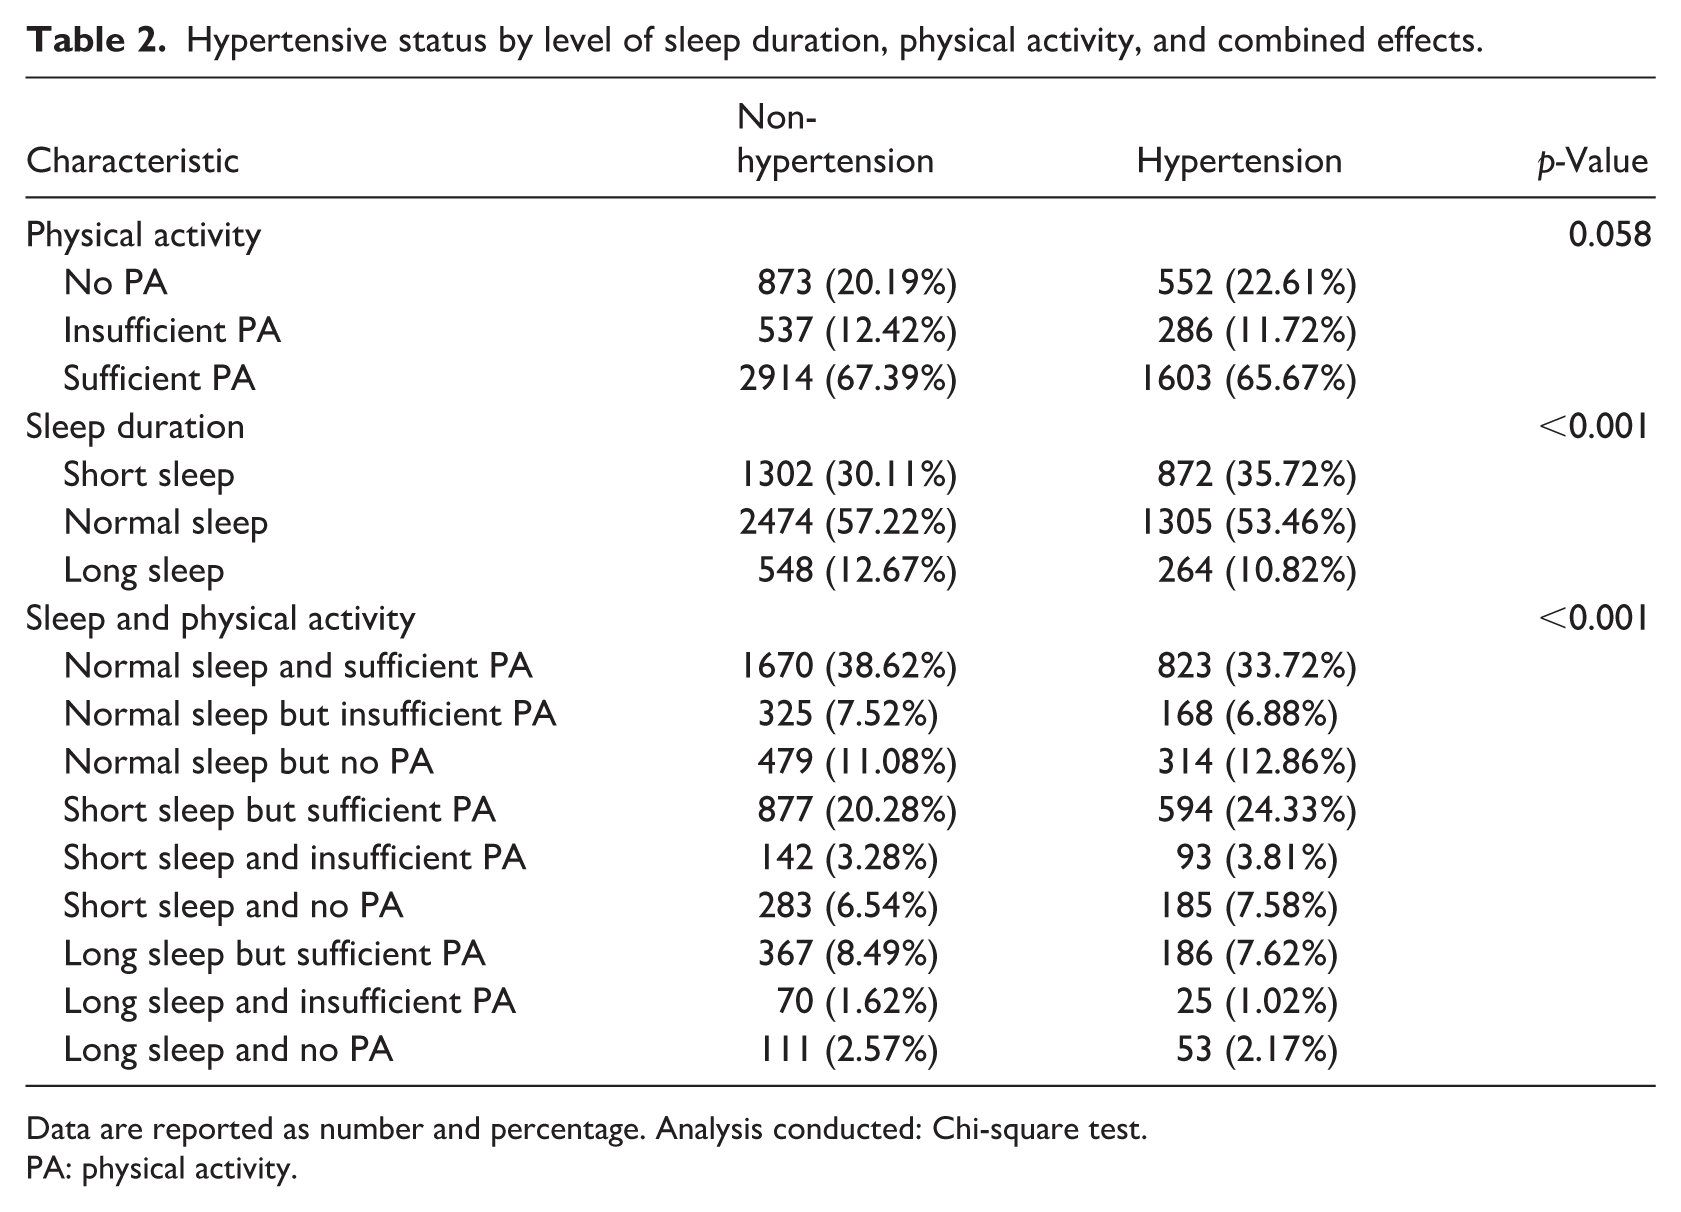
Data are reported as number and percentage. Analysis conducted: Chi-square test.
PA: physical activity.
The analysis of combined sleep-PA patterns also showed a significant overall difference between the groups (p < 0.001). Visually, the hypertensive group had a lower proportion of individuals in the “Normal sleep and sufficient PA” category (33.72% vs 38.62%) and a higher proportion in several categories involving short sleep, particularly “Short sleep but sufficient PA” (24.33% vs 20.28%).
Association of sleep duration, PA, and combined effects with hypertension
The results from the logistic regression analyses examining the associations between sleep duration, PA, and their combinations with hypertension are presented in Table 3. In the analysis of individual factors, short sleep duration was consistently associated with a significantly higher risk of hypertension across all models. In the fully adjusted Model 3, individuals with short sleep had a 28% higher odds of hypertension compared to those with normal sleep duration (OR: 1.28, 95% CI: 1.14–1.42, p < 0.0001). In contrast, long sleep duration and insufficient PA were not independently associated with hypertension. However, reporting No PA was associated with a 15% increased odds of hypertension in the fully adjusted model (OR: 1.15, 95% CI: 1.01–1.30, p = 0.0342).
Association of physical activity and sleep duration and their combined effect with hypertension.
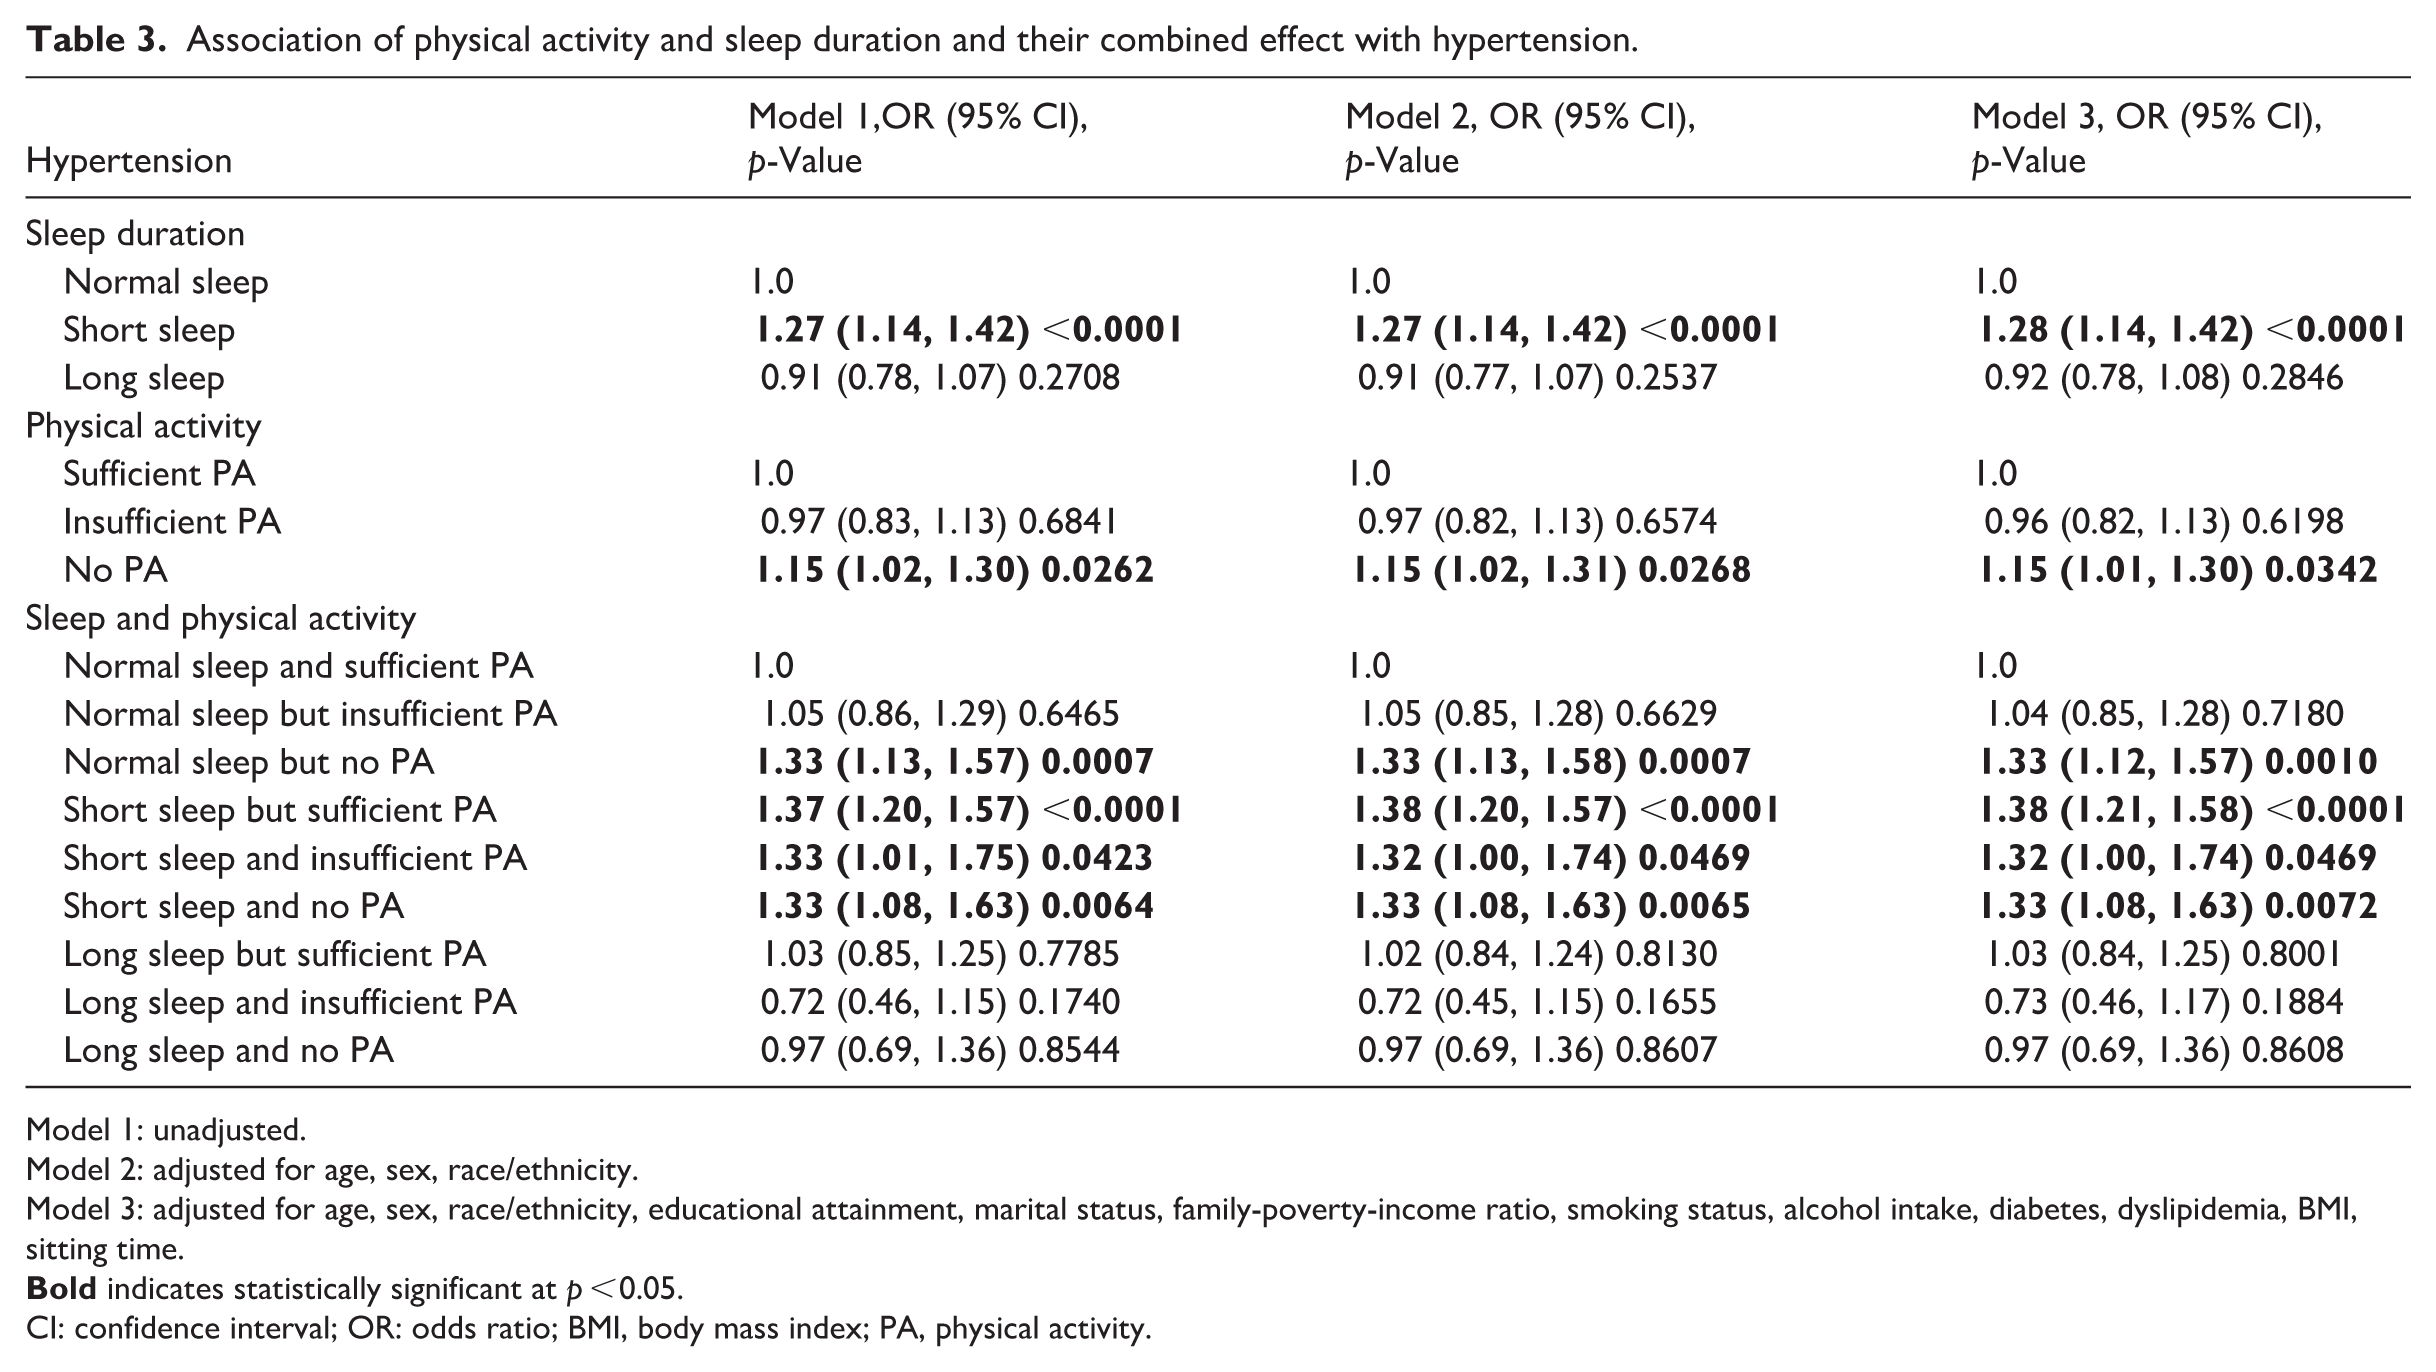
Model 1: unadjusted.
Model 2: adjusted for age, sex, race/ethnicity.
Model 3: adjusted for age, sex, race/ethnicity, educational attainment, marital status, family-poverty-income ratio, smoking status, alcohol intake, diabetes, dyslipidemia, BMI, sitting time.
CI: confidence interval; OR: odds ratio; BMI, body mass index; PA, physical activity.
When examining the combined effects, using “Normal sleep and sufficient PA” as the reference, several patterns emerged. The risk of hypertension was significantly elevated in groups involving short sleep, regardless of PA level. The highest risk was observed for “Short sleep but sufficient PA” (OR: 1.38, 95% CI: 1.21–1.58, p < 0.0001), followed by “Short sleep and No PA” (OR: 1.33, 95% CI: 1.08–1.63, p = 0.0072) and “Short sleep and insufficient PA” (OR: 1.32, 95% CI: 1.00–1.74, p = 0.0469). Notably, the group “Normal sleep but No PA” also showed a significant 33% increased odds of hypertension (OR: 1.33, 95% CI: 1.12–1.57, p = 0.0010). None of the combinations involving long sleep duration showed a statistically significant association with hypertension.
Sensitivity analyses confirmed the robustness of these associations: the core findings remained consistent across the minimally adjusted model, mediator-excluded model, and multiple imputation model (Supplemental Table S4). Additionally, formal mediation analysis (Supplemental Table S5) demonstrated that sedentary time acts as a partial mediator in the associations of short sleep and No PA with hypertension, accounting for 13.4% and 13.9% of the total effect, respectively—confirming its role as a mediator rather than a confounder.
Both short sleep duration and No PA were associated with a higher prevalence of hypertension in this sample (Figure 2). The adjusted prevalence of hypertension with 95% confidence intervals, stratified by sleep duration and PA status, is provided in Supplemental Figure 1.
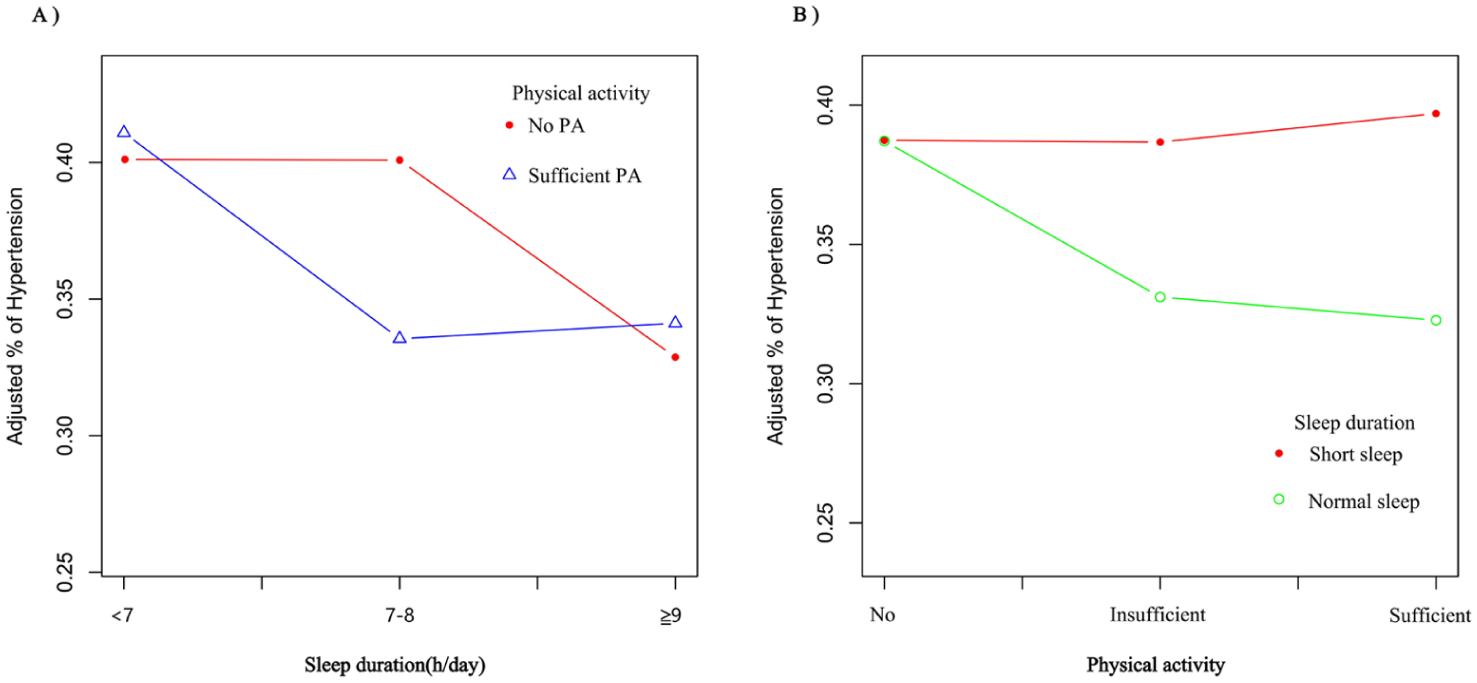
Both short sleep duration and No PA were associated with a higher prevalence of hypertension.
Subgroup analyses
A stratified analysis according to age, sex, race/ethnicity, and BMI status was performed (Supplemental Table 2). There was no evidence that the association between the combined sleep-PA categories and hypertension differed by these factors (All P for interaction > 0.05), indicating the consistency of the associations across subgroups.
Discussion
In this cross-sectional study of Young adults, we found that short sleep duration and lack of PA were independently associated with an increased risk of hypertension. These findings underscore the importance of healthy sleep and sufficient PA in reducing hypertension risk in this population. Notably, short sleep remained linked to elevated hypertension risk even among participants with sufficient PA. Similarly, physical inactivity was associated with higher hypertension risk regardless of sleep duration. The consistency of these associations across key demographic and clinical subgroups further strengthens the evidence base. Our results provide novel evidence supporting the combined benefits of adequate sleep and regular PA for lowering hypertension likelihood in Young adults. Collectively, these findings highlight the importance of simultaneously improving sleep duration and promoting physical activity for hypertension prevention in Young adults, with important implications for public health strategy and practice.
In alignment with previous research emphasizing the critical role of early-life risk factors in hypertension development (Li et al., 2022b; Mak et al., 2025), our findings corroborate that short sleep duration is a significant risk factor for hypertension, as supported by multiple studies across different populations (Bock et al., 2022; Khan and Aouad, 2017). Specifically, a meta-analysis in Asian adults reported a similar positive association (Nurrobi et al., 2024). The lack of a significant association for long sleep duration in our study aligns with some report, though a U-shaped relationship has also been described, with potential mechanisms for long sleep’s effect involving underlying inflammatory processes or poor sleep quality (Sanchez Corredera et al., 2025). Regarding PA, our results are consistent with established evidence that adequate activity is a robust protective factor against hypertension (Yan et al., 2024; Zhang et al., 2025). Furthermore, the joint benefit of healthy sleep and sufficient PA has been highlighted in other studies, such as the NHANES analysis by Cheng et al, which reported that only the combination of both factors was significantly associated with lower hypertension odds (Yan et al., 2024). However, a key distinction of our study is the focus on Young adults, whereas several major previous studies, such as the HypnoLaus (Berger et al., 2022) and ELSA-Brasil studies (Parise et al., 2023), primarily involved middle-aged or older populations. This difference in target population may explain inconsistencies with studies like that of Marín et al., which found no significant association between sleep quality and hypertension in a specific regional population (Marín et al., 2024), suggesting potential variations across ethnic and cultural contexts.
A notable finding of our study is that short sleep duration may attenuate the protective effect of sufficient PA, as individuals with adequate activity but short sleep still exhibited elevated hypertension risk. This observation extends the concept proposed by Fernandez-Mendoza regarding “insomnia with objective short sleep duration” as a high-risk physiological phenotype (Fernandez-Mendoza, 2025), and suggests that the detrimental pathophysiological effects of sleep deprivation (e.g. increased sympathetic nervous system activity and cortisol levels (Khan and Aouad, 2017)) may not be fully compensated by PA alone. Conversely, no-PA consistently elevated hypertension risk regardless of sleep duration, underscoring its fundamental and independent role, a notion supported by Mendelian randomization evidence linking sedentary behaviors to hypertension risk (Wang et al., 2025). This complex interplay between sleep-PA aligns with the 24-hour movement behavior framework emphasized by Riquelme et al. (2022), but our study specifically delineates their interaction in Young adults.
The physiological mechanisms underlying these associations are multifaceted. Chronic short sleep is associated with sustained sympathetic overactivity and HPA axis dysregulation, leading to increased vascular resistance and sodium retention (Bock et al., 2022; Khan and Aouad, 2017). Objectively measured poor sleep microarchitecture, including reduced slow-wave activity and spindle density, has been inversely linked to incident hypertension (Berger et al., 2022). PA, conversely, improves endothelial function and promotes parasympathetic tone. Our finding that short sleep attenuates the protective effect of sufficient PA suggests that the detrimental pathophysiological effects of sleep deprivation may not be fully compensated by PA alone.
Our results indicate significant joint associations of sleep duration and physical activity with hypertension in Young adults, but causal inferences are precluded by the cross-sectional nature of the data. We cannot determine whether suboptimal sleep or insufficient PA precedes hypertension, or if other unmeasured factors drive these associations. However, several limitations of this study must be acknowledged. First, the cross-sectional design of this study precludes the establishment of definitive causal relationships among sleep duration, PA, and hypertension, as it only captures a single snapshot of exposures and outcomes rather than their temporal sequence over time. Second, sleep duration and PA were assessed using self-reported measures, which are inherently susceptible to recall bias (e.g. inaccuracies in estimating habitual sleep or activity levels) and social desirability bias (e.g. overreporting PA or ideal sleep duration), potentially leading to misclassification of exposures. Third, although we adjusted for a comprehensive set of key confounding variables (e.g. demographic characteristics, socioeconomic factors, health behaviors, and clinical measures), residual confounding from unmeasured or incompletely measured factors-such as detailed dietary patterns, chronic psychosocial stress, genetic predisposition to hypertension, or sleep quality (beyond duration)-cannot be entirely ruled out. Fourth, due to the absence of detailed psychiatric data in the NHANES database, we were unable to exclude individuals with severe mental health comorbidities (e.g. psychosis), which may introduce additional residual confounding. Finally, while NHANES is designed to be nationally representative, the generalizability of our findings to the broader U.S. young adult population may still be limited, as our analytical sample was restricted to participants aged 18–44 years with complete data on all key variables. Given these limitations, future research employing longitudinal or interventional study designs, objective measures of sleep-PA, and comprehensive assessment of potential confounders (including mental health comorbidities) is imperative to establish definitive causal conclusions and enhance the generalizability of findings regarding the relationships among sleep duration, PA, and hypertension in Young adults.
These findings carry important and actionable public health implications. Given that short sleep and physical inactivity independently increase hypertension risk in Young adults and cannot offset one another, population-level strategies should prioritize integrated interventions that simultaneously promote adequate sleep and regular physical activity rather than focusing on a single health behavior. Practical approaches may include school- and workplace-based health programs, standardized sleep hygiene education, accessible fitness resources, and public health campaigns targeting Young adults to raise awareness of the combined cardiovascular benefits of healthy sleep and regular exercise. Individual-level counseling in primary care settings may also help Young adults establish consistent sleep schedules and sustainable physical activity routines from early adulthood onward. Such targeted interventions may help reduce the growing burden of hypertension and subsequent cardiovascular risk in this high-risk population.
These findings carry important public health implications. While promoting both sufficient sleep and sufficient PA remains the ideal strategy for hypertension prevention in Young adults, ensuring adequate sleep may represent a more foundational component. The persistence of hypertension risk with short sleep, even in physically active individuals, indicates that sleep deprivation establishes a physiological state not easily remedied by exercise alone. These findings emphasize the importance of promoting both adequate sleep and sufficient PA as integral components of cardiovascular health strategies from early adulthood. Future research should employ longitudinal and interventional designs with objective measures of sleep-PA to establish causality and elucidate the underlying biological mechanisms in young adult populations.
Conclusion
In conclusion, this cross-sectional study of Young adults demonstrates that short sleep and No PA are associated with an elevated risk of hypertension. Short sleep duration was associated with elevated hypertension risk even among those with sufficient PA, while No PA was associated with increased hypertension risk regardless of sleep duration. Combining adequate sleep duration with sufficient PA represents a practical approach to hypertension prevention among Young adults. Consequently, our findings contribute to identifying potentially effective lifestyle management strategies for early-stage hypertension within the studied population.
Supplemental Material
sj-docx-1-hpq-10.1177_13591053261458537 – Supplemental material for Hypertension in young adults: Joint Associations of sleep duration and physical activity
Supplemental material, sj-docx-1-hpq-10.1177_13591053261458537 for Hypertension in young adults: Joint Associations of sleep duration and physical activity by Minqi Huo, Fang Liu and Hongmei Gao in Journal of Health Psychology
Supplemental Material
sj-jpg-2-hpq-10.1177_13591053261458537 – Supplemental material for Hypertension in young adults: Joint Associations of sleep duration and physical activity
Supplemental material, sj-jpg-2-hpq-10.1177_13591053261458537 for Hypertension in young adults: Joint Associations of sleep duration and physical activity by Minqi Huo, Fang Liu and Hongmei Gao in Journal of Health Psychology
Supplemental Material
sj-jpg-3-hpq-10.1177_13591053261458537 – Supplemental material for Hypertension in young adults: Joint Associations of sleep duration and physical activity
Supplemental material, sj-jpg-3-hpq-10.1177_13591053261458537 for Hypertension in young adults: Joint Associations of sleep duration and physical activity by Minqi Huo, Fang Liu and Hongmei Gao in Journal of Health Psychology
Supplemental Material
sj-jpg-4-hpq-10.1177_13591053261458537 – Supplemental material for Hypertension in young adults: Joint Associations of sleep duration and physical activity
Supplemental material, sj-jpg-4-hpq-10.1177_13591053261458537 for Hypertension in young adults: Joint Associations of sleep duration and physical activity by Minqi Huo, Fang Liu and Hongmei Gao in Journal of Health Psychology
Supplemental Material
sj-jpg-5-hpq-10.1177_13591053261458537 – Supplemental material for Hypertension in young adults: Joint Associations of sleep duration and physical activity
Supplemental material, sj-jpg-5-hpq-10.1177_13591053261458537 for Hypertension in young adults: Joint Associations of sleep duration and physical activity by Minqi Huo, Fang Liu and Hongmei Gao in Journal of Health Psychology
Supplemental Material
sj-jpg-6-hpq-10.1177_13591053261458537 – Supplemental material for Hypertension in young adults: Joint Associations of sleep duration and physical activity
Supplemental material, sj-jpg-6-hpq-10.1177_13591053261458537 for Hypertension in young adults: Joint Associations of sleep duration and physical activity by Minqi Huo, Fang Liu and Hongmei Gao in Journal of Health Psychology
Footnotes
Acknowledgements
We thank the National Center for Health Statistics at the CDC for their responsibilities in designing, collecting, and administering the NHANES data and for making it accessible to the public.
Ethical considerations
The NHANES study protocols were approved by the NCHS Research Ethics Review Board, and all participants provided written informed consent. As this cross-sectional analysis utilized publicly available, de-identified data from NHANES, ethical approval from the Institutional Review Board of the Second Affiliated Hospital of Shandong University of Traditional Chinese Medicine was not required, nor was clinical trial registration necessary.
Consent to participate
The NHANES study protocols were approved by the NCHS Research Ethics Review Board, and all participants provided written informed consent.
Consent for publication
Not applicable. (This secondary analysis utilized de-identified, public-use data from NHANES. The original survey was approved by the NCHS Ethics Review Board, and informed consent was obtained from all participants).
Author contributions
MH and HG designed the research and collected the data, HG developed the data analysis strategy, MH performed the data analysis and wrote the draft of the manuscript, FL provided comments for revising the manuscript, MH and FL revised the manuscript together. All the authors agreed with the submission of this manuscript for publication.
Funding
The authors disclosed receipt of the following financial support for the research, authorship, and/or publication of this article: This study was supported by the Taishan Scholar Program Special Project Fund (No. tsqn202507381).
Declaration of conflicting interests
The authors declared no potential conflicts of interest with respect to the research, authorship, and/or publication of this article.
Data availability statement
Supplemental material
Supplemental material for this article is available online.
References
Supplementary Material
Please find the following supplemental material available below.
For Open Access articles published under a Creative Commons License, all supplemental material carries the same license as the article it is associated with.
For non-Open Access articles published, all supplemental material carries a non-exclusive license, and permission requests for re-use of supplemental material or any part of supplemental material shall be sent directly to the copyright owner as specified in the copyright notice associated with the article.