






Abstract
Subthreshold depression (StD) is prevalent among older adults, significantly impacting their quality of life. Understanding the central symptoms of StD is crucial for improving the structural comprehension of StD and forming effective prevention strategies. Network analysis offers a useful framework for examining complex interconnections among symptoms and identifying those that play a central role within the symptom network. In this cross-sectional study, a symptom network was constructed among 424 older adults with StD, with centrality assessed using expected influence (EI) and network stability evaluated via case-dropping subset bootstrap method and correlation stability coefficient. Among the 17 depressive symptoms analyzed, work and activities (EI = 0.63) and depressed mood (EI = 0.54) emerged as the most central symptoms. The network demonstrated acceptable stability. These findings enhance the understanding of the symptom structure of StD and provide a foundation for developing targeted interventions in older adults.
Background
Subthreshold depression (StD), which defined by clinically significant depressive symptoms that do not meet diagnostic criteria for major depressive disorder (MDD), is a prevalent condition that significantly impacts the quality of life of over one-third of the older adult population (Tuithof et al., 2018; Xiang et al., 2018). StD is associated with increased risks of cognitive decline, social isolation, and mortality (Cuijpers et al., 2007a; 2007b; da Silva Lima and de Almeida Fleck, 2007; Goldney et al., 2004; Tuithof et al., 2018). It is also recognized as a precursor to MDD, as studies have found a notably higher incidence of progressing to MDD in StD patients than those without StD (Cuijpers et al., 2007b; Cuijpers and Smit, 2004). In later life, depressive symptoms should be understood within the broader context of aging-related life transitions rather than as isolated psychological phenomena. Older adults often experience a series of significant changes, including retirement, reduction in social roles, declining physical health, and increased exposure to chronic conditions, all of which may influence how depressive symptoms are expressed and interconnected (English and Carstensen, 2014; Kotwal and Meier, 2022). For example, declining physical health and increased chronic disease burden may lead individuals to focus more on bodily discomfort, resulting in emotional distress being expressed through somatic symptoms (Alexopoulos, 2005). Retirement and the reduction of social roles may decrease engagement in daily activities and sense of purpose, which may be reflected in symptoms such as loss of interest or reduced activity (Kim and Moen, 2002). In addition, reductions in social networks and increased experiences of loneliness or social isolation may further exacerbate low mood and interact with depressive symptoms (English and Carstensen, 2014). Taken together, these aging-related contextual factors may shape the expression of subthreshold depression in older adults, making it more subtle, multifaceted, and difficult to detect, thereby posing challenges for timely identification and intervention.
Borsboom et al. indicate that a mental disorder refers to a set of symptoms that are empirically connected and exist in an interrelated manner (Borsboom, 2017; Borsboom and Cramer, 2013; Kendler, 2012; Kendler et al., 2011). Network theory of psychopathology also showed that there is a strong correlation between symptoms of psychopathology, which continuously strengthen through synergistic effects. This self-reinforcing feedback loop is believed to trigger and sustain psychological health problems (Borsboom, 2017; Borsboom and Cramer, 2013; Mcnally et al., 2015; McNally et al., 2017). The symptoms of StD mainly include depressed mood, feelings of guilt, suicide, insomnia, loss of interest in work or activities and so on. Although these symptoms present a unique psychological structure, they also interact with each other in complex ways (Fried and Cramer, 2017). In empirical studies, the presence of certain depressive symptoms, such as depressed mood, appears to be more strongly correlated with the overall score of depression, while other symptoms, such as loss weight and insomnia, have limited association with the total depression score in adults with MDD (Faravelli et al., 1996). The results of the study from Fried and Nesse showed that the contribution of different depressive symptoms to psychosocial functioning varies, with the impact of hypersomnia being 0.7% and that of sad mood being 20.9% (Fried and Nesse, 2014). These studies suggest that certain symptoms of depression may be more important than others (Mullarkey et al., 2019). Compared to patients with MDD, individuals with StD may exhibit more subtle emotional symptoms, such as mild depressed mood, low energy or fatigue, poor concentration or indecisiveness, and low self-esteem, rather than the persistent and severe depression commonly seen in MDD (Serretti et al., 1999). StD patients typically may not display the strong suicidal tendencies or complete loss of interest in life that are often observed in MDD patients (Wesselhoeft et al., 2013). Additionally, the symptom network structure of StD differs from that of MDD. MDD symptoms tend to be more concentrated and mutually reinforcing, such as extreme helplessness, self-deprecation, and persistent sadness, which often form a tightly interconnected network (Fried et al., 2016; van Borkulo et al., 2015). In contrast, the symptom network in StD is more dispersed, with weaker associations between symptoms (Hakulinen et al., 2020).
Given the varying significance of different symptoms, investigating the central symptoms is critical (Fried and Nesse, 2015). First, recognizing the central symptoms within the network may enables the identification of those with the most substantial impact on the network’s structure and dynamics, which is pivotal for guiding early intervention strategies (Beard et al., 2016). Treatment that targets the central symptoms can effectively improve the disease (Fried et al., 2017). In individuals receiving treatment for depression, changes in one symptom have been found to predict changes in other symptoms the following week (Bringmann et al., 2015). One interpretation of this finding is that effective therapies target some symptoms first, which leads to downstream effects on other symptoms (Cramer et al., 2010). Therefore, such central symptoms represent key targets for preventative actions may aimed at reducing the risk of progression from StD to MDD. Second, looking for central symptoms can be used to predict the course of psychopathology (Fried et al., 2017). Study on predicting the future course of psychopathology showed that the most interconnected or central depression symptoms in the baseline network were the ones most predictive of future MDD onset (Boschloo et al., 2016). Depressed mood, for example, were more predictive of MDD than other symptoms. This implies that the nature of symptoms may play an important role above and beyond the number of symptoms (Fried and Nesse, 2015).
Network analysis (NA) is a statistical approach for examining relationships and interconnections among variables within complex systems and has been widely applied across disciplines, including the social sciences, biology, and computer science. (Epskamp et al., 2018). In recent years, network analysis has been increasingly adopted in medical research. Within symptom science, symptom network analysis has emerged as a key paradigm for visualizing and quantitatively interpreting relationships among co-occurring symptoms, thereby providing a novel framework for capturing the complex organization of symptom experiences and identifying central symptoms. (Zhu et al., 2022). Accordingly, NA has been applied to a range of health-related contexts, including psychopathology and chronic diseases (Fried et al., 2016; Zhu et al., 2021). By modeling symptoms as nodes and their associations as edges, network analysis allows the identification of symptoms that occupy central positions within the network and exert a disproportionate influence on the overall symptom structure.
Recently, a number of studies have utilized network approaches in order to reveal the different central symptoms regarding depression. However, these studies have tended to focus on either adolescents (Mullarkey et al., 2019; Rubin et al., 2021; Schweren et al., 2018) or young adults (Fried et al., 2016; Hartung et al., 2019; Herniman et al., 2021). A small number of studies have been conducted on MDD in older adults. The current research on the central symptoms of depression in elderly people is inconsistent. The result of study by Seon-Cheol et al. showed that among items on the HAMD-17 the anxiety psychic item was the most central domain in older adults patients with MDD, followed by insomnia (middle of the night), depressive mood, and insomnia (early hours of the morning) items (Park, 2021). The result of study by Kyoung et al. showed that among items on the geriatric depression scale-15, loss happy, hopeless and empty showed significantly higher strength centrality than the other symptoms (Kim et al., 2021). The results of study by Pascal et al. suggest the central symptoms from the aged 50 and above residing in private households in England were everything was an effort, could not get going, loneliness (Schlechter et al., 2023). A previous study showed that high central symptoms differ across samples, suggesting that the reproducibility of the network results may be limited. Therefore, the conclusions of previous studies may be difficult to generalize to the elderly with StD (Forbes et al., 2017; Pan and Liu, 2021).
This study aims to identify the central symptoms of StD and explore the interrelationships among StD symptoms in older adults. Recognizing these central symptoms is crucial for devising effective early intervention strategies specifically tailored to older adults. By mapping the interrelations, our study seeks to contribute a deeper understanding of StD’s symptomatology, potentially informing more precise clinical approaches and helping prevent the progression to MDD.
Methods
Participants
The data sourced from medical examinations conducted at the outpatient department in a comprehensive hospital. Participants were recruited through local community centers. The data were collected spanning from July 2021 to October 2022. The study was approved by the Chinese Clinical Trial Registry, and the registration date is July 28, 2021.
The inclusion criteria of this cross-sectional study were: a. age ⩾60 years old; b. not diagnosed with current or past major depressive disorder (MDD) according to the Diagnostic and Statistical Manual of Mental Disorders 5th edition (DSM-Ⅴ) or any other diagnostic criteria; c. 7 ⩽ Hamilton Depression Scale-17 (HAMD-17) <17 (Demyttenaere and De Fruyt, 2003; Zimmerman et al., 2013). The exclusion criteria were: a. A diagnosis of schizophrenia, bipolar disorder, or dementia; b. Alcohol or drug addiction disorders; c. Patients with severe physical illness or who are unable to complete the test.
Since the HAMD-17 used in this study includes 17 symptoms, the network model to be constructed requires estimating 17 nodes. The number of pairwise association parameters is calculated as [17×(17−1)/2] (Papachristou et al., 2019). To ensure the reliability of the model, the sample size is calculated based on 3–5 cases per parameter (Epskamp et al., 2018). The range of the sample size should be from 408 to 680. To ensure ethical standards, a detailed consent process was implemented. Participants received both written and verbal explanations about the study’s purpose, procedures, potential risks and benefits, and their rights including the right to withdraw at any time. All patients are assessed by a psychiatrist.
The study was conducted across three tertiary-level general hospitals. These hospitals are large, comprehensive medical centers integrating clinical care, teaching, and research, and serve as regional referral centers for both common and complex conditions. As such, they serve a diverse population of older adults with varying health conditions and sociodemographic backgrounds. This clinical context enhances the representativeness of the sample and strengthens the generalizability of the study findings. Data were collected as part of a research-specific assessment rather than routine clinical care. All measures and scales were administered by trained researchers during participants’ clinical visits using standardized questionnaires. Relevant information was recorded directly at the time of the visit through face-to-face interviews, and no data were extracted from medical records after the visits.
Measures
Sociodemographic variables
Sociodemographic variables were collected during the clinical visit using structured inquiries, including age, gender identity (male/female), educational attainment (no education, primary school, junior high school, high school/vocational school, or college/university or higher), family history of depression (yes/no), and medically diagnosed comorbidities.
Depressive symptoms
Depressive symptoms were assessed with the HAMD-17 (Hamilton, 1960). The reliability coefficient (Cronbach’s α) of HAMD-17 is 0.88 ∼ 0.99 after localization in China (Hu et al., 2018). Each HAMD-17 item was scored according to the standard instrument guidelines, with higher scores indicating greater symptom severity. For the network analysis, all 17 HAMD-17 item scores were treated as individual variables (nodes) and entered using their original item-level values.
Data analysis
The mean, standard deviation, and the presence of scores greater than zero for all HAMD-17 items were analyzed. All analyses were conducted in the R statistical environment version 4.1.0 (Epskamp et al., 2012).
Network estimation
To reduce redundancy among nodes and to assess potential topological overlap, we examined whether pairs of symptoms showed highly similar patterns of associations with all other symptoms in the network. Topological overlap refers to the extent to which two nodes are connected to the rest of the network in a highly similar way, suggesting that they may represent overlapping or non-distinct constructs rather than independent symptoms. This was evaluated using the goldbricker function from the networktools package, which statistically compares the correlation profiles of symptom pairs with all remaining nodes in the network. Symptom pairs that did not show significant differences in their correlation patterns were considered to exhibit topological overlap (Hittner et al., 2003).
Network models estimating the associations between symptoms were constructed using the Gaussian graphical model (GGM) (Epskamp, 2016; Epskamp and Fried, 2018). Networks are graphical models consisting of nodes and edges. In the symptom network, each symptom is represented by one node, and the edges connecting two nodes indicate a relationship between the two symptoms. The thicker the edges are, the stronger the correlation between the two symptom nodes. Red and green edges represent negative and positive correlations, respectively.
To construct the conservative network model, the “least absolute shrinkage and selection operator (LASSO)” technique based on a GGM was utilized with the tuning parameter to minimize the extended Bayesian information criterion (EBIC) (Epskamp et al., 2018; Epskamp and Fried, 2018). This regularization approach identifies the neighborhood structure among nodes by shrinking weak edge coefficients to zero, thereby reducing spurious associations and yielding a parsimonious and interpretable network that retains only the most robust symptom connections. The layout of the network was based on the Fruchterman–Reingold algorithm (“spring” layout). This algorithm places nodes with stronger correlations approach the center of the network and nodes with weaker correlations on the periphery (Fruchterman and Reingold, 1991).
Centrality estimation
The node centrality metrics include expected influence (EI), strength, closeness and betweenness. Recently, EI has been used to assess node centrality instead of strength, especially when negative edges are present. EI reflects the summed weight of positive and negative edges with neighboring nodes in the network (Heeren et al., 2018). Strength is the sum of the edge weights connected to a node and is considered to be the most stable and reliable measure of node centrality (McNally, 2016). Closeness is the inverse of the sum of the distances of one node from all the others. Betweenness is the number of times that a node lies on the shortest path between two other nodes. The symptoms with the highest centrality were examined using EI indices in the current study , and higher values of EI reflect greater node centrality (Bringmann et al., 2019). The indices of node strength, closeness, and betweenness were used for supplementary analyses.
Network accuracy, stability and significance testing
To identify the estimated network accuracy and stability , robustness analyses were conducted by using the bootnet package (Epskamp et al., 2018). First, network accuracy was assessed by determining a nonparametric bootstrap approach. The bootstrapped 95% confidence intervals (CIs) around the edged weights were estimated. Smaller CIs represent greater accuracy in estimation. Second, network stability was examined with the case-dropping subset bootstrap with a correlation stability coefficient (CS). The CS should not be below 0.25, and a coefficient exceeding 0.50 suggests strong stability and interpretability (Epskamp et al., 2018). Finally, a bootstrapped difference test was conducted in order to examine significant differences between edge weights and node centralities, as well as to show whether they significantly differ from each other in centrality estimates. All bootstrap calculations involved 1000 iterations in the current study.
Results
Demographic characteristics
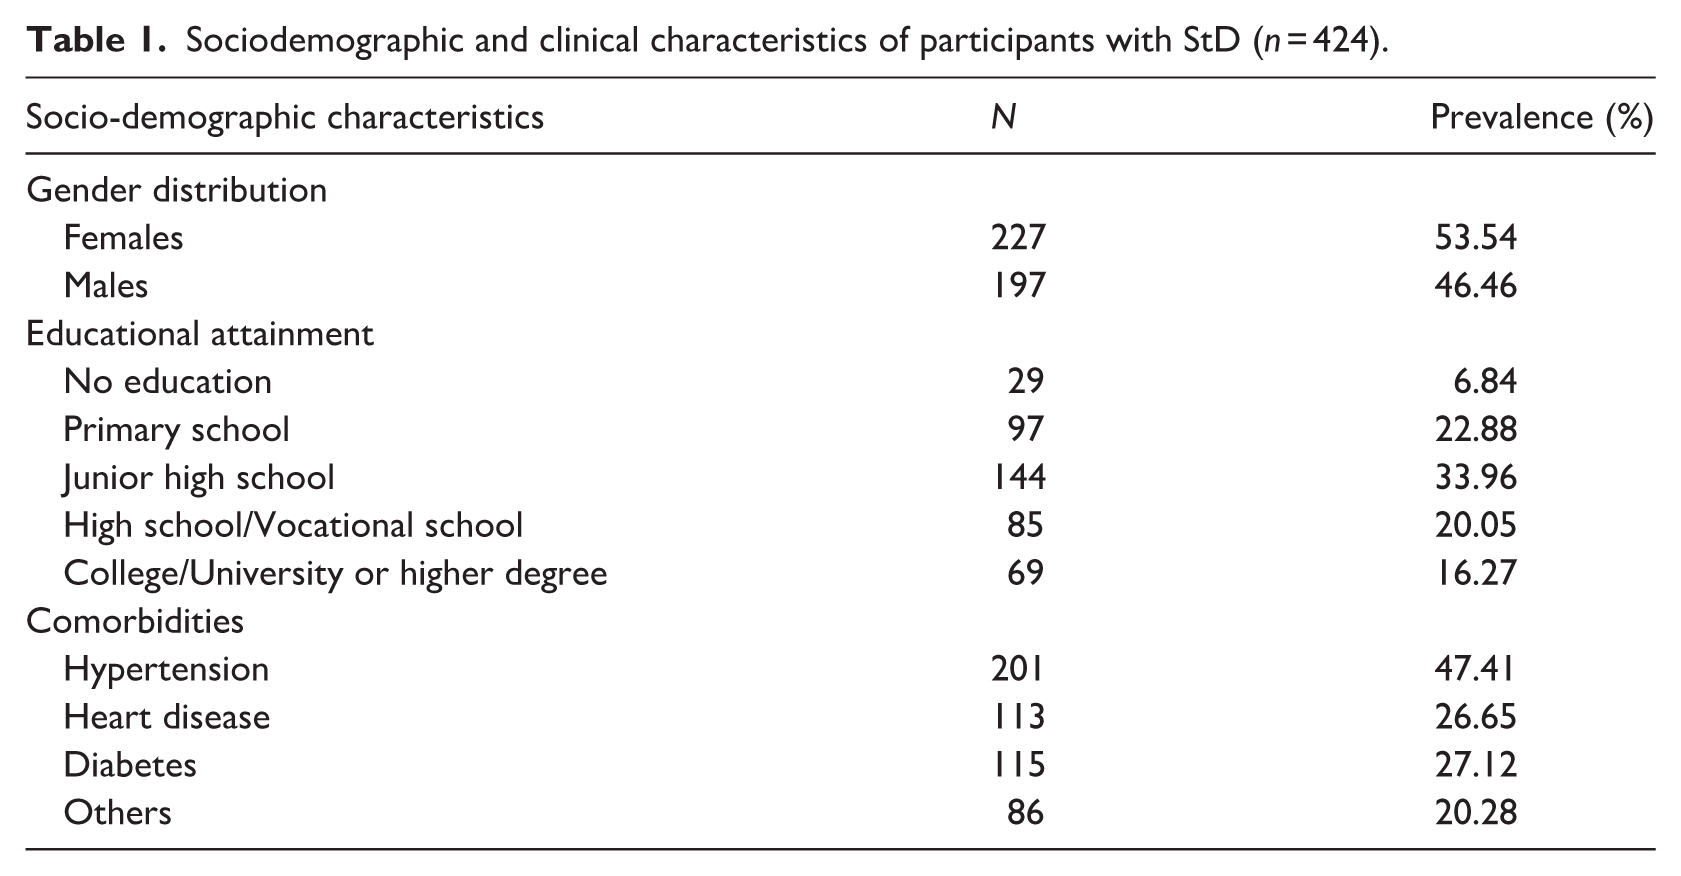
Among the 1512 individuals initially screened, 897 did not meet the criteria for subthreshold depression, 117 did not complete the assessment, and 74 were excluded due to severe medical or neurological conditions. As a result, a total of 424 older adults met the eligibility criteria for subthreshold depression and were included in the network analysis. The sample consisted of 227 (53.54%) females. On average, the participants were aged 69.69 ± 6.80 years old, reporting a HAMD-17 score of 10.46 ± 3.21. No participants reported a family history of MDD. Comorbidities such as hypertension, cerebral infarction, heart disease, and diabetes were prevalent, along with other conditions including fractures and liver diseases. Details are provided in the Table 1.
Sociodemographic and clinical characteristics of participants with StD (n = 424).
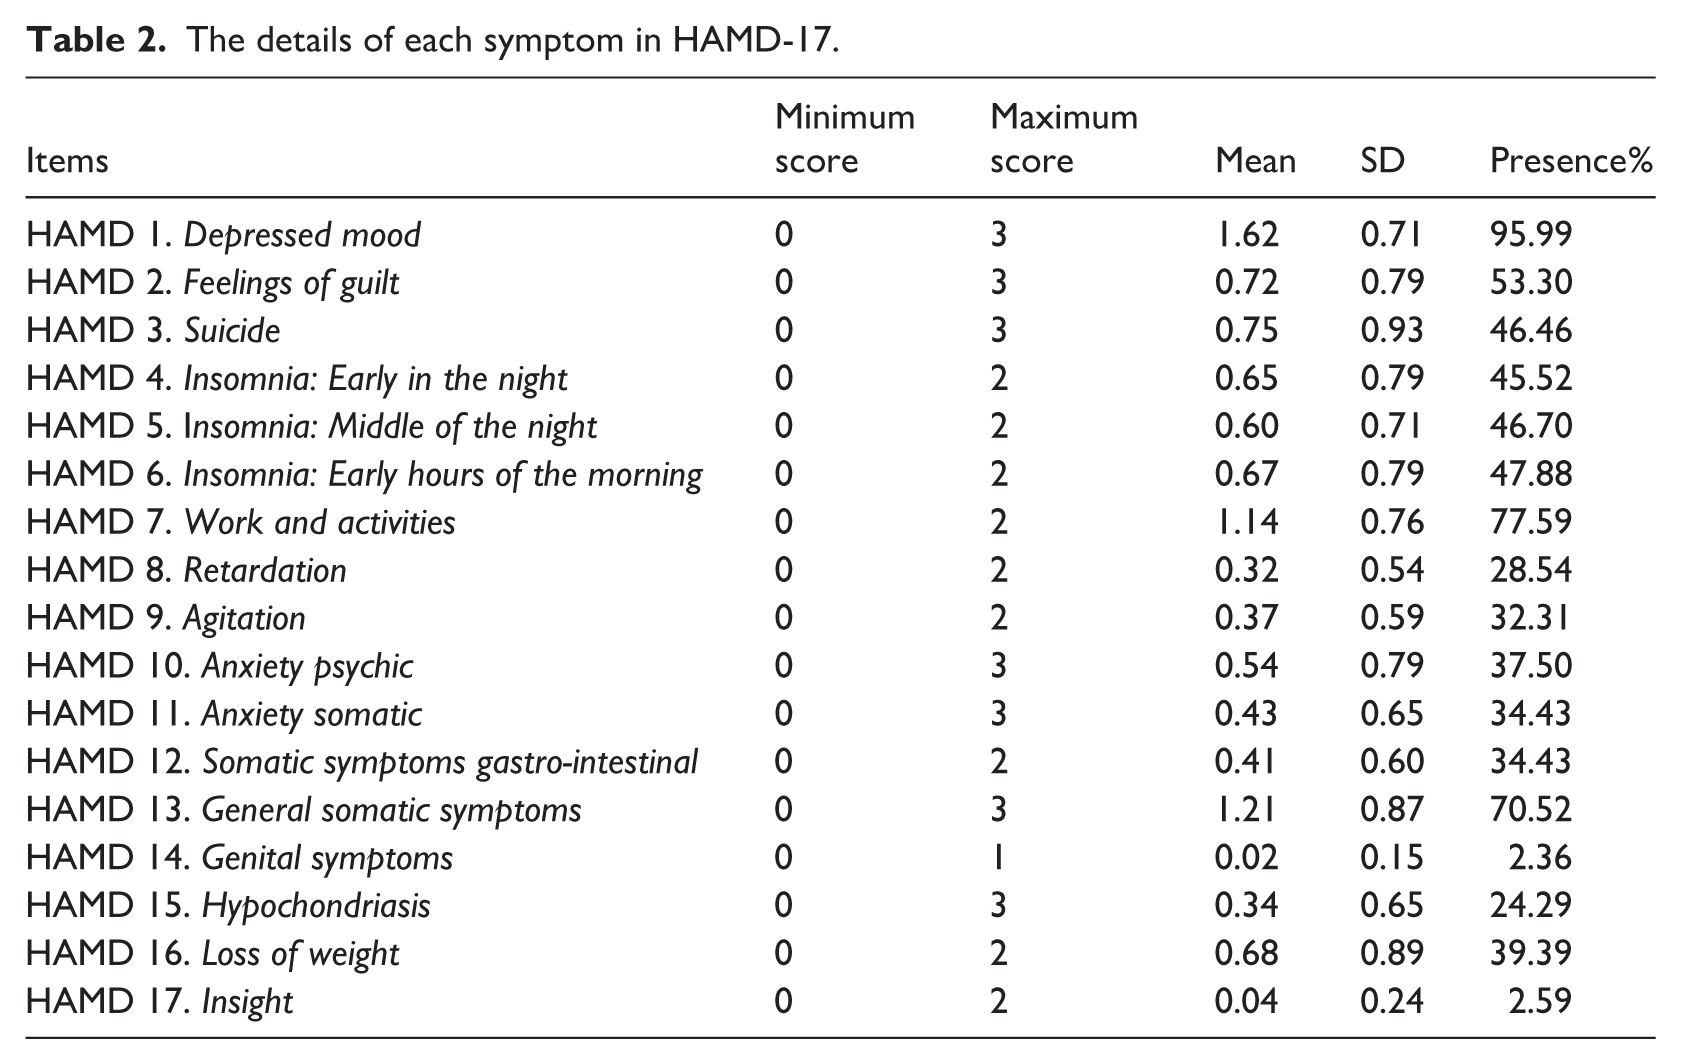
In the HAMD-17 assessment, depressed mood (95.99%) exhibited the highest frequency, followed by work and activities (77.59%) and general somatic symptoms (70.52%). The fourth rank was feelings of guilt (53.30%) with insomnia: early hours of the morning (47.88%) coming in fifth. Subsequent rankings include insomnia: middle of the night (46.70%), suicide (46.46%) and insomnia: early in the night (45.52%). The ninth to twelfth positions were occupied by loss of weight (39.39%), anxiety psychic (37.50%), anxiety somatic (34.43%) and somatic symptoms gastro-intestinal (34.43%), respectively. Agitation (32.31%) came next, followed by retardation (28.54%), hypochondriasis (24.29%), insight (2.59%) and finally, genital symptoms (2.36%) as the least frequent. The maximum values, minimum values, and occurrence rates for each symptom are shown in Table 2 as follows.
The details of each symptom in HAMD-17.
Network structure and centrality estimation
Network structure
The analysis of topological overlap revealed no instances of item overlap in our dataset, affirming the uniqueness of each variable in the network. A visualization of the network structure of depression can be seen in Figure 1.
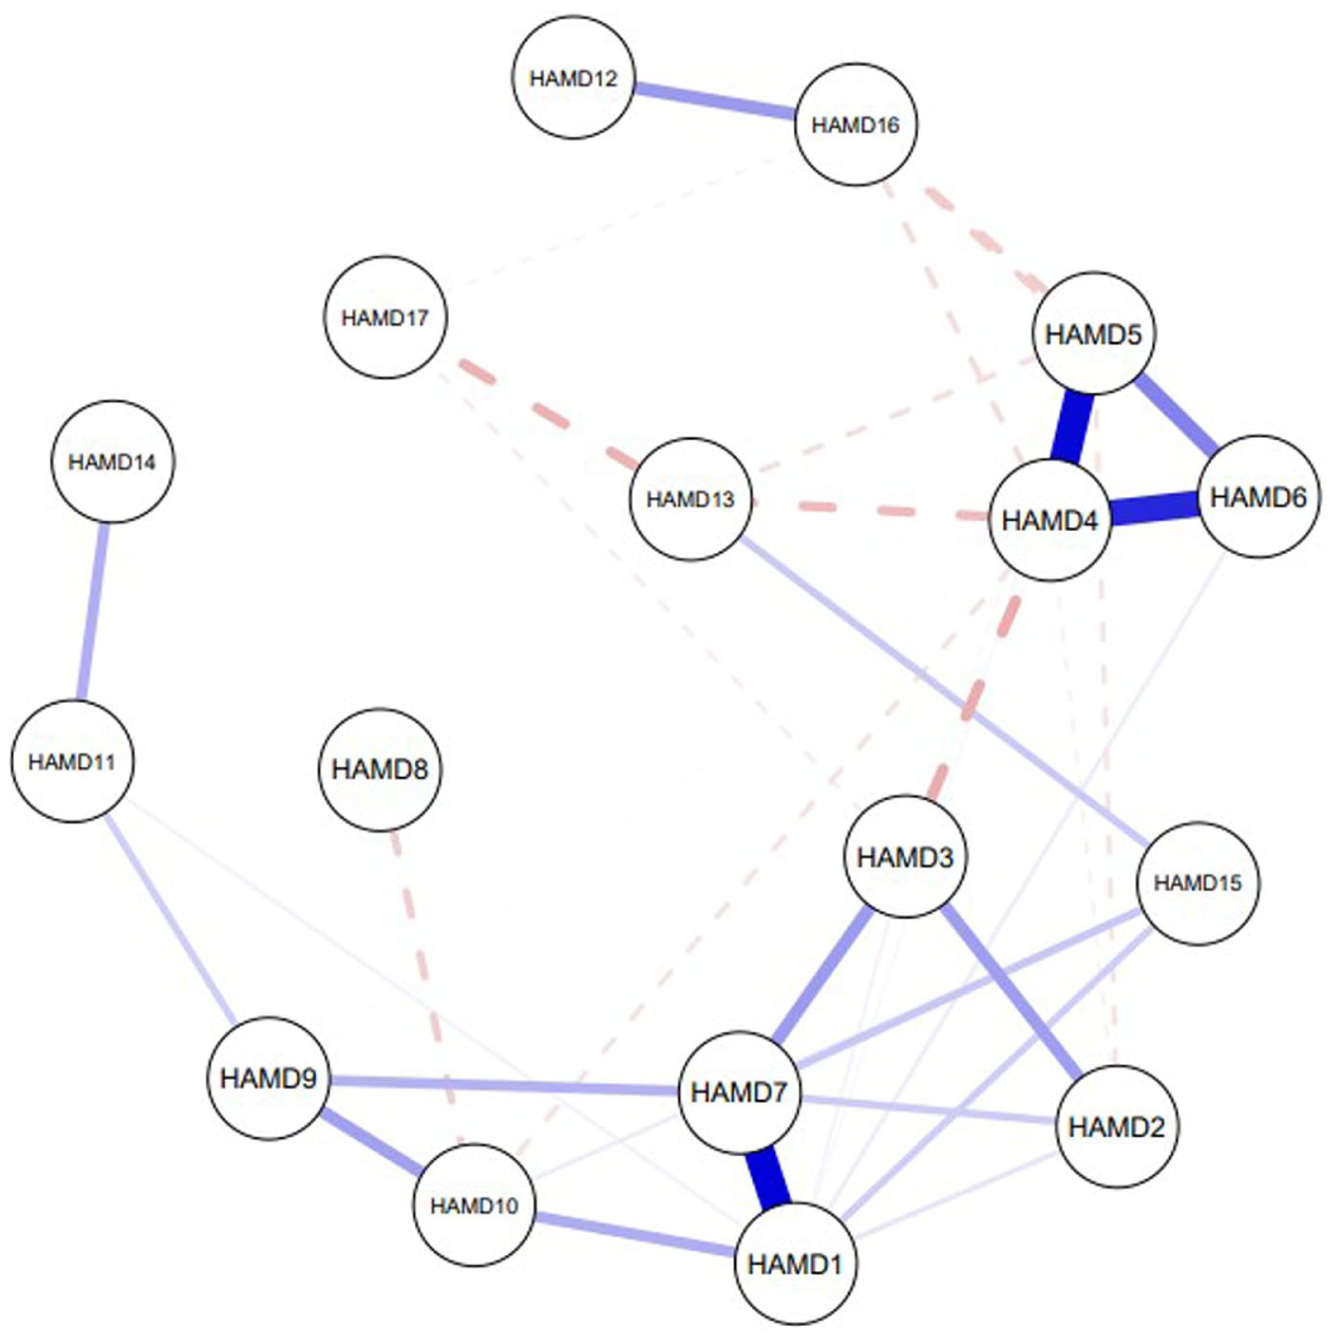
Symptom network of StD among older adults.
The network demonstrates partial correlations between nodes, with 17 nodes interconnected by 37 associations. The strongest associations are between depressed mood – work and activities (Edge weight = 0.298); insomnia: early in the night – insomnia: middle of the night (Edge weight = 0.288) and insomnia: early in the night – insomnia: early hours of the morning (Edge weight = 0.254). The statistical significance of pairwise differences in edge weights was evaluated using bootstrapped difference tests, with detailed visualizations provided in Supplemental Appendix S1.
Depressive symptoms centrality
Based on EI results, the most central symptoms are work and activities (EI = 0.626) and depressed mood (EI = 0.539). Work and activities showed statistical significance when compared with other 16 symptoms. Depressed mood showed statistical significance when compared with feelings of guilt, suicide, retardation, agitation, anxiety psychic, anxiety somatic, somatic symptoms gastro-intestinal, general somatic symptoms, genital symptoms, hypochondriasis, loss of weight and insight. The least central symptoms are insight (EI = −0.124), and general somatic symptoms (EI = −0.142). The standardized estimates for strength, closeness, and betweenness are presented in Table 3. The ranking of symptoms by the magnitude of their EI is shown in Figure 2. The statistical significance of pairwise differences in EI was evaluated using bootstrapped difference tests, with detailed visualizations provided in Supplemental Appendix S2.
Centrality indices of depressive symptoms in the symptom network (expected influence, strength, betweenness, and closeness).
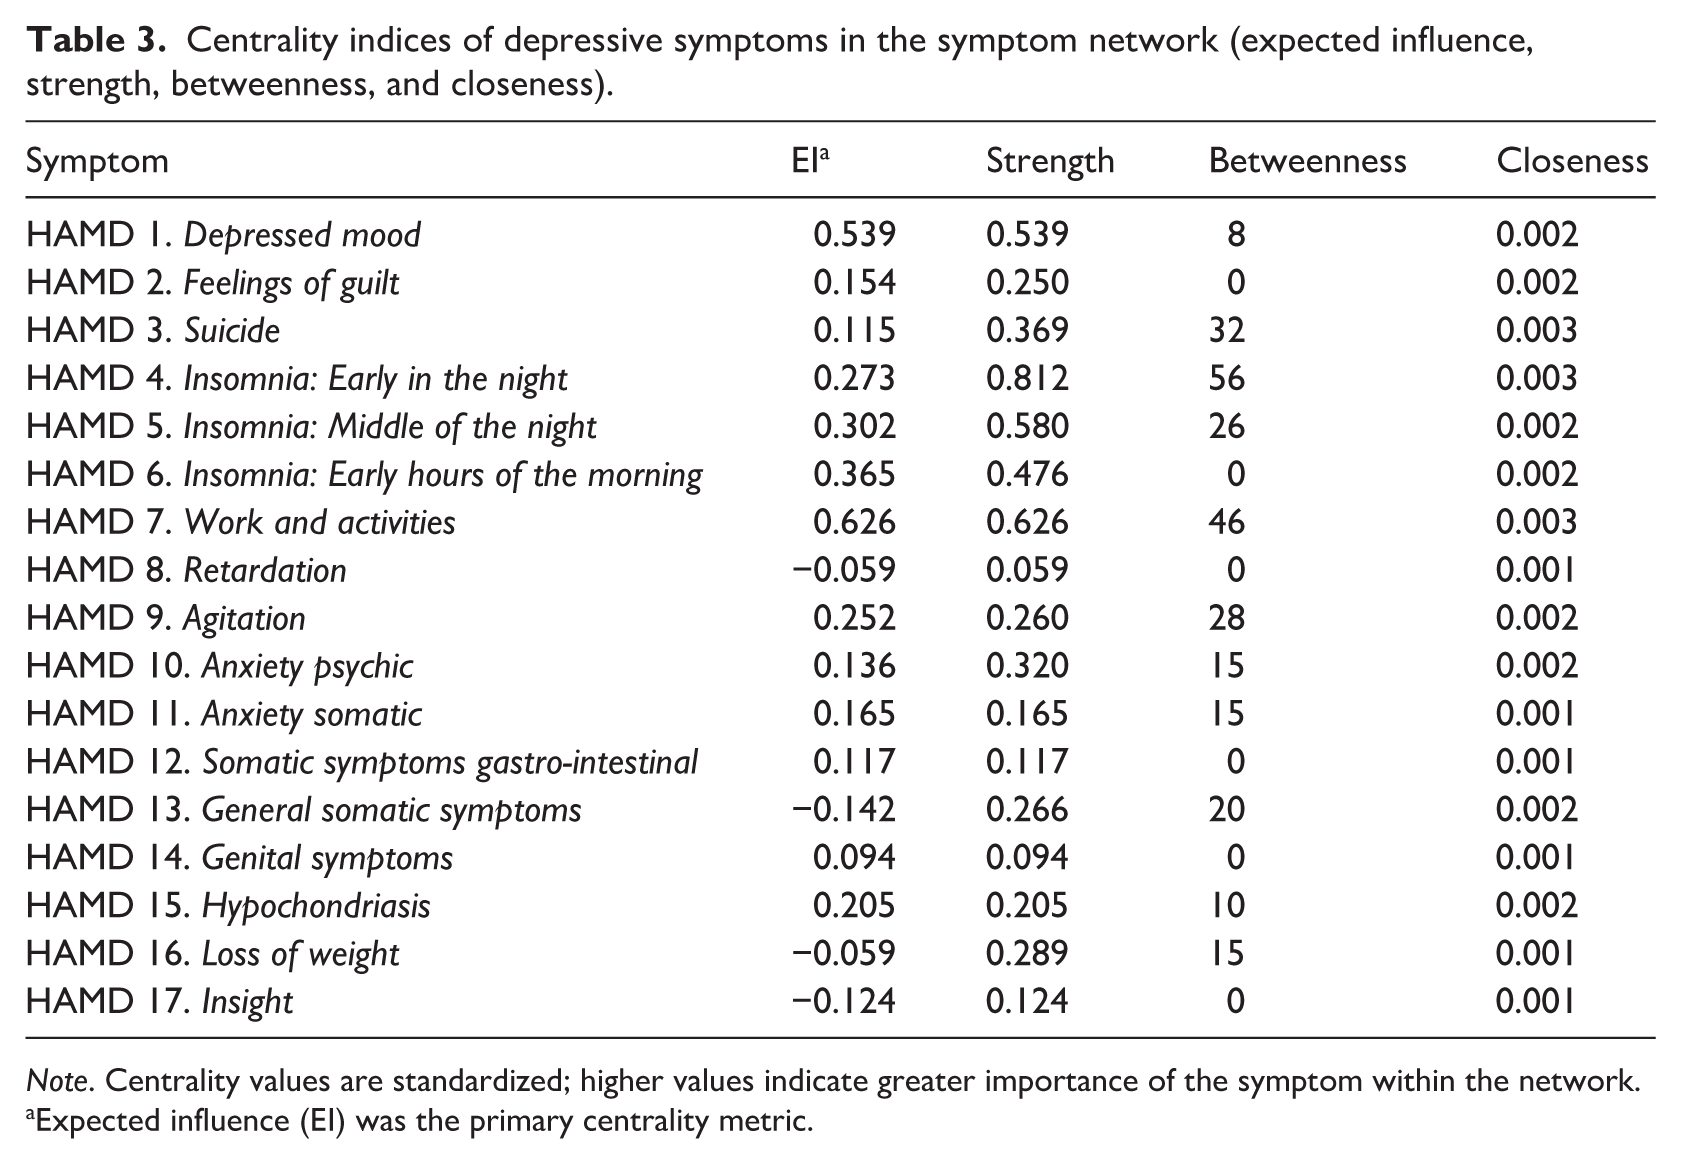
Note. Centrality values are standardized; higher values indicate greater importance of the symptom within the network.
Expected influence (EI) was the primary centrality metric.
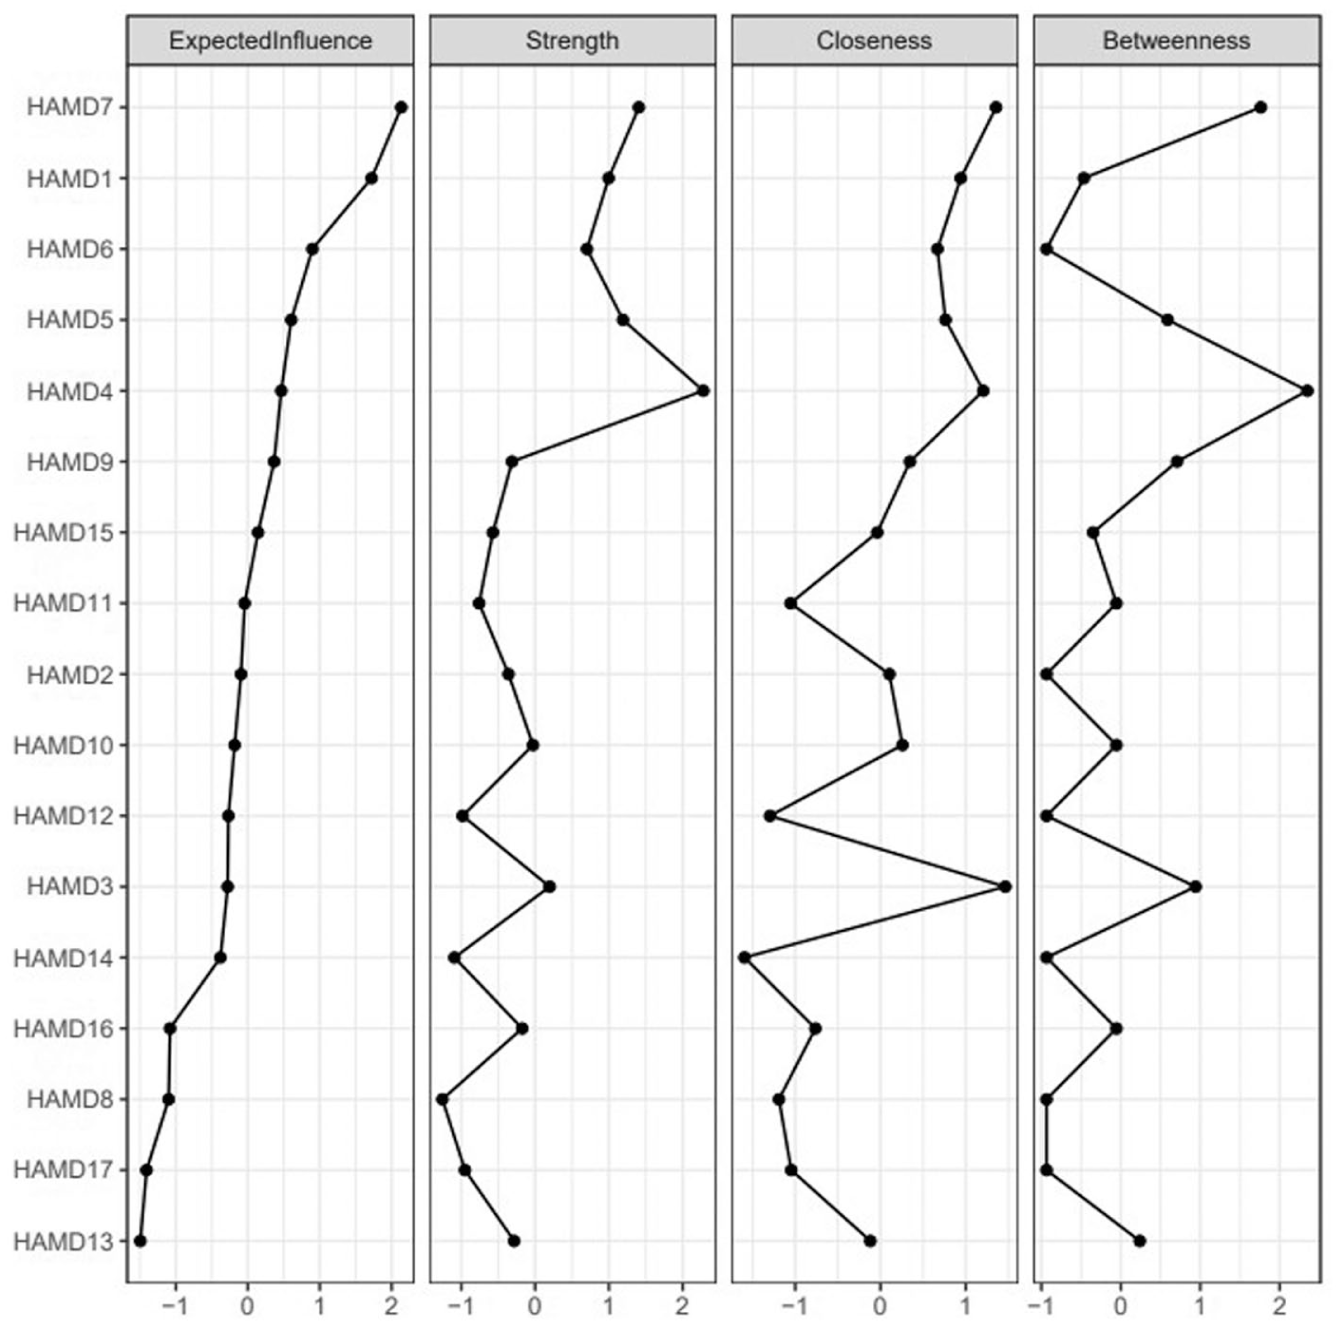
Centrality indices of depressive symptoms, shown as standardized values z scores.
Network stability
Network accuracy and stability were evaluated using nonparametric and case-dropping bootstrap procedures (Supplemental Appendix S3). Inspection of the edge-weight accuracy plots showed that the 95% confidence intervals around many edge weights were relatively wide and partially overlapping, indicating limited precision in the estimation of weaker associations. Nevertheless, stronger edges exhibited more consistent estimates, suggesting that the most prominent connections in the network were reasonably robust. Centrality stability was specifically assessed for expected influence, which was the primary centrality metric of interest in the present study. The correlation stability coefficient (CS) for expected influence was 0.361, exceeding the recommended minimum threshold of 0.25 and indicating moderate stability. As shown in Supplemental Appendix S3, expected influence remained relatively stable across different proportions of case removal, supporting the reliability of identifying central symptoms based on this metric. Taken together, these results suggest the identification of central symptoms based on expected influence is reasonably stable and interpretable.
Discussion
This study utilized network analysis to explore the central symptoms of StD in the elderly, revealing that work and activities and depressed mood are the central symptoms in the network. These symptoms not only have high interconnectivity with other symptoms but also exert a disproportionate influence on the symptom network, may potentially driving the psychopathological profile of StD in older adults.
Our analysis revealed that the incidence of StD among the screened population was 28.04%, similar to that reported in previous studies, which ranged from 8.8% to 31.3% in the community (Meeks et al., 2011). The prevalence of StD is higher than that of MDD which is 13.3%, suggesting that a significant number of individuals are experiencing depressive emotional distress that still affects their lives despite not meeting the full diagnostic criteria for major depressive disorder (Abdoli et al., 2022).
Our results indicate that work and activities and depressed mood are the two most central symptoms in the StD symptom network among older adults. This result supports the present concept of the two cardinal symptoms of depression in the Diagnostic and Statistical Manual of Mental Disorders, Fifth Edition (DSM-5) system (American Psychiatric Association, 2013; Meeks et al., 2011). Other studies have also found work and activities and depressed mood were central in the depressive symptom network structure of both old and younger adults with MDD (Cramer et al., 2016; Fried et al., 2016; van Borkulo et al., 2015). These two symptoms were more important relative to the others(Nair et al., 1999), and made high contributions to explaining impairment, ranking 1 (20.7%) and 4 (13.1%) in general relative importance estimates (Fried and Nesse, 2014). Our findings are similar to those of current studies looking at the central symptoms of MDD in older adults. Most studies of the central symptoms of MDD in older adults mention loss of interest and depressed mood (Belvederi Murri et al., 2020; Kim et al., 2021; Park, 2021). Unlike these findings, the central symptoms of StD usually do not include suicidal behavior. The main reason may because the symptoms of StD are usually mild, and people with StD have a lower risk of suicide than people with MDD (Cuijpers and Smit, 2004).
Work and activities assesses diminished time and interest in the domains of work and leisure activities/hobbies (Rohan et al., 2016). Loss of interest in usual activities may lead to less physical activity and greater social isolation, which may lead to a self-reinforcing cascade of events resulting in continually worsening depression and functioning (Covinsky et al., 2014; Jalil et al., 2023). The rates of this outcome are high in older persons, the adjusted risk of 30% conferred by loss of interest would translate into substantial increased risk of disability and death. This supports loss of interest plays an increasingly important role in the presentation of late-life depression (Covinsky et al., 2014). There are also mechanistic reasons why Loss of interest may confer a higher risk for disability or death. For example, the vascular depression hypothesis suggests that late-life depression may be induced by atherosclerotic vascular disease in the brain (Seeman et al., 1996). Further, vascular disease may be more strongly correlated with anhedonia than dysphoria (Seeman et al., 1996). In addition, anhedonia may be a preclinical marker of dementia (Keedwell et al., 2005; Lampe et al., 2001). Therefore, anhedonia may be a stronger predictor of disability and death because it is marker for comorbid conditions associated with these outcomes.
Depressed mood is defined by guidelines as any emotional state commensurate with sadness such as those named in the item label as well as down, low, blue, melancholic, dysphoric, teary, etc (Rohan et al., 2016). Evolutionary theory suggests that depressed emotions signal to an individual that he or she has experienced a loss or is facing a desperate situation. This sense of loss and futility may activate unconscious biased reflective processes that negatively and selectively reflect on problems. This process can lead to the occurrence and development of depression (Nolen-Hoeksema et al., 2008). Depression can also lead to low self-esteem, which can exacerbate excessive worry and trigger feelings of guilt or death. These interactions may lead to the development of self-sustaining symptom clusters (Belvederi Murri et al., 2020).
Our results indicate that “depressed mood” and “work and activities” are the two most central symptoms in the symptom network of StD among older adults. Our results showed that the interrelation between work and activities and depressed mood was the strongest. This can be illuminated through Beck’s cognitive theory of depression. This theory posits that the way individuals perceive themselves, their environment, and the future—often through a negative, distorted lens. Such cognitive distortions lead to a withdrawal from activities once enjoyed, encapsulating the symptom of loss of interest. Concurrently, these negative thought patterns exacerbate feelings of sadness, hopelessness, and a pervasive depressed mood. Beck’s model suggests that these two symptoms are interconnected; a negative view of the self (characteristic of a depressed mood) can lead to a disinterest in activities as individuals may perceive them as less rewarding or more challenging than they are. Conversely, the inability to derive pleasure from activities (loss of interest) reinforces negative self-perceptions and beliefs about the world’s lack of offerings, further deepening the depressed mood (Ahern et al., 2019; Beck, 1979).
Somatic symptoms have a lower centrality in the symptom network of StD. One possible explanation is that somatic symptoms are commonly present in later life, regardless of whether they are caused by depression, medical illness, or the interaction between depression and medical illness (Haigh et al., 2018) . Another possibility is that the symptoms of medical illnesses act as “bridge symptoms” triggering depressive episodes (Cramer et al., 2010, 2012; Gleason et al., 2013), rather than being central to the depression symptom network. Other potential factors that might explain the differences in the structure of symptom networks between late-life and earlier-life depression include a higher prevalence of cognitive impairments, endocrine, and immune system changes in the elderly (Alexopoulos and Morimoto, 2011; Belvederi Murri et al., 2020; van Agtmaal et al., 2017).
There is some limitations in our study. One primary limitation of our study is its cross-sectional design, which restricts our ability to determine causality among the symptoms of subthreshold depression (StD) in older adults. While this design provides a snapshot of symptom interconnections at a single point in time, it does not capture the evolution or variability of these relationships over time. Secondly, our samples were all derived from the community, excluding individuals in hospital settings. The living environment may impact the symptoms network. It will be necessary to develop symptom networks for older individuals with multidimensional frailty from different environments in the future. Additionally, data collection for this study occurred during the COVID-19 pandemic, a period characterized by widespread social restrictions and disruptions to daily routines. Public health measures such as reduced mobility, home confinement, and limited social interaction may have led to decreased engagement in daily activities, increased loneliness, and reduced access to social support, thereby influencing individuals’ emotional states. Although the present study did not directly assess pandemic-related stressors, this broader context may have influenced the manifestation and severity of depressive symptoms and should be considered when interpreting the findings.
Conclusion
This study sheds light on the network structure of StD in older adults, emphasizing the importance of Work and activities and depressed mood as central nodes within the symptom network. Given the potential of StD to progress to MDD, early identification and intervention for these central symptoms could have significant implications for preventing the escalation of depressive disorders in the elderly. Future research should aim to validate these findings in larger, more diverse populations and explore the dynamic nature of these networks over time to inform the development of preventive and therapeutic interventions.
Supplemental Material
sj-docx-1-hpq-10.1177_13591053261462440 – Supplemental material for Exploring central symptoms of subthreshold depression in older adults: A network analysis
Supplemental material, sj-docx-1-hpq-10.1177_13591053261462440 for Exploring central symptoms of subthreshold depression in older adults: A network analysis by Rendong He, Junxin Li, Tangsheng Zhong, Yiming Qiu, Yongliang Jiao, Kexin Huang, Bingyue Han, Yuhang Pu, Jia Yong and Li Chen in Journal of Health Psychology
Footnotes

Ethical considerations
The study was approved by the Institutional Review Board (approval number: 2021030502) and the Chinese Clinical Trial Registry (ChiCTR), registration number ChiCTR2100049258.
Consent to participate
Written informed consent was obtained from all participants.
Consent for publication
Consent for publication is not applicable to this article as it does not contain any identifiable data.
Author contributions
Rendong He contributed to the conceptualization, data collection, data analysis, and writing of the original draft. Junxin Li provided critical revisions and edits to the manuscript. Tangsheng Zhong, Yongliang Jiao, Kexin Huang, Bingyue Han, and Yuhang Pu were involved in data collection. Yiming Qiu collect the data and also contributing to data analysis. Jia Yong reviewed and edited the original draft, while Li Chen oversaw project administration.
Funding
The authors disclosed receipt of the following financial support for the research, authorship, and/or publication of this article: This research supported by the Educational Commission of Jilin Province of China (JJKH20231061KJ) and Jilin Association for Higher Education (JGJX2022B6).
Declaration of conflicting interests
The authors declared no potential conflicts of interest with respect to the research, authorship, and/or publication of this article.
Data availability statement
The datasets used and/or analyzed during the current study are available from the corresponding author on reasonable request.*
Supplemental material
Supplemental material for this article is available online.
References
Supplementary Material
Please find the following supplemental material available below.
For Open Access articles published under a Creative Commons License, all supplemental material carries the same license as the article it is associated with.
For non-Open Access articles published, all supplemental material carries a non-exclusive license, and permission requests for re-use of supplemental material or any part of supplemental material shall be sent directly to the copyright owner as specified in the copyright notice associated with the article.
