






Abstract
This study examined the association between vegetable intake and mental health indicators, specifically perceived stress and depression symptoms, and it assessed whether a brief animated educational video targeted at young adults could increase readiness to improve vegetable consumption. Participants were 270 undergraduate students with average daily vegetable intake of 1.12 cups (SD = 0.88). Participants completed an online survey with pre- and post-video assessments measuring daily vegetable intake, perceived stress, depression symptoms, and stage of change for vegetable intake. Descriptive and correlation analyses and nonparametric tests were conducted. Findings indicated higher vegetable intake was associated with lower perceived stress and depressive symptoms. The video intervention was effective in improving stage of change, but only among participants who were initially in the precontemplation stage. Results highlight a relationship between vegetable intake and mental health in college students and suggest that brief, scalable interventions may be effective for individuals not yet considering behavior change.
Introduction
Young adults often face significant perceived stress and mental health challenges (e.g. depression) as they transition into adulthood. Perceived stress is the extent to which individuals assess situations in their lives as stressful, considering both the unpredictability and intensity of these situations alongside their capacity to manage them (Cohen et al., 1983). Perceived stressors for college students include academic (Barbayannis et al., 2022), and relationship stressors (Karyotaki et al., 2020). Depression is characterized by persistent feelings of sadness, a diminished interest in activities, and various emotional and physical symptoms that can hinder daily functioning (American Psychiatric Association, 2013). Notably, in 2020, nearly one in five young adults aged 18–25 met the criteria for a major depressive episode within the preceding year (Goodwin et al., 2022). In addition to the mental health challenges they face, young adults also struggle with maintaining healthy eating habits, including regular fruit and vegetable consumption, with most falling short of the recommended daily vegetable intake (Mello Rodrigues et al., 2019).
Vegetable intake in young adults
The World Health Organization (WHO, 2003) recommends individuals ages 10 and older consume 400 g (approximately five servings) of fruits and vegetables per day. The 2020–2025 Dietary Guidelines for Americans recommendations for adults include consumption of approximately 2–3 cup-equivalents of vegetables daily (generally equivalent to 4–6 servings). However, only 7.1% of young adults (aged 18–30 years) in the United States met this vegetable consumption guideline (Lee et al., 2022). A study of 762 U.S. college students reported average daily intake of vegetables was 1.41 ± 0.38 cup equivalents (Drzal et al., 2025). Amid rising rates of depression and perceived stress among college students alongside declining vegetable intake (VI), there is a growing need to investigate the association between dietary behaviors—particularly VI—and mental health indicators in this population.
Stress, depression, and antioxidants found in vegetables
While it is widely recognized that eating vegetables is beneficial for physical health, the impact of vegetable consumption also extends to mental well-being (Głąbska et al., 2020). Specifically, the antioxidant properties of vegetables can influence brain function by modulating both physiological and psychological processes, including inflammation. For example, carotenoids, a class of antioxidants found in fruits and vegetables, may provide a protective effect against oxidative stress and depressive symptoms. A systematic review and meta-analysis by Yu et al. (2022) found a significant association between dietary carotenoid intake and reduced depressive symptoms. A study of the relationship between serum carotenoids and perceived stress found that higher fruit and vegetable intake was associated with lower perceived stress in middle-aged adults (Radavelli-Bagatini et al., 2021).
Interventions to improve vegetable intake
Numerous studies have explored the reasons for low VI in young adults and evaluated existing interventions aimed at improving vegetable consumption. One systematic review revealed a lack of targeted interventions for young adults and a notable absence of population-wide educational programs focused specifically on vegetable intake (Appleton et al., 2016). Barriers to vegetable consumption in young adults may include insufficient knowledge, lack of motivation, and limited access to fresh produce (Alkazemi and Salmean, 2021; Drzal et al., 2025). Understanding these factors is crucial for designing effective interventions to promote VI among young adults (Guillaumie et al., 2010).
One promising intervention approach with college students is the use of educational videos to inform and encourage positive health behaviors. A meta-analysis of 38 studies found that video-based interventions can significantly enhance individuals’ attitudes, intentions, and behaviors regarding health practices such as healthy eating, vaccination, and cancer screening (Xiao et al., 2024). However, to date, there have been no known educational video interventions specifically targeting VI in young adults. While some studies have explored video-based interventions for vegetable consumption in young adults (Nour et al., 2018; O’Neal et al., 2022), they primarily focus on recipes and cooking techniques without addressing the psychosocial implications of vegetable consumption.
Stages of change and vegetable intake
To effectively promote VI, the transtheoretical model of behavior change (Prochaska and DiClemente, 1992) may provide valuable insights into individuals’ readiness to adopt new eating behaviors. The five stages of the model have been successfully applied to various health behaviors, including smoking cessation, substance abuse, exercise, and dietary modifications (Rosen, 2000). Chee Yen et al. (2014) applied this model to assess individuals’ intentions and actions regarding fruit and vegetable consumption, demonstrating its applicability in understanding dietary behaviors. The transtheoretical model has been used as the basis for interventions in other health behaviors, such as smoking cessation in adolescents (Erol and Erdogan, 2008) and promoting physical activity in sedentary young adults (Woods et al., 2002). Thus, the transtheoretical model was selected as a tool to assess college students’ intent to improve VI in the current study.
Study purpose and hypotheses
The purpose of this study was to measure college students’ readiness to increase VI and compare their stage of change (SoC) before and after viewing a brief educational video. This study fills a gap in the literature by providing educational content to motivate young adults to engage in a positive eating behavior that could have psychosocial implications. Two hypotheses guided this study:
We expect that there will be a negative relationship between VI and depression and stress levels, such that the greater amount of consumed vegetables is associated with lower self-reported perceived stress and depression symptoms.
We expect that participants in pre-contemplation and contemplation stages will increase their stage of readiness to change after watching the educational video.
Methods
Participants and procedure
A total of 330 undergraduate students at a regional university participated in this study and received course credit for participating, and 270 students were included in analyses. The inclusion criteria for the study were age 18 or older and currently enrolled in an Introduction to Psychology course. There were no exclusion criteria. As this study used a student-based human subjects research pool, the final sample was partially determined by pool availability, which is standard practice in undergraduate research settings. This study was approved by the Texas State University Institutional Review Board (#9348), and participants provided informed consent.
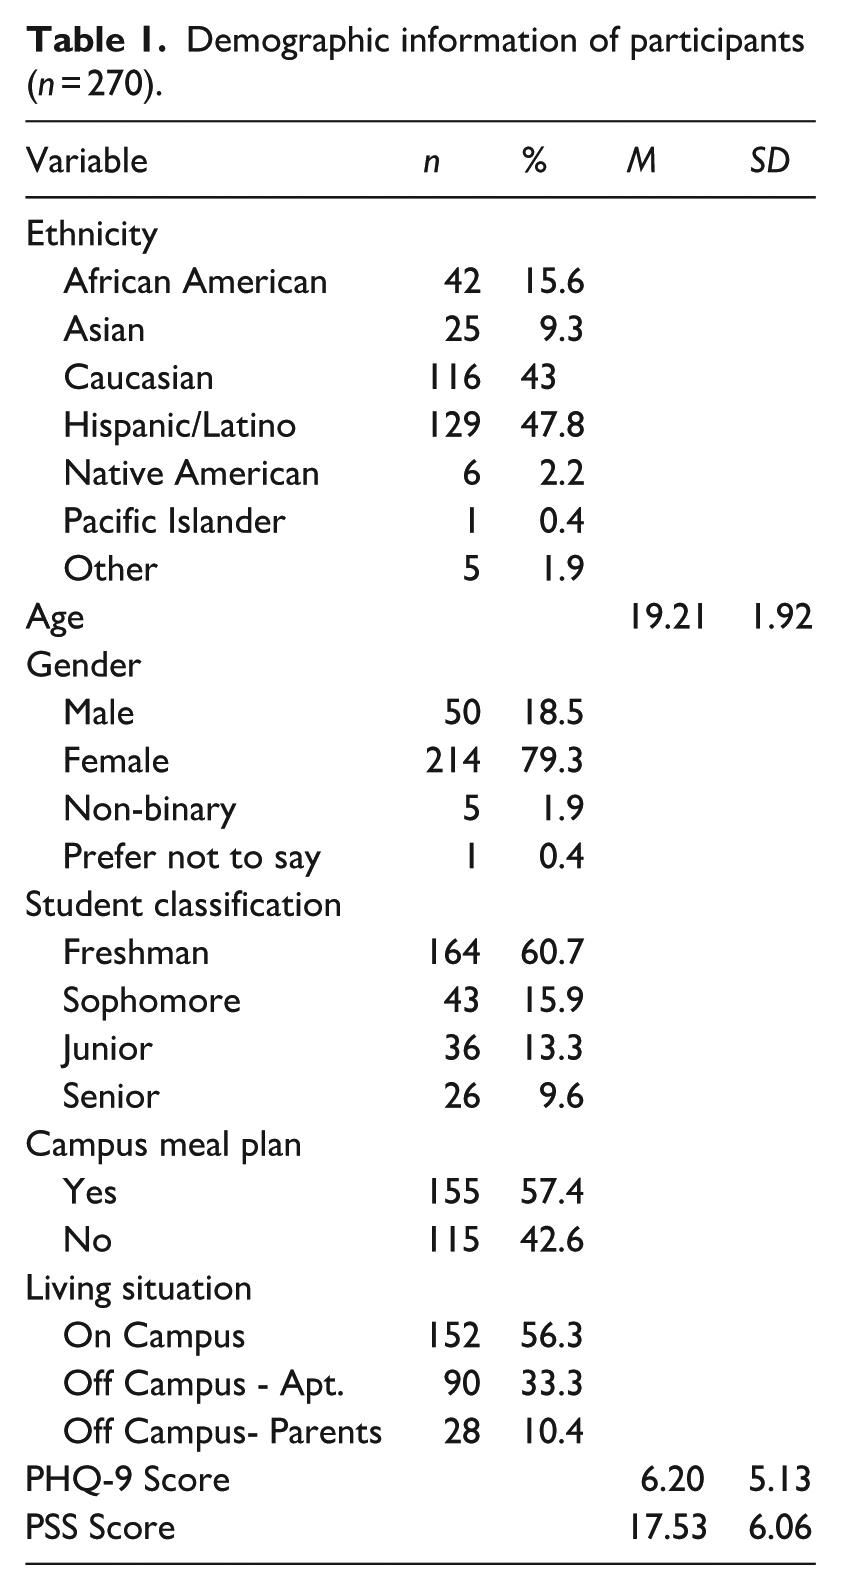
The mean age of participants was 19 years of age (SD = 1.92), and most participants were female (79.3%; see Table 1). The racial/ethnic breakdown of participants was 47.8% Hispanic/Latino, 43% Caucasian, 15.6% African American, 9.3% Asian, 2.2% Native American/Pacific Islander, and 1.9% other race or ethnicity. Most participants (57.4%) reported having a meal plan on campus, and 56.3% of participants lived on campus.
Demographic information of participants (n = 270).
Materials
Educational video
A 5 minute 20 second animated educational video was written, created, and produced by the primary author of this study (see Supplemental Materials). The video was created using Adobe After Effects and Adobe Photoshop, with professional-quality audio narration recorded using a Blue Yeti microphone. Throughout the development process, the video underwent multiple rounds of iterative revision based on structured feedback from a group of undergraduate students in an honors creative capstone course and a multidisciplinary panel of faculty experts, including a health psychology professor, a capstone course professor, a nutrition professor, and a journalism and mass communication professor. Feedback addressed both the scientific accuracy of the nutritional content and the clarity, flow, and communicative effectiveness of the video as a media product. This iterative, multi-expert review process resulted in multiple revised versions of the video before a final version was produced. Following this development phase, the video was evaluated in an IRB-approved pilot study conducted in a health psychology course prior to the main study. The pilot allowed us to assess the video’s feasibility and acceptability in a student population comparable to our target sample, and it also informed any final refinements before the video was used in the present study.
Using the theoretical basis of the Health Belief Model (Rosenstock, 1974; Rosenstock et al., 1988) and current research on vegetable intake, carotenoids, and its relation to depression and stress levels, the script was written to specifically target college-age young adults. It discussed perceived susceptibility by citing data that 60% of college students met the criteria for a mental health diagnosis in 2020 (Lipson et al., 2022). To illustrate perceived severity and benefits, the video explained how a lack of antioxidants can negatively impact one’s quality of life and mental health, while scientific evidence supports that increasing VI is linked to improved stress and depression levels (Rasmus and Kozłowska, 2023). Addressing perceived barriers, the video highlighted common challenges to vegetable consumption and practical strategies to overcome these obstacles. To increase perceived self-efficacy and provide a cue to action, the video emphasized the importance of mindset in behavior change: “Start with your mindset. Choose to think, ‘How can I add more vegetables to my diet?’ then look for opportunities to do that.” The concluding question, “Which vegetable will you add to your meals today?” serves as a final cue to action.
Survey
An online Qualtrics survey assessed participants’ perceived stress and depression symptoms, vegetable intake, attitudes and beliefs about vegetables, and readiness to increase vegetable intake (all were pre-video measures). The survey then included the embedded 5-minute animated educational video, followed by post-video questions measuring participants’ readiness to increase VI, recall of information presented in the video, and demographics.
Pre-video measures
Depression symptoms
Depression symptoms were assessed using the Patient Health Questionnaire (PHQ-9; Kroenke et al., 2001), a 9-item validated screening instrument that measures the severity of depressive symptoms across the past 2 weeks. The PHQ-9 includes phrases such as, “Feeling tired or having little energy.” with response options ranging from “Not at all” to “Nearly every day” on a 4-point scale. The sample provided good internal consistency (Cronbach’s α = 0.87). The depression variable was recoded into a dichotomous variable. Participants with a PHQ-9 score of 0–4 were coded as 0 = minimal to zero depression, and those with a score of 5–27 were coded as 1 = mild to severe depression, in line with standard diagnostic cutoffs.
Perceived stress
Stress was assessed using the Perceived Stress Scale (PSS; Cohen et al., 1983), a 10-item validated instrument that measures the frequency of participants’ general feelings about life stressors in the past month. The PSS included questions such as, “How often have you felt nervous and ‘stressed’?” with response options ranging from “Never” to “Very often” on a 5-point scale. The sample provided good internal consistency (Cronbach’s α = 0.80). Following commonly used conventions (Adamson et al., 2020), stress scores were recoded into a trichotomous variable. Participants with a PSS score of 0–13 were categorized as low stress, participants with a score of 14–26 were categorized as moderate stress, and participants with a score of 27–40 were categorized as high stress.
Food attitudes and behaviors
Five selected questions from the Food Attitudes and Behaviors (FAB) Survey (National Cancer Institute, 2007) were adapted for this study to understand participants’ general beliefs as well as current and previous VI behaviors. These included questions such as, “About how many cups of vegetables (including 100% vegetable juice) do you eat or drink per day?” [scale of 0–6 cups] and “I eat enough vegetables to keep me healthy” [strongly disagree to strongly agree].
Stages of change (SoC)
Participants’ readiness to increase VI was measured using a modified SoC algorithm developed by Chee Yen et al. (2014), which was administered both pre- and post-video. Participants first indicated how they perceived their overall level of VI. Based on their responses, participants were categorized into action, maintenance, preparation, contemplation, and pre-contemplation stages (see Figure 1). These stages were based on the self-rating of VI and the participant’s readiness or intention to change his/her eating habits. The algorithm was adapted to include a fifth answer choice (“I haven’t been increasing my vegetable intake”) for question 2 so that those participants who thought their VI was high would not be miscategorized into action or maintenance.
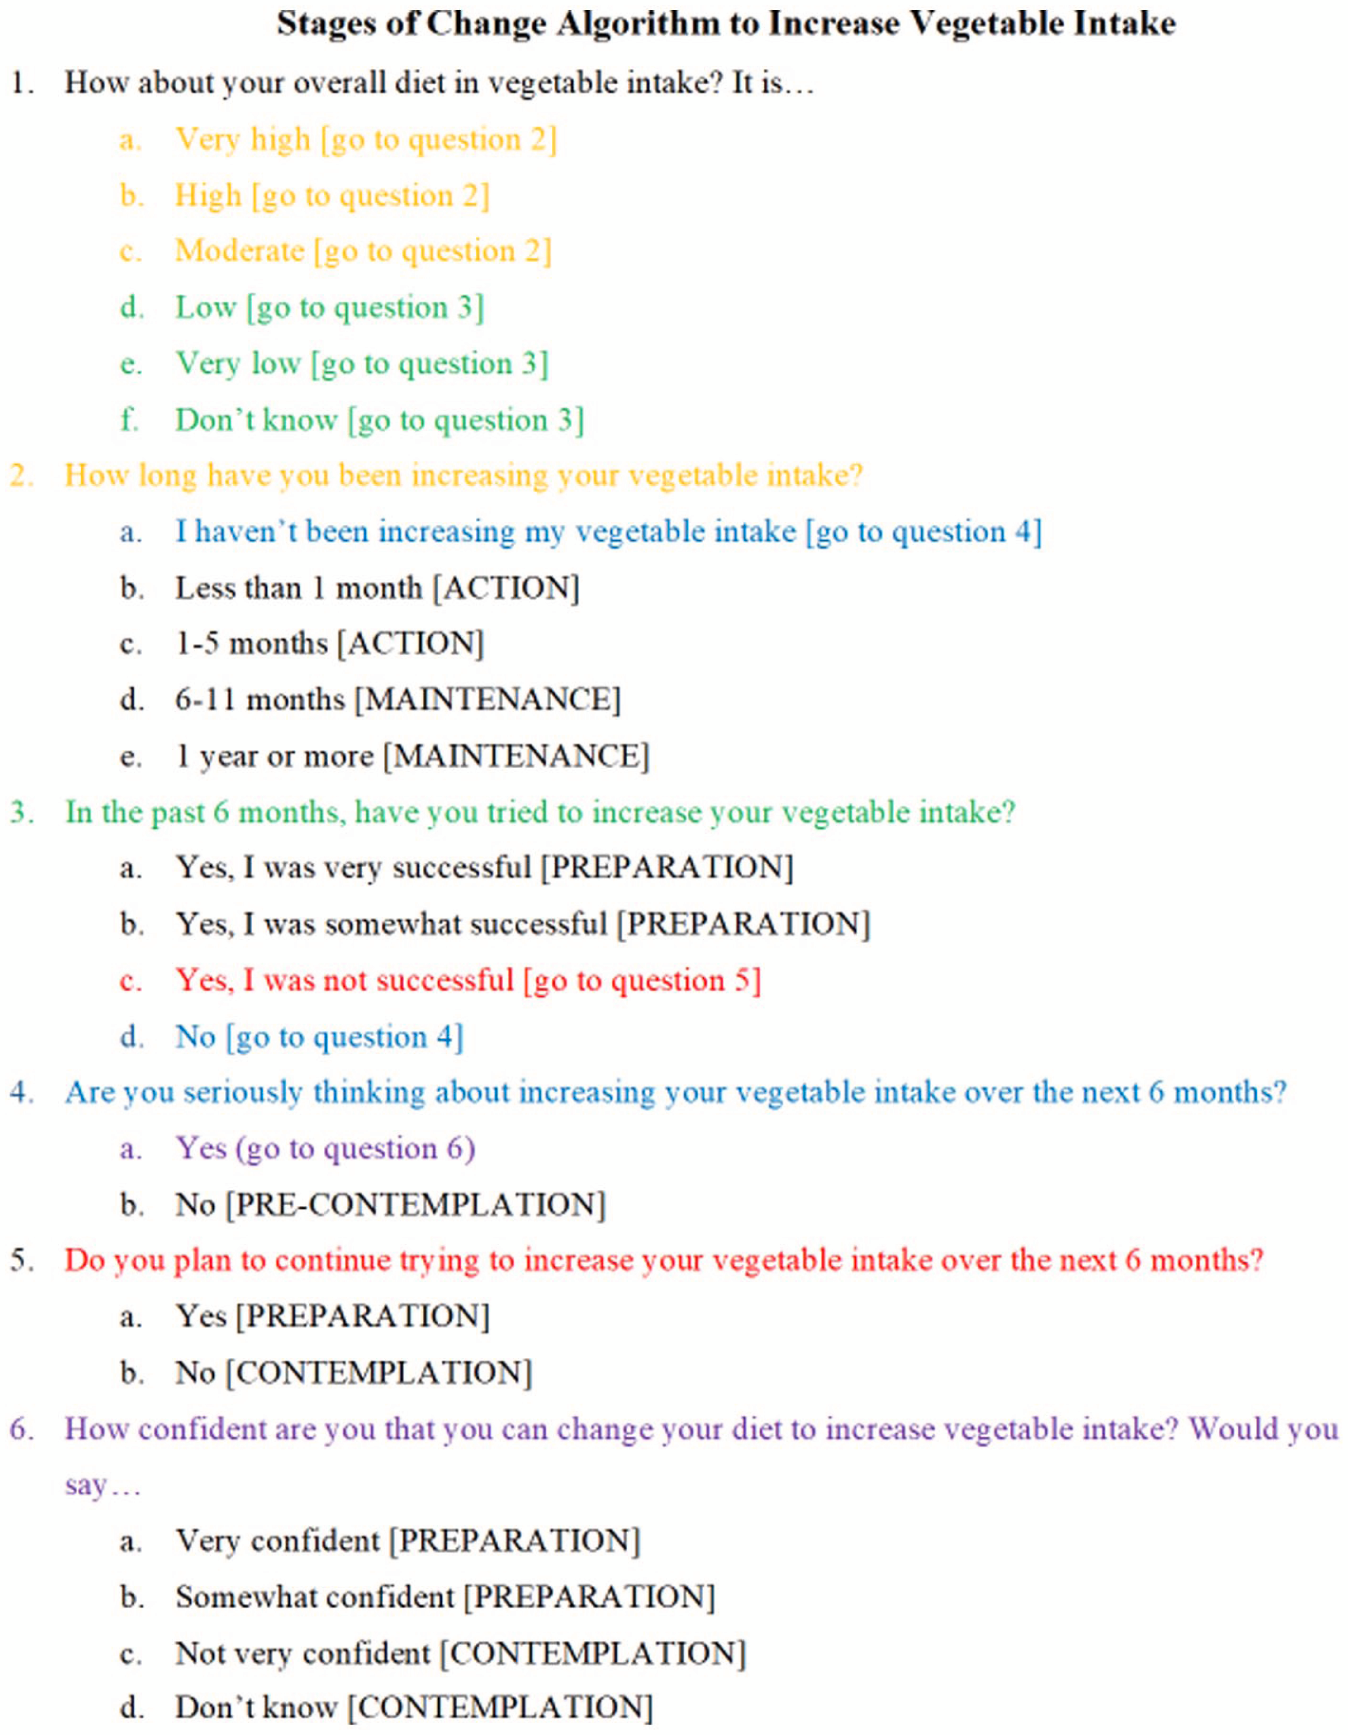
Stages of change algorithm to increase vegetable intake.
Post-video measures
In the post-video assessment, participants were asked to select some reasons why they did not choose to eat as many vegetables. Some of the possibilities included, “I eat enough vegetables,” “Vegetables cost too much,” and “I don’t know how to prepare vegetables.” Participants could select more than one answer.
Recall of video content
In the post-video survey, participants were presented with the multiple-choice question: “What are carotenoids?” to assess their recall and understanding of the video content.
Stages of change (SoC)
Similar to the SoC assessment used in the pre-video assessment, this assessment rephrased the first question to: “After watching the video, would you say your overall diet is. . .” with the same answer options as before. The algorithm remained the same as the pre-video assessment.
Demographics
Participants disclosed their year in college, major, age, gender, ethnicity, on or off campus status, and campus meal plan status.
Statistical analysis
Descriptive analyses summarized depression and stress levels, VI, attitudes and beliefs related to eating, and SoC before and after viewing the video. Pearson correlations were used to assess the relationship between daily vegetable intake and stress scores. Nonparametric tests (i.e. Mann Whitney U test, chi-square tests of independence, Fisher exact tests) were used for categorical comparisons of VI and stress and depression levels and to assess increase in SoC after watching the video. A two-tailed alpha level of p < 0.05 was used for all analyses. A post-hoc power analysis was conducted based on the McNemar Test for the Contemplation Stage of Change using an alpha = 0.05, N = 19 discordant pairs, and effect size (difference in discordant proportions) = 0.474, which showed achieved power (1−b) = 0.79, indicating adequate power for detecting a significant shift in stage status. Analyses were conducted using SPSS Version 27.
Results
Descriptive statistics: Stress and depression symptoms
A total of 330 participants completed the survey. Prior to conducting analyses, participant responses were screened for inconsistencies in the SoC algorithm. Nine participants were excluded for changing their answers to question 2, from “I have not been increasing my vegetable intake” pre-video to “I have been increasing my vegetable intake” post-video. Additionally, three participants were excluded for indicating implausible changes in their eating habits when answering question 2 about how long they have been increasing their vegetable intake, such as shifting two or more levels (e.g. from “have been increasing for 1-5 months” pre-video to “1+ years” post-video).
Finally, to assess the impact of the intervention on those who demonstrated attentiveness to the educational material, participants were asked to recall the video content by answering, “What are carotenoids?” A total of 86% of participants (n = 270) correctly identified carotenoids as “A type of antioxidant found in vegetables.” Of the remaining participants, 8.3% selected “A type of bacteria, 2.5% chose "A type of carrot," and 3.2% indicated “I don’t know.” Only participants who correctly answered the video recall question were included in analyses.
The average level of depressive symptoms was 6.20 (SD = 5.13; see Table 1). Approximately 43.7% of participants were experiencing zero to minimal symptoms, 32.6% of participants met screening criteria for mild depression, 15.9% met screening criteria for moderate depression, 6.3% met screening criteria for moderately severe major depression, and 1.5% met screening criteria for severe major depression. The average perceived stress score was 17.53 (SD = 6.06), indicating that most participants (69.3%) were experiencing moderate perceived stress. About 23.7% of participants were experiencing low perceived stress and 7% were experiencing high perceived stress.
Descriptive statistics: Vegetable intake, attitudes, and beliefs
As shown in Table 2, overall VI in this sample was low; the average daily VI across all participants was 1.12 cups (SD = 0.88). A total of 78.1% of participants ate less than the recommended minimum of two cups of vegetables per day; included in that is 11.1% of participants who ate no vegetables at all. When participants were growing up, most ate vegetables several times or once a day (73%). However, comparing that to the last 6 months, only 44.8% ate vegetables several times or once per day. Overall, participants ate less vegetables in the past 6 months than they used to while growing up. In response to the FAB question, “I eat enough vegetables to keep me healthy,” (M = 2.78, SD = 1.11) about 44% of participants responded, “strongly disagree” or “disagree” to the statement, whereas 30% of participants responded “agree” or “strongly agree.” In response to the FAB question, “What I eat doesn’t really affect my health,” (M = 1.72, SD = 0.88) the majority of participants (85.6%) responded, “strongly disagree” or “disagree,” indicating that most participants were aware that eating choices play a role in their health.
Participant vegetable intake frequency, attitudes, and beliefs.
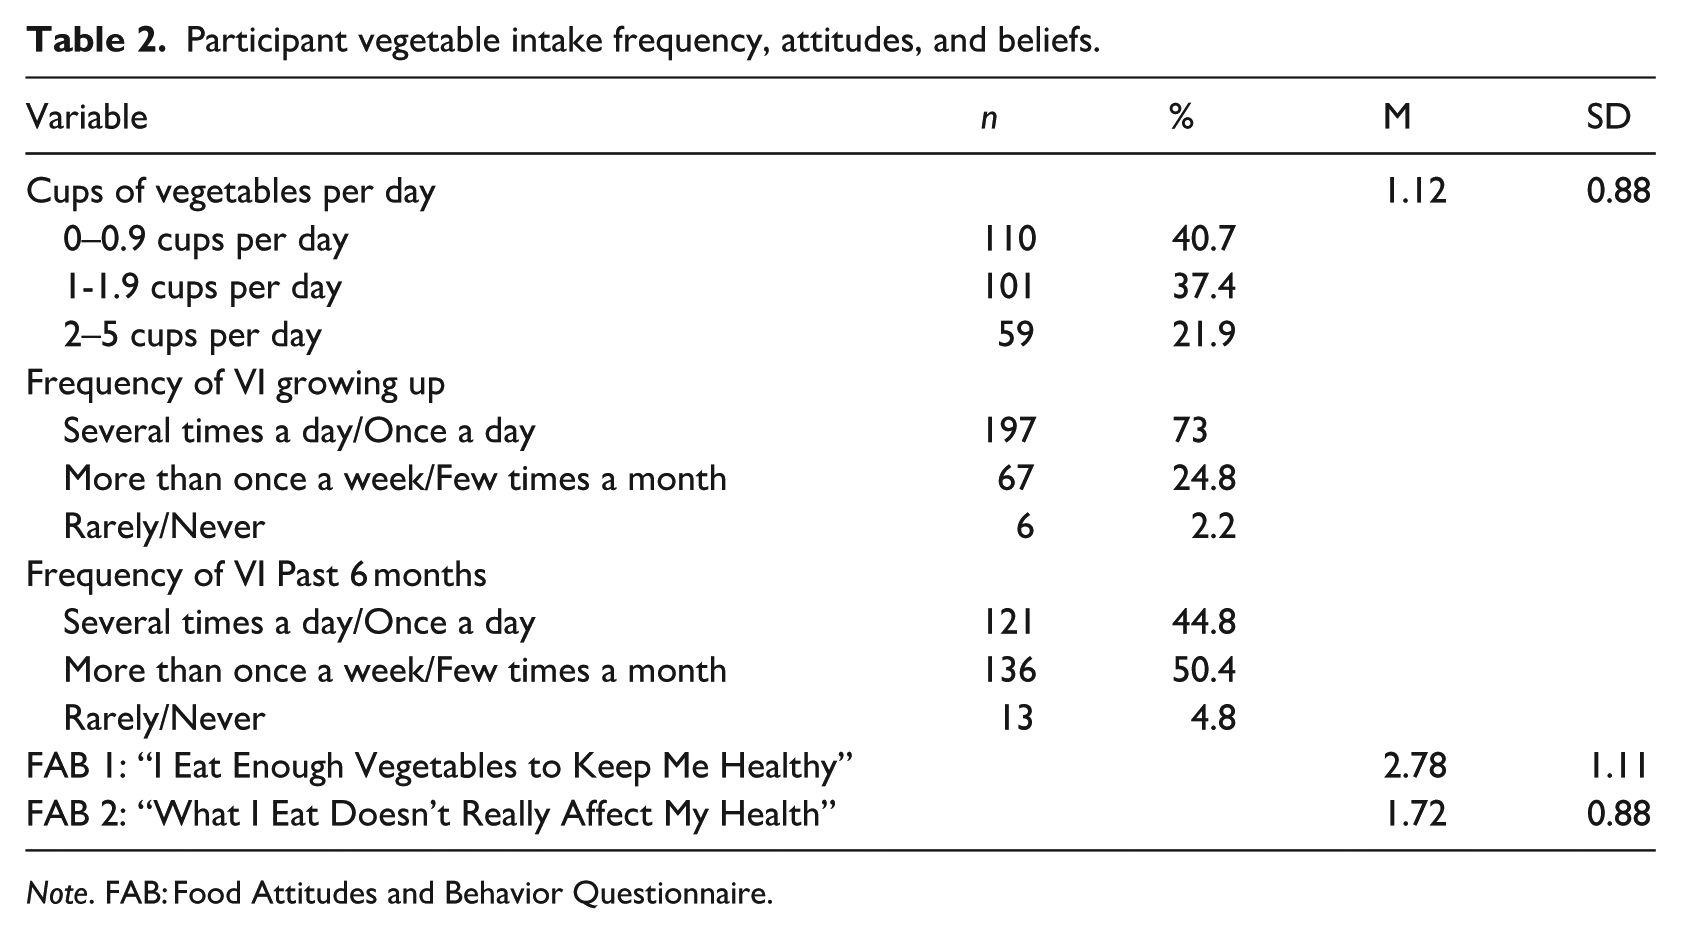
Note. FAB: Food Attitudes and Behavior Questionnaire.
Based on self-reported vegetable intake data, approximately 22% of participants ate the minimum recommended amount of two cups of vegetables per day, aligning with the 19% of participants who indicated that they ate enough vegetables when asked, “what are some reasons you choose to not eat as many vegetables?” For participants who did not eat so many vegetables, some reasons included their lack of knowledge on how to prepare vegetables (37.4%), cost of vegetables (33.7%), distaste for vegetables (28.5%), and lack of time (30.7%).
Hypothesis 1
There was a significant negative correlation between stress scores and daily VI, r = −0.13, p = 0.018, indicating that higher stress levels were associated with lower VI. We conducted a simultaneous multiple regression to assess whether meal plan (yes/no), living situation (on campus, off campus-parent’s home, off campus-apartment/duplex), and perceived stress predict vegetable intake. The results showed that the model significantly predicted vegetable intake with a small effect size (R2 = 0.06, F[3, 266] = 5.52, p = 0.001). Results indicated that meal plan and living situation did not significantly predict vegetable intake, but perceived stress remained a significant predictor of vegetable intake (β = −0.15, p = 0.014), suggesting this relationship is not attributable to the potential confounds. We also analyzed the relationship between depression and VI, but there was no significant correlation, r = −0.09, p = 0.131. We also conducted a simultaneous multiple regression to assess whether depressive symptoms, meal plan, and living situation predict vegetable intake. We found that the relationship between vegetable intake and depressive symptoms was not significant after controlling for covariates (β = −0.11, p = 0.065), nor did the other predictors significantly predict vegetable intake. To examine whether VI differed by perceived stress level (low, moderate, high), a Kruskal-Wallis H test was conducted, demonstrating a statistically significant difference in VI across the three stress groups, χ2(2) = 6.34, p = 0.042. Follow-up Mann-Whitney U tests indicated that participants with low stress reported significantly greater VI than those with high stress, U = 377.00, Z = −2.53, p = 0.011. No significant difference was observed between the low and moderate stress groups, p = 0.681. The comparison between moderate and high stress groups approached significance, p = 0.057, but did not remain significant after a Bonferroni correction. A Mann-Whitney U test revealed a statistically significant difference in VI between participants with and without depressive symptoms, U = 7075.50, Z = −3.00, p = 0.003. Participants with depressive symptoms reported consuming fewer cups of vegetables per day than those without symptoms.
Hypothesis 2
The majority of participants in both the pre- and post-video assessment were in the preparation stage (See Table 3), indicating that either (1) in the past 6 months, they had tried to increase VI somewhat or very successfully, or (2) they were not successful in increasing VI but were planning on continuing to try, or (3) they are seriously thinking about increasing their VI and were somewhat or very confident in their abilities to change their diet.
Participants’ SoC before and after the video intervention.
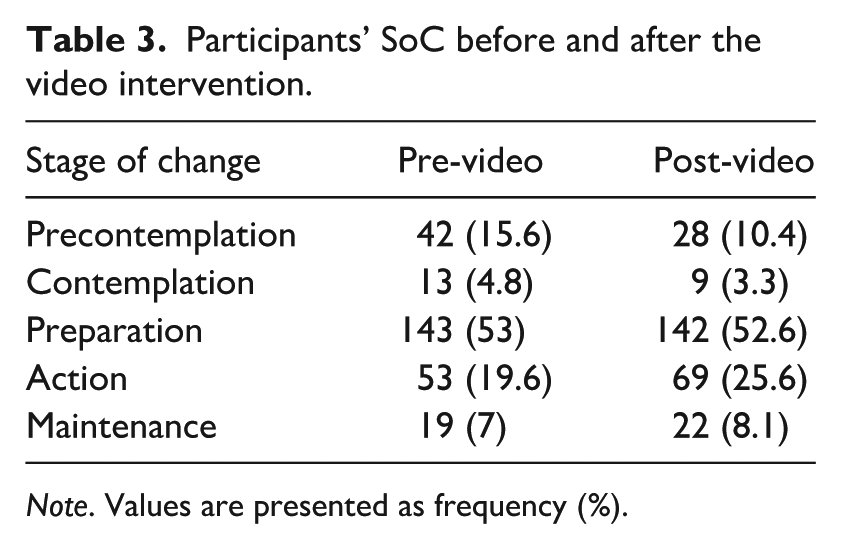
Note. Values are presented as frequency (%).
A McNemar test was conducted to examine the changes in the proportion of participants classified as being in the precontemplation stage before and after watching the video. The results indicated a significant difference of participants moving out of the precontemplation stage into higher stages after the video, p = 0.009, n = 270. The McNemar test with those in the contemplation stage before and after the video was not statistically significant, p = 0.289.
Chi-square tests assessed whether demographic differences were significantly associated with an increase in stage of change. These differences included student classification, ethnicity, gender, cups of vegetables per day, and depressive symptoms, but only student classification was significant. A Fisher’s exact test examining the association between student classification and whether participants increased in their stage of change following the video intervention indicated a significant association (p = 0.043). Specifically, more freshmen and sophomores reported increasing in their stage of change when compared to juniors and seniors.
To examine whether findings were generalizable across genders, two additional analyses were conducted. First, a Fisher’s Exact test comparing the distribution of males and females across the five stages of change prior to the intervention was non-significant (Fisher’s Exact = 2.08, p = 0.717, Cramér’s V = 0.09), indicating that male and female participants did not differ meaningfully in their baseline readiness to change. Second, a Pearson chi-square test found no significant gender difference in the proportion of participants who increased their stage of change following the video (χ2(2) = 1.53, p = 0.466, Cramér’s V = 0.17), suggesting the pattern of change was consistent across genders.
Discussion
The present study examined the relationships between VI, depressive symptoms, and perceived stress scores, as well as the effectiveness of an educational video on college students’ readiness to improve their vegetable consumption habits, using the transtheoretical model as a framework. The findings partially supported both hypotheses, providing insights into the association between VI and mental health and the potential effectiveness of a brief educational intervention in promoting health-related behavior change related to VI in college students.
The first hypothesis—that higher vegetable intake would be associated with lower levels of depression and stress—was supported. Significant differences in VI were found between those with and without depressive symptoms, as well as between those with low versus high perceived stress levels. Individuals who consumed more vegetables tended to report fewer symptoms of depression and lower stress levels. This finding aligns with previous research linking nutrient-dense foods, such as vegetables, with lower rates of mood disorders (Jacka et al., 2017). The antioxidants in vegetables, such as carotenoids, may help reduce inflammation and oxidative stress, factors associated with depression and stress. These findings highlight the potential mental health benefits of encouraging greater VI, particularly among young adults—a group that often falls short of meeting dietary recommendations. Notably, in our sample, almost 22% of participants met the recommended daily VI (2–3 cups), exceeding the national average of 7% for young adults. Moreover, many participants reported experiencing mild to moderate depressive symptoms and moderate perceived stress, further emphasizing the relevance of dietary interventions in this population.
The second hypothesis—that participants would demonstrate increased readiness to change after watching the educational video—was also supported, though only among those in the precontemplation stage. Consistent with expectations, a significant proportion of these participants progressed to a higher stage of change following the video intervention, indicating increased readiness to consider or take action toward increasing VI in their diet. This finding suggests that brief, targeted interventions can positively influence young adults’ intentions and readiness to adopt healthier eating habits, a result which supports other research on short-term interventions (Whatnall et al., 2018). Participants who were initially in the precontemplation stage, and thus not actively considering changes to their VI, may have developed greater awareness and motivation due to the video’s educational and accessible content.
However, no statistically significant change was observed among those in the contemplation stage. It is possible that individuals already considering improving VI require more intensive or sustained interventions to progress to the preparation or action stages. A single, brief video may be insufficient to meaningfully advance their readiness. This finding suggests the importance of future research on stage-tailored interventions (Di Noia et al., 2008), as individuals at different points in the behavior change process may respond differently to the same content.
Further analysis revealed a significant association between student classification and the likelihood of progressing in stage. Freshmen and sophomores were more likely to increase their readiness to change compared to juniors and seniors. This may reflect developmental or environmental differences, such as younger students being more open to forming new health habits and encountering fewer ingrained routines. Conversely, older students may have more established eating behaviors or time constraints that make dietary change more difficult.
Limitations
Several limitations should be considered when interpreting these findings. First, the study relied on self-reported measures of vegetable intake, perceived stress, and depression symptoms, which may introduce reporting biases. Incorporating objective measures of dietary intake, such as skin carotenoid biomarkers measured by spectroscopy (e.g. Veggie Meter®), and validated diagnostic tools for mental health assessments would provide a more comprehensive view. In addition, the use of cup-based measurements, consistent with CDC and U.S. Dietary Guidelines recommendations, limits direct comparison with the World Health Organization’s recommendation of 400 g of combined fruit and vegetable intake per day (WHO, 2003). Additionally, the gram weight of one cup of vegetables varies considerably by vegetable type, further precluding a precise unit conversion. Future research with international populations may benefit from adopting gram-based measurements to facilitate cross-cultural comparability. Second, because the study was conducted online and offered course credit, some participants may have been more motivated by that credit than by genuine engagement, potentially affecting the response reliability and quality. This was seen in the aberration of some participants’ responses post-video, which placed them in the action category despite not having increased their actual VI. Participants were only classified as being in the action phase if they reported (a) moderate to high vegetable intake and (b) recent increases in intake within the past 1–5 months. Given that meaningful behavioral change takes time, the study’s brief duration could only affect cognitive aspects of the Transtheoretical Model—namely, precontemplation, contemplation, and preparation—rather than producing immediate, measurable increases in actual vegetable consumption. Third, the cross-sectional design of the study does not allow for causal inferences regarding the relationship between vegetable intake and mental health. People who are more likely to eat vegetables may be more likely to engage in other positive health behaviors, which may also impact depression symptoms and perceived stress. Fourth, the study sample was nearly 80% female, which may make it difficult to generalize the findings, despite the video’s apparent effectiveness across genders. Horacek et al. (2002) found that men were disproportionately represented in the precontemplation stage for fruit and vegetable intake and recommended that interventions targeting men emphasize practical perceived benefits such as cost, convenience, and accessibility, alongside skills-based strategies for shopping, cooking, and meal management. The present intervention video incorporated precisely these elements, addressing common practical barriers to vegetable intake including cost, time constraints, and lack of knowledge. This alignment with the literature-identified needs of male participants may help account for the comparable response observed across genders. We acknowledge, however, that the small male subsample limits the statistical power of these comparisons, and gender generalizability remains a limitation that future studies with more balanced samples should address.
Strengths and practical implications
Despite its limitations, this study contributes to the growing literature on the intersection between nutrition and mental health. The results suggest that even brief, scalable video interventions may play a positive role in dietary attitudes and motivation among college students, especially those in the earliest stages of change. The observed association between higher VI and lower depression and stress highlights the importance of including dietary components in mental health promotion strategies on college campuses. The short, animated video proved to be an accessible and engaging format for delivering health-related educational content. Furthermore, 86% of participants retained key information from the video about carotenoids, supporting the potential efficacy of brief educational interventions in enhancing health knowledge. Universities could easily implement similar videos in orientation sessions, health and wellness classes, apps, or social media to reach a wide audience.
Conclusion
This study offers further evidence that vegetable consumption is negatively associated with depression and perceived stress. It also offers preliminary evidence that brief animated educational video interventions can increase readiness to improve dietary behaviors among college students who are not considering engaging in a health behavior, such as increasing vegetable intake. The use of animation can enhance engagement and understanding while also offering the benefit of a scalable and cost-effective format for public health promotion. The findings underscore the importance of promoting vegetable consumption not only for physical health but also for psychological well-being, especially among young adults.
Supplemental Material
sj-docx-1-hpq-10.1177_13591053261464459 – Supplemental material for Exploring the association between vegetable intake, mental health, and readiness to change in college students
Supplemental material, sj-docx-1-hpq-10.1177_13591053261464459 for Exploring the association between vegetable intake, mental health, and readiness to change in college students by Lyla G. K. Ricks, Kelly Haskard-Zolnierek and Krista Howard in Journal of Health Psychology
Footnotes

Ethical considerations
The authors confirm that the research presented in this article met the ethical guidelines, including adherence to the legal requirements, of the United States and received approval from the Institutional Review Board of Texas State University.
Consent to participate
Informed consent for all human participants in this study was obtained. Participants in this online study reviewed the informed consent page and clicked an online button to continue with the study if they consented to participate.
Consent for publication
Consent for publication is not applicable to this article as it does not contain any identifiable data.
Funding
The authors received no financial support for the research, authorship, and/or publication of this article.
Declaration of conflicting interests
The authors declared no potential conflicts of interest with respect to the research, authorship, and/or publication of this article.
Data availability statement
The data that support the findings of this study are available from the corresponding author, KHZ, upon reasonable request.
Supplemental material
Supplemental material for this article is available online.
References
Supplementary Material
Please find the following supplemental material available below.
For Open Access articles published under a Creative Commons License, all supplemental material carries the same license as the article it is associated with.
For non-Open Access articles published, all supplemental material carries a non-exclusive license, and permission requests for re-use of supplemental material or any part of supplemental material shall be sent directly to the copyright owner as specified in the copyright notice associated with the article.
