
Abstract
The present study was motivated by theoretical considerations in cognitive linguistics associated with the concept projection as well as by theories in cognitive science related to self-directed learning on computers, to apply them in developing Japanese learners’ knowledge of the different degrees of sureness attached to
I Cognitive linguistics and conceptual metaphor
Learning a language is one of the most complex human accomplishments. Among the various different views about language, cognitive linguistics emphasizes the role of frequency and schema formation through form–meaning pairings (Tomasello, 2009), the so-called usage-based approach, and language is best comprehended as a reflection of general cognitive processes through which humans experience and interact with the physical world. Lakoff and Johnson (1999) argued that embodied concepts can be extended from a source domain to a target domain. This process is called conceptual projection on which the conceptual metaphor theory (CMT; Lakoff & Johnson, 1999) is based. Grady (1997) explained that conceptual projection links objective and subjective experiences, and that humans use their understanding of the physical world as a framework in the source domain for representing more abstract concepts in the target domain.
The metaphor central to the present study is the proximal–distal metaphor, which involves the use of three different items, such as
The present study investigates whether comprehending the abstract concept of the degrees of certainty in terms of the spatial concept of different distances can be used as a means for memory enhancement in developing Japanese learners’ knowledge of the different degrees of sureness attached to
II Applying cognitive linguistics as a pedagogical approach
Recently, approaches for raising metaphor awareness have been shown to have positive effects on second language learning. It is in the area of vocabulary learning that much of the empirical work on the effects of approaches to raising metaphor awareness has been done so far (Boers, 2013).
Boers (2000) conducted three experiments to determine the effects of teacher-directed approaches to raising metaphor awareness in teaching English expressions related to anger to young Dutch learners of English in Experiment 1, teaching English expressions related to upward and downward economic trends to adult French learners of English in Experiment 2, and teaching English expressions related to
Csábi (2004) and Berendi, Csábi, and Kövecses (2008) examined the relative effects of teacher-directed approaches to raising metaphor awareness with or without explicit information on Hungarian learners of English learning English idiomatic expressions with the words hold and keep. They demonstrated that the teacher-directed metaphor awareness-raising approach with explicit information helped the learners, not only to learn the English idiomatic expressions, but also to maintain their knowledge over a longer period of time.
Comparing the teacher-directed metaphor awareness-raising approach with the traditional teaching approach, Tyler, Mueller, and Ho (2010) explored the efficacy of the teacher-directed metaphor awareness-raising approach in teaching English modals to learners of English as a foreign language (EFL) in a US university, and found more improvement for the metaphor awareness-raising approach group than for the traditional group. Furthermore, Tyler, Mueller, and Ho (2012) also demonstrated that the teacher-directed metaphor awareness-raising approach proved better than the traditional approach for teaching the semantics of the English prepositions to, for, and at to Vietnamese EFL learners.
Although there has been general support for a teacher-directed metaphor awareness-raising approach, inconclusive findings with regard to the effectiveness of the approach have been reported by two studies. Yasuda (2010) investigated the effects of teacher-directed metaphor-awareness instruction for acquiring English idioms by Japanese learners of English, comparing it with traditional instruction, and reporting that the metaphor awareness-raising approach group outperformed the traditional instruction group on unexposed items, but not on exposed items. Gao and Meng (2010) examined the effects of a teacher-directed metaphor awareness-raising approach on Chinese EFL learners of English idiomatic expressions and its effect on retention. The results showed that although the metaphor awareness-raising approach and the traditional approach had similar effects on acquisition, the former had a stronger effect on retention.
In view of both conclusive and inconclusive findings regarding the effectiveness of the teacher-directed metaphor awareness-raising approach, Boers (2013) argued that we need to be careful in interpreting the results of previous studies, pointing out the following two issues. First, some studies did not conduct sufficiently precise pre-tests, or they delayed post-tests to ascertain whether there was any difference before treatments, or whether there were long-term effects of the approaches. Second, the superior effects of the metaphor awareness-raising approach may be ascribed to other variable ingredients of the metaphor awareness-raising approach. Therefore, we need to adopt more rigorous experimental designs with controlled interventions to find the most appropriate metaphor awareness-raising approach for allowing learners to acquire target expressions easily and efficiently.
Moreover, all of the previous studies have adopted teacher-directed approaches. Nowadays we see computers in classrooms, and they can be defined as electronic devices, enhancing self-directed learning and allowing students to engage in conceptual operation necessary for meaning conceptualization. It is worthwhile looking into the effects of self-directed approaches on computers, comparing the self-directed and the teacher-directed methods in approaches to raising metaphor awareness.
III Self-directed learning on computers
Although the literature on foreign language teaching is replete with studies of learning strategies, self-directed learning on computers has received little attention and remains a relatively understudied area of cognitive science (Gureckis & Markant, 2012). While teacher-directed learners are exposed to the flow of target information passively, self-directed learners are able to choose the parts of the target information they most want to learn and focus their efforts there. In other words, self-directed learners can avoid redundant target information and focus on parts of the target information that they do not understand well. Markant and Gureckis (2010) conducted an experiment with undergraduate students in New York under either a self-directed learning condition or a passive-yoked learning condition on computers. They found that the participants in the self-directed learning condition acquired novel perceptual categories faster because they were free to query individual exemplars in a self-directed manner, avoiding redundant exemplars that they had already learned.
Furthermore, Gureckis and Markant (2012) explained that another advantage of self-directed learning is it lets people decide how to study target information for maximum retention. In a study by Voss, Gonsalves, Federmeier, Tranel, and Cohen (2011), adult participants studied an array of common objects arranged on a grid on a computer, viewing one object at a time through a small moving window. The results indicated that the participants in the self-directed learning condition, who controlled the time spent studying each item, outperformed the participants under the passive condition on tests of spatial memory and item memory. As computer-based self-directed learning has been demonstrated to be particularly effective from a cognitive perspective, the present study examines the effects of a self-directed approach on concept projection, through which learners understand an abstract concept, namely the degree of certainty in terms of the spatial concept of distance.
IV The present study
To date, no studies have examined the effects of applying the proximal–distal metaphor in teaching the markers of the
What are the relative effects of cognitive and non-cognitive approaches and the relative effects of self- and teacher-directed approaches on the development of Japanese learners’ knowledge of the different degrees of sureness attached to the
1 Participants
A total of 139 university students from five full classes at a private university in Japan participated in the present study. The participants’ average age was 20 years, and they were science majors, studying in a college of science and engineering. The participants’ first language was Japanese, and they were monolingual Japanese speakers learning English as a foreign language. All the participants had studied English for eight years at schools in Japan. The participants’ English proficiency was evaluated to be roughly at the intermediate level, as defined by a Test of English for International Communication (TOEIC) score of 400–700, and there were no significant differences on the TOEIC scores between the five groups, F (4, 134) = .36, p = .839 > .05, ηp2 = . 011 (see Table 1). The participants in the five classes were randomly assigned to four treatment groups, self-directed cognitive approach (SC; n = 29: female = 4, male = 25), teacher-directed cognitive approach (TC; n = 31: female = 3, male = 28), self-directed non-cognitive approach (SN; n = 26: female = 4, male = 22), teacher-directed non-cognitive approach (TN; n =28: female = 6, male = 22), and one control group (n = 25: female = 4, male = 21).
Means of the TOEIC scores across the five groups.
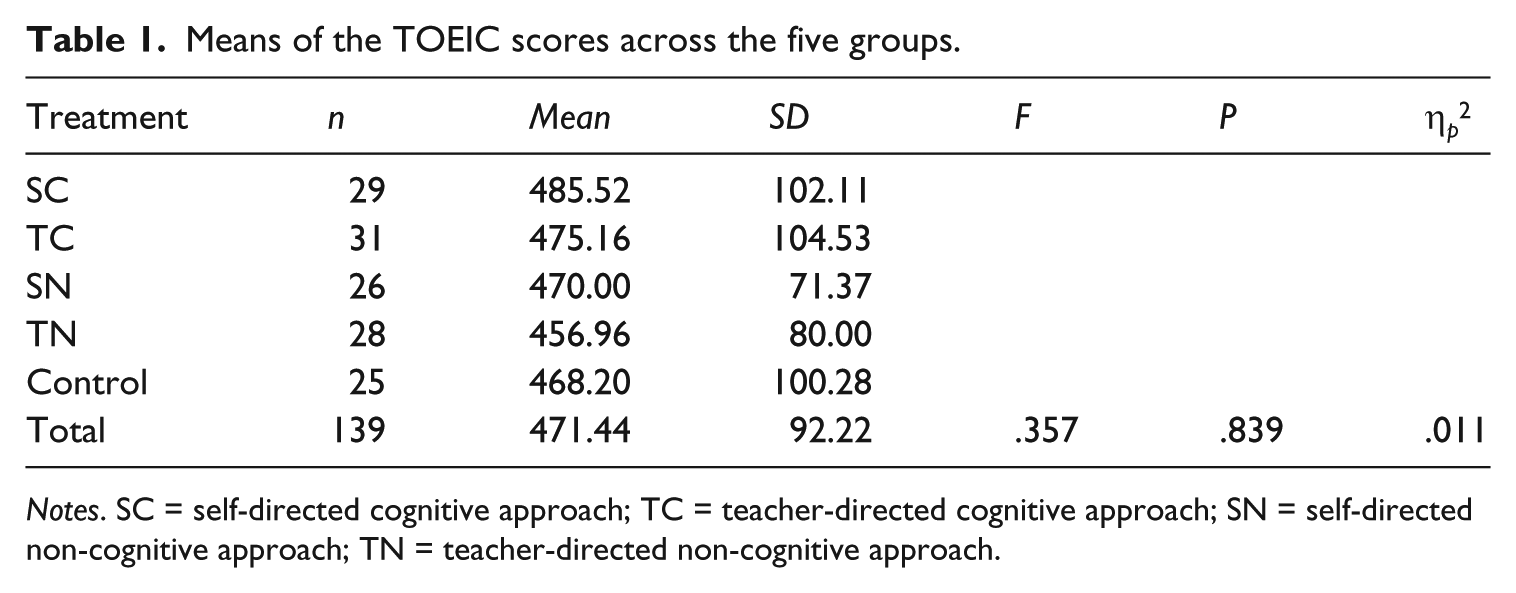
Notes. SC = self-directed cognitive approach; TC = teacher-directed cognitive approach; SN = self-directed non-cognitive approach; TN = teacher-directed non-cognitive approach.
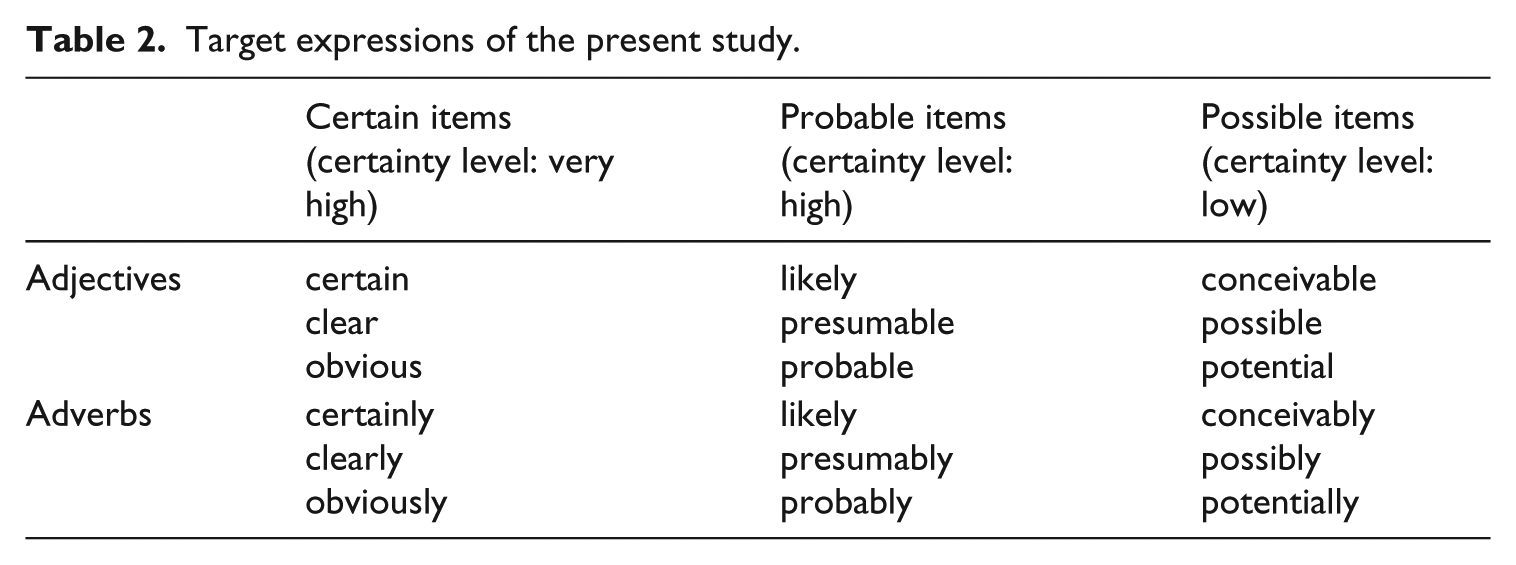
2 Target expressions
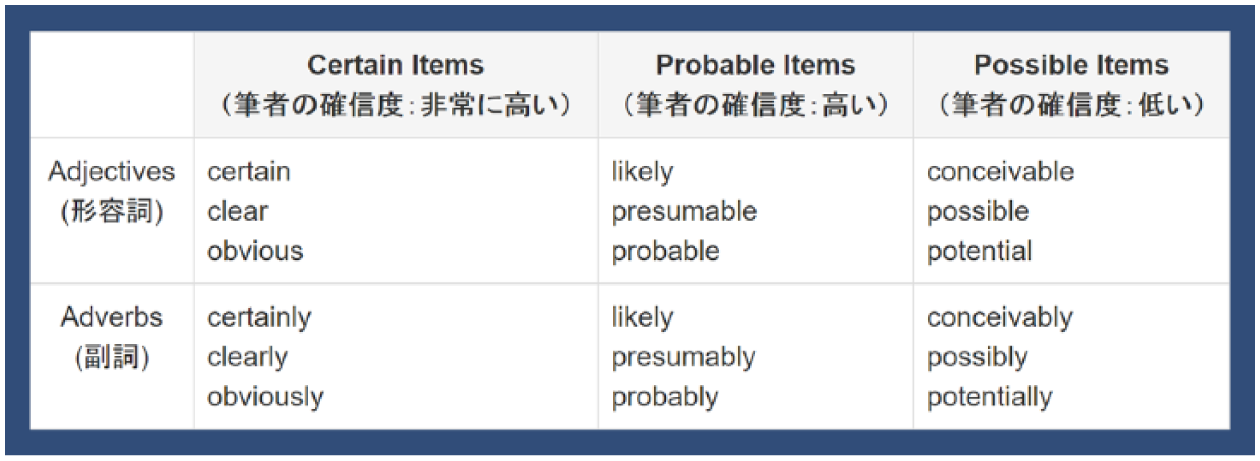
Takimoto (2015) discovered that Japanese EFL learners had great difficulty in identifying and categorizing the roles of adjectives and adverbs for probable and possible items, and misapprehended the meanings of the two. Accordingly, it might be assumed that the Japanese EFL learners were not familiar with metaphors associated with adjectives and adverbs for
Target expressions of the present study.
3 Learning treatments
Each learning session for the four treatment groups and the control group lasted for 20 minutes, and the instructor gave all directions in Japanese during each learning session. Learning sessions were carried out by the same instructor once a week for six weeks in five intact classes at a university in Japan.
The four treatments were four types of computer-based explicit learning. The four treatment groups were required to engage in explicit learning about the meanings of the target expressions, either with 3D image content based on the proximal–distal metaphor for the cognitive approach groups, or with only a list for the non-cognitive approach groups, through computers and then work on acceptability judgment and listening tasks.
The acceptability judgement and listening tasks based on the usage-based approach were the same for the four treatment groups, so that an equal amount of exposure to each one of the three different items was provided. During each lesson, the acceptability judgement task required the participants to read three passages (each about 145 words long) about familiar topics, choose the most appropriate form out of the three offered for each underlined part, and indicate the participants’ choices by circling (a), (b), or (c). Then, the listening task required the participants to listen to a recording of each passage and select the actual word used for each underlined part. Some sample items for the acceptability judgment and listening tasks are presented below: When we talk face to face, regardless of 1. Acceptability judgement task: Suppose that Listening task: Listen to a recording of the passage and select the actual word used for each underlined part.
No feedback was given during the learning sessions. Additionally, the four learning treatments were matched for target pragmatic features. That is, the first and fourth classes were focused on the
In self-directed learning, the participants were able to use the online computer program in their own way, choosing the parts of the target information they wanted to learn more about, and concentrating on what they wanted to study. On the other hand, in the teacher-directed learning, the instructor played the role of a lecturer. The instructor had primary control of the online computer program, adhering to the information available in the online computer program. Thus, in the present study, the difference between the self- and teacher-directed approaches was that in the self-directed approaches, the participants determined how much time they spent on each scene, whereas in the teacher-directed approaches, the instructor decided how much time should be spent on each scene.
The cognitive approach involves concept projection, a process through which the participants understand an abstract concept, namely the degree of certainty, in terms of the spatial concept of distance, whereas the non-cognitive approach does not involve concept projection, but instead involves rote learning of a list of target expressions related to the degree of certainty.
The self-directed cognitive (SC) approach consisted of two components: (a) watching 3D image content based on the proximal–distal metaphor about the target expressions and then (b) engaging in the acceptability judgment and listening tasks. The teacher-directed cognitive (TC) approach consisted of two components: (a) watching 3D image content based on the proximal–distal metaphor about the target expressions under the instructor’s guidance for 5 minutes and then (b) engaging in the acceptability judgment and listening tasks under the instructor’s guidance for 15 minutes. The self-directed non-cognitive (SN) approach consisted of two components: (a) watching the list of the target expressions and then (b) engaging in the acceptability judgment and listening tasks. The teacher-directed non-cognitive (TN) approach consisted of two components: (a) watching the list of the target expressions under the instructor’s guidance for 5 minutes and then (b) engaging in the acceptability judgment and listening tasks under the instructor’s guidance for 15 minutes. Lessons for the control group were designed to focus on improving the participants’ speaking and listening skills for the TOEIC. They were not exposed to the target structures at all.
4 3D image content and explicit information
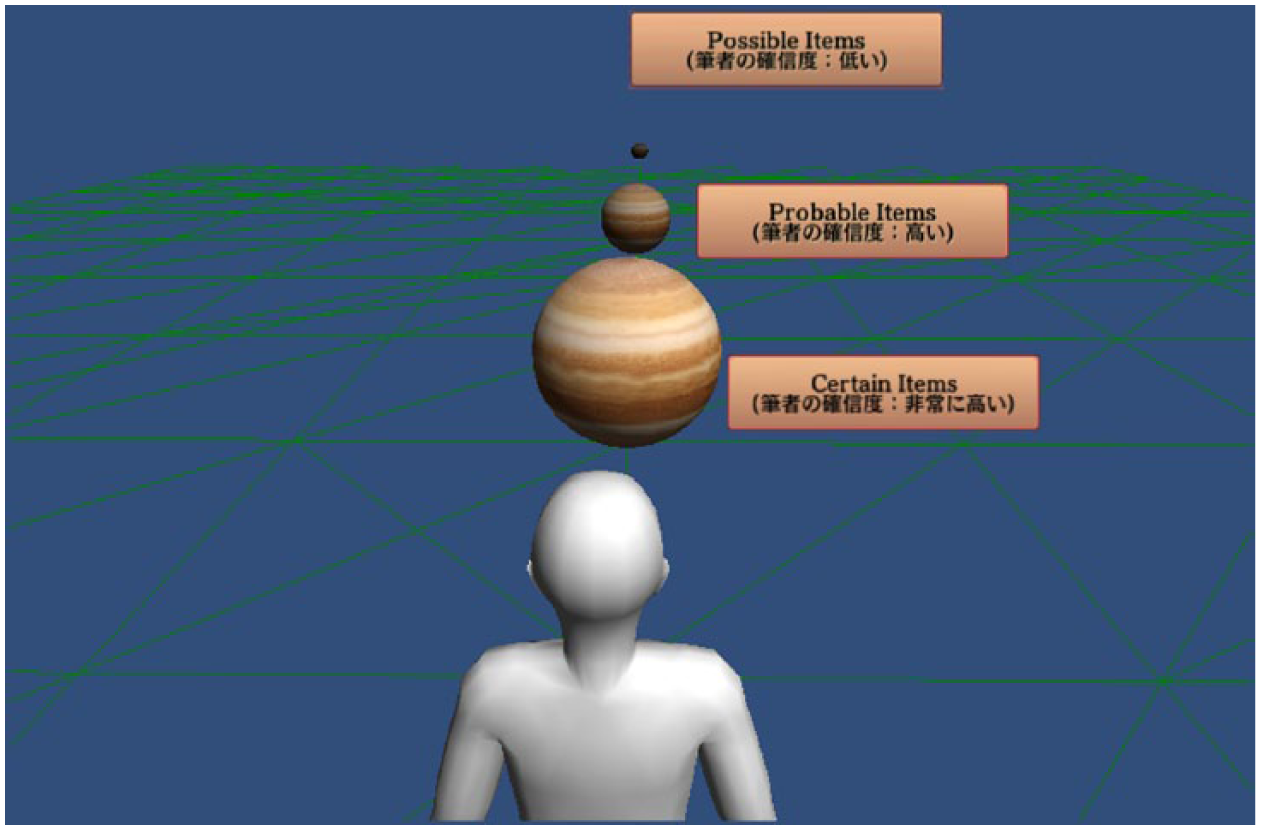
The 3D image content was used to make it easier for the participants in the cognitive approach groups to grasp spatial relationships between
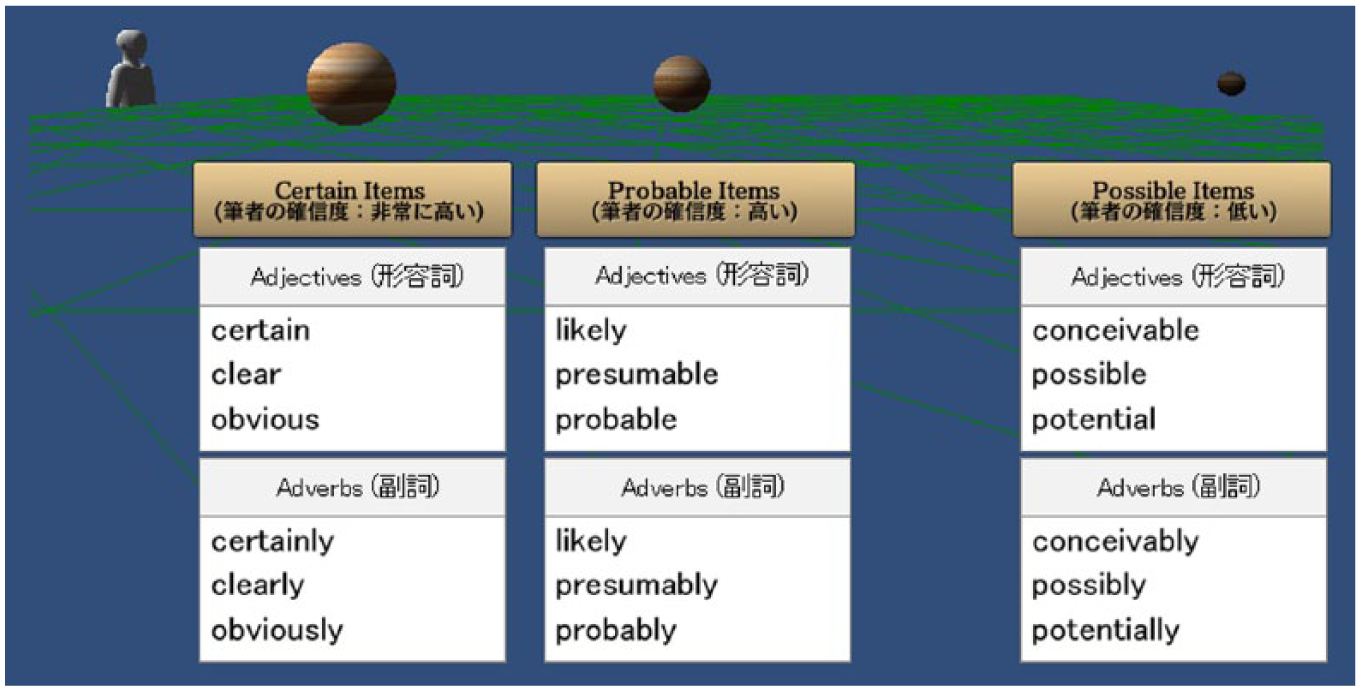
First scene of the animation of the 3D image content watched by the self-directed cognitive approach (SC) and teacher-directed cognitive approach (TC) groups.
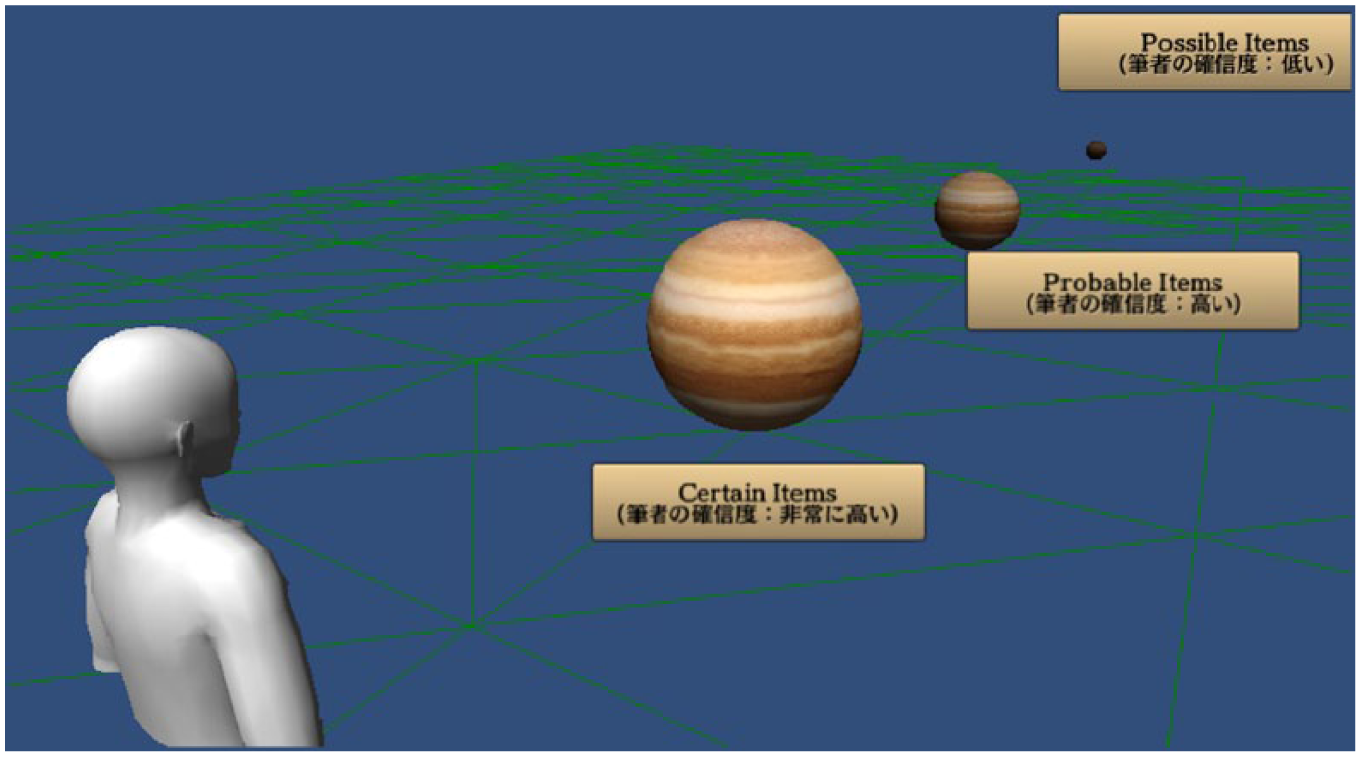
Second scene of the animation of the 3D image content watched by the self-directed cognitive approach (SC) and teacher-directed cognitive approach (TC) groups.
Third scene of the animation of the 3D image content watched by the self-directed cognitive approach (SC) and teacher-directed cognitive approach (TC) groups.
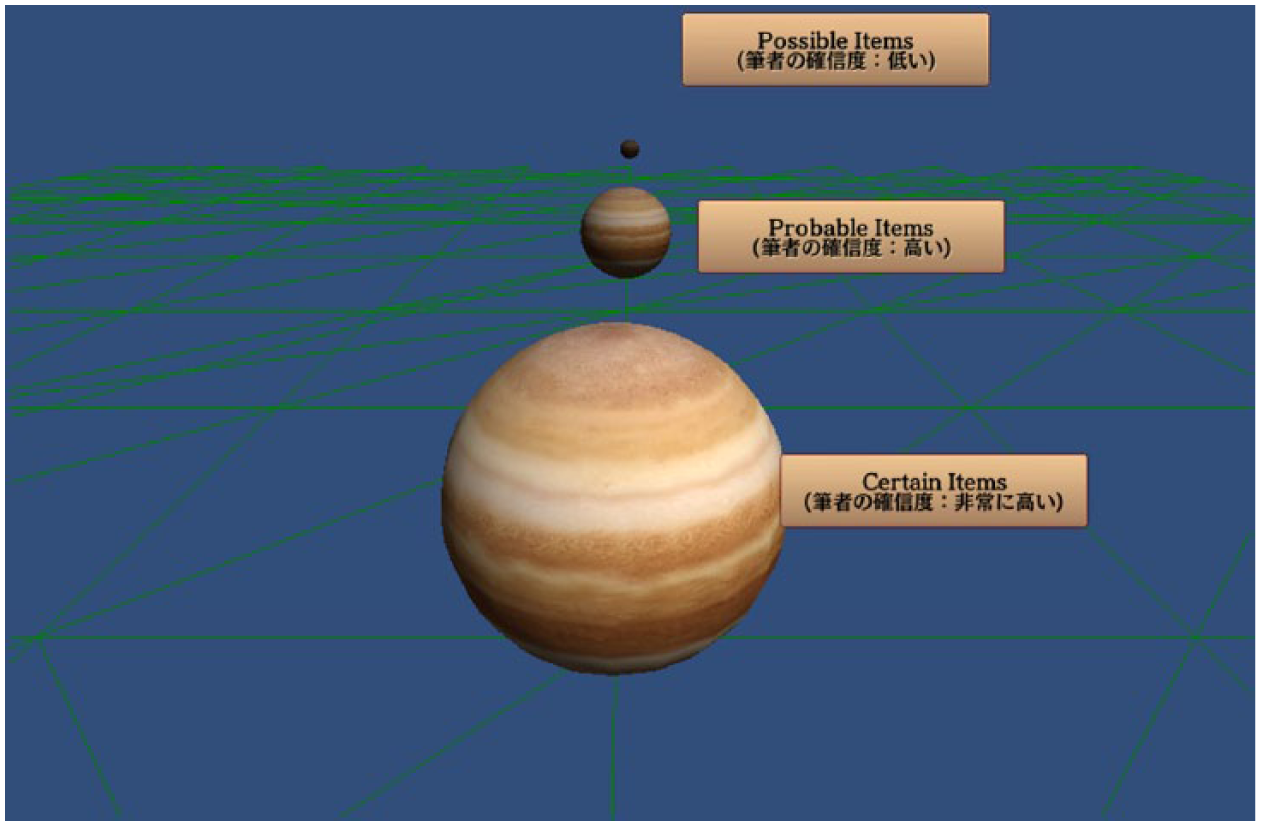
Last scene of the animation of the 3D image content watched by the self-directed cognitive approach (SC) and teacher-directed cognitive approach (TC) groups.
The participants in the non-cognitive approach groups watched the list of target expressions on a computer (see Figure 5). The list was designed to encourage the participants to memorize the forms and meanings of the adjectives and adverbs of the
Scene of the list watched by the self-directed non-cognitive approach (SN) and teacher-directed non-cognitive approach (TN) groups.
5 Testing instruments and procedures
The present study adopted a pre-test, post-test 1, post-test 2, and post-test 3 to assess the effectiveness of the cognitive and non-cognitive approaches. The pre-test was administered a week prior to the first learning treatment, post-test 1 a week after the treatments, post-test 2 in the sixth week, and post-test 3 in the fourth month following the treatments.
Each test consisted of a writing test, a comparison test, and a categorization test. Moreover, in order to provide a complete, detailed description of the participants’ cognitive processing of the target words, first, the written retrospective evaluation questionnaires were administered during the fourth, fifth, and sixth treatment sessions, and then interviews were conducted on two occasions, after post-test 2 and after post-test 3.
Four versions of the writing test, the comparison test, and the categorization test were developed and employed in order to minimize the test learning effect. The pre-tests, post-test 1, post-test 2, and post-test 3 were administered in the following order: the writing test, the comparison test, and the categorization test. Langacker (1987) considered comparison to be a fundamental cognitive operation, which led Croft and Cruse (2004) to link the fundamental concept of contrast/similarity judgment to the cognitive psychological process of comparison. The comparison and categorization tests were administered to see whether the participants could make a contrast judgment and similarity judgment on the target words. In addition, the writing test, which involves both contrast and similarity judgments, was conducted to examine whether the participants could respond appropriately through their contrast and similarity judgments. The participants were instructed to complete the writing tests within 30 minutes and the comparison judgment tests and the categorization judgment tests within 5 minutes each.
a Writing test
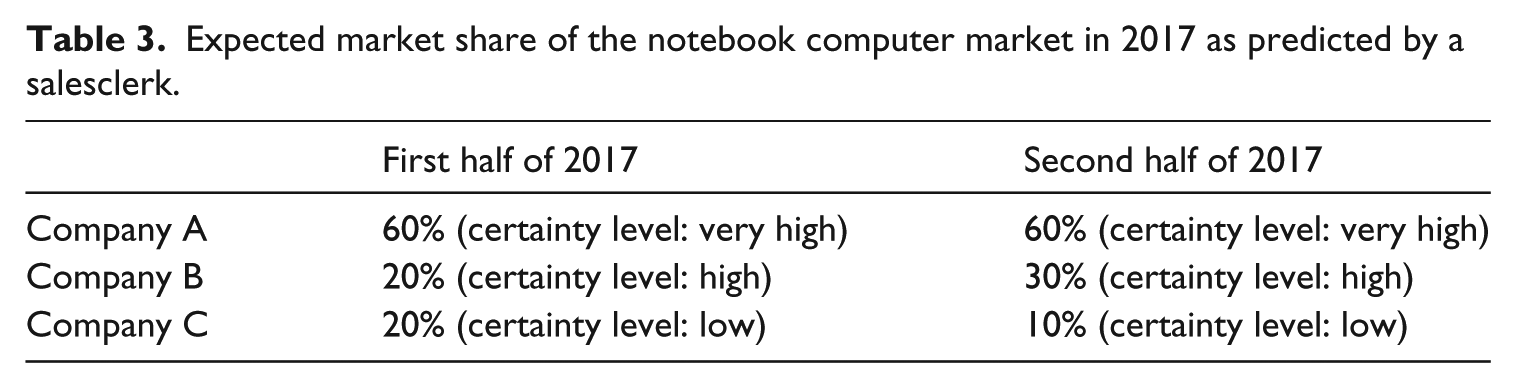
The writing test required the participants to write sentences in response to the tables about the expected market share of notebook computers, the expected number of participants, and the expected number of gold and silver medals. Two native speakers of English evaluated the participants’ writing on a 5-point scale in terms of the appropriateness of reporting the main ideas and using the target expressions. The test contained 18 items, with the maximum score being 90. Some sample items in the writing test follow. Table 3 shows the expected market share of the notebook computer market in 2017 as predicted by a salesclerk. You are the salesclerk. Explain the expected market share of notebook computers in 2017.
Expected market share of the notebook computer market in 2017 as predicted by a salesclerk.
b Comparison test
The comparison judgment test required the participants to read 12 statements and then indicate the difference in the writer’s certainty level of the underlined words according to whether they thought the difference was ‘completely different’, ‘fairly different’, ‘slightly different’, and ‘not different at all’ about the writer’s claims. Participants’ judgments were scored in line with the model answers
1
based on different degrees of sureness attached to the Other not different at all
c Categorization test
The categorization test used 12 statements and simply asked the participants to indicate the writer’s certainty level of each word according to whether they thought the writer’s certainty level was ‘completely high’, ‘high’, ‘low’, and ‘completely low’ about the claim. Participants’ judgments were scored in line with the model answers
2
based on different degrees of sureness attached to Happy people completely low
d Written retrospective evaluation questionnaire
During the fourth, fifth, and sixth treatment sessions, a written recall protocol analysis was conducted by way of a written retrospective evaluation questionnaire, which involved the participants responding to two open-ended questions (Q1 and Q2). The written recall protocol analysis provides us with some insights into the participants’ cognitive processing while performing their tasks. Q1 asked the participants to write down how they derived answers during the acceptability judgment and listening tasks, while Q2 asked the participants to write down how either the self-directed or teacher-directed learning helped them to derive answers during the acceptability judgment and listening tasks.
e Interview
Interviews were conducted on two occasions, Q1 and Q2 after post-test 2, and Q3 and Q4 after post-test 3, to provide a detailed description of the participants’ cognitive processing of the target words, and to relate it to their performance on these post-tests. Interviews started with 12 students, three students from each of the four treatment groups, but one student (Student 8) from the SN group dropped out of college after post-test 2 and interviews were completed with 11 students. Prospective interviewees were selected based on their responses to the two open-ended questions at the fourth, fifth, and sixth treatment sessions, and then, out of the prospective interviewees, three students with the highest, lowest, and middle scores on the TOEIC from each of the four treatment groups were chosen for the interviews.
V Results
Quantitative analyses were performed using SPSS 22.0 (IBM Corp., 2013) and the textual information in the written retrospective evaluation questionnaire was analysed by text-mining software, KH Coder 3 (Higuchi, 2016).
1 Reliability
Inter-rater reliability for the writing test was assessed by means of an intraclass correlation coefficient to examine the extent to which two native English raters’ scores correlated with each other. The intraclass correlation coefficients for single measures and average measures were .992 and .996 respectively, which were statistically significant (p < .001).
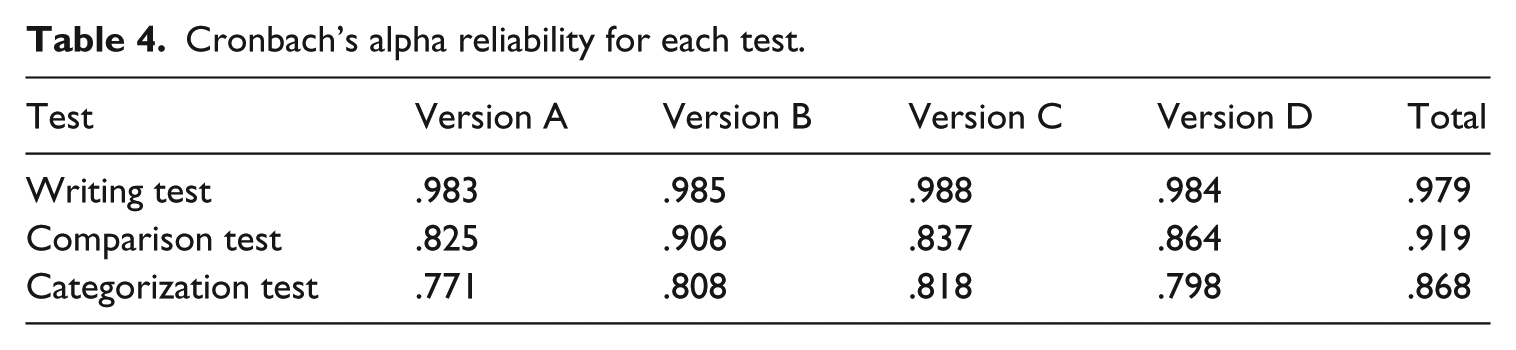
Cronbach’s alpha reliability estimates for each of the testing instruments were examined (see Table 4). The internal consistency estimates for all the tests were fairly high with the exception of Version A and D of the categorization test, which was slightly lower than the other tests in reliability, but still within an acceptable range of reliability.
Cronbach’s alpha reliability for each test.
2 Validity
As the three testing instruments in the present study are criterion-referenced tests, only the content validity and construct validity are examined. With regard to content validity, to ensure its validity in the present study, the situations of the three testing instruments were carefully planned and matched to a theoretical framework based on
Regarding construct validity, the present study adopts the pre-test–post-test design, comparing the participants’ performances on the pre-tests with their performances on the post-tests, and there are significant differences between the pre-test scores and post-test scores for each testing instrument, such as the writing test (p < .001, ηp2 = .481), the comparison test (p < .001, ηp2 = .441), and the categorization test (p < .001, ηp2 = .366). Therefore, it can be concluded that these results confirm the construct validity of the tests.
3 Descriptive Statistics and Results of MANOVA and ANOVA
The descriptive statistics in Table 5 reflect the performance of the participants for four different treatment groups and the control group on the pre-test, post-test 1, post-test 2, and post-test 3 of each testing instrument in the present study. In each case, the number of participants (n), mean (M), and standard deviation (SD) are provided.
Descriptive statistics for three testing instruments.
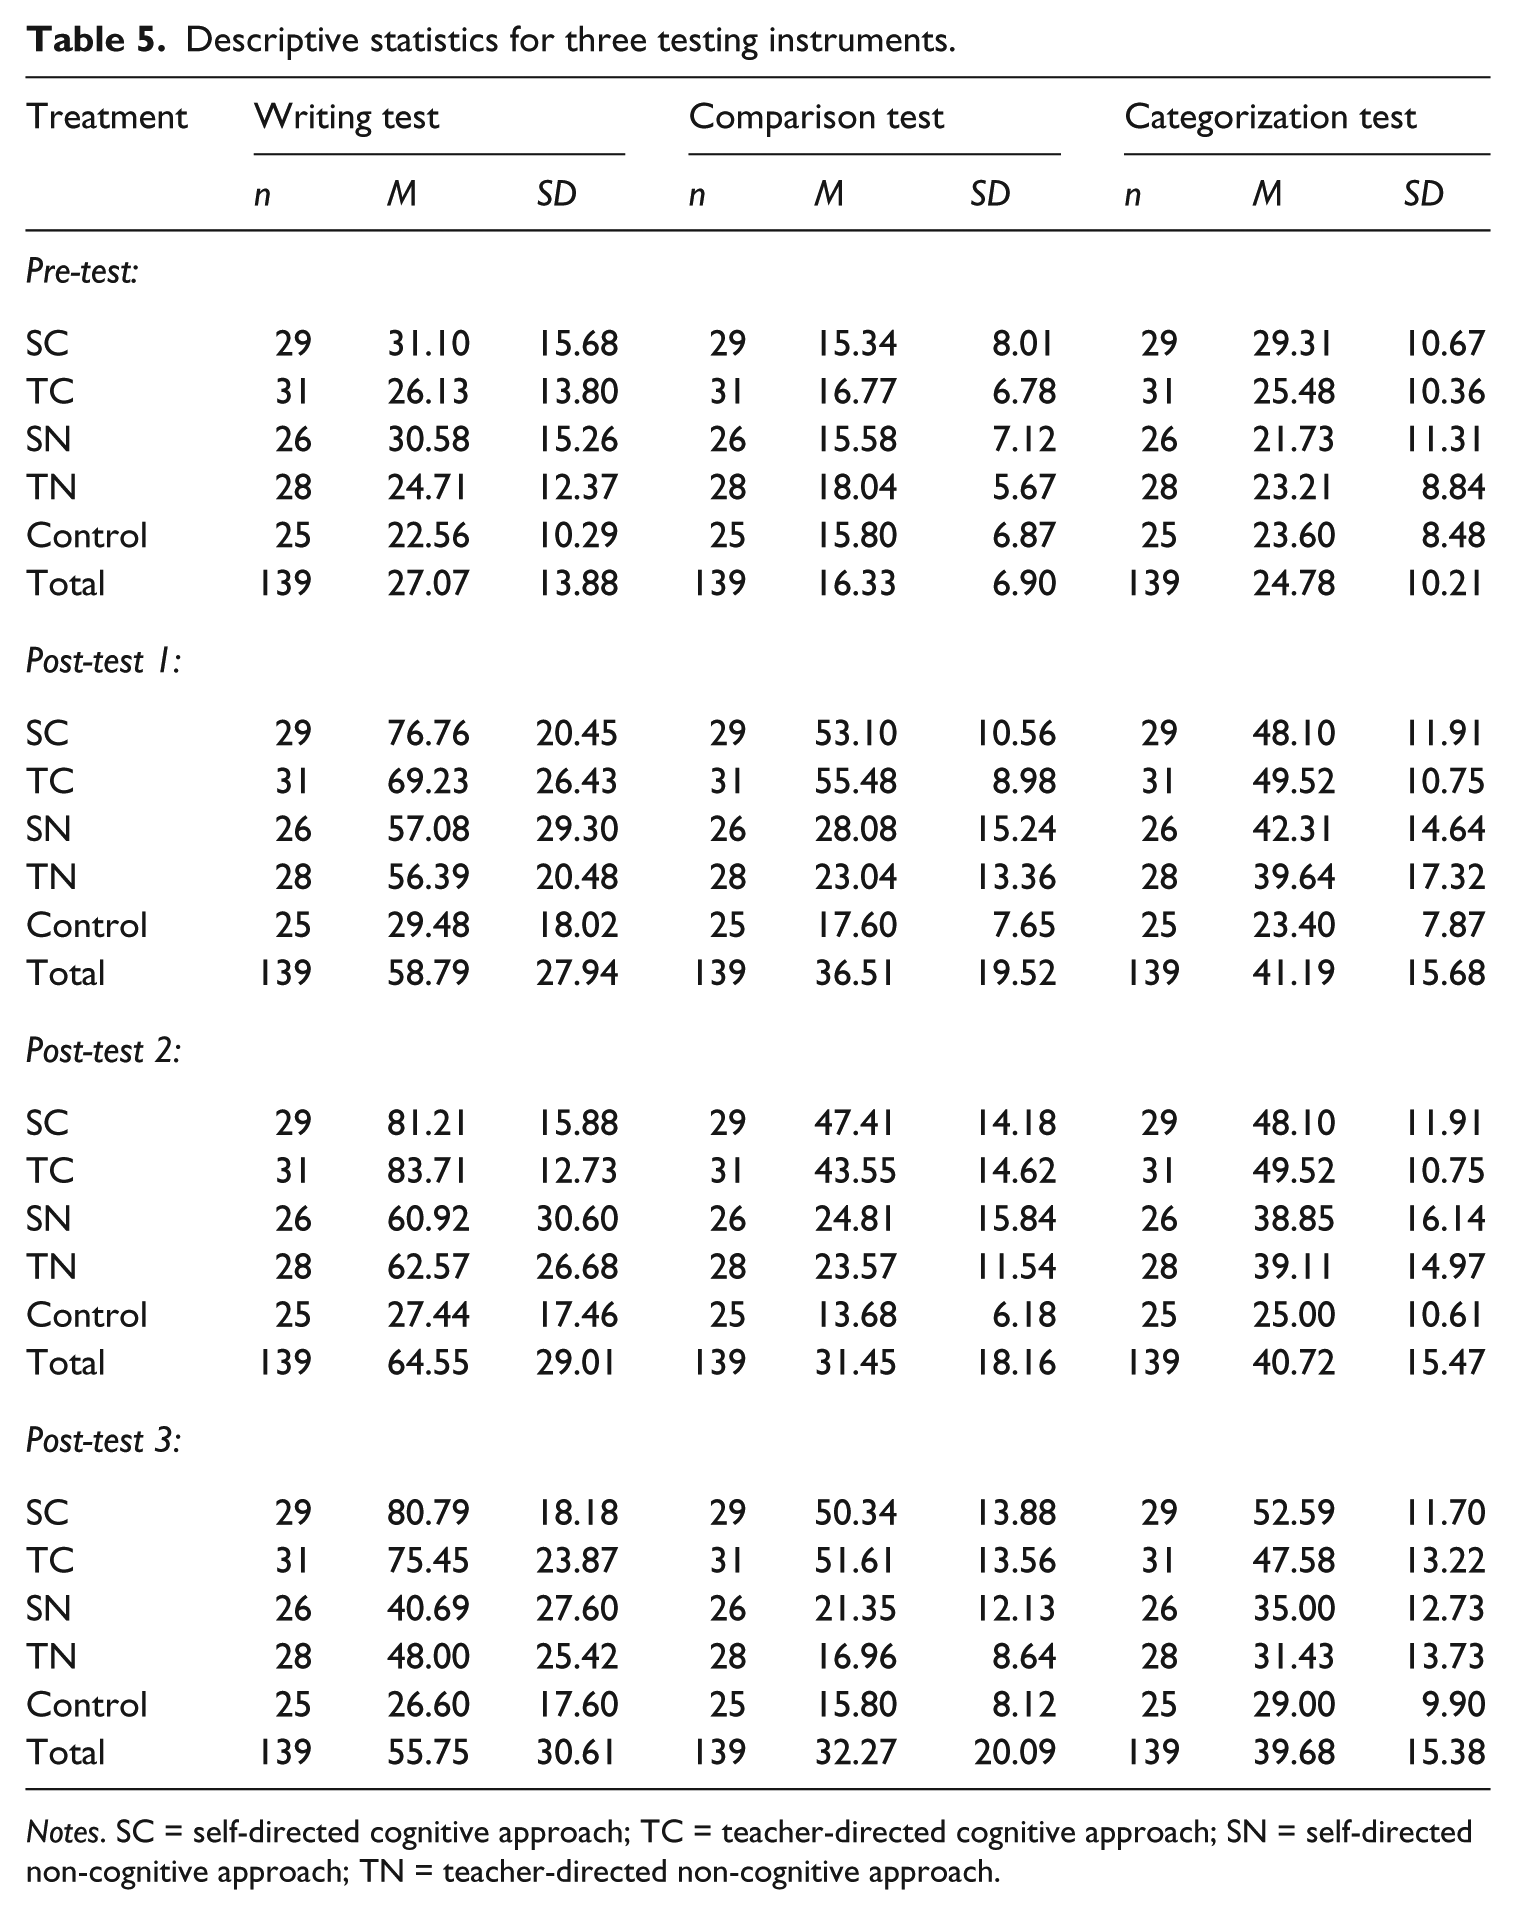
Notes. SC = self-directed cognitive approach; TC = teacher-directed cognitive approach; SN = self-directed non-cognitive approach; TN = teacher-directed non-cognitive approach.
To confirm the findings backed up by the figures statistically, multivariate analysis of variance (MANOVA) and analysis of variance (ANOVA) were run. The results of MANOVA indicate a significant main effect for Instruction, Pillai’s trace = .88, F (12, 402) = 13.91, p < .001, ηp2 = .293, a significant main effect for Time, Pillai’s trace = .70, F (9, 1206) = 40.70, p < .001, ηp2 = .233, and a significant interaction effect between Instruction and Time, Pillai’s trace = .62, F (36, 1206) = 8.66, p < .001, ηp2 = .205. The results of ANOVA also reveal a significant main effect for Instruction (F = 33.28, p < .001, ηp2 = .498 for the writing test; F = 81.46, p < .001, = .709 for the comparison test; and F = 24.41, p < .001, ηp2 = .421 for the categorization test), a significant main effect of Time (F = 124.18, p < .001, ηp2 = .481 for the writing test; F = 105.69, p < .001, ηp2 = .441 for the comparison test; and F = 77.44, p < .001, ηp2 = .366 for the categorization test), and a significant interaction effect between Instruction and Time (F = 10.32, p < .001, ηp2 = .236 for the writing test; F = 24.03, p < .001, ηp2 = .418 for the comparison test; and F = 6.34, p < .001, ηp2 = .159 for the categorization test).
The significant interaction effects between Instruction and Time clearly show that the effects of Instruction were moderated by those of Time. Although there were no significant differences on the pre-tests among the four treatment groups and the control group, the four treatment groups made gains from the pre-tests to the post-tests 1.
The descriptive statistics indicate that the participants in the four treatment groups scored higher on the post-tests than on the pre-tests, but the scores of the non-cognitive approach groups were not as high as those of the cognitive approach groups on the post-test 1 of the writing, comparison, and categorization tests. On the post-tests 2 and 3, the cognitive approach groups continued to score higher than the non-cognitive approach groups. On the whole, the effects of Instruction were greater on the three post-tests than on the pre-tests for the cognitive approach groups, and for the non-cognitive approach groups, even with some weakness and over the course of the pre-tests and post-tests, a relatively large superiority of the four treatment groups compared to the control group was clearly observed. The post-hoc Games–Howell test on the scores of the pre-tests and the three post-tests for the writing, comparison, and categorization tests reveals the following contrasts: SC, TC > SN, TN > Control (p < .05)
4 Results from the written retrospective evaluation questionnaire
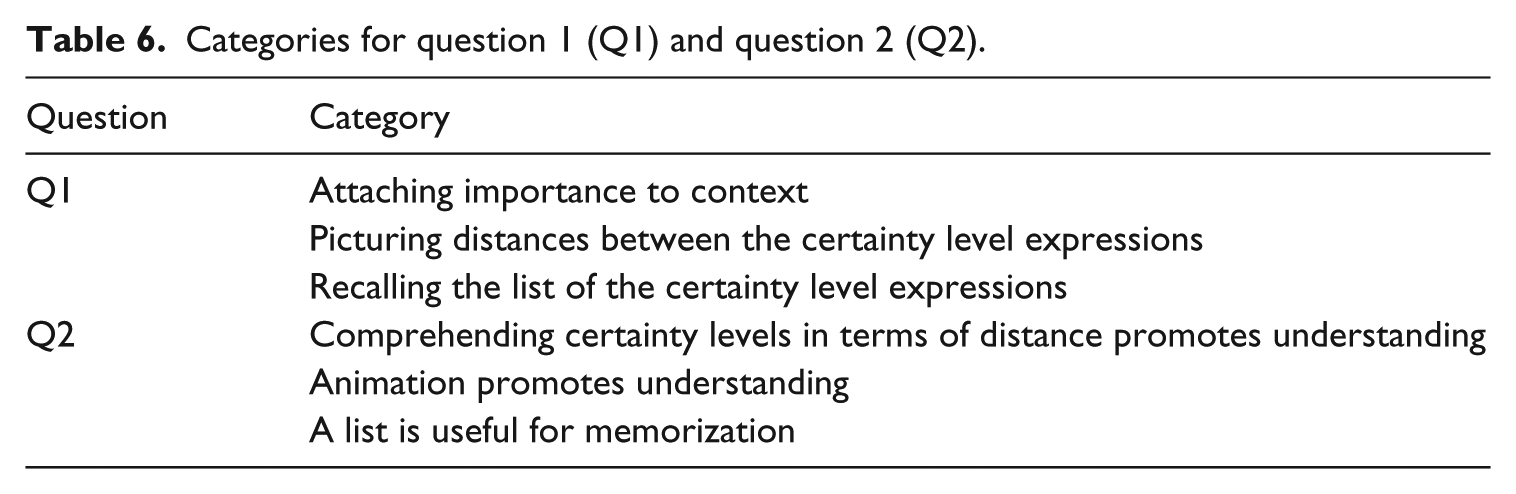
The present study analysed textual information of the participants’ responses to two open-ended questions (Q1 and Q2) using KH Coder 3, which automatically extracted concepts and then built categories in line with coding rules and text-mining techniques. Results revealed three different categories for Q1 and Q2 (see Table 6).
Categories for question 1 (Q1) and question 2 (Q2).
The present study explored the relationships among the three different categories for Q1 and Q2 by using cross tabulation analysis to find associations between the categories and the treatments.
Question 1
Table 7 indicates relationships between three categories and four treatment groups. It indicates the total number of responses and the percentages of the total sums coded into each category for Q1. Regardless of significant differences in the chi-squared values among the four treatment groups in each category, it could be assumed that all four treatment groups were inclined to attach importance to contexts, but some participants in the cognitive approach groups mentioned picturing distances between the
Cross tabulation table for question 1 (Q1).
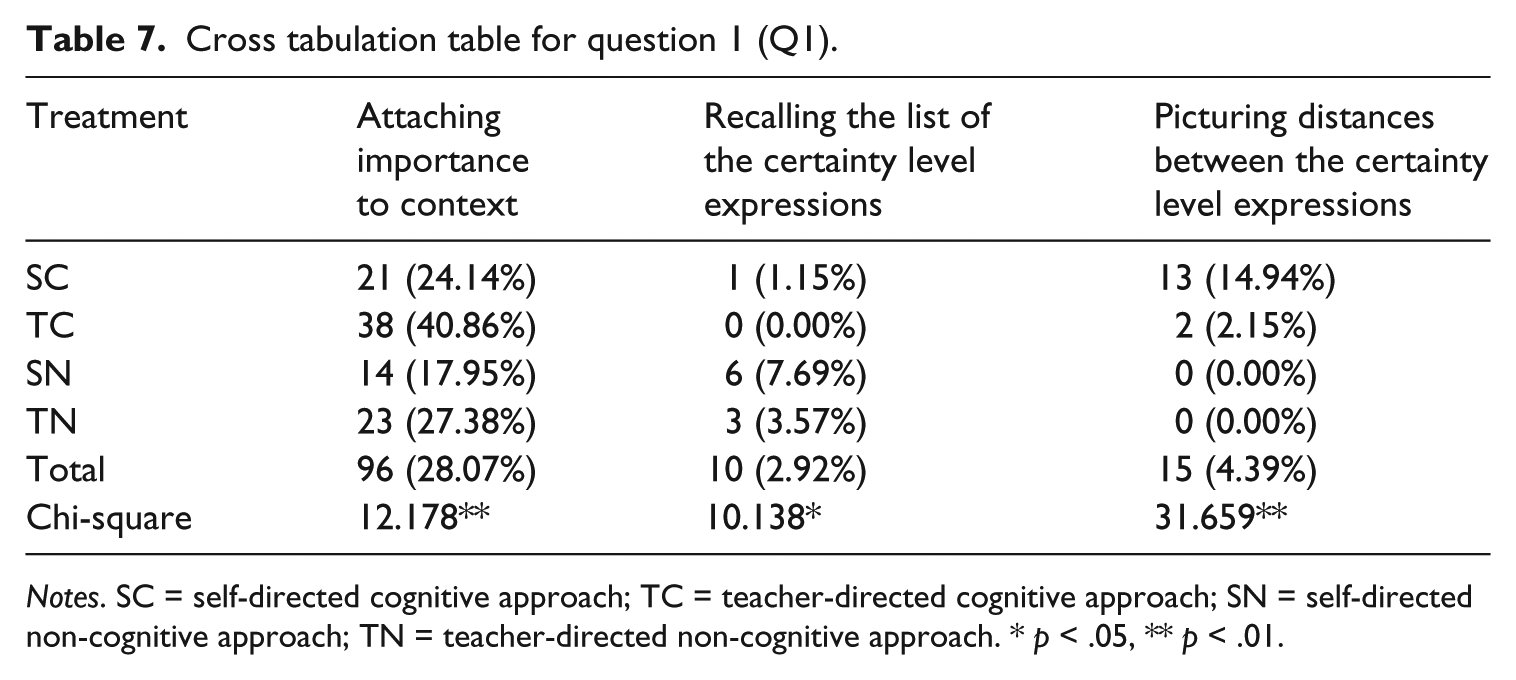
Notes. SC = self-directed cognitive approach; TC = teacher-directed cognitive approach; SN = self-directed non-cognitive approach; TN = teacher-directed non-cognitive approach. * p < .05, ** p < .01.
Question 2
Table 8 was generated and it shows the percentages of the total sums and the total number of responses coded into each category for Q2. The chi-squared statistic discloses significant differences in the first two categories of comprehending certainty levels in terms of distance promotes understanding and animation promotes understanding between the cognitive and non-cognitive approach groups. Although there were some participants from the cognitive approach groups who believed that animation promoted their understanding of the differences in three types of certainty level expressions, the result of the Ryan’s pairwise comparison indicates a significantly higher number of participants from the cognitive approach groups thought that comprehending the differences in three types of certainty level expressions, in terms of the different distances, promoted a deeper understanding of them (p < .05). In addition, it also indicates that only a few participants from the non-cognitive approach groups felt that the list was useful for memorizing the target boosters and hedges. Hence, it could be presumed that the self- and teacher-directed cognitive approach groups visualized the degrees of certainty in terms of the spatial concept of distances among the
Cross tabulation table for question 2 (Q2).
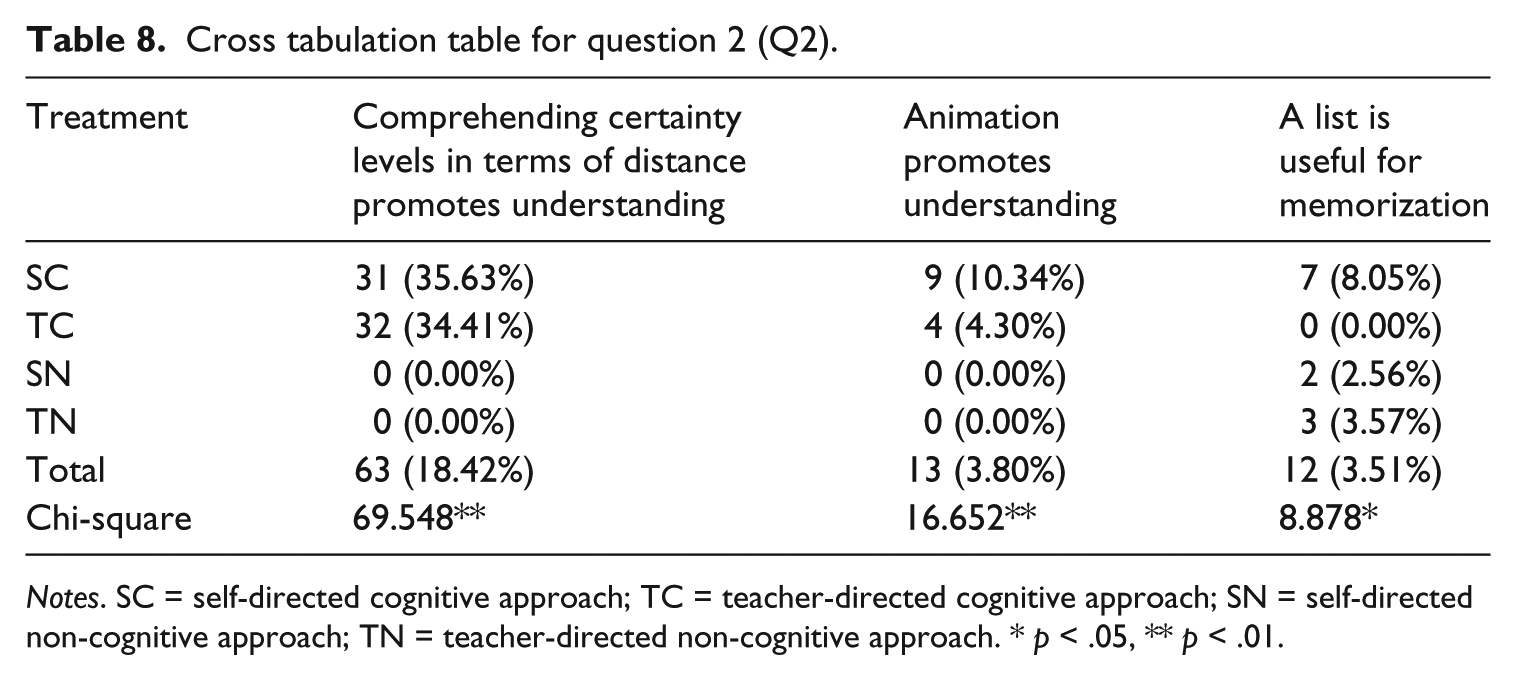
Notes. SC = self-directed cognitive approach; TC = teacher-directed cognitive approach; SN = self-directed non-cognitive approach; TN = teacher-directed non-cognitive approach. * p < .05, ** p < .01.
5 Results from interviews
The interviews were recorded and transcribed by the researcher. The 12 interview transcripts after post-test 2 and the 11 interview transcripts after post-test 3 yielded about 3,368 words of data; the length of each of the interviews was about 23 minutes for the interviews after post-test 2 and about 17 minutes for the interviews after post-test 3. Summary of responses to the interview questions are shown in Table 9.
Summary of responses to the interview questions.
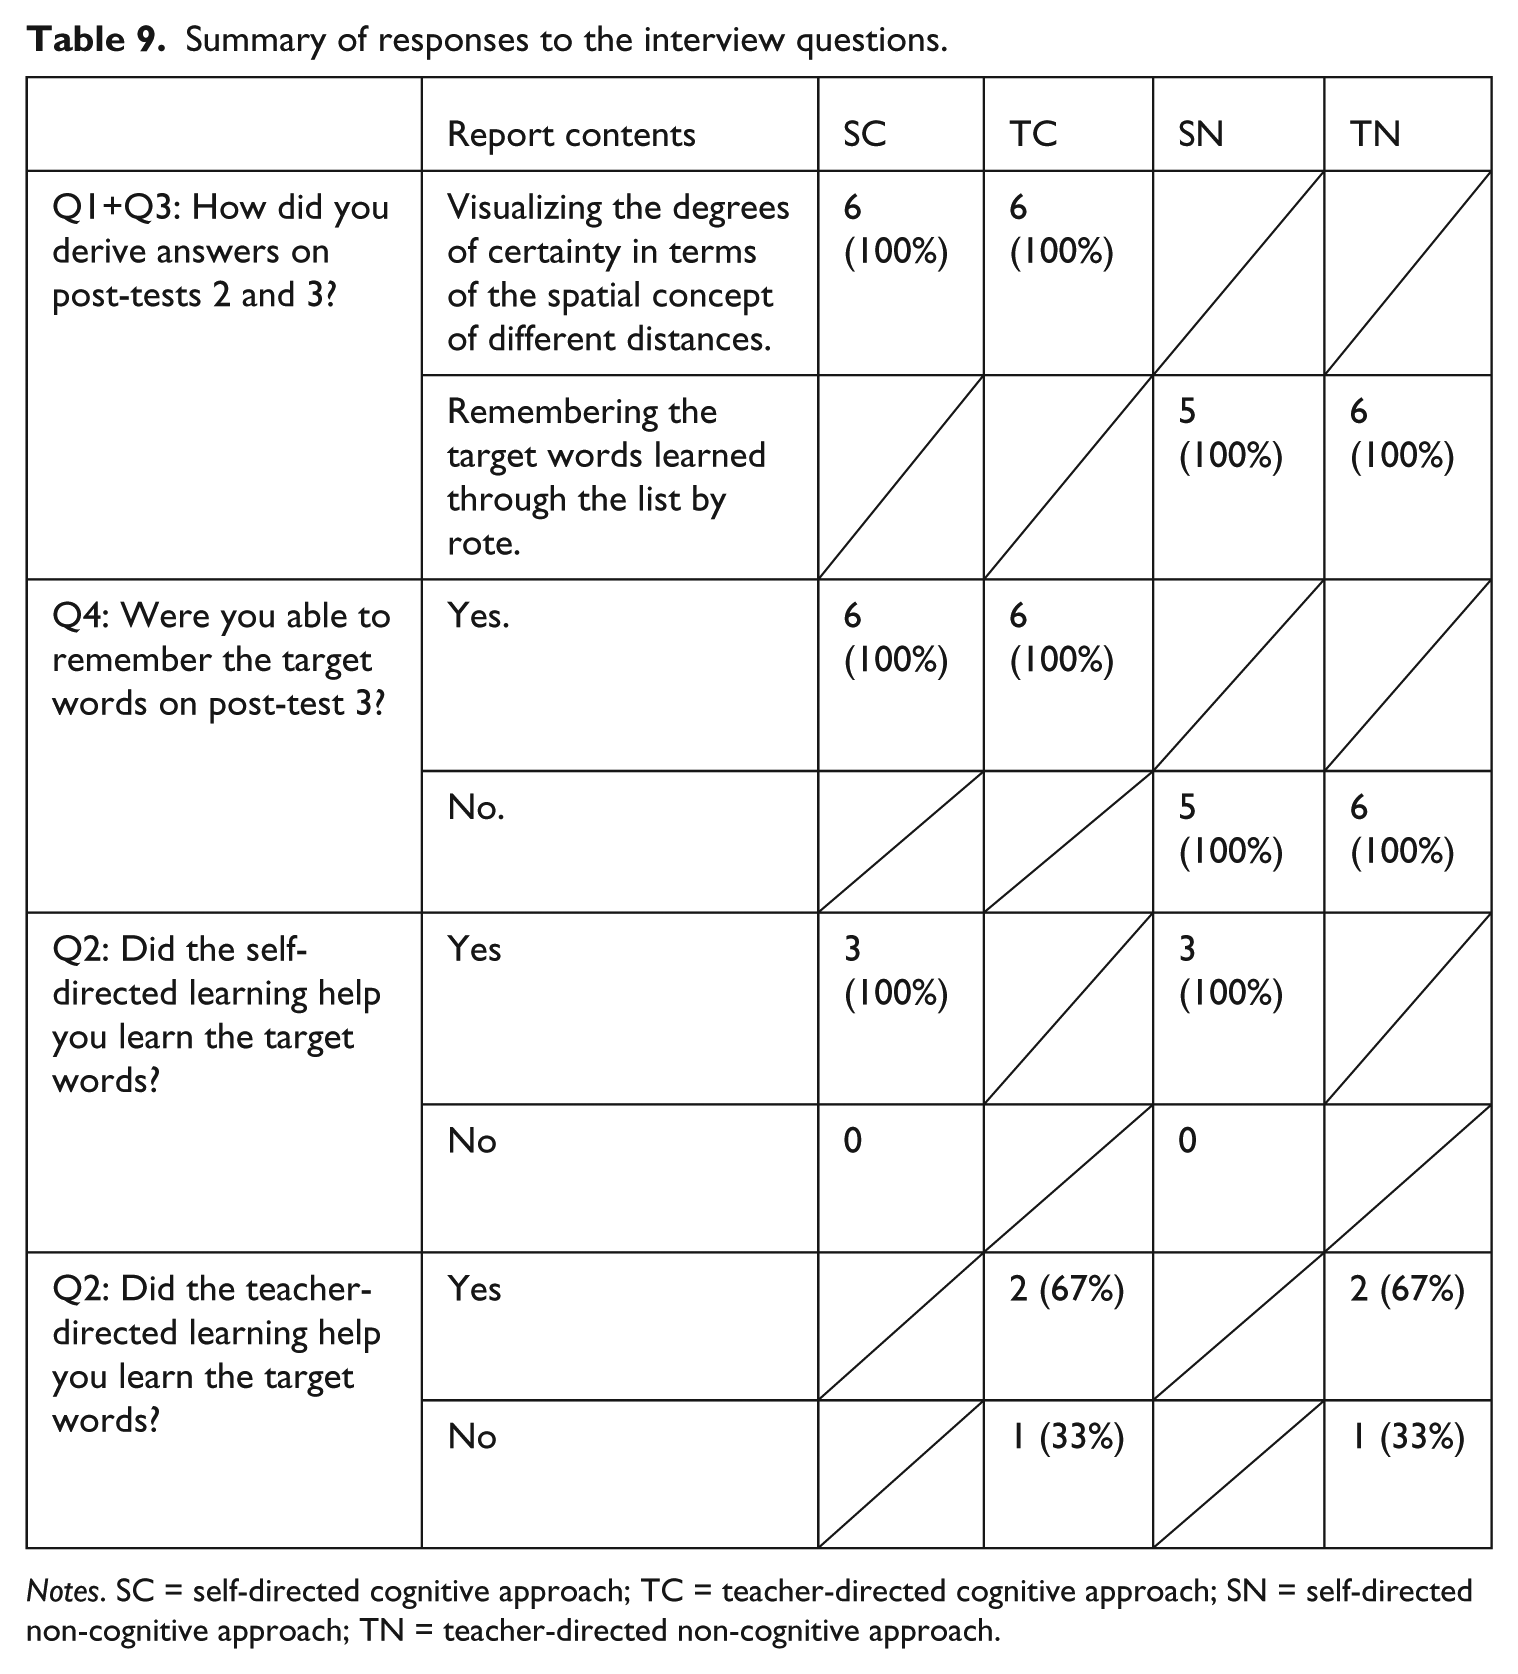
Notes. SC = self-directed cognitive approach; TC = teacher-directed cognitive approach; SN = self-directed non-cognitive approach; TN = teacher-directed non-cognitive approach.
All the participants in the cognitive groups said that they comprehended an abstract concept, the degrees of certainty, in terms of a spatial concept, the different distances, through visual images in the animation, which enabled them to derive answers easily and also led them to maintain their recollection of the concept because the visual images about the different distances remained in their brains, even four months after they first learned them. On the other hand, all the participants in the non-cognitive groups responded that they simply learned the target words on the list by rote and answered the questions, but they felt unable to learn the target words on the list by rote memory, which did not lead to long-term retention.
The participants from the SC and SN groups indicated that they were satisfied with the self-directed way of learning, but it was difficult to combine the participants’ answers from the TC and TN groups into one conclusion. Two students from the TC and TN groups argued that they preferred the self-directed way of learning to teacher-directed way of learning because they could do a lot more at their own pace using the online computer program in their own ways.
VI Discussion and conclusions
The results of the present study demonstrated that the metaphor awareness-raising approach group outperformed the non-cognitive approach and control groups in the writing, comparison, and categorization tests, and the self- and teacher-directed approach groups performed similarly within either the cognitive (the SC and TC) or the non-cognitive (the SN and TN) approach domains on the online computer program. These results revealed that the proximal–distal metaphor awareness-raising approach helps to remember expressions of certainty, thereby lending support to findings in previous studies (Berendi et al., 2008; Boers, 2000; Tyler et al., 2010, 2012) on the effects of the metaphor awareness-raising approach. All of the previous studies utilized metaphors embedded in target expressions or included in the concrete meanings of the target expressions. In the present study, the proximal–distal metaphors were not embedded in the target words, but were used as a mnemonic device. It proved effective and generated long-term memory encoding. Moreover, in consideration of the outcomes of the three tests, written retrospective evaluation questionnaires, and interviews, no participants relied on the image schema of
There are two possible factors behind the effectiveness of the metaphor awareness-raising approach. The first factor is associated with input enhancement. According to the results of the cross tabulation analysis and the interview analysis, the input the cognitive approach groups received from the 3D image content based on the proximal–distal metaphor made the target words more salient, which enabled the participants to structure the image schema of
The second factor may be the concept projection through which the participants understood an abstract concept, namely the degree of certainty in terms of the spatial concept of distance. As suggested in Table 8, although there were some participants from the cognitive approach groups who thought that the animation with the 3D image content promoted their understanding of the differences in the three types of certainty level expression, more participants believed that the proximal–distal metaphor awareness-raising approach, rather than the animation, enabled the participants to connect spatial visualized concepts with different degrees of sureness attached to the use of the
While the cognitive approaches based on the proximal–distal metaphor proved to be effective, the non-cognitive approaches with rote learning of the list did not. It seems that although the non-cognitive groups had multiple exposure to the target expressions in the acceptability judgment and listening tasks, the benefits of the usage-based approach did not compensate for the deficiencies of rote learning. Stengers, Boers, Housen, and Eyckmans (2010) argued that multiple exposure alone to samples of the second language (L2) target language is not enough in many EFL settings, and that instructional intervention that constructs form–meaning pairings needs to be added to usage-based tasks. Thus, instructional interventions like the metaphor-awareness raising approach should ideally be combined with usage-based activities in order to effectively learn abstract concepts.
The results also showed that the self-directed approaches were no less effective than the teacher-directed approaches on the online computer program, showing a partial support for the findings in previous studies (Gureckis & Markant, 2012; Markant & Gureckis, 2010; Voss et al., 2011).
In the present study, the difference between the self- and teacher-directed approaches on online computer program was that, while the self-directed learning allowed the participants to control their time spent on each scene, the teacher-directed learning gave the instructor full control over the time spent on each scene. However, this difference does not seem to have had a major impact on the overall performance of the self- and teacher-directed groups.
There are two closely related reasons that account for the similar performance of the participants in the self- and teacher-directed approaches. The first reason is associated with the information the participants received. The information the participant received through the self- and teacher-directed approaches in the cognitive and non-cognitive domains was the same, and even with the teacher-directed approach, the instructor used only the information available in the online computer program. Furthermore, the sequence of information presented in the online computer program was fixed and was the same for the self- and teacher-directed groups.
The second reason is related to the cognitive and non-cognitive strategies the participants in the self- and teacher-directed groups used to derive their answers. According to the results of the cross tabulation analysis and the interview analysis, the strategies they took were the same, which probably resulted from the content and the volume of information that the two approaches had in common. The self- and teacher-directed cognitive groups visualized the degrees of certainty in terms of distances among the
Regarding the limitations of this study, they are the high dropout rate of participants and unequal number of participants in each group. The present study started with 172 participants, excluding those who were absent or late for the scheduled experiments. However, in the end, we were left with 139 participants and an unequal distribution of participants in each group, which might have affected the assumption of homogeneity of variances.
To extend the current findings, deeper insights can be gained from future studies that examine the effects of the proximal–distal metaphor awareness-raising approach on teaching other abstract concepts. In addition, further analysis of the self-directed approach would be beneficial to develop learning methods that are suitable for the era of information technology.
In conclusion, the author hopes that the findings of the present study will offer some suggestions to researchers and teachers for productive approaches of teaching abstract concepts in an EFL context.
Footnotes
Acknowledgements
The author would like to express his deepest gratitude to his supervisor, Professor Toshio Ohori at The University of Tokyo, for the continuous support and invaluable comments during the development of this study.
Funding
The author disclosed receipt of the following financial support for the research, authorship, and/or publication of this article: This work was supported by Grant-in-Aid for Scientific Research 26370632.