
Abstract
This study examined the effects of watching gestures and lip movement on second language (English) listening comprehension. The participants were 30 high and 22 low proficient learners of English. There were six listening tasks combining two variables: modality and difficulty. The modality consisted of three types of assessments: Body (the upper half of body was visible), Face (close up view), and Audio. The difficulty consisted of two levels: Easy and Hard. Learners watched Body, Face, or listened to Audio, and worked on six comprehension questions twice for each task. Moreover, the participants were asked about their modality of preference. The notable results were (1) the modality of listening had no influence on their listening performance, (2) for the high proficiency group, the score difference between the easy and the hard texts was larger at the second attempt than at the first attempt, (3) the participants generally preferred to watch the whole body, followed by watching the face, and then listening only, (4) the high proficiency group showed more variations of preference than the low proficiency group, and (5) the participants’ modality preference had no influence on their listening performance.
Keywords
I Introduction
Communication entails both verbal production and nonverbal cues. Considering they occur mostly in tandem when we communicate orally, the effects of nonverbal behaviors, and gestures inter alia, toward comprehending speech have been extensively examined. The research has been primarily focused on first language (L1); however, we have been witnessing a growing number of scholars interested in the effects of nonverbal cues on second language (L2) listening comprehension (e.g. Rohrer, Delais-Roussarie & Prieto, 2020). L2 listeners are expected to rely on nonverbal cues more than L1 listeners because their language processing is less dependent on the automaticity that is afforded to L1 listeners (Nakatsukasa & Loewen, 2017). However, it should be noted that the degree of reliance on speakers’ nonverbal behaviors is not expected to be uniform but influenced by various factors including the proficiency of the L2 listeners (e.g. Sueyoshi & Hardison, 2005).
There are various kinds of nonverbal cues that listeners can utilize when decoding speech, but when we consider students in the classroom, the main locus of their attention is teachers, especially regarding the attention they afford to teachers’ gestures and faces, including lip movements (Kamiya, 2018, 2019). While a host of studies exist in which the effects of gesture and face were separately investigated among L2 learners (Hamdan & Al-Hawamdeh, 2018), there is a paucity of research comparing them in a single study, and even fewer incorporating proficiency as an additional variable, a gap that the present research addresses.
II Literature review
A number of experimental studies have attested to the improvement of L2 listening comprehension when materials are presented via video (i.e. nonverbal cues are visible) (Baltova, 1994; Dahl & Ludvigsen, 2014; Parry & Meredith, 1984; Shin, 1998; Sueyoshi & Hardison, 2005; Wagner, 2010a, 2013) even for participants who had obtained very little or no L2 proficiency (Church, Ayman-Nolley & Mahootian, 2004; Gullberg, Roberts & Dimroth, 2012). However, past studies also report that the role that nonverbal behaviors play in listening tasks is not uniformly positive; rather, the findings indicate that they may not exert any effects on listening comprehension at all (Batty, 2015; Coniam, 2001; Cubilo & Winke, 2013; Gruba, 1993; Gullberg et al., 2012; Londe, 2009). Furthermore, research has shown that the watching videos may even deteriorate listeners’ comprehension (Coniam, 2001; Ockey, 2007; Pusey & Lenz, 2014; Suvorov, 2009). Even in a single study, the effects of nonverbal behaviors on students’ learning have produced mixed results (Batty, 2018; Brett, 1997; Faraco & Kida, 2008; Gullberg et al., 2010, 2012; Sueyoshi & Hardison, 2005). Such confounding results can be potentially ascribed to four variables: types of gestures performed by speakers, visibility of their faces (i.e. lip movements), participants’ L2 proficiency, and text difficulty.
1 Effects of iconic and metaphoric gestures in L2 learning
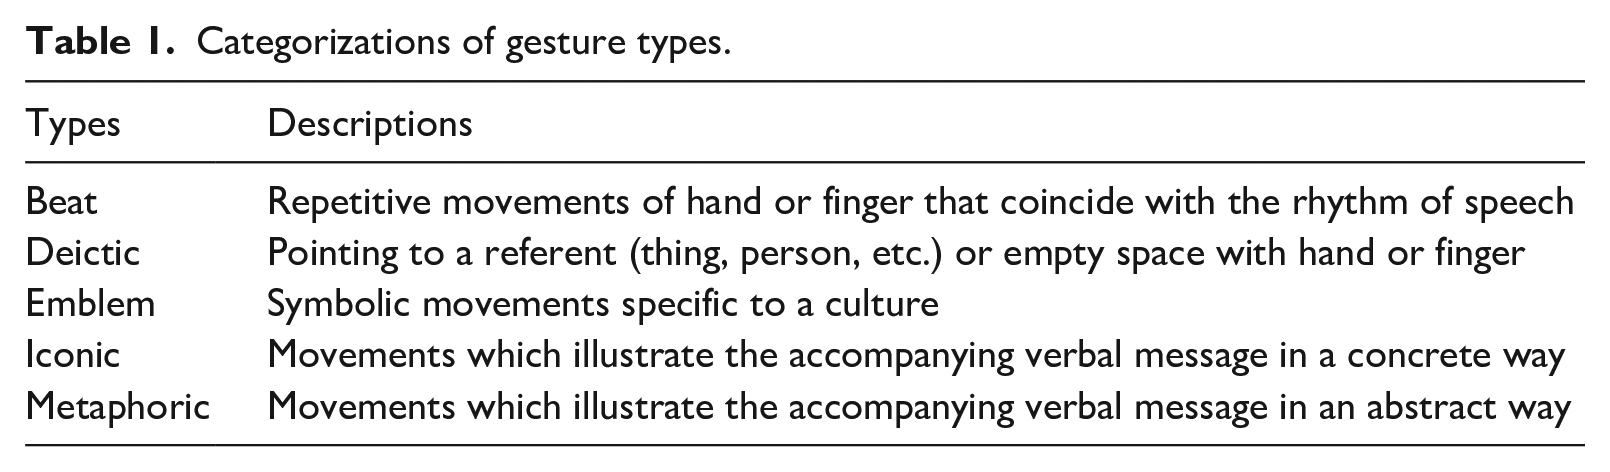
Regarding gesture types, one of the ways to categorize gestures is to classify them based on the shape and motion of the hands and arms because gestures are ‘movements of arms and hands [that] are closely synchronized with the flow of speech’ (McNeill, 1992, p. 1). Among several ways to classify gestures, the one by McNeill (1992) together with emblem is the most widely applied in the field of language learning (Table 1).
Categorizations of gesture types.
In the current study, metaphoric gestures occupied the largest portion of all gestures, followed by iconic gestures. This concurs with Sueyoshi and Hardison (2005) who found that these two types of gestures comprised 23% and 31%, respectively. In light of this, only iconic and metaphoric gestures in L2 learning will be discussed forthwith. Also, because participants in this study did not perform gestures, the following discussion includes only those studies in which participants watched gestures without performing them.
Iconic gestures represent the concrete notion of the accompanying utterances. Because of their direct embodiment of the referent, it seems legitimate to assume that their beneficial effects are granted. For example, Lin (2021) showed that listening to stories with iconic gestures facilitated their recall when compared to beat gestures or no gestures. Kelly, McDevitt and Esch (2009) as well as Levantinou and Navarretta (2015) found that iconic gestures facilitated vocabulary learning of Japanese and of English, respectively. However, their effects were also mediated by other variables. Kelly and Lee (2012) found that iconic gestures assisted learning Japanese words but only when the phonetic demands of the target words were low. This echoes the findings in Hoetjes and van Maastricht (2020), who found that iconic gestures facilitated the production of an easy Spanish phoneme but hindered a difficult one. In addition, Rowe, Silverman and Mullan (2013) explored the effect of vocabulary learning of an artificial language, and the results were found to be affected by learners’ characteristics in the short term. However, over the long term (a week), iconic gestures had no influence on the results.
Perhaps due to their abstract nature, several studies have found metaphoric gestures to be ineffective for L2 learning. The point-back gesture in Nakatsukasa (2021) did not facilitate learning the past tense in English. Moreover, Hirata and Kelly (2010) found gestures that metaphorically represented the length of vowel exerted no influence on learning Japanese phonemic vowel length. However, the effects of metaphoric gestures are not uniformly ineffective, and some studies demonstrated mixed findings. For instance, another study conducted by Kelly et al. (Kelly, Bailey & Hirata, 2017) found observing metaphoric gesturing to be effective for learning Japanese intonation, but ineffective for perceiving vowel length. In Xi et al. (2020), while the presence of metaphoric gestures did not affect the perception of newly-learned Mandarin Chinese consonants, gestures facilitated their production but only when the gesture mimicked the feature of the target sound. Positive effects have also been reported from several other studies as well. Hannah et al. (2017) found that metaphoric gesturing helped learners to accurately perceive Mandarin tones in background noise. Baills et al. (2019) also found beneficial effects for identifying tones and vocabulary learning in Mandarin Chinese. Finally, in Yuan et al. (2018), metaphoric gestures promoted learning Spanish intonation patterns.
Two things are noteworthy from the above discussion. First, although scholars have investigated how iconic and metaphoric gestures contribute to L2 acquisition, the results thus far are far from being conclusive. This indicates that the effects of gestures are dependent upon not only the types being examined but also other variables, such as task types and learning domains (e.g. vocabulary vs. pronunciation). Second, the majority of the target features of those studies have been aimed at the learning of vocabulary and pronunciation, and none investigated listening comprehension. This is partly because it is unfeasible or unnatural to single out a type of gesture to be performed in normal speech. Therefore, it is unknown to what extent the results of these studies are applicable to the case of listening comprehension. Nevertheless, it is possible to analyse the profile of gestures performed retrospectively and examine their effects; however, up to this point in time, it seems that only Sueyoshi and Hardison (2005) have examined the percentage of each gesture type used, and even in their study, how each gesture contributed to answering each question was not explored.
2 Role of gesture, lip movements, proficiency, and text difficulty in L2 listening comprehension
When we watch videos, not only speakers’ gestures but also their faces are visible. In spite of this, there have been few studies examining the effects of watching gestures and faces on L2 listening comprehension in a single experiment. As one of the pioneering studies, Sueyoshi and Hardison (2005) recruited 42 learners of English as a second language (ESL), who were divided into two proficiency levels (high, low) and three conditions (Gesture & Face, Face, Audio). The researchers had the learners watch a video-taped lecture on pottery making. In the Gesture & Face condition, participants were able to watch the teacher’s hand and arm movements as well as her face albeit remotely. Increased distance from faces deteriorates the effects of lip reading for identifying words that are difficult to comprehend (Zheng & Samuel, 2018). As such it is unlikely that the participants in the Gesture & Face group could reap as much benefit as those in the Face condition, in which participants could see the teacher’s face up close, especially her lip movements. In the Audio condition, no visual information was provided. The results indicate that, regardless of proficiency levels, participants scored the lowest in the Audio condition, indicating the positive role of visual cues. The difference between the two proficiency levels was found between the Gesture & Face and Face conditions. Whereas the low proficiency group scored the highest in the Gesture & Face condition, the high proficiency group scored the highest in the Face only condition. These seemingly contradictory results make sense if we consider the functions of gestures and face. Since gestures can represent semantic aspects of vocabulary, they help learners guess the meaning of unfamiliar words. On the other hand, although lip movements can help learners identify words that they cannot recognize only via audio, they do not facilitate inferring the meanings of unfamiliar words. Hence, while the high proficiency group was able to utilize the nonverbal information derived from lip movements with their larger repertoire of vocabulary, the low proficiency group failed to do so due to their lack of vocabulary.
A similar study was conducted more recently by Dahl and Ludvigsen (2014). Instead of learners of two different levels, they compared native-speaking children to non-native-speaking children of English. The seventh and eighth graders watched a video in which a speaker explained cartoon images in English under two conditions: Gesture & Face and Face (there was no audio-only group), and were subsequently told to draw its picture. The results show that the presence or absence of gestures did not affect the results of the native-speaking children. In contrast, non-native-speaking children performed significantly better in the Gesture & Face condition than in the Face condition, and the former score was comparable to that of native-speaking children.
As a final point here, it should not be forgotten that the effects of proficiency can be discussed only in relation to the difficulty of the text that listeners are trying to decode. For instance, if the auditory information is easy enough for comprehension, nonverbal cues may not be necessary. This was evident in the studies that demonstrated null effects of watching nonverbal cues among native speakers (Dahl & Ludvigsen, 2014; Rohrer et al., 2020). In contrast, nonverbal cues may boost understanding of hard texts as they supplement incomprehensible messages (Stam & McCafferty, 2008); yet a double-edged sword is that studies have also shown that increased verbal processing yields come at the expense of the processing of nonverbal cues (Drijvers & Ozyurek, 2018, 2019; Drijvers, Vaitonyte & Ozyurek, 2019; Hirata & Kelly, 2010; Rohrer et al., 2020), and L2 listeners may be adept at consciously restricting their attentional resources to one modality in such a situation (Cross, 2011). As no studies to date have verified these notions, this study used texts of two different levels to examine their interactional effects.
3 Limitations of past studies and unique features of this study
Reviewing past studies that showed the preponderance of visual modality on listening comprehension, we find that they consistently adopted the between-participant design (Baltova, 1994; Church et al., 2004; Dahl & Ludvigsen, 2014; Parry & Meredith, 1984; Shin, 1998; Sueyoshi & Hardison, 2005; Wagner, 2010a, 2013). This means that the participants were divided into groups and participated in either one of the conditions (e.g. audio vs. visual).
It is critical to understand that the effects of nonverbal cues are not uniform, and individual differences may influence how learners process visual input. Therefore, in order to examine what effects visual cues exert on listening comprehension while controlling individual differences, the study must adopt the within-participant design in which each learner participates in every condition for comparison. Notably, to our knowledge, there are no studies having used such a cross-balanced approach that show a consistent facilitative role of watching nonverbal behaviors on listening comprehension; all of them confirmed the null (Batty, 2015; Cubilo & Winke, 2013), had negative (Rohrer et al., 2020; Suvorov, 2009) or mixed (Batty, 2018; Brett, 1997; Gullberg et al., 2010, 2012) results.
Considering this point, this study adopted the within-participant design; however, this makes it logistically complex to prepare materials. This is due to the difficulty of making all the scripts equivalent; otherwise, the study would be incapable of discerning to which factor the differences in scores can be ascribed: to the experimental conditions or to the text difficulty. Therefore, we took careful measures to control the difficulty of texts in this study.
Another distinctive feature of this study is that we recruited two groups of learners for investigating the effects of learner proficiency. In past studies that compared multiple groups, although L2 proficiency was controlled, the sensitivity to nonverbal cues that differs for each participant was not (e.g. Kamiya, 2019). Therefore, the possible effects of the idiosyncratic sensitivities of each participant could not be excluded. In order to address this issue, this study quantitatively measured participants’ sensitivity to nonverbal behaviors. By comparing mean scores, those measurements can be utilized for examining comparability of interpersonal sensitivity between groups. Only when the equivalency is guaranteed, can the effects be ascribed to the accompanying conditions if listening scores differ among the groups.
Finally, this study incorporates another variable in its design. We provided the participants two opportunities to listen to the same text and to answer the same questions. When learners listen to texts, they are engaged in two types of processing: perceptual and conceptual processing. Perceptual processing refers to bottom-up, word-level processing for decoding the details of the text whereas conceptual processing refers to top-down, global level processing for comprehending the overall gist of the text (Field, 2015). While learners are adept at processing simultaneously on multiple levels (e.g. McQueen, 2007), by presenting comprehension question items only after the first attempt of listening, a task can be devised in a way to induce one or the other processing type as being more dominant because the type of processing is influenced by the purpose of listening (Vandergrift, 2013). Precisely speaking, in the first attempt, processing should be primarily conceptual because participants are incapable of anticipating what information should be kept in mind for answering any forthcoming questions. In contrast, in the second attempt, the processing should be primarily perceptual since participants are seeking specific lexical cues useful for answering the questions (Field, 2015). Studies on nonverbal behaviors and L2 listening have not incorporated this strategy previously. Not surprisingly, in general, when learners listen to the same text twice, their scores naturally rise (e.g. Ruhm et al., 2016). However, if the gain in scores from the first attempt (conceptual processing) to the second attempt (perceptual processing) are proportionally dissimilar across different conditions, the nonverbal cues in each condition should be contributing to the comprehension of the text in distinct ways.
4 Learner preference for listening modalities
Another factor that can potentially influence the effects of material modality on listening comprehension is learner preference. Past studies that investigated learner perception on listening materials indicate that, although they generally preferred video over audio, some studies reported cases where participants felt that watching videos did not always lead to higher scores (Baltova, 1994; Cubilo & Winke, 2013; Dunkel, 1991; Parry & Meredith, 1984; Progosh, 1996; Sueyoshi & Hardison, 2005; Wagner, 2010b). Suvorov (2009), more importantly, examined the relationship between participants’ preferences and test scores. The results show that those who preferred audio scored higher for audio materials than video materials; however, participants who preferred other formats (video and photographs) did not exhibit any superiority in the conditions of their preferences. To our knowledge, this is the first to examine whether and how learners’ perception influences their listening performance; due to paucity of research in this vein, this issue is worth pursuing further.
III Research questions
In summary, this study was guided to address the following research questions.
How are the following variables affecting the test scores of listening comprehension questions?
(a) Difficulty of materials (Easy, Hard) (b) Modality of materials (Body, Face, Audio) (c) Attempts of listening (First, Second) (d) Learner proficiency (High, Low)
Which modality of listening do participants prefer and why? Are there any differences between high and low proficiency groups? Is there any relationship between their modality preferences and listening comprehension test scores?
IV Methods
1 Participants
The recruited participants are categorized into two groups, all between the ages of 18 and 29. The high proficiency group (n = 30; 1 male, 29 females; mean age = 21.0, SD = 2.1) consisted of 28 university students majoring in English literature or international communication and two learners who recently graduated from university who majored in either of these. Based upon the listening score of an English proficiency test that that they took previously, they all possessed B2 or C1 levels in accordance to the Common European Framework of Reference for Languages (CEFR; Council of Europe, 2001).
The low proficiency group (n = 22; 6 males, 16 females; mean age = 21.2, SD = 2.3) consisted of eight university students majoring in various subjects and 14 learners who recently graduated from high school or university. Based on the listening score of an English proficiency test that they took previously, their CEFR levels were categorized as either A1 or A2 levels.
2 Materials
a Creating scripts and questions for listening tasks
In this study, two variables were considered when creating texts to be used for the listening experiments. First, the participants worked on the listening materials under three different conditions: Body (audio + face + gesture), Face (audio + face), and Audio. Second, the texts were categorized into two groups according to their levels of difficulty: easy and hard groups. In total, six (three modalities * two difficulties) texts and accompanying questions were prepared. For those six texts, the following conditions had to be met in order to secure the validity to use these materials for answering the research questions.
(a) The three texts in the easy group must be easier than those three in the hard group.
(b) The difficulty of texts in each of the two groups must not be significantly different from one another.
(c) The difficulty of questions in each of the two groups must not be significantly different from one another.
For selecting the listening scripts, the listening and reading materials on the webpage of British Council: Learning English (British Council, n.d.) were examined (n = 71). Among those, only monologued explanatory texts (n = 34) were kept for further analysis, excluding other types of text, such as conversations, letters, SNS (Social Networking Service) postings, and fill-in-the blanks.
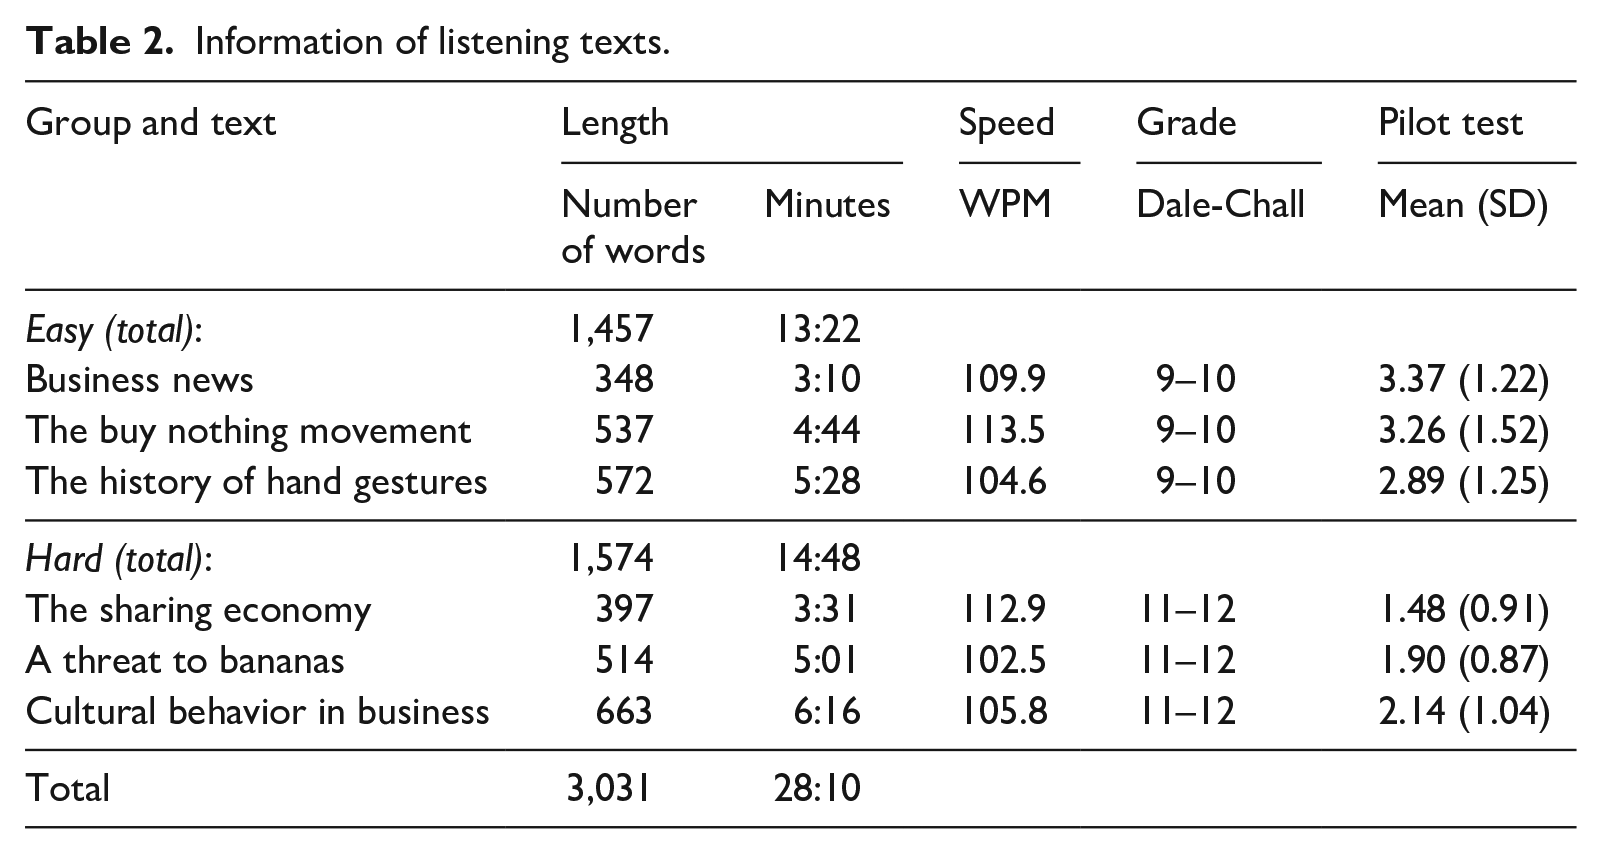
The difficulty of the remaining 34 texts were measured by the New Dale-Chall Readability Formula (Chall & Dale, 1995), which categorized the texts into four groups of different levels (for its validation, see Benjamin, 2012). Among them, the two highest levels (Grades 9–10 and 11–12) were retained for the final selection because of the high English proficiency of the participants in the advanced group. The length of talks varied in each group, but the length of each pair of texts was controlled to be similar across the two groups, each containing a talk of around three, five, and six minutes. Strictly controlling the length to be identical would alter the difficulty of talks; thus, such practice was not conducted.
The next step was to create comprehension questions whose difficulty were considered to be equal. To begin with, this study adopted the multiple-choice format with four choices for the following three reasons: (a) this is the format adopted in Sueyoshi and Hardison (2005), (b) Chang (2005) found that the gap in the score between high and low proficient learners was wider in multiple-choice questions than in short-answer questions, and (c) time-efficiency was prioritized due to the fact that participants worked on six listening tasks. Also, all of the questions and the choices were written in the native language of the participants, Japanese, so that they would have no difficulty comprehending them, a concern raised in some past studies (e.g. Chang & Read, 2006). Then, referring to the guidelines for creating test items (Brown, 2005), the researcher created six questions in many cases based upon the questions originally attached to the texts on the British Council webpage. All of items were answerable based on audio only. In order to validate the equality of the difficulty of the questions, two groups of university students (n = 19, 21) majoring in economics placed in the upper-intermediate level based on the scores of the English test that they had taken for matriculation took the three listening tests (audio only) in each level, respectively. The results are shown in Table 2 (see the Pilot test column). Repeated-measures ANOVAs indicate that the difficulty of the questions was not significantly different from one another in the easy text group (F(2, 36) = .679, p = .513, ηp2 = .036) or the hard text group (F(2, 40) = 2.531, p = .092, ηp2 = .112). Accumulating the scores of each level, an independent samples t-test showed that the scores of the easy texts were significantly higher than those of the hard texts (t(101.117) = 6.082, p < .001, d = 1.129). These results indicate that (a) the difficulty of the three texts and the accompanying questions in each level is statistically homogenous, and (b) the three texts and the accompanying questions in the hard group are significantly more difficult than those in the easy group.
Information of listening texts.
b Creating video and audio files of listening tasks
The final step was to create the video and audio files of those listening scripts. An English native speaker from South Africa in his 30s was invited to take part for this step. He was instructed to pretend to talk to the students of low proficiency in the authentic classroom in the way to enhance their comprehension as much as possible, using gestures. For securing ecological validity, neither the frequency nor the type of gesture to be performed was prescribed. Since the scripts were quite long, it was impractical for him to memorize them. Although it was possible for him to improvise the speech, keeping in mind its gist, this would likely alter its difficulty. Therefore, each text was projected on the screen in front of him, and he was able to refer to it whenever he needed. During his performance, two video cameras set up around 30 degrees from his front captured him: one focusing on his face (for Face) while the other focusing on the upper half of his body (for Body). Although it would have been ideal to set up cameras directly in front of him so that he could face them, this would have blocked his sight of the script, so it was not feasible. Also, performers are more likely to produce natural gestures when facing a real audience (e.g. Cubilo & Winke, 2013); however, inviting students was unfeasible due to the restriction imposed from the university where the video was shot due to Covid-19 pandemic. The audio files were created by extracting the audio data from one of the videos (for Audio). The screenshots of Body and Face are shown in Figures 1 and 2.
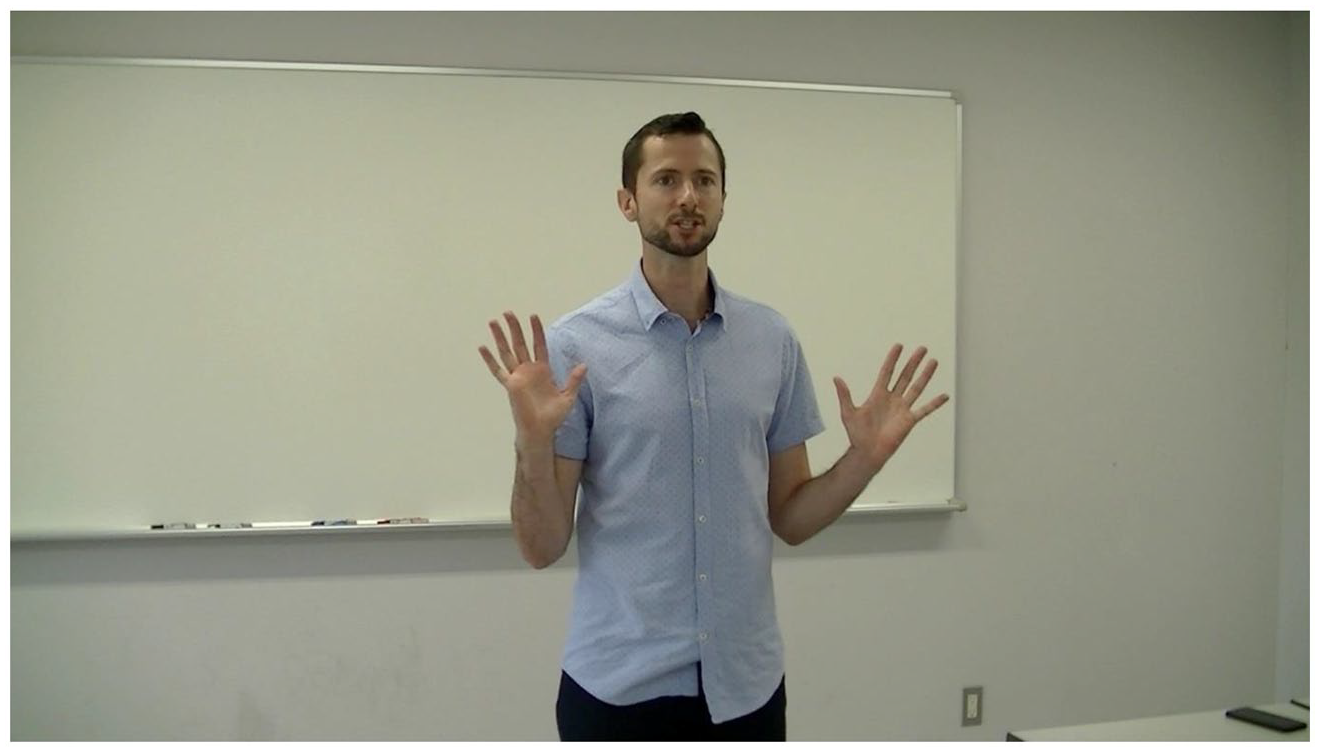
Screenshot of body.

Screenshot of face.
c PONS test
As a way to ensure that the participants in the two proficiency groups would not differ in respect to their interpersonal sensitivity to nonverbal behaviors, the Profile of Nonverbal Sensitivity (PONS test) was employed. This test was introduced by Rosenthal et al. (1978, 2013), and has been widely administered for measuring nonverbal decoding ability (Knapp, Hall & Horgan, 2014). Its full version consists of 220 items, each of which is a short video clip portrayed by a woman. Watching each scene, participants are to make a dichotomous choice on its enacted description. Because its manual disallows its use for individual assessment or diagnosis, it cannot be used for exploring individual differences. Instead, it was utilized to confirm that there would be no significant difference in the interpersonal sensitivity between the high and low proficiency groups. Due to the restrictions on time, this study adopted a shorter form of the PONS test, which is entitled Face and Body PONS. This test consists of 40 items selected exclusively projecting face and body without accompanying sounds.
3 Procedure
The messages soliciting participation were distributed through emails and SNS. Those who were interested in participation voluntarily contacted the researcher. Due to the university prohibition against face-to-face meetings owing to the pandemic, the data were individually collected via Zoom. Participants used either computers, tablets, or smartphones. Checks were made to assure that those who used smartphones (n = 2) would have no difficulty in watching the movements of the teachers in videos. Although it would have been ideal to turn the video camera on to observe the participants’ performance, a decision was made not to do so for two reasons: (a) lightening the data traffic was prioritized for the sake of stable interaction, and (b) some of the participants expressed concern about showing their faces. The whole procedure took around 1.5 hours. A book coupon with a worth of around US$28 was given as compensation to each participant.
Regarding the condition of the three modalities of the scripts (Body, Face, Audio), they were Latin squared for each level, which produced six conditions for easy and hard texts each. Multiplying them, there were 36 conditions in total. After checking background information collected prior to data collection, each participant was randomly assigned to one of these 36 conditions, and worked on the corresponding six listening tasks. The order of the six scripts was randomized for each participant. In order for the participants to focus on the script, the questions were hidden while listening to them because visibility of questions is known to distract attention from video materials (Wagner, 2007, 2010b). To keep their attention focused on the video in the Body and Face conditions, participants were not allowed to take notes. For equalizing the conditions, note taking was disallowed in Audio as well.
For Body and Face, each participant was instructed to focus on the video. For Audio, they were allowed to close their eyes. After watching the video or listening to the audio, the first question was displayed on the screen, and the participant was told to orally give the answer. Then, the next question was displayed. After all of the six questions had been asked, the questions were hidden again, and the participant either watched the same video or listened to the same audio a second time. Then, each question was displayed in turn again. They were allowed to change their answers from the first to the second attempt. After three listening tasks, the participants took a break if they so wished. After all of the listening tasks were done, the researcher asked the participant the order of her/his preference among the three conditions (Body, Face, Audio) along with their reasons.
Finally, the participant worked on PONS. The participant projected both the video and the questions on the same screen. While watching the video, they orally gave the answer to each item.
4 Analysis
In order to probe what gestures were performed in the video clips that the participants watched, the types and frequencies of gestures were identified using the categorizations of McNeill (1992) (Table 1). Following the suggestion by McNeill (2005), up to two kinds were assigned to a single token of gesture. For instance, when the speaker repeatedly flicks his hand synchronized with the rhythm of the stresses of the words that he utters while protruding the thumb up, both beat and emblem were coded. An undergraduate research assistant specializing in second language acquisition and the researcher collaboratively worked on coding, and we reached full agreement regarding the identification of gestures and the categorizations of their types.
Also, because the types and frequencies of gestures were not controlled in the video clips, gestures that were performed along with those sentences crucial to answering the questions were analysed to examine whether and in what way those gestures contributed to answering the comprehension questions.
In order to probe whether the accuracies significantly differed, repeated-measures ANOVAs were conducted. Since all of the test items were comprised of multiple-choice questions, it was coded dichotomously, correct or incorrect, and its aggregated score and also the score increase from the first to second attempts for each text was the dependent variables. The assumptions for running parametric tests were confirmed using P-P plots (for normality), the scatterplots of the values of the residuals against the values of the outcome predicted by the model (for linearity), and Mauchly’s tests (for sphericity; p > .211).
The reasons for the participants’ modality preference were transcribed by the author, on which content analysis was conducted to find what notions were stated by how many participants. In order to examine the relationship between their preferred modality and listening performance, partially referring to Suvorov (2009), the following procedure was adopted.
(a) Exclude the data of a participant who stated that there was no preferred modality (n = 1).
(b) Extract the scores of the modality that each participant preferred the most (First choice), the second (Second choice), and the least (Third choice).
(c) Calculate the mean of scores in cases when two modalities were preferred equally (n = 3).
(d) Run a repeated-measures ANOVA between First choice, Second choice, and Third choice.
V Results
1 Descriptive statistics and preliminary analyses
Table 3 shows the descriptive statistics. Before moving on to answering research questions, the following analyses were conducted: (a) making sure that there are significant differences in test scores between the high and low proficiency groups, (b) making sure that there are no significant differences in PONS between the high and low proficiency groups, (c) examining the types and frequencies of gestures performed in the video clips, and (d) examining how gestures contribute to finding the answers to the comprehension questions.
Results of listening tasks and PONS.
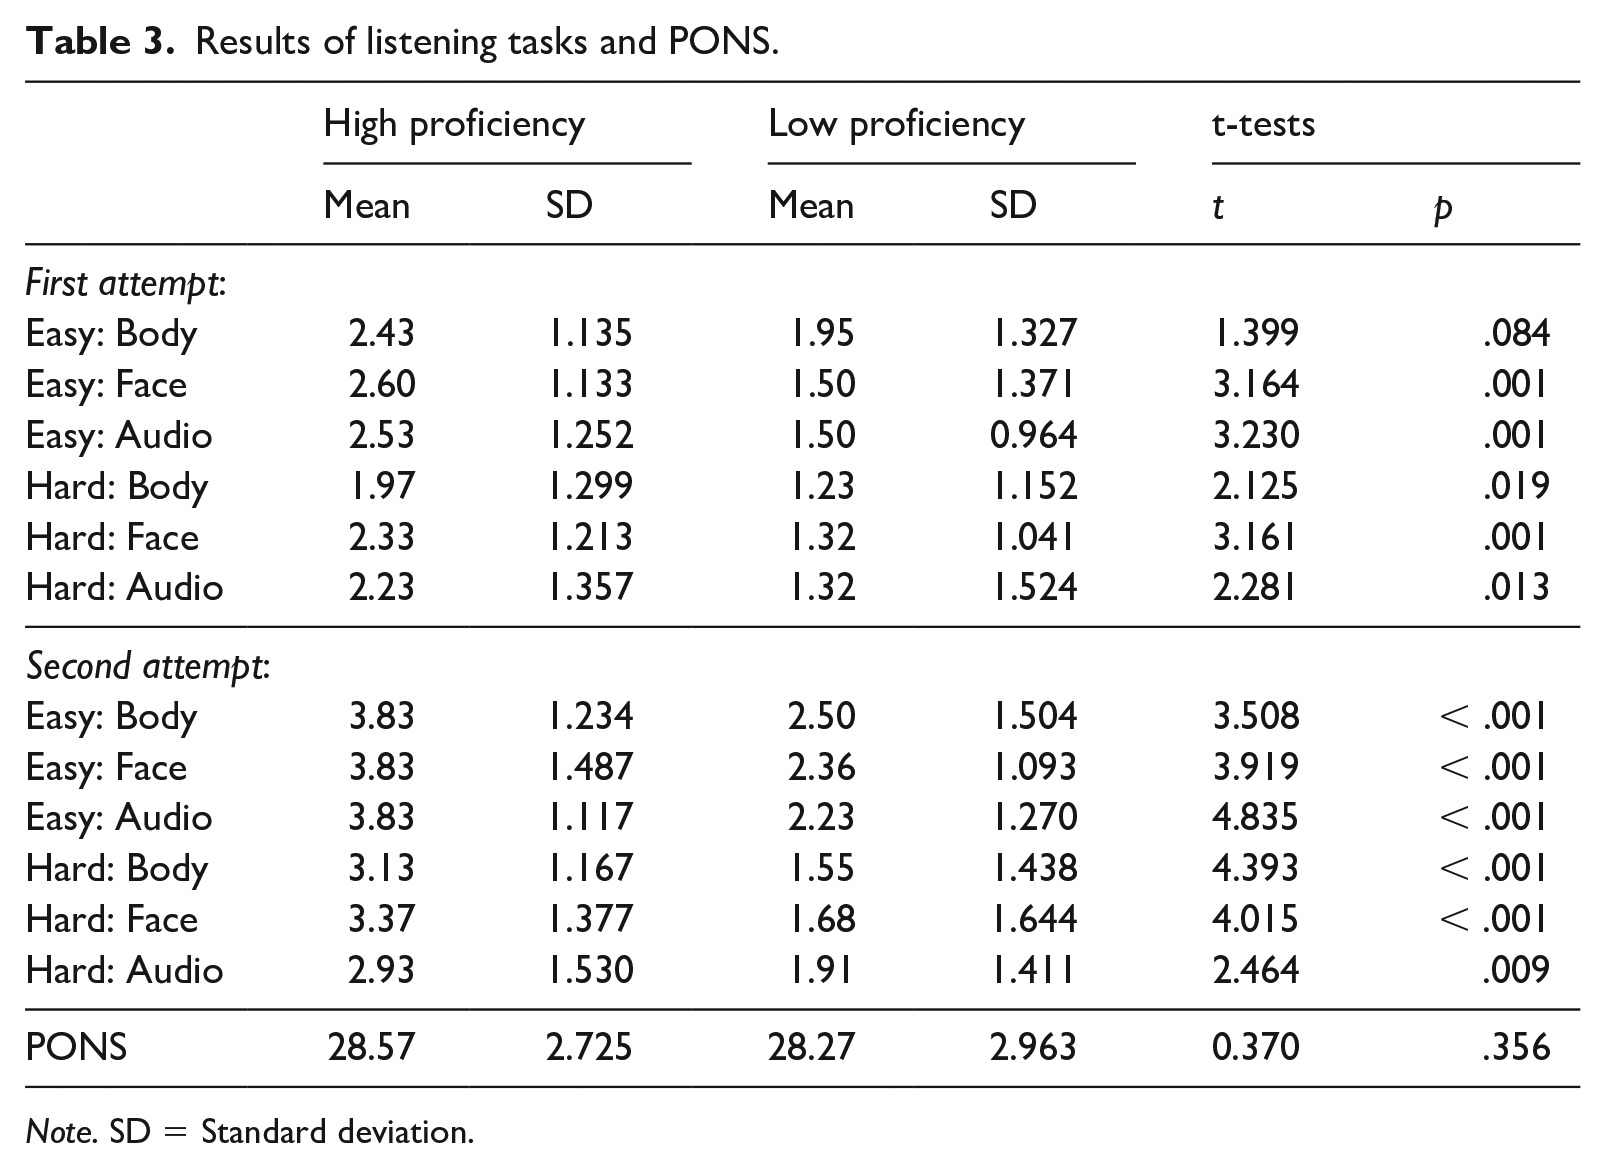
Note. SD = Standard deviation.
Regarding (a), as can be seen in Table 3, a series of independent t-tests indicate that accuracies are significantly different between the high and low proficiency groups in all cases except one (Easy-Body-First attempt; p = .084). Therefore, subsequent analyses were conducted separately for these two groups.
Regarding (b), an independent t-test indicates that high and low proficiency groups performed similarly in PONS (p = .356, d = 0.104). Therefore, we can safely assume that the sensitivity to nonverbal behaviors was equivalent between these two groups.
Regarding (c), Table 4 shows the types and frequencies of gestures in the Body materials. A point worth noting is that the majority of gestures were metaphoric, comprising around 60%–70% among all gesture types.
Gestures in body materials (percentages in parentheses).
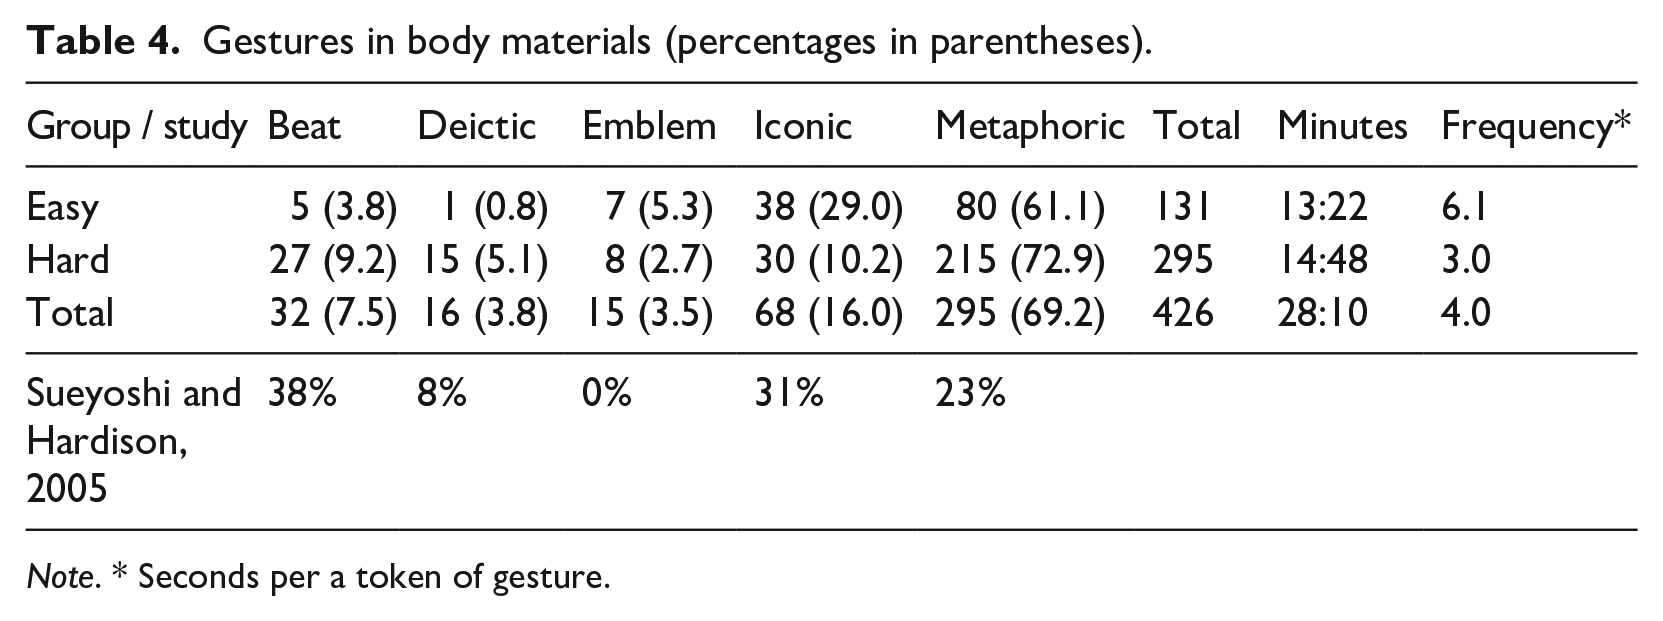
Note. * Seconds per a token of gesture.
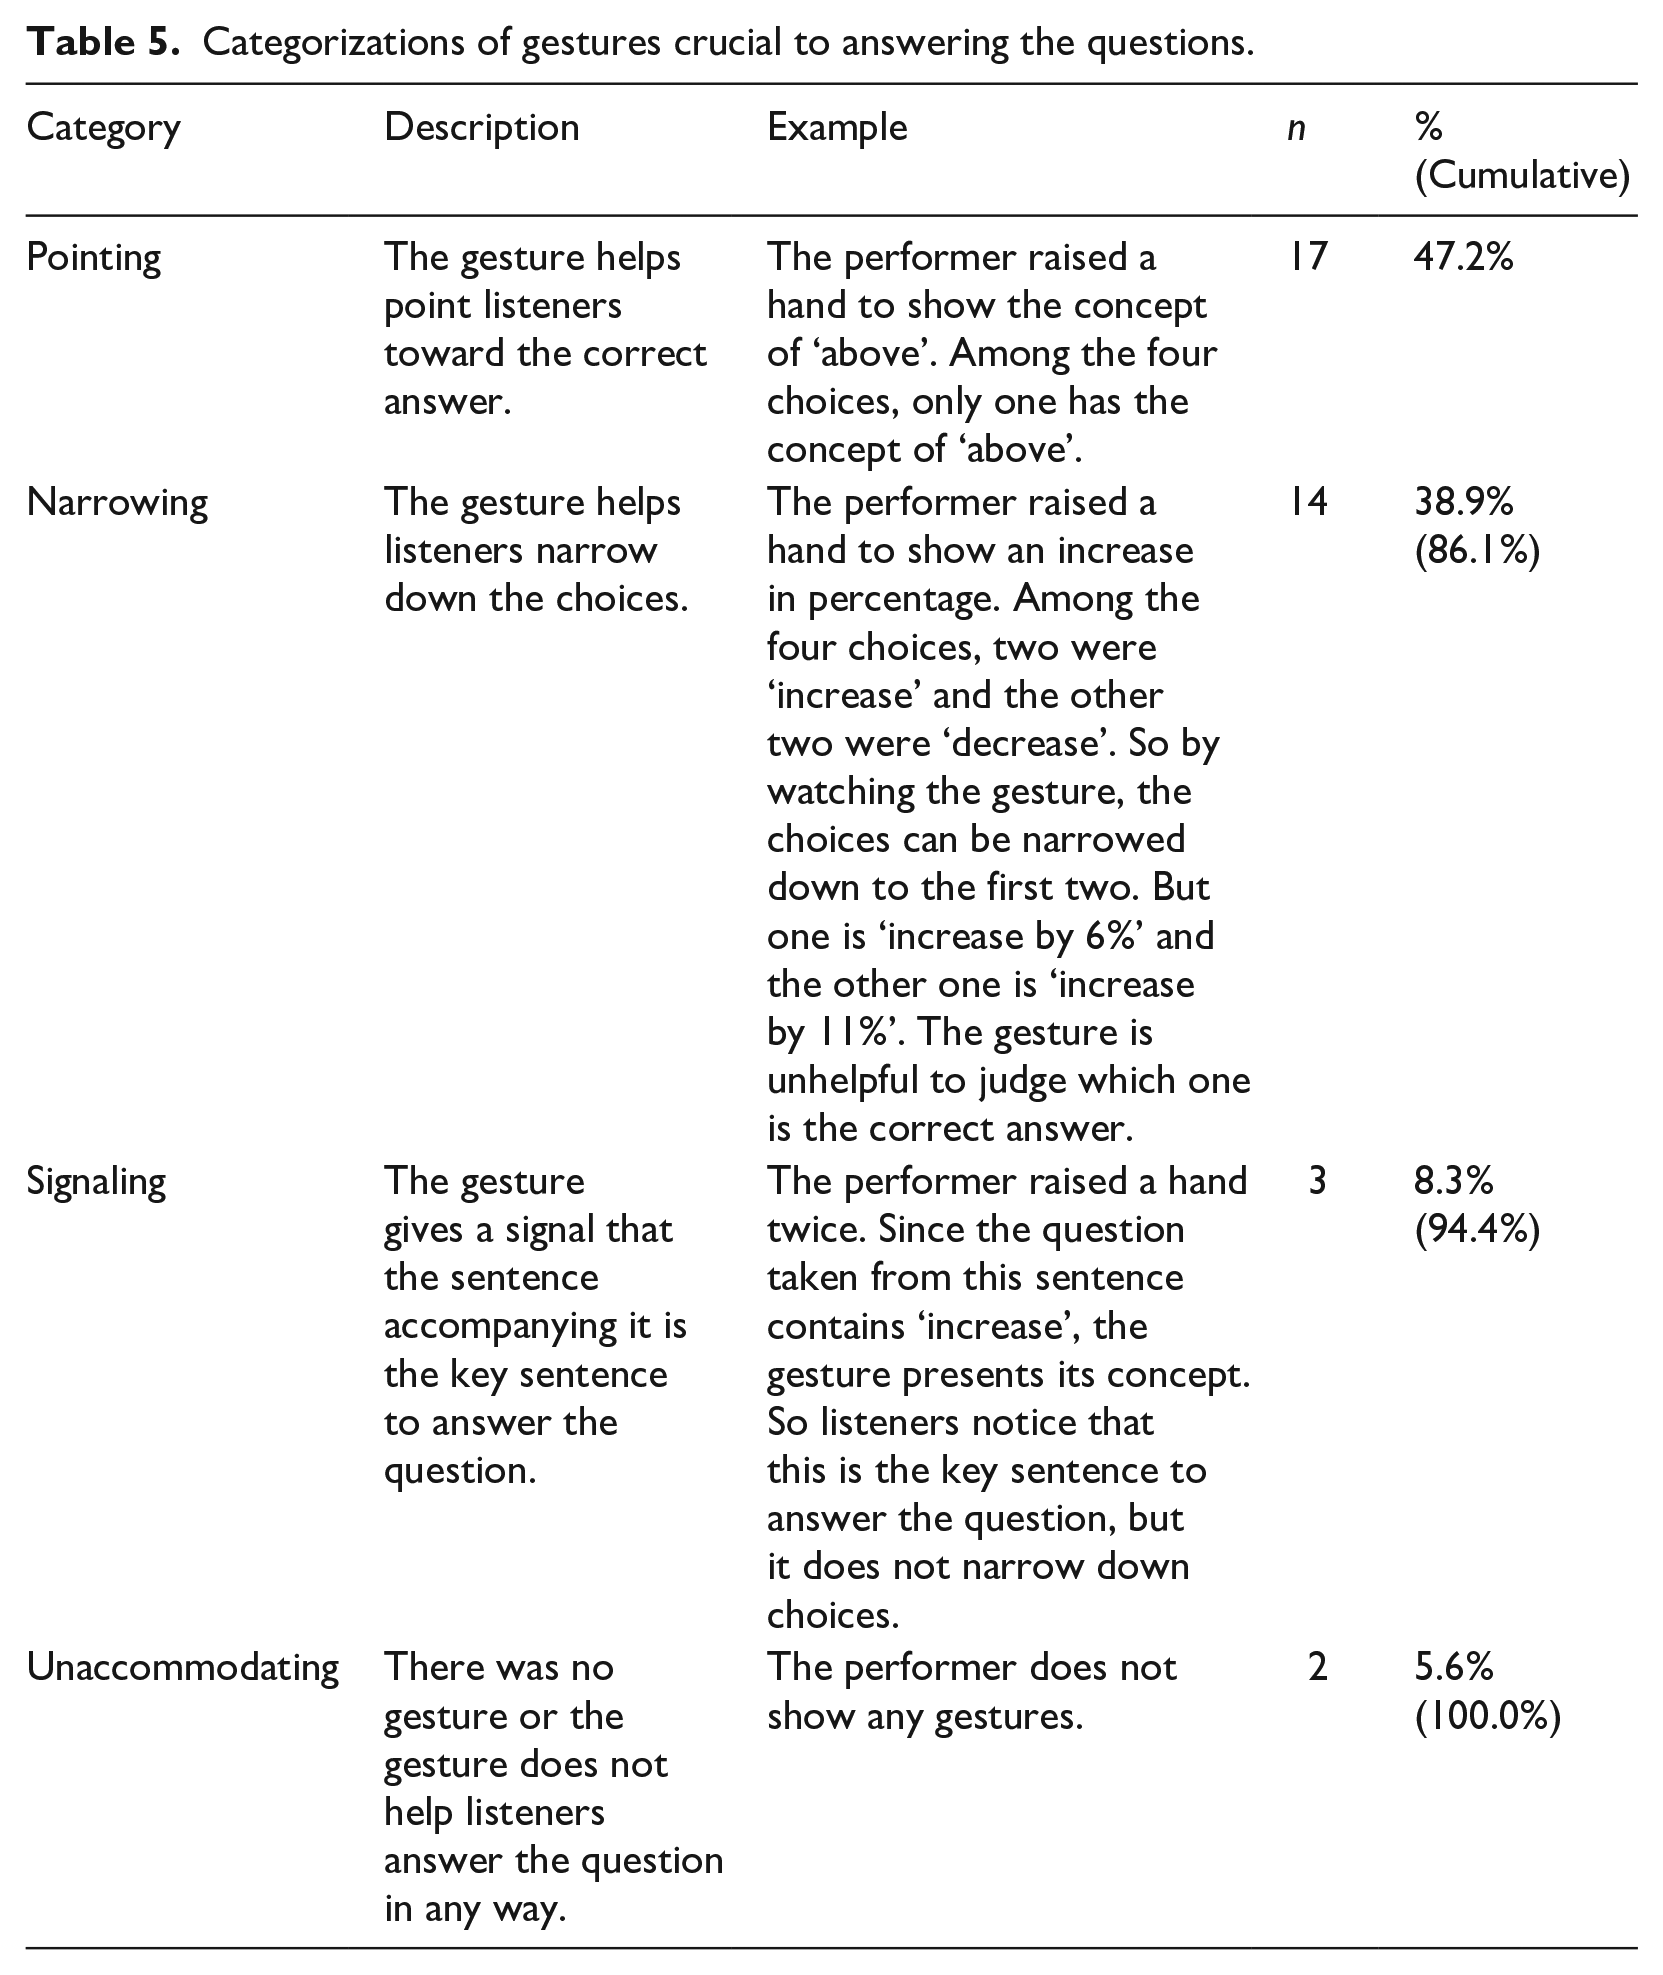
Finally, regarding (d), the gestures that were performed along with those sentences crucial to answering the questions were examined, and were categorized into four types, which is shown in Table 5. This categorization was inductively generated from the current data. Inclusive of all of the cases except ‘no help’, 34 key sentences (94.4%) were accompanied by gestures helpful for answering the questions in some way. Thus, gestures can be expected to assist the participants with finding the right answers (but see Sections VI and VII).
Categorizations of gestures crucial to answering the questions.
2 Main analyses
Table 6 shows the results of the repeated-measures ANOVAs. For both the high and low proficiency groups, there were main effects of the difficulty of materials and of the attempts at listening. There was also an interaction effect between these two variables but only for the high proficiency group. Simple effects show that, for both attempts, scores significantly differed between the hard and the easy texts; the difference was more prominent at the second attempt (p < .001, ηp2 = .538) than at the first attempt (p = .032, ηp2 = .149). Finally, score increase from the first to the second attempt did not differ among the modalities for the hard texts (p = .242, ηp2 = .048) nor for the easy texts (p = .874, ηp2 = .005) for the high proficiency group. In addition, they did not differ for the hard texts (p = .798, ηp2 = .011) nor for the easy texts (p = .776, ηp2 = .012) for the low proficiency group.
Results of repeated-measures ANOVAs.
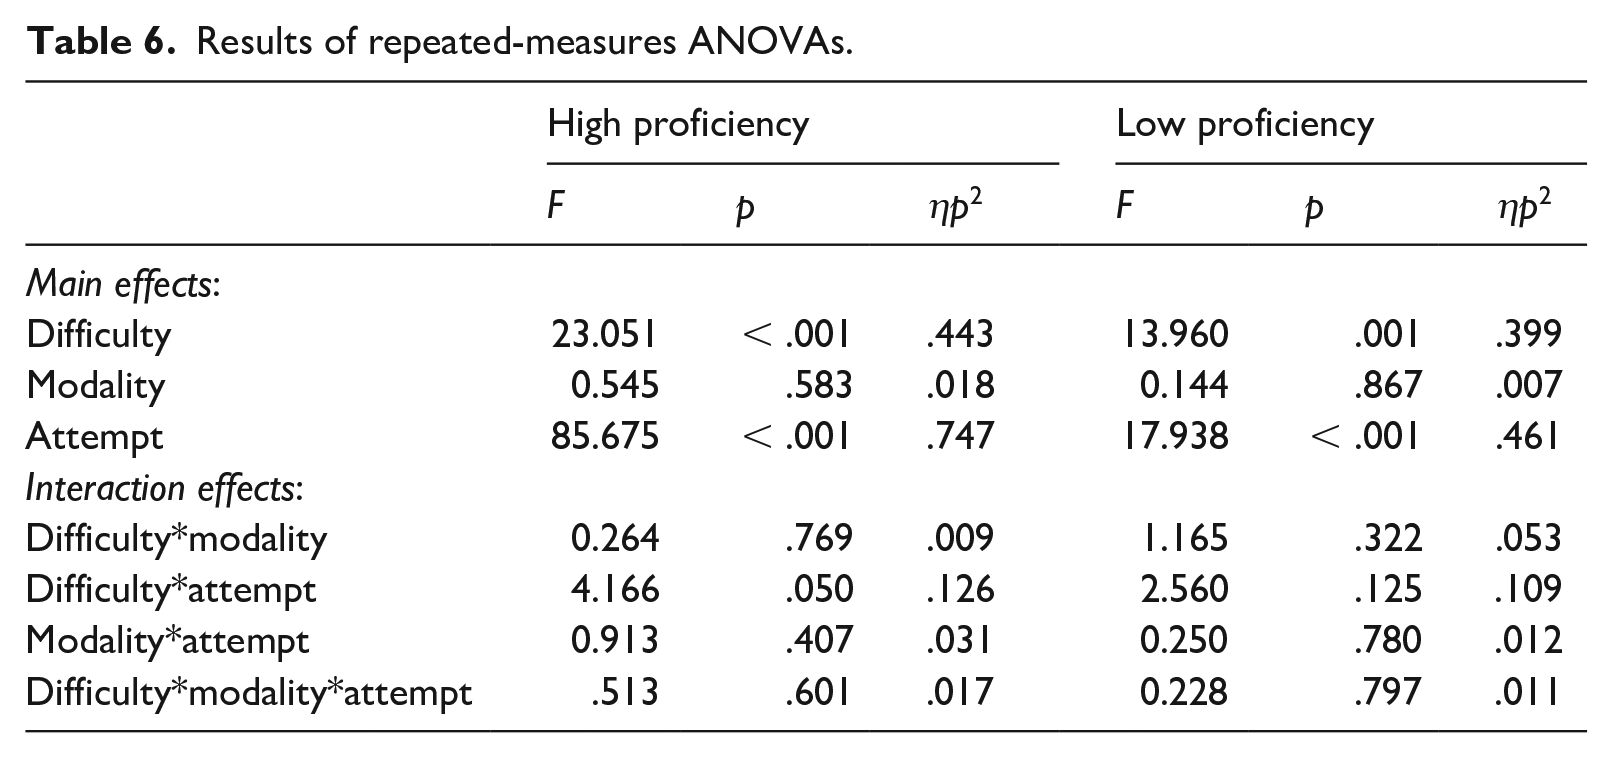
Table 7 shows the number and percentage of participants divided by their modality preference. The low proficient group showed only four combinations, but most (72.7%) chose Body > Face > Audio. As expected, the main reason for preferring Body was that gestures helped their comprehension (n = 17). Although the high proficiency group also preferred Body > Face > Audio, it did not reach half (40.0%), showing more varied preferences than the low proficiency group. Still, 23 high proficient participants acknowledged the facilitative role of gestures. Notably, ten high proficiency participants (33.3%) chose Face as the least preferable compared to only one in the low proficiency group (4.5%), while seven high proficiency participants (23.3%) chose Audio as the most preferable compared to only two in the low proficiency group (9.1%).
Number of learners for each modality preference (percentages in parentheses).
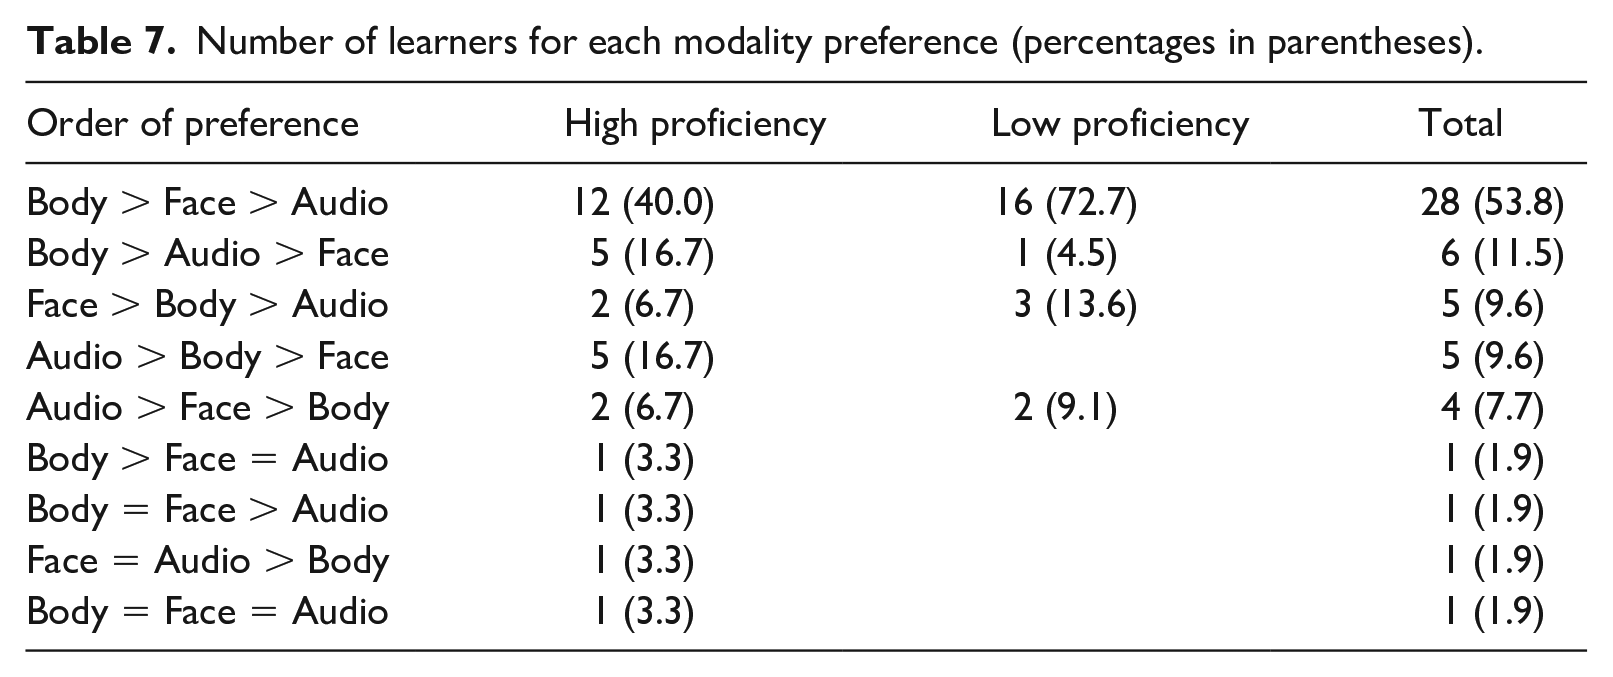
Table 8 shows the descriptive statistics of their aggregated test scores reordered based on their preferences. Repeated-measures ANOVAs show that there was no significant difference in their scores among First, Second, and Third choices for the high proficiency group (p = .193, ηp2 = .057) or for the low proficiency group (p = .811, ηp2 = .010). A series of repeated-measures ANOVAs of eight score sets (two proficiencies * two difficulties * two attempts) showed that the scores were significantly different for the easy texts at the second attempt in the high proficiency group. Post-hoc tests showed that the score of the Third choice (4.24) was higher than that of the Second choice (3.57). Due to its reversed order and small effect size (ηp2 = .215), we assumed that this resulted by chance.
Aggregated test scores in the order of preference.
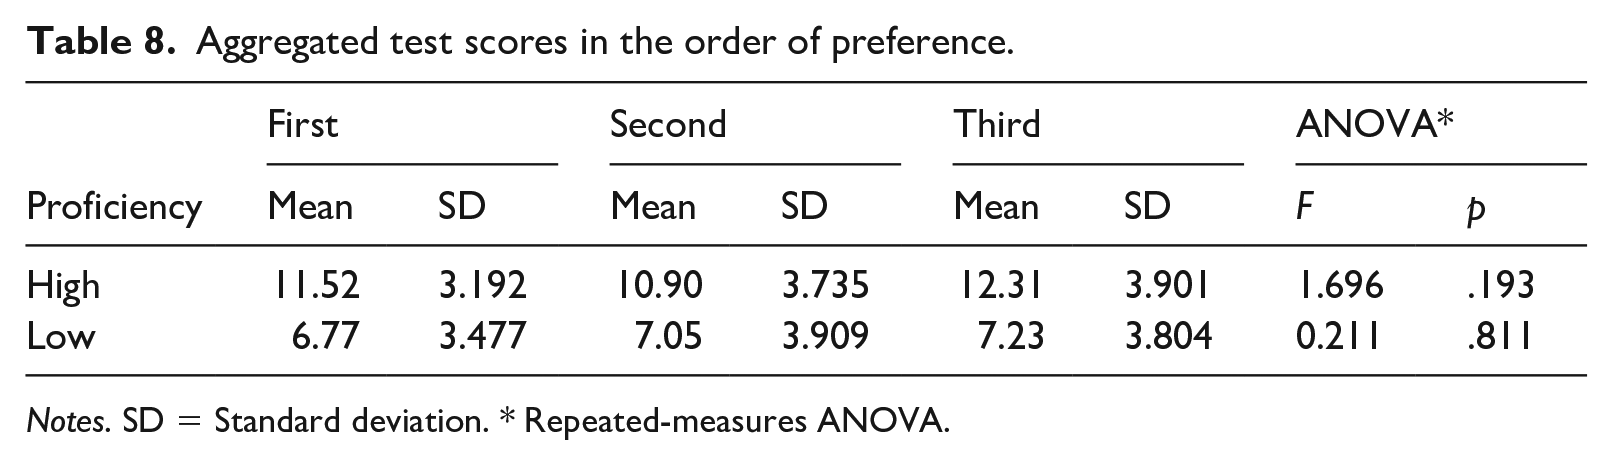
Notes. SD = Standard deviation. * Repeated-measures ANOVA.
VI Discussion
This study investigated how watching performer’s gestures and lip movements affect listeners’ comprehension of texts in relation to their proficiency, text difficulty, and the frequency of listening to the texts. To recap, the findings are as follows. Because (a)–(c) are a reconfirmation of assumptions, (d)–(h) will be discussed in the subsequent sections.
(a) Scores of the high proficiency group were higher than those of the low proficiency group.
(b) Scores of the easy texts were higher than those of the hard texts.
(c) Scores of the second attempt were higher than those of the first attempt.
(d) The modality of listening had no significant influence on their listening performance.
(e) For the high proficiency group, the score difference between the easy and the hard texts was larger at the second attempt than at the first attempt.
(f) Learners generally preferred watching the whole body the most, followed by watching the face, and then listening only.
(g) The high proficiency group showed more variations of modality preference than the low proficiency group.
(h) Learners’ modality preference had no significant influence on their listening performance.
1 Ineffectiveness of modality on listening
As the crux of this experiment, overall, the modality of listening did not affect learners’ listening comprehension. Adding visual cues is generally expected to increase comprehension; however, as discussed in Section II, such results were obtained only in the studies of between-participant design. Thus far, no study of within-participant design demonstrated a robust effect of modality on listening comprehension; rather, they found mixed effects on listening comprehension. Null effects observed in this article are in line with at least two studies of within-participant design (Batty, 2015; Cubilo & Winke, 2013). Evidence of null effects can also be gleaned from studies of between-participant design (Coniam, 2001; Gruba, 1993; Londe, 2009). Considering rather low scores even for the easy texts among the high proficiency group at the first attempt (2.43–2.60), it is not valid to claim that the texts were too easy for them to rely on nonverbal cues for comprehension.
We do not wish to claim that nonverbal behaviors do not exert any effect on L2 comprehension. We would rather argue that, these accumulated pieces of evidence reconfirm the notion that the contribution of nonverbal behaviors is not uniform and fluctuate due to various factors. We propose two possible reasons for the null effects observed in this study: (a) the types of visual cues used in the materials invalidated their contribution to listening comprehension, and (b) the demand of the task was so high that the participants could not afford to pay enough attention to nonverbal behaviors.
a Characteristics of materials
First, the homogeneous effects of the three modalities may be ascribed to the characteristics of the materials used in the study. Precisely speaking, it may be because the visual materials contained (a) context visuals only (Body and Face), and (b) metaphoric mostly (Body).
First, visual cues can be categorized into two kinds: content visuals and context visuals (Ginther, 2002). Content visuals refer to those that depict the contents of the speech. For instance, a lecturer may show slides that include photographs, pictures, or graphs related to the content of the academic lecture. Context visuals, on the other hand, refer to those that depict the context in which the speech is delivered. For instance, at a L2 listening test, a picture of two people talking to each other is shown while listening to their conversation. Ginther (2002) compared these two kinds of visuals, and demonstrated that content visuals facilitate more comprehension than context visuals. In Suvorov (2009), participants scored worse when assessing the video material with context visuals than other modalities (audio and photograph). These indicate the superiority of content visuals over context visuals for listening comprehension. Because the visual materials in this study showed only the performer without any content visuals, it provided only context visuals: a man giving a lecture alone. Lack of content visuals may have invalidated the usefulness of the visual cues. This is in line with the argument made by Cubilo and Winke (2013), who also ascribed the null effects of the video materials in their study to the fact that they contained primarily context visuals.
Second, as can be seen in Table 4, around 60%–70% of gestures performed in the Body materials were metaphoric. Moreover, a further analysis indicated that out of 86 gestures that supposedly helped reach the answer (except ‘no help’), 56 gestures (72.7%) were metaphoric, followed by 12 iconic gestures (15.6%). The beneficial effects of metaphoric gestures have been apparent only for phonological aspects (e.g. Baills et al., 2019). No study has yet examined the effects of metaphoric gestures exclusively on listening comprehension, but due to its abstract nature, its effects are supposedly limited.
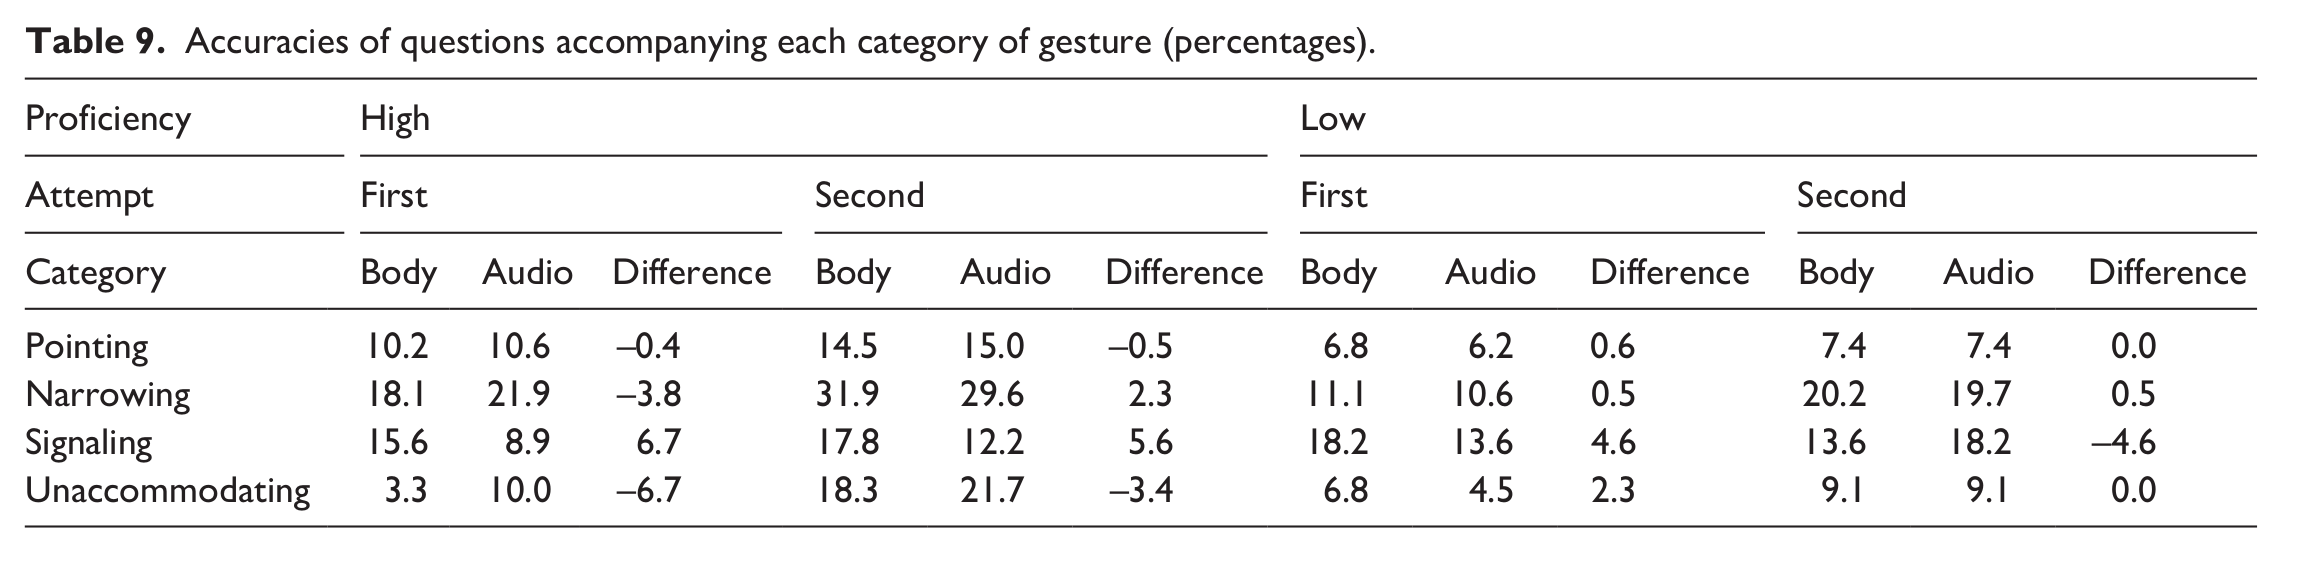
Table 4 compares the types and frequencies of gestures in the video material between Sueyoshi and Hardison (2005) and this study. As can be seen in Table 4, the video material in Sueyoshi and Hardison (2005) contained a large portion of iconic gestures (31%). Albeit not so for every case, iconic gestures have demonstrated facilitative effects for story retelling (Lin, 2021) and vocabulary learning (e.g. Levantinou & Navarretta, 2015). Again, no study has yet examined the effects of iconic gestures exclusively on listening comprehension; however, considering that iconic gestures represent the concrete notion of the words, it can potentially compensate for lack of vocabulary among listeners who may guess their meanings from the accompanying gestures (Stam & McCafferty, 2008). Moreover, out of 68 incidents of iconic gestures in this study, 19 (27.9%) of them were referring simply to numbers, which the participants must have been familiar with and could understand even without recourse to gestures. Table 9 shows the accuracies of questions accompanying each category of gesture (Table 5) comparing Body and Audio. If gestures had been helpful for answering questions, in all cases except in ‘Unaccommodating’, Body should exhibit a higher percentage than Audio. However, there seems to be no consistent pattern in superiority of one modality over the other, indicating the limited effects of gestures. This may explain why watching gestures aided the comprehension of participants in Sueyoshi and Hardison (2005) but not in this study.
Accuracies of questions accompanying each category of gesture (percentages).
b High demand of the task
Another possibility of null effects of modalities is that the task imposed on the participants was so demanding that they were incapable of sharing their cognitive resources for incorporating nonverbal cues, be it gestures or lip movements. As discussed in Section II, when the processing of auditory information becomes burdensome, listeners become unable to process nonverbal information (e.g. Rohrer et al., 2020), and in such cases, L2 listeners tend to consciously narrow their focus on the former (Cross, 2011). Considering the present study, the four characteristics may have elevated the task demands.
First, the participants listened to L2 texts that lasted between three to six minutes. This is relatively long compared to the materials in other studies that showed beneficial effects of watching nonverbal cues (Dahl & Ludvigsen, 2014, 2.0–2.5 minutes; Parry & Meredith, 1984, less than one minute; Sueyoshi & Hardison, 2005, 2–4 minutes; Wagner, 2010a, 1.5–4.0 minutes; 2013, 1.5–2.5 minutes), and this may have overloaded learners’ working memory. Second, note-taking was not permitted during listening in contrast with the practices of some other studies (Shin, 1998; Wagner, 2010a, 2013).
Third, since the questions were not previewed prior to the first attempt in contrast to the procedure adopted by Wagner (2010a, 2013), the participants were required to comprehend and retain as much information as possible to prepare for any kinds of questions. It is true that the participants knew the questions at the second attempt, so the task should have become easier; as such, the effects of watching nonverbal cues may be expected to appear. However, Gruba (2010) and Cross (2011) reported cases where participants tended to primarily focus on the auditory channel when they listened to the same text the second time in search for details and clarification of information. In other words, during conceptual processing, the task demand was too high to expend cognitive recourses for decoding nonverbal behaviors. In contrast, during perceptual processing, learners naturally tended to focus on the auditory channel. This may have further prevented detecting modality differences.
Fourth, the texts may have been too difficult for the participants. Thus far, only two studies (Dahl & Ludvigsen, 2014; Sueyoshi & Hardison, 2005) provided a text used in their research, so we analysed the difficulty of these texts. According to the New Dale-Chall Readability Formula (Chall & Dale, 1995), the difficulty of the texts in these two studies is both categorized as Grades 5–6 whereas the ones in the current study are categorized as Grades 9–10 and 11–12. The participants in Sueyoshi and Hardison (2005) were ESL learners but were living in the US. Those in Dahl and Ludvigsen (2014) had been learning English for six to seven years. Therefore, relative to the texts with the difficulty of Grades 5–6, their English proficiency may have been high enough, which enabled them to afford to spend a part of their cognitive resources on decoding nonverbal cues, yielding higher scores for visual materials than audio materials. Although the easy texts were supposed to lighten their cognitive burden in this study, Grades 9–10 may have been still quite arduous for the participants.
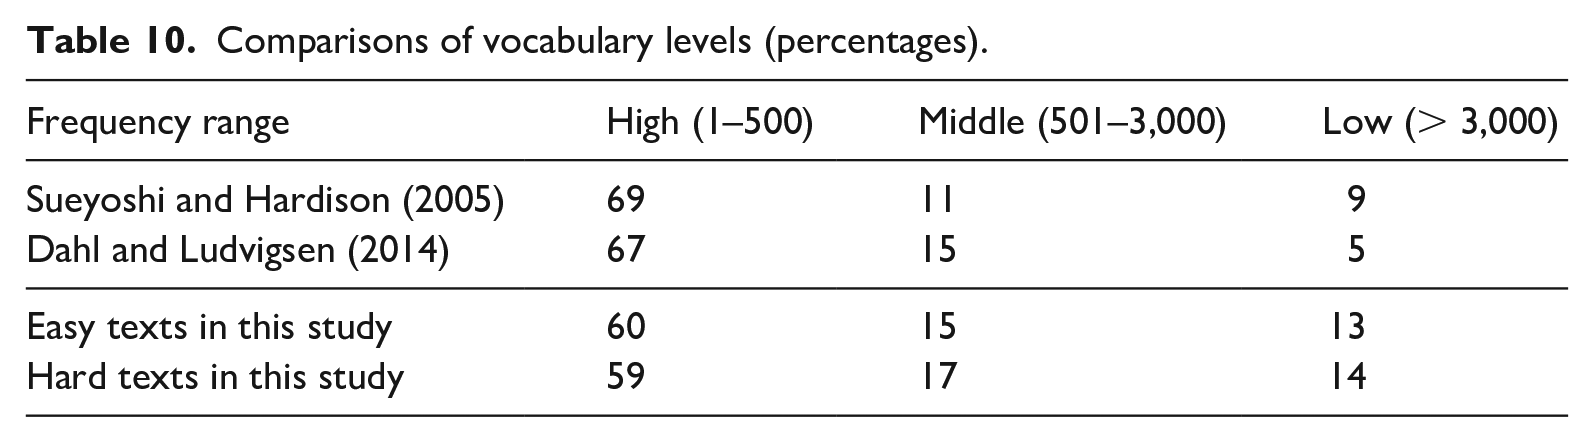
Although the New Dale-Chall Readability Formula (Chall & Dale, 1995) takes vocabulary levels into account, it simply dichotomizes them into ‘hard’ and ‘non-hard’. Therefore, we compared the frequency range among the three studies using Corpus of Contemporary American English (Davies, 2008–). As can be seen in Table 10, the texts in this study contained a larger percentage of words of low frequencies when compared to the other two studies. As discussed in Section II, visible lip movements help word recognition only when the word is familiar to the listener. Since many words were outside of vocabulary repertoire of the participants, the Face materials probably did not aid learners’ comprehension.
Comparisons of vocabulary levels (percentages).
The interaction effect observed in the repeated-measures ANOVA can also be explained from this perspective of task demand. The results indicate that the score difference between the easy and hard texts was larger during the second attempt than the first for the high proficiency group (Table 3). In other words, they gained significantly more for the easy texts than for the hard texts from the first to the second attempt. Among all of the eight combinations of learner proficiency, text difficulty, and attempt of listening, the task demand was the lightest for the easy texts during the second attempt among the high proficiency group. Listening to the same easy texts twice while keeping the questions in mind, the high proficiency group may have felt this task to be much easier than during the first attempt especially when compared to the hard texts, producing a larger gain. Nevertheless, the easy texts may have still been challenging for the low proficiency group even during the second attempt, so this tendency was not observed for them.
2 Modality preference of listening
Across proficiency levels, the preferred order was Body > Face > Audio (53.8%) mainly because they found gestures facilitate comprehension. Past studies on learner perception generally indicate that participants prefer video over audio (e.g. Cubilo & Winke, 2013); however, none included these three levels (Body, Face, Audio), so the results cannot be compared directly. Although participants in Sueyoshi and Hardison (2005) did not rank their preferences, they answered a questionnaire on five-point Likert scales, and two of the items are noteworthy: (a) It is easier to understand English when I can see the speaker’s face, and (b) It is easier to understand English when I can see the speaker’s gestures. While higher proficiency learners yielded the same mean score across these two items (4.24), low proficiency learners tended to favor gestures (4.19) over face (3.86). This is partially in line with the results of the present study in the sense that 17 participants in the low proficiency group (77.2%) preferred Body over Face. However, contrary to the results in Sueyoshi and Hardison (2005), 23 participants (76.7%) of the high proficient group also preferred Body over Face. Several participants in this study commented that the visual information in Face (lip movement, facial expressions, partially-visible gestures) was not only unhelpful but also distracting for listening. This can likely be attributed to the split-attention effect (Mayer & Moreno, 1998), which is ‘the impairment in learning that arises from the need to mentally integrate disparate sources of information’ (Moreno & Mayer, 1999, p. 359). This facilitates a sense that it is easier to concentrate by singly focusing on audio. This phenomenon was also reported in past studies (Cubilo & Winke, 2013; Wagner, 2008), and there seem to be no effects of proficiency on this tendency at least in this study.
A difference between the high and low proficiency groups lies with the fact that the former showed a more varied order of preference. This may be owing to their lessened need to depend on visual information for comprehension at least for the easy texts during the second attempt; their proficiency was high enough to understand the content only from the information coming through the verbal channel. Thus, seven participants (23.3%) chose Audio as the most preferred modality. At the same time, 21 participants (70.0%) preferred Body over Audio, indicating that they did not negate the usefulness of gestures.
To our knowledge, there has been only one study that directly investigated the relationship between learners’ preference and performance of different modalities (Suvorov, 2009). The study found that those participants who preferred audio scored significantly higher at the audio modality than at other modalities; however, the number of participants was only 15. Moreover, the results from all participants (n = 34) indicate that there was no relationship between preference and performance. In this sense, the present study seconds the notion that learners’ preference of a particular modality is unrelated to their performance. Suvorov (2009) surmises that sensory preferences (e.g. Dörnyei & Ryan, 2015) may be playing a role. More precisely, auditory learners perform better with auditory materials whereas visual learners perform better with visual materials. Because learning style operates out of our awareness (Sternberg & Grigorenko, 2014), it is distinct from learner preference. Discovering such undetected influencers on listening comprehension, if any, could be a direction for further research.
VII Limitations
Several limitations should be mentioned. First, the low number of participants, especially in the low proficiency group, could have been a reason for our failure to detect significant effects on modalities.
Second, data collection was inevitably conducted online due to the pandemic. Although participants were told not to take notes so that they could focus on the video or the audio, we were unable to invigilate their practices. There is no incentive for them to cheat to aim at higher scores, but it is not guaranteed that they strictly followed the procedure as planned. In relation to this, two participants watched the videos via smartphones, whose small screen might have obscured body movements. This might have negatively affected their listening performance.
Third, the listening materials were scripted and shot in an experimental condition. For the sake of increasing ecological validity, those clips could have been taken from authentic classrooms. However, this comes at the cost of losing the control over several variables in them. As a compromised solution, as can be seen in some past studies, inviting the audience in front of the performer could have induced more natural nonverbal behaviors even if it was staged (e.g. Cubilo & Winke, 2013); however, it was not feasible also due to the pandemic.
Fourth, the types and frequencies of gestures were not strictly manipulated for the sake of ecological validity, but this yielded two concerns. First, the majority of gestures turned out to be metaphoric, which may not facilitate comprehension compared to iconic gestures. This leads to a further inquiry of whether the null effects can be replicated if the profile of gestures differs. Second, although only 5.6% of gestures were categorized as ‘Unaccommodating’, in a study to investigate the effects of gestures on listening comprehension, all questions should have been ‘Pointing’, which occupied only 47.2% in this study. This was caused by the practice of preparing the scripts and the accompanying questions before making the video clips. Thus, I suggest scholars endeavoring to tackle this topic generate questions after shooting videos, and the questions should be made based on the gestures observed in them. Moreover, to enable comparisons among studies in order to examine gesture effects in more depth, it is indispensable that future research report (a) what types of gestures are performed and how frequently in the video materials overall (Table 4) as well as (b) what types and categories of gestures are performed in the sentences crucial to answering questions (Table 5) along with the accuracy of each category (Table 9).
VIII Pedagogical implications and conclusions
There has been a controversy whether listening materials should be accompanied by visual information in L2 assessment (e.g. Wagner & Ockey, 2018). Some experts in L2 assessment claim that the test takers’ skills to interpret NVBs can and should be regarded as a part of the listening construct whereas others object to such a notion, asserting that listening tests including video will assess something other than test takers’ listening skills. Findings of the present study can shed another light on this issue. Whether nonverbal cues can be utilized in listening comprehension should be considered in relation to the text difficulty, learners’ proficiency and gesture profile. If the text is easy enough for listeners to comprehend only through the aural channel, there will be no necessity to rely on nonverbal cues. In contrast, as this study has shown, if the text is too difficult for listeners to expend cognitive resources on other elements besides decoding the aural input, nonverbal cues will not be utilized. Moreover, even when the text difficulty is appropriate for listeners, if performed gestures are metaphoric, they may not offer much in terms of positive information for comprehension. All in all, there should be cases when adding visual information does not alter scores as well as cases when it increases (or decreases) scores, depending upon the relationships among these variables. Such a notion is in line with the mixed results of past studies that compared audio with visual conditions on listening comprehension (e.g. Rohrer et al., 2020). As Batty (2015) pointed out, tests that resemble authentic contexts may motivate test takers to study. On the other hand, preparation becomes more demanding and time-consuming for producing video materials. Therefore, the decision should be left to each practitioner, considering their students’ proficiency, needs and their own workload.
To conclude, this study provides evidence that the effects of watching performers’ gestures and lip movements do not automatically improve L2 listening comprehension. Whether watching nonverbal behaviors offers positive, negative or no influence, is affected by various factors. In this sense, it is not surprising that past studies have shown contradictory results. With this in mind, the time is now ripe to move forward from the stage of the dichotomous choice of whether or not to use nonverbal cues to the stage of how we can better make use of them during listening instruction. Such fruitful practices should provide the groundwork to advance learners’ comprehension skills, which will lead to improved performance regardless of the modality of the presented materials.
Footnotes
Acknowledgements
I am very grateful to Michael Floquet who generously helped me create video clips. I am also thankful to Miho Komura for giving me advice on the statistics as well as Mark Freiermuth for proofreading in their busy schedules. I also thank the editors and anonymous reviewers for their constructive feedback.
Funding
The author received no financial support for the research, authorship, and/or publication of this article.