
Abstract
Oral fluency is critical to oral proficiency, as it reflects both linguistic competence and communicative confidence, which are essential for effective interaction and successful language use. However, its characteristics across different educational stages remain underexplored. Drawing on the Spoken Corpus of Chinese Learners of English and guided by
Keywords
1. Introduction
Oral fluency is widely recognized as a crucial component of second language acquisition (SLA), functioning both as an indicator of learners’ language proficiency and a benchmark for evaluating the effectiveness of oral instruction and learning outcomes (Foster et al., 2000; Kormos, 2014; Segalowitz, 2010). The importance stems from its dual reflection of linguistic competence and communicative confidence (Derwing et al., 2008), which are vital for effective interaction in academic and social contexts.
Given its profound significance, many studies have been conducted on oral fluency (Albarqi, 2025; Albarqi & Tavakoli, 2023; Suzuki & Kormos, 2023, 2024; Yan et al., 2025). Early research examined fluency from the perspective of first language (L1) acquisition (Fillmore, 1979; Leeson, 1975), but, since the 1980s, attention has increasingly shifted toward second language (L2) contexts (Brumfit, 1984; Faerch et al., 1984; Lennon, 1990). In the following decades, the related research has mainly evolved along two main strands: the multidimensional assessment of oral fluency 1 (Suzuki & Kormos, 2023, 2024; Tavakoli & Wright, 2020) and the exploration of the characteristics of fluency development under various influencing factors (Garcia-Ponce, 2023; Olkkonen et al., 2024). The latter has predominantly relied on longitudinal designs tracking the same group of learners over time to identify the fluency characteristics (Mareková & Beňuš, 2024; Szyszka & Lintunen, 2026). While these studies provided valuable insights, they often lacked a broader comparative perspective across proficiency levels (Kormos & Dénes, 2004; Olkkonen et al., 2024). To address this gap, cross-sectional research is essential for capturing a more comprehensive picture of the characteristics of oral fluency across different educational stages (Gu & Hsieh, 2019; W. Wang et al., 2024).
However, relatively few cross-sectional studies have examined fluency characteristics across multiple educational stages within the EFL context (Albarqi, 2025; Albarqi & Tavakoli, 2023; Chat et al., 2018; Pan, 2013). Moreover, most existing studies have concentrated on senior secondary school or university learners (Albarqi & Tavakoli, 2023; Chat et al., 2018), with limited attention to earlier stages, particularly primary and junior secondary schools (Dewaele et al., 2025; Gu & Hsieh, 2019), which remain underexplored and warrant further investigation.
Therefore, this study conducted a cross-sectional analysis of oral fluency characteristics among Chinese EFL learners across three educational stages: Stage One (Grade 7: junior secondary school), Stage Two (Grade 10: senior secondary school), and Stage Three (first-year English majors in university). By examining fluency through three dimensions, namely speed fluency, breakdown fluency, and repair fluency, this study aimed to identify learners’ oral fluency patterns across three educational stages and to explore the underlying influencing factors. The findings provided pedagogical implications for L2 oral instruction and practice.
2. Literature Review
The earliest definitions of oral fluency were developed in the context of L1 acquisition (Fillmore, 1979; Leeson, 1975). Later, studies on L2 oral fluency emerged, with Lennon (2000, p. 26) providing a narrow definition as “the rapid, smooth, accurate, lucid, and efficient translation of thought or communicative intention into language under the temporal constraints of online processing,” which limited fluency to temporal characteristics of speech and laid the foundation for subsequent empirical research (Albarqi, 2025; Albarqi & Tavakoli, 2023; Lintunen et al., 2019; Yan et al., 2022). In the present study, oral fluency is conceptualized in terms of speed, breakdown, and repair fluency (Tavakoli & Skehan, 2005) and operationally defined using commonly employed temporal measures (Ginther et al., 2010; Kormos & Dénes, 2004), including speech rate, mean length of runs, pause frequency and length, and repair rate. To elucidate the mechanisms through which fluency is realized and develops, the following section reviews classical theoretical models that have informed empirical studies, highlighting key findings and ongoing debates in the field.
2.1. Theoretical Models
Oral fluency has been examined through several theoretical models.
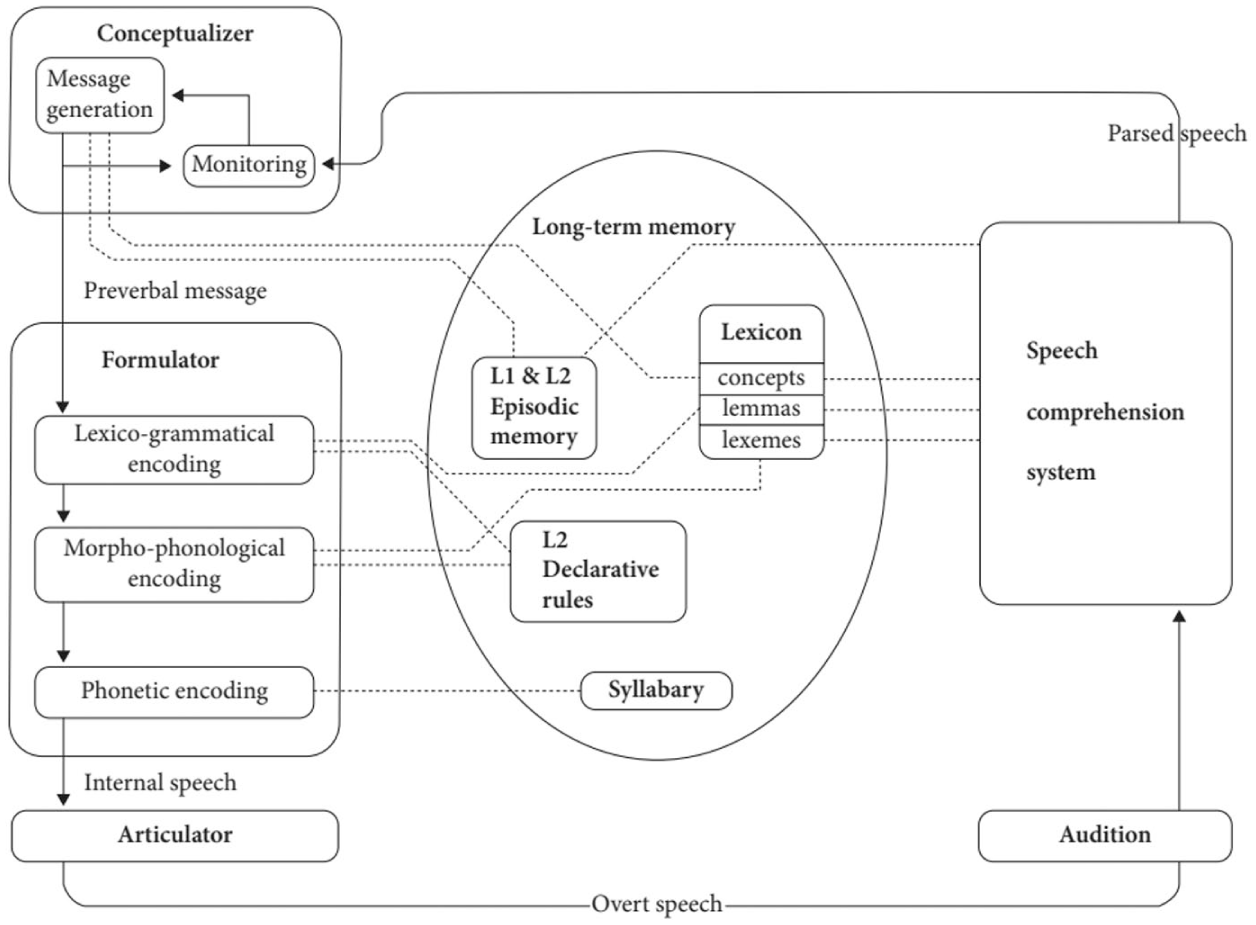
The model of Kormos’ bilingual speech production.
Kormos’ (2014) model comprises three core encoding systems—the conceptualizer, formulator, and articulator—supported by a storage system, referred to as long-term memory, and regulated by a monitoring mechanism. Unlike
By linking these cognitive and linguistic processes to observable fluency indicators, Kormos’ (2014) model offers a comprehensive framework for analyzing L2 fluency. These processes determine the efficiency of speech production and directly shape measurable indicators including speech rate, pause behavior, and repair phenomena. According to Grosjean (1980), temporal variables should be understood within a broader framework of production, perception, and language acquisition to yield deeper insights into fluency development. Therefore, this study adopted Kormos’ (2014) Bilingual Speech Production Model to analyze the fluency characteristics of Chinese EFL learners and the factors influencing their progression across educational stages.
2.2. Multidimensional Assessment of Oral Fluency
Given the prominence of oral proficiency, considerable research (Leeson, 1975; Lennon, 1990; Suzuki & Kormos, 2023, 2024; Tavakoli & Skehan, 2005) has sought reliable indicators for assessing fluency. Temporal variables have become the most widely adopted and are recognized as robust measures (Cai & Zhang, 2023; Mareková & Beňuš, 2024; Olkkonen et al., 2024).
Leeson (1975) was among the first to propose indices for assessing oral fluency, although some lacked practical clarity. As a groundbreaking researcher, Lennon (1990) made seminal contributions by adopting 12 indices to analyze the fluency development of advanced EFL learners, ultimately identifying 3 as particularly significant: pruned words per minute, repetitions per T-unit, and the percentage of T-units followed by pauses. Following this, Arevart and Nation (1991) measured fluency development using words per minute and the number of pauses per 100 words, thereby lending support to Lennon’s (1990) proposed measures of fluency. Based on previous studies, Tavakoli and Skehan (2005) proposed three dimensions of fluency: speed fluency, referring to the rate features of speech; breakdown fluency, concerning the characteristics of disfluencies; and repair fluency, dealing with the strategies used to resolve disfluencies and maintain the flow. Each dimension, along with its indices, has been widely adopted in subsequent studies to assess oral fluency (Albarqi, 2025; Albarqi & Tavakoli, 2023; Suzuki & Kormos, 2023, 2024). Accordingly, this study employed their measurement as the primary analytic metrics (see Section 3.3 for details).
2.3. Studies on Oral Fluency Characteristics
Research on oral fluency characteristics can generally be classified into longitudinal and cross-sectional studies. Longitudinal research, which tracks fluency development under various influencing factors over time, remains the dominant approach and has provided valuable insights into fluency’s dynamic nature. The factors can be broadly divided into internal and external categories. The former includes learners’ L1 background (Mareková & Beňuš, 2024), cognitive processing efficiency (Olkkonen et al., 2024), working memory capacity (Gagné et al., 2025), willingness to communicate and language anxiety (Nematizadeh & Wood, 2019; Pérez, 2019; Szyszka & Lintunen, 2026), L2 proficiency (Yan et al., 2025), and the use of formulaic language (Xuan et al., 2021). External factors encompass the language environment (Cai & Zhang, 2023; Garcia-Ponce, 2023), technology use (Jiang et al., 2023), sentence patterns and lengths (Hougham et al., 2024), and task conditions such as task types, task repetition, and pre-task planning time (Doe, 2025). Some scholars have further adopted the complexity, accuracy, and fluency (CAF) framework to provide an integrated view of oral development (Housen, 2022; Housen & Kuihen, 2009; Muhammadpour et al., 2023; Shi et al., 2024).
Although longitudinal studies capture developmental trajectories in detail, they are typically constrained by small sample sizes and limited generalizability. Cross-sectional research addresses these limitations by examining fluency across larger groups and multiple proficiency levels (Albarqi, 2025; Albarqi & Tavakoli, 2023; Butler & Liu, 2025; Chat et al., 2018; Pan, 2013; Wang et al., 2024). For instance, Pan (2013) found minimal differences in speech rate across proficiency levels but wave-like patterns for filled pauses and linear trends for unfilled pauses. Chat et al. (2018), using Test of English as a Foreign Language (TOEFL) tasks, observed significant increases in speech rate with rising proficiency but no clear progression in pause length, with intermediate-level learners unexpectedly exhibiting the longest mean length of pauses. Albarqi and Tavakoli (2023) noted that higher-proficiency learners produced significantly fewer filled pauses, repetitions, and hesitations, alongside a higher proportion of self-repairs. Moreover, Albarqi (2025) documented significant proficiency-related differences in breakdown fluency among Arabic EFL learners, particularly in filled pauses, between-clause pauses, and articulation rate.
Despite these findings, most studies have focused on a single educational stage, predominantly at the senior secondary or adult level, leaving earlier stages underexplored (Dewaele et al., 2025; Djigunović, 2016; Gu & Hsieh, 2019). Consequently, a substantial gap remains in understanding the oral fluency characteristics across multiple educational stages, which is crucial for informing instructional design and targeted training tailored to learners at several stages. Building on prior research, this study investigated the characteristics of oral fluency across three educational stages to provide a comprehensive account of its progression. Therefore, the following three research questions were formulated.
3. Methodology
3.1. Design
This cross-sectional study employed a mixed-methods design to investigate the characteristics of oral fluency across three educational stages of Chinese EFL learners. The independent variable was educational stage with three levels (Grade 7, Grade 10, first-year English majors), and the dependent variables were eight fluency indicators categorized into speed (speech rate, articulation rate, mean length of runs), breakdown (mean length of pauses, pause rate), and repair (false start rate, self-repair rate, repetition rate) fluency. Additionally, semi-structured interviews investigated the factors underlying oral fluency characteristics.
3.2. Participants
A total of 152 participants from the Spoken Corpus of Chinese Learners of English (SCCLE), a corpus of oral English recordings from Chinese learners, were included across three stages: Stage One (Grade 7; n = 52), Stage Two (Grade 10; n = 52), and Stage Three (First-year English majors; n = 48). Thirty interviewees were further randomly selected for semi-structured interviews through stratified sampling. Demographic information is presented in Table 1.
Participants’ Demographic Information across Three Educational Stages.
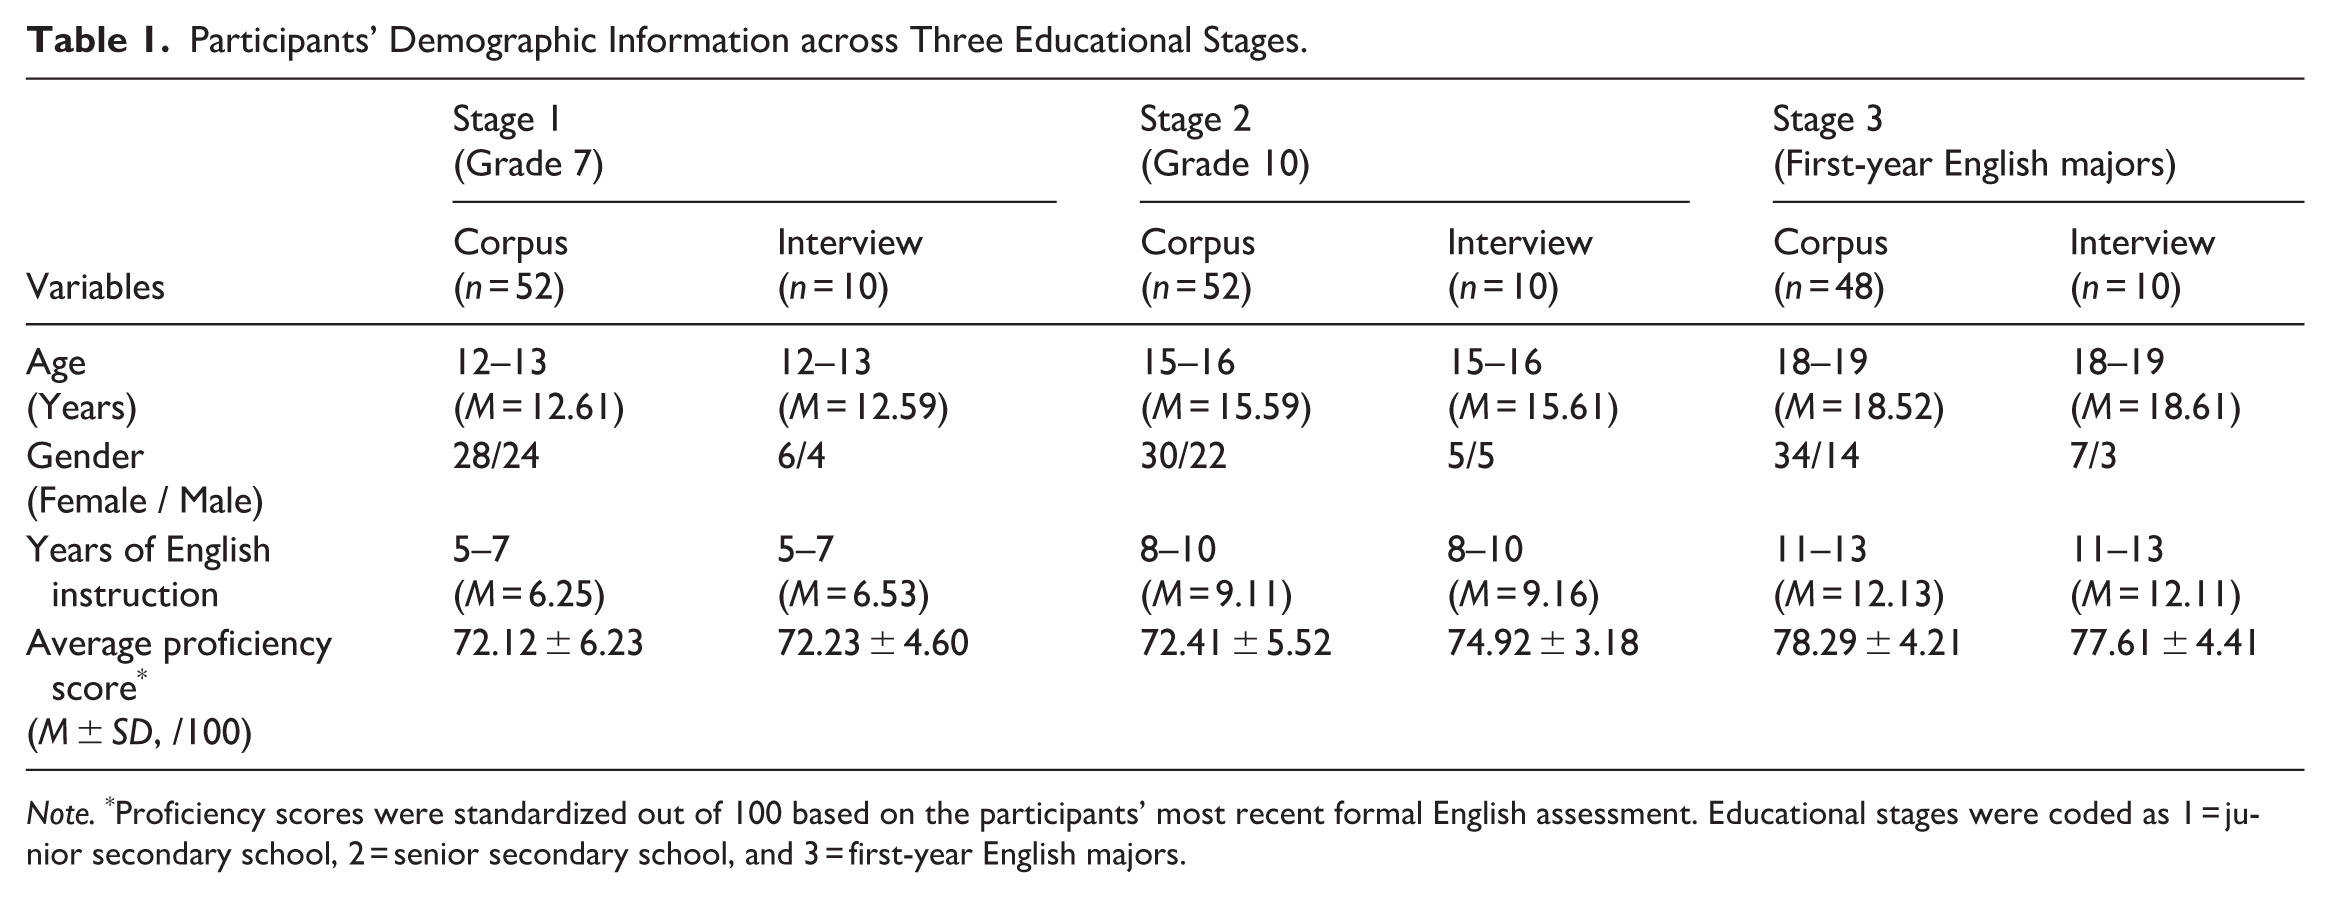
Note. *Proficiency scores were standardized out of 100 based on the participants’ most recent formal English assessment. Educational stages were coded as 1 = junior secondary school, 2 = senior secondary school, and 3 = first-year English majors.
The SCCLE corpus employed in this study was developed by the School of International Studies, Northeast Normal University, China (Zhang, 2021). It contained 494 oral samples from 47 middle schools and 4 universities. The tasks included in this corpus consisted of free dialogues and picture-description tasks. Dialogue topics (e.g., extracurricular activities, favorite food, pocket money, exercise habits, and gaming debates) were moderately challenging yet closely related to learners’ daily lives, which ensured topic familiarity. The picture-description task required describing a school layout (Figure 2). Each recording lasted up to 20 minutes without prior preparation. This study analyzed only the picture-description data.
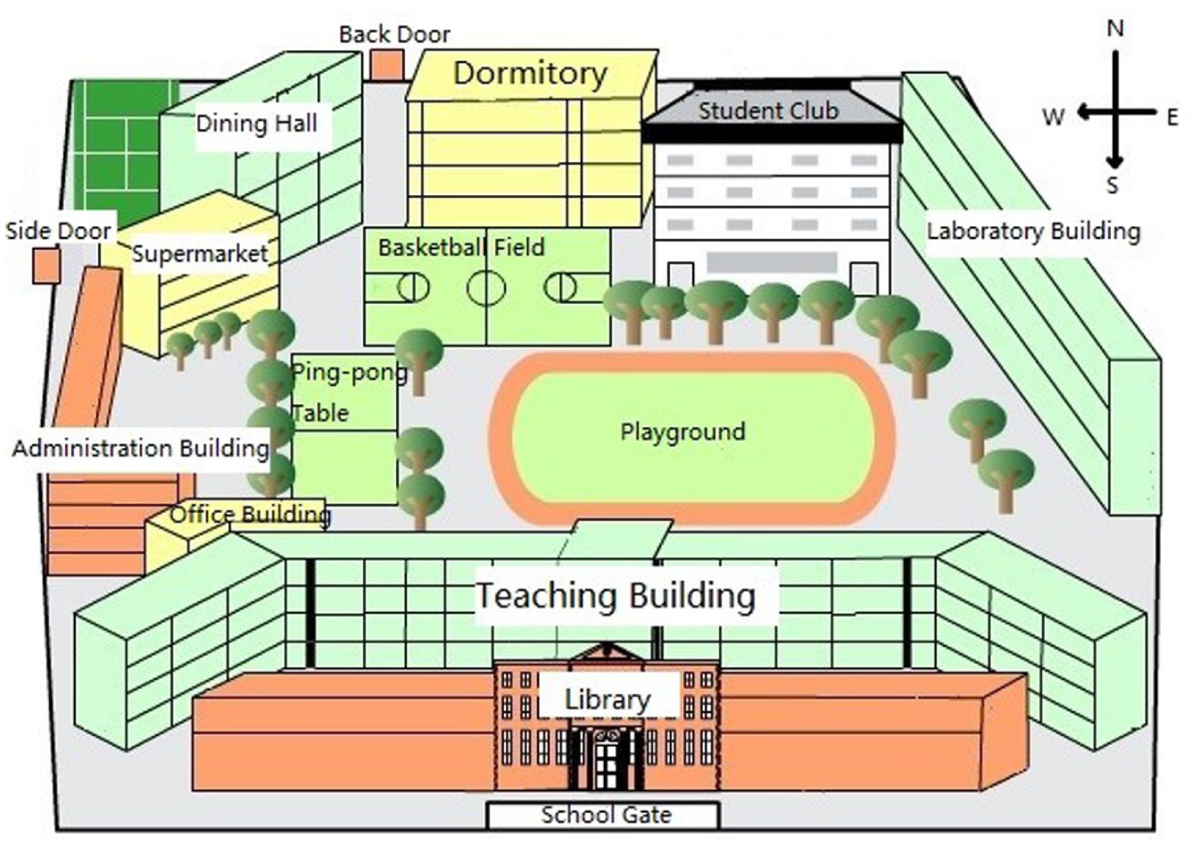
Map of the picture-description task.
Moreover, semi-structured interviews (n = 30) were designed by researchers to probe into oral fluency characteristics. The protocol was developed based on prior research (Segalowitz, 2010; Tavakoli & Hunter, 2018), piloted with five learners, and subsequently refined for clarity. The final version was reviewed by researchers to ensure content validity (see Appendix).
3.3. Data Analysis
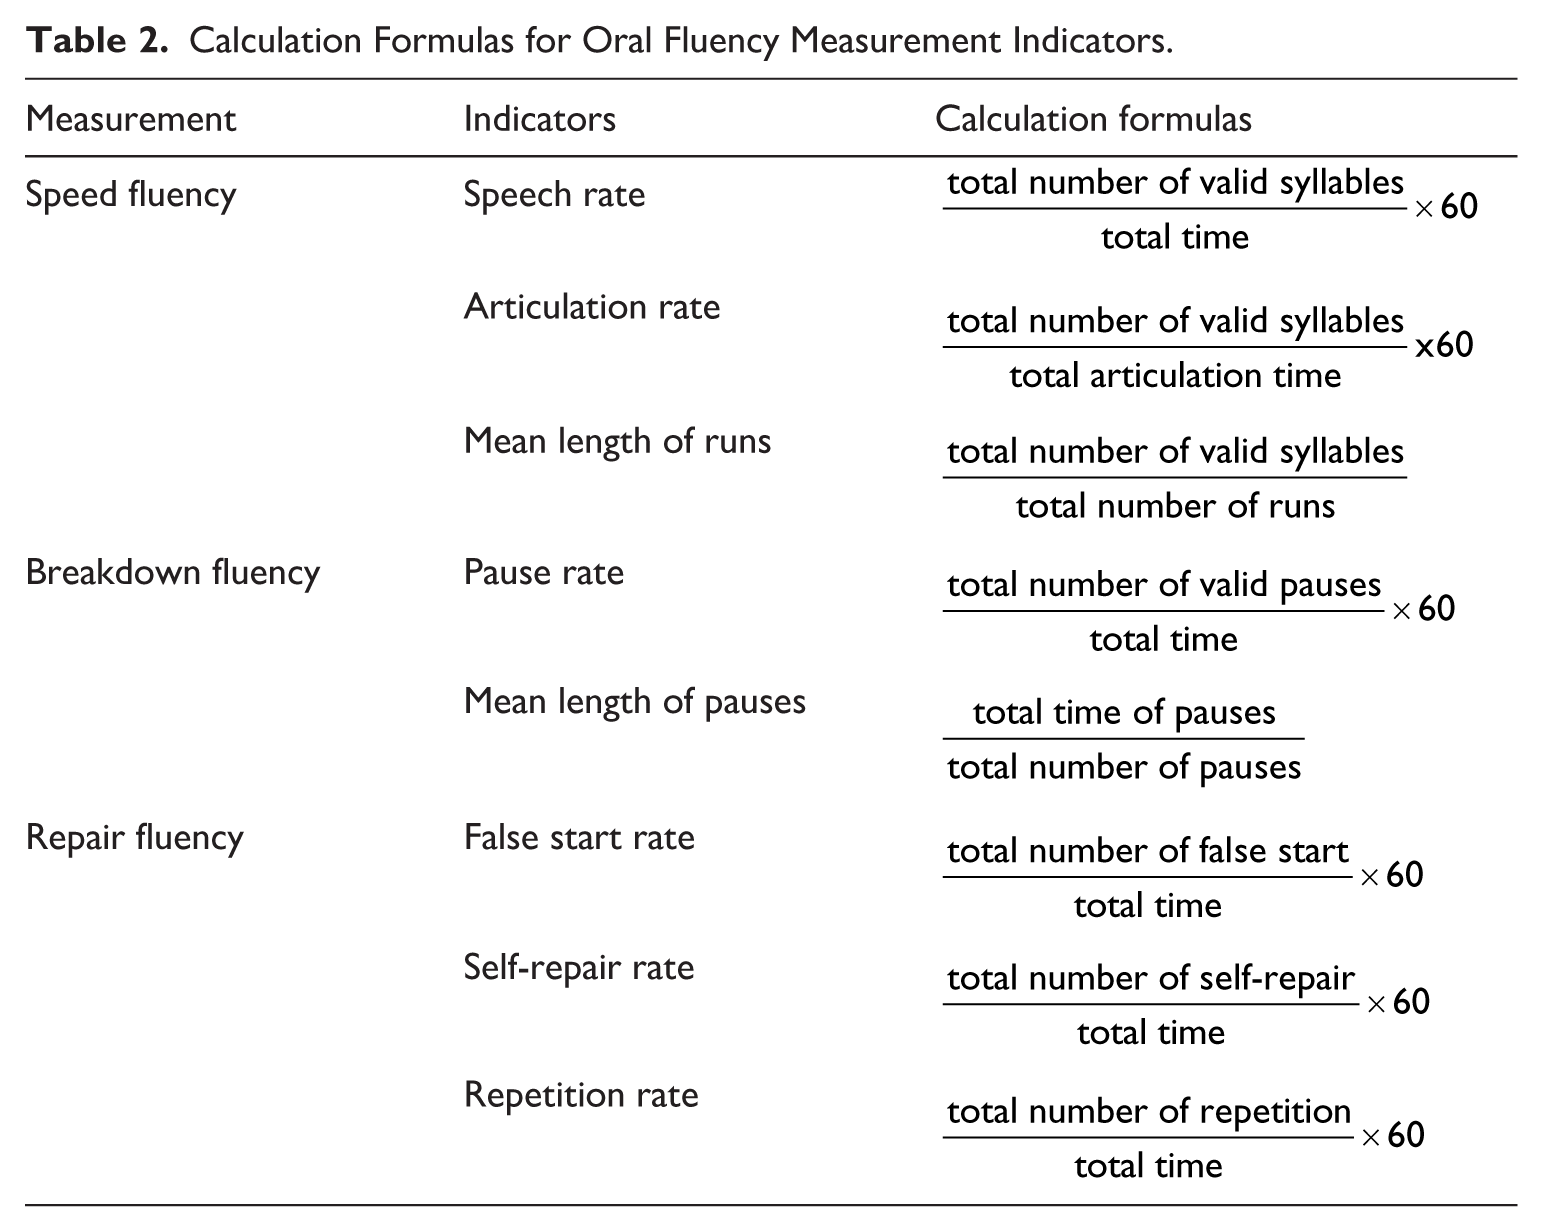
Oral fluency was examined across three dimensions: speed, breakdown, and repair fluency, each of which was operationalized following Tavakoli and Skehan (2005). The measurements for the three fluency dimensions, which have been widely adopted by previous researchers (Albarqi, 2025; Albarqi & Tavakoli, 2023; Iwashita et al., 2008; Kormos, 2014; Kormos & Dénes, 2004; Suzuki & Kormos, 2023, 2024; Towell et al., 1996), are summarized in Table 2.
Calculation Formulas for Oral Fluency Measurement Indicators.
For the calculation of speed and breakdown fluency, oral productions were processed as follows. Syllable counts were obtained using SyllableCount, 2 and speech duration was calculated in Praat (Version 6.1.48). Pauses, defined as 0.30 seconds or longer (Raupach, 1980; B. Wang & Li, 2015), were also identified in Praat. To standardize the data for further analysis, each oral production was encoded in the format “[35JC310009]. . .(10.00| 0.32| 35),” where the bracketed code represented the participant’s sequence number in the corpus, and the values in parentheses indicated total speech duration, pause duration, and number of valid syllables. Figure 3 illustrates an example of [35JC310009], showing a total speech duration of 169.77 seconds (excluding 8.83 seconds from Speaker 1) with six pauses, the first lasting 9.25 seconds.
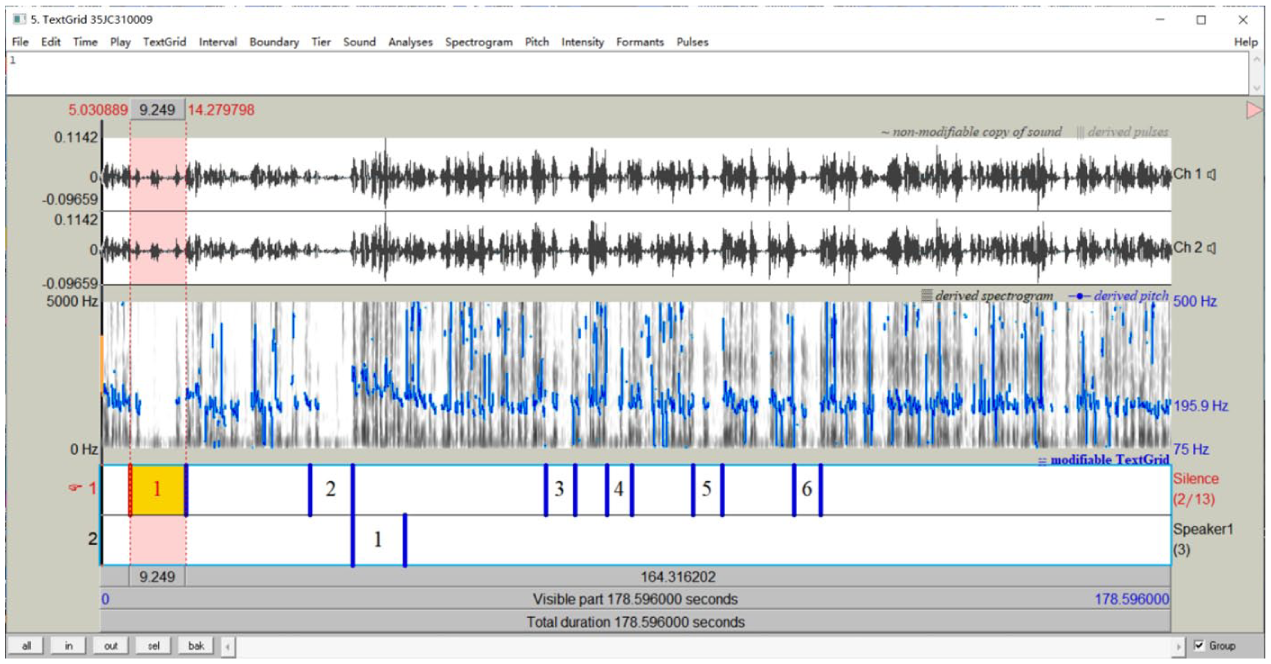
The operating interface of Praat.
For the calculation of repair fluency, three repair types were annotated first. Following Foster et al. (2000), these include false starts (FS), in which an utterance is abandoned or reformulated after initiation; self-repairs (SR), where speakers modify utterances during or immediately after production; and repetitions (R), in which parts of words, whole words, phrases, or entire sentences are repeated to maintain the turn and plan subsequent content. Accordingly, these repair types were identified through manual annotation in AntConc (Version 3.5.7) by researchers. Inter-rater agreement for all annotated indicators was assessed using Cohen’s kappa in SPSS (Version 26), with values ranging from 0.91 to 0.95 (all p < .001).
Thereafter, SPSS was adopted for quantitative analyses. To test stage effects while controlling for covariates of learners’ age and years of English instruction, the analysis of covariance (ANCOVA) was performed (Field, 2018). Assumptions of normality, homogeneity of variances and regression slopes, linearity, and the treatment effects of covariates were verified with the Shapiro-Wilk, Levene’s tests, scatterplots, and the examination of the ANCOVA model, respectively. Estimated marginal means (EMMs) and Bonferroni-adjusted pairwise comparisons were then reported to determine which specific groups differed significantly from each other.
For qualitative data, a thematic analysis using NVivo (Version 13) was conducted to identify recurring themes influencing fluency characteristics. The coding framework, informed by prior research (Cai & Zhang, 2023; Garcia-Ponce, 2023; Mareková & Beňuš, 2024; Nematizadeh & Wood, 2019; Pérez, 2019; Szyszka & Lintunen, 2026; Xuan et al., 2021) and pilot testing, was refined through a data-driven process to expand categories and identify subthemes across stages. Following Braun and Clarke’s (2006) six-step procedure, the transcripts were read repeatedly to generate initial open codes. To illustrate, excerpts describing learners’ hesitation, nervousness, or worry during speaking were coded as “speaking anxiety,” contributing to the broader theme “emotional factors.” Similarly, codes such as “peer practice,” “communicating with foreigners,” and “self practice” were grouped into the category “after-class activities,” forming part of the theme “learning experience.” In addition, codes such as “habitual use of filled pauses,” “lack of vocabulary,” and “uncertainty in pronunciation” were synthesized into the category “challenges in oral production,” contributing to the theme “perception of oral fluency.” Through continuous comparison and refinement, related categories were collapsed or differentiated, resulting in a three-level coding structure (open codes, categories, and themes) for subsequent reporting of qualitative findings.
4. Results
4.1. Quantitative Results
Prior to conducting ANCOVA to examine oral fluency across three educational stages, all relevant assumptions were evaluated and met. Normality tests indicated that all variables were approximately normally distributed (p < .05). Linearity between covariates and dependent variables was confirmed through scatterplot inspection. Homogeneity of variances was assessed with Levene’s test, showing no significant violations for most indicators (p < .05). In addition, the assumption of homogeneity of regression slopes was also met, confirming that the relationship between covariates and dependent variables was consistent across groups. Finally, the covariates were independent of the treatment effects. These results confirmed that ANCOVA could be appropriately applied.
In response to the characteristics of oral fluency across three educational stages, the statistical results are presented in four tables. Table 3 reports descriptive statistics; Table 4 summarizes ANCOVA results controlling for age and years of instruction; Table 5 presents adjusted means (EMMs); and Table 6 displays Bonferroni-adjusted pairwise comparisons of stage differences.
Statistics on Oral Fluency Indicators across Stages.
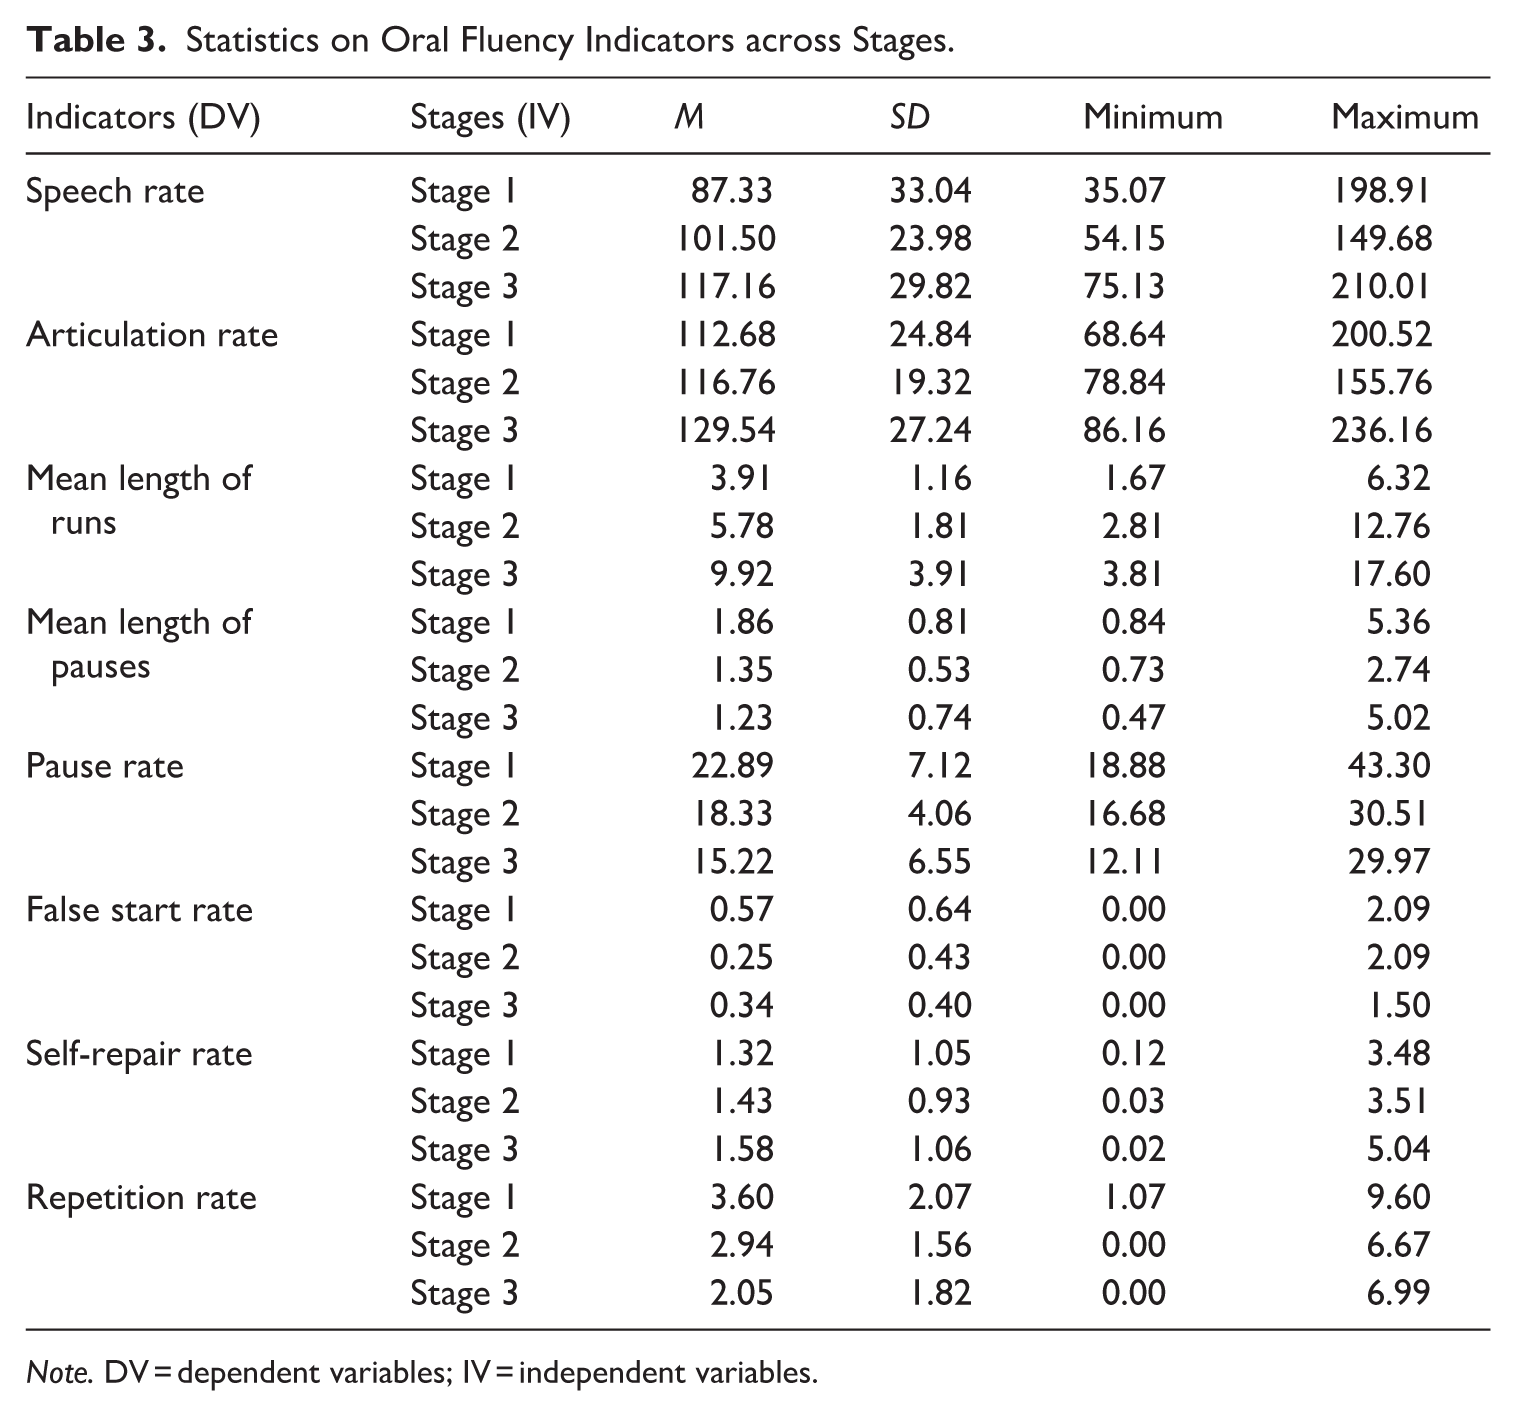
Note. DV = dependent variables; IV = independent variables.
Analysis of covariance (ANCOVA) Results for Oral Fluency Indicators across Stages.
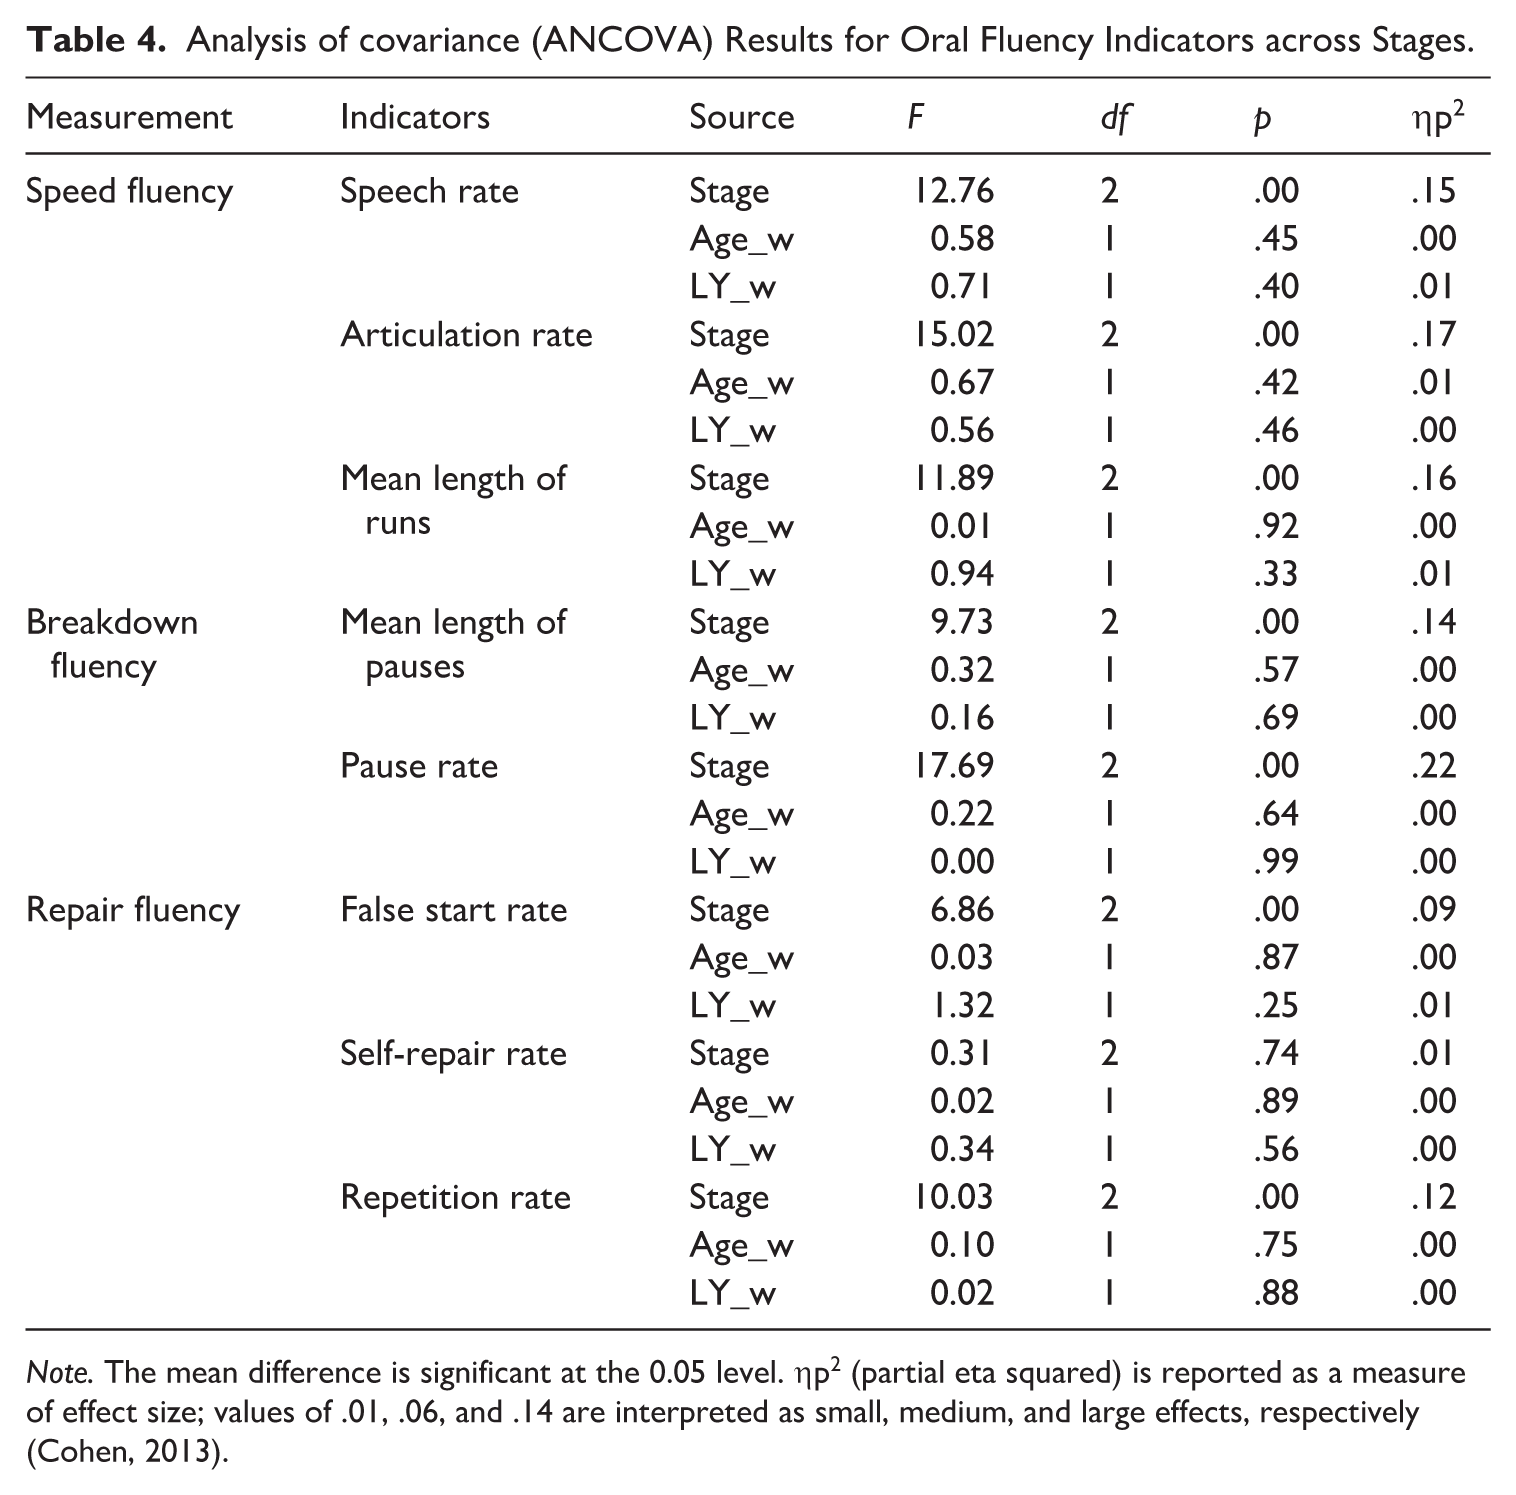
Note. The mean difference is significant at the 0.05 level. ηp2 (partial eta squared) is reported as a measure of effect size; values of .01, .06, and .14 are interpreted as small, medium, and large effects, respectively (Cohen, 2013).
Estimated Marginal Means (EMMs).
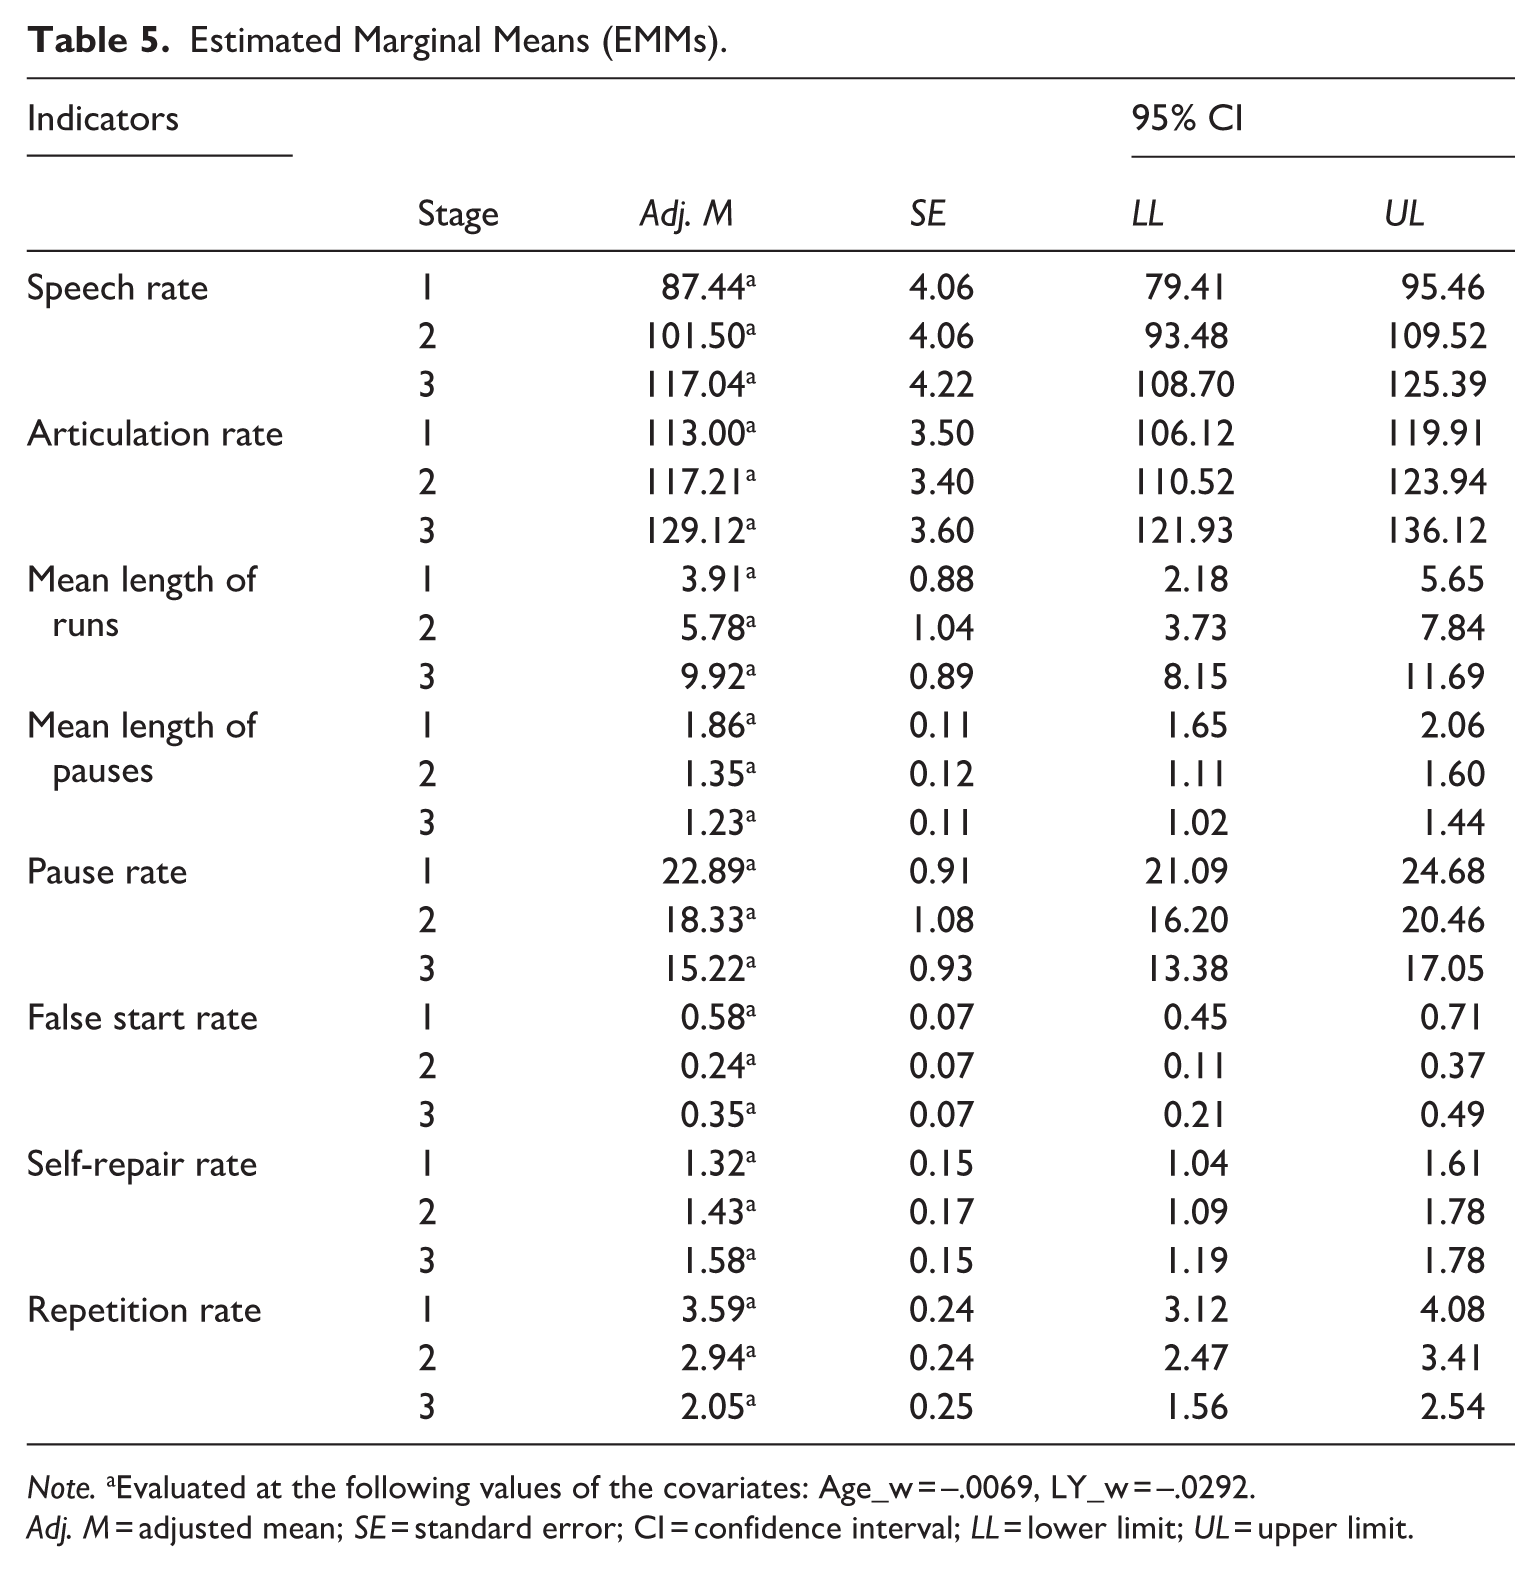
Note. aEvaluated at the following values of the covariates: Age_w = –.0069, LY_w = –.0292.
Adj. M = adjusted mean; SE = standard error; CI = confidence interval; LL = lower limit; UL = upper limit.
Bonferroni-Adjusted Pairwise Comparisons Across Stages.

Note. *The mean difference is significant at the .05 level.
4.1.1. Speed Fluency
With regard to speech rate, a steady upward trend was observed from Stage 1 (M = 87.33, SD = 33.04) to Stage 2 (M = 101.50, SD = 23.98) and Stage 3 (M = 117.16, SD = 29.82), indicating that learners produced more syllables per minute as proficiency advanced. Notably, substantial individual differences emerged: some Stage 1 learners (maximum = 198.91) even exceeded the mean value of Stage 3, whereas the lowest value of Stage 3 (75.13) fell below the average of Stage 1. These findings suggested a considerable disparity in speech rate among learners, highlighting significant individual differences and uneven development. ANCOVA confirmed a significant stage effect (F (2, 149) = 12.76, p < .001, ηp2 = .15), while neither age nor years of English instruction was significant as covariates. Adjusted means followed the same trend (Stage 1 = 87.44; Stage 2 = 101.50; Stage 3 = 117.04). Pairwise comparisons further indicated significant differences among all three groups but with varied degree. The increase from Stage 1 to Stage 2 reached significance (p = .05) but was relatively modest. By contrast, the improvement from Stage 2 to Stage 3 (p = .03) and especially from Stage 1 to Stage 3 (p < .001) were more pronounced. Overall, these findings indicated consistent progress in speech rate across stages, with more substantial advancement at higher levels alongside notable individual variation.
Concerning articulation rate, values increased from Stage 1 (M = 112.68, SD = 24.84) to Stage 2 (M = 116.76, SD = 19.32) and Stage 3 (M = 129.54, SD = 27.24), reflecting improved ability to maintain continuous speech as proficiency advanced. Also, individual variation was again substantial, with the maximum value in Stage 1 (200.52) exceeding even the mean of Stage 3, while the minimum in Stage 3 (86.16) fell below the average of Stage 1. These results indicated that, similar to speech rate, articulation rate displayed strong individual variability within each stage, reflecting uneven developmental patterns among learners. ANCOVA revealed a significant main effect of stage (F (2, 149) = 15.02, p < .001, ηp2 = .17) with no significant influence from covariates. Adjusted means followed the same upward pattern (Stage 1 = 113.00; Stage 2 = 117.21; Stage 3 = 129.12). Pairwise comparisons indicated that Stage 3 significantly outperformed both Stage 1 (p < .001) and Stage 2 (p = .01), while the difference between Stages 1 and 2 was not significant (p = .35). These results suggested that notable improvements in articulation rate emerged only at university level, whereas progress from Stages 1 to 2 was limited.
For mean length of runs, values increased moderately from Stage 1 (M = 3.91) to Stage 2 (M = 5.78), followed by a sharp rise at Stage 3 (M = 9.92). ANCOVA revealed a significant stage effect (F (2, 149) = 11.89, p < .001, ηp2 = .16) after controlling covariates. Adjusted means showed a same upward trend (Stage 1 = 3.91; Stage 2 = 5.78; Stage 3 = 9.92). Pairwise comparisons further confirmed the non-significant difference between Stage 1 and Stage 2 (p = .51) but a significant improvement from Stage 2 to Stage 3 (p = .01), suggesting that learners’ ability to produce longer utterances improved significantly only at the university level. Moreover, individual variation was the most evident within Stage 3. Although some learners maintained a minimum value comparable to lower proficiency levels, others achieved values several times higher, revealing extremely unbalanced development in this stage. To illustrate oral production features, representative 10-second samples are presented below.
I can see <pause: 1.28> a back door <pause: 1.32> in the <pause: 0.82> front of this <pause: 1.49> field (10.00| 4.91| 12) (Stage 1: [29HA210001])
And (a school)<SR>, a middle school has a supermarket and dining hall. Beside <pause: 0.52> (it is a side door)<SR>, it’s a side door (10.00| 0.52| 22) (Stage 2: [03JA320007])
We will see another building, that is laboratory building. <pause: 0.38> And then we can go along the laboratory building and turn left (10.00| 0.38| 35) (Stage 3: [15JD440001])
As shown in the sample excerpts, learners at lower stages tended to pause more frequently and produced fewer valid syllables within the same time span. In Example 1 from Stage 1, the utterance was fragmented with long pauses between short phrases, yielding limited syllable production. Similarly, the Stage 2 excerpt in Example 2 contained repeated self-repairs and hesitations, further disrupting fluency and constraining articulation rate. By contrast, Example 3 from Stage 3 demonstrated longer stretches of continuous speech with fewer interruptions, enabling the learner to articulate more syllables and extend the mean length of runs.
To conclude, three indicators of speed fluency demonstrated clear characteristics across stages. Speech rate showed steady improvement with each stage, articulation rate displayed marked gains only at the university level, and mean length of runs advanced most significantly from senior secondary to university level. Nonetheless, large individual differences persisted within all stages, indicating uneven fluency development among learners.
4.1.2. Breakdown Fluency
For mean length of pauses, it exhibited a significantly nonlinear decreasing trend (Stage 1: 1.86 < Stage 2: 1.35 < Stage 3: 1.23), indicating that learners required shorter pauses as proficiency advanced which enabled more efficient delivery. ANCOVA revealed a significant main effect of stage (F (2, 149) = 9.73, p < .001, ηp2 = .14) with no covariate effects. Adjusted means fell from 1.86 in Stage 1 to 1.35 in Stage 2, reaching 1.23 in Stage 3. Pairwise comparisons further showed significant differences between Stage 1 and both Stage 2 (p = .01) and Stage 3 (p < .001), whereas the difference between Stage 2 and Stage 3 was not significant (p = 1.00). These results suggested that pause duration decreased considerably from junior to senior secondary level, with minimal change observed thereafter.
For pause rate, mean values decreased significantly from Stage 1 (M = 22.89, SD = 7.12) to Stage 2 (M = 18.33, SD = 4.06) and Stage 3 (M = 15.22, SD = 6.55), suggesting that learners produced fewer pauses per minute with increasing proficiency. ANCOVA confirmed a significant stage effect (F (2, 149) = 17.69, p < .001, ηp2 = .22) with no covariate effects. Adjusted means showed a decreasing pattern across stages, from 22.89 in Stage 1 to 18.33 in Stage 2 and 15.22 in Stage 3. Pairwise comparisons revealed significant differences across all stages (Stage 1 vs. Stage 2: p = .01; Stage 2 vs. Stage 3: p = .03; Stage 1 vs. Stage 3: p < .001), showing a gradual reduction, most pronounced between junior secondary and university levels. Considerable individual variation still persisted, as some Stage 3 learners exceeded the mean of Stage 1 while others reached far lower values, reflecting uneven development within groups. Specific examples illustrating pause occurrences can be found in Section 4.1.1 (Examples 1–3).
4.1.3. Repair Fluency
Repair fluency was assessed through false start rate, self-repair rate, and repetition rate. False start rate exhibited a U-shaped pattern with mean values declining substantially from Stage 1 (M = 0.57, SD = 0.64) to Stage 2 (M = 0.25, SD = 0.43) before rebounding slightly at Stage 3 (M = 0.34, SD = 0.40). ANCOVA confirmed a significant stage effect (F (2, 149) = 6.86, p < .001, ηp2 = .09) with no covariate effects. Adjusted means exhibited a similar U-shaped trend, initially decreasing from 0.58 in Stage 1 to 0.24 in Stage 2 before increasing to 0.35 in Stage 3. Pairwise comparisons further revealed a significant difference between Stage 1 and Stage 2 (p < .001), no difference between Stage 2 and Stage 3 (p = .76), and a marginal difference between Stage 1 and Stage 3 (p = .05). These results suggested that learners were able to reduce false starts markedly by the senior secondary stage but showed no further improvement at the university level. Nevertheless, the overall decreasing trend across three stages remained evident, reflecting a certain degree of progress of learners’ control over false starts.
Self-repair rate, in contrast, demonstrated a non-significant upward trend, rising slightly from Stage 1 (M = 1.32, SD = 1.05) to Stage 2 (M = 1.43, SD = 0.93) and Stage 3 (M = 1.58, SD = 1.06). Adjusted means showed a similar upward trend (Stage 1 = 1.32; Stage 2 = 1.43; Stage 3 = 1.58). Furthermore, neither ANCOVA nor pairwise comparisons detected significant differences. These results indicated that learners tended to produce more self-repairs at higher stages, reflecting increased monitoring of speech, but the growth was slight and not statistically distinguishable across stages.
For repetition rate, values declined steadily across stages, from Stage 1 (M = 3.60, SD = 2.07) to Stage 2 (M = 2.94, SD = 1.56) and Stage 3 (M = 2.05, SD = 1.82), indicating that learners at higher stages produced fewer repetitions and demonstrated greater fluency. Notably, even zero repetitions were observed in some instances within Stages 2 and 3. A consistent reduction in adjusted means was observed across the stages (Stage 1 = 3.59; Stage 2 = 2.94; Stage 3 = 2.05). ANCOVA confirmed a significant stage effect (p < .001). Pairwise comparisons revealed that Stage 3 was significantly lower than both Stage 1 (p < .001) and Stage 2 (p = .03), while the difference between Stages 1 and 2 was not significant (p = .17). To further illustrate learners’ speech features, representative 40-second excerpts are provided below.
4. [It is]<FS>, {there is}<R>, there is ping-pong table. Across from the ping-pong table, it is {ad}<R>, {ad}<R>, {admini}<R>, administration building. [Two doors]<FS>, the middle school has two doors . . . And there is a dining hall beside the (remi-)<SR>, {the}<R>, {the}<R>, {the}<R>, beside the {dormitory}<R>. (Stage 1: [29HA210009])
5. I see a playground in the middle of the school, and (in)<SR>, (at the)<SR>, {in front of}<R>, in front of the teaching building is a library and (a school)<SR>, a middle school has a supermarket and dining hall. Beside {it is a side door}<R>, it’s a side door, and dormitory is (in front of)<SR>, behind of the . . . (Stage 2: [03JA320007])
6. It is a very traditional middle school, I just can see the dormitory, dining hall, supermarket, seems like my middle school. {If I were a}<R>, if I were a student in kind of this school, I will feel boring because I don’t like my middle school. In my middle school, we also have a supermarket and it has<SR>, it is a two-floor supermarket . . . (Stage 3: [15JD440001])
As illustrated in the sample excerpts, learners at lower stages (Examples 4 and 5) frequently produced repairs, mainly confined to lexical retrieval and phonological accuracy. Words such as “administration” or “dormitory” were repeatedly abandoned and restarted, suggesting difficulties in both pronunciation and lexical access. Such repairs disrupted fluency and often resulted in fragmented utterances. In contrast, the Stage 3 excerpt (Example 6) reflected a qualitative shift in the nature of repairs. Rather than focusing on isolated words, university learners engaged in repairs to expand, refine, or supplement their content, indicating that repair behavior increasingly functioned as a strategic resource for elaboration and precision rather than merely as a response to lexical or phonological difficulties.
In summary, apart from self-repair rate which showed limited improvement, all other dimensions of oral fluency demonstrated varying degrees of progress. In addition, considerable individual variation persisted across dimensions within each stage, highlighting the uneven nature of oral fluency development.
4.2. Qualitative Results
Thematic analysis of the interview data yielded three themes: learning experience, emotional factors, and perception of oral fluency, which were the major influencing factors found in the present study (Table 7).
Factors Influencing Oral Fluency across Three Stages.
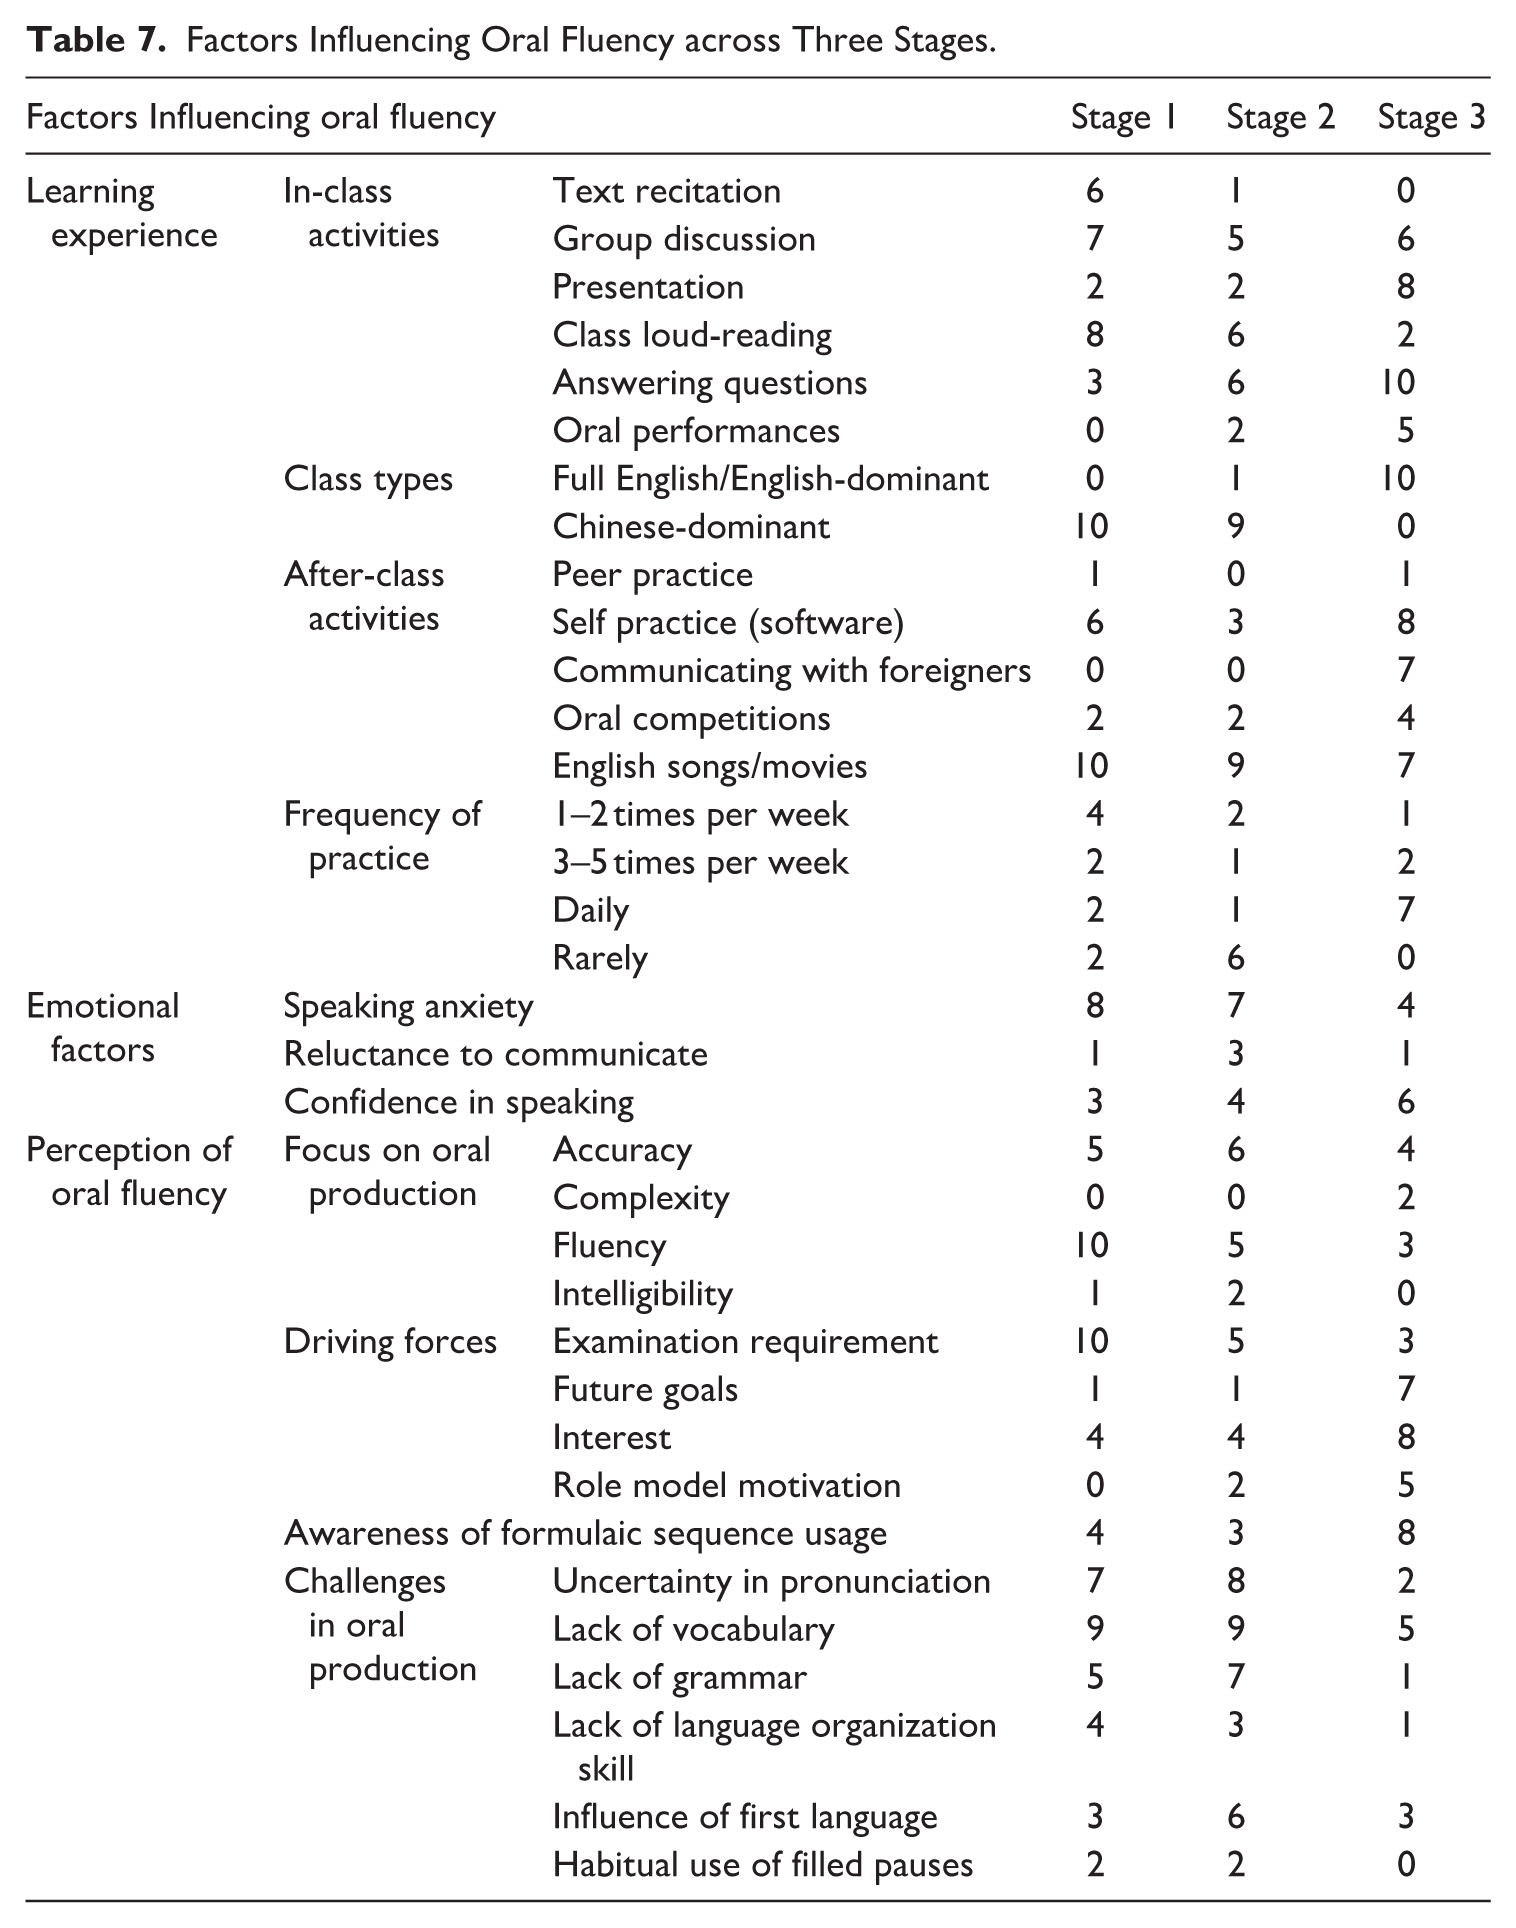
4.2.1. Learning Experience
Four categories were found from the interview data of learning experience, which were in-class activities, class types, after-class activities, and frequency of practice.
4.2.1.1. In-Class Activities and Class Types
Interview data revealed two types of in-class oral activities: mechanical, repetitive tasks versus interactive, authentic tasks with higher cognitive demands. Specifically, activities in Stage 1 were predominantly structured and repetitive. As one participant named John 3 (age = 12) explained: “We usually read the text out loud together . . . We’re asked to memorize the whole text” (Excerpt 1; Theme: Learning experience). Similar accounts were common, with most learners reporting frequent engagement in class loud-reading (n = 8) and text recitation (n = 6).
In contrast, Stage 3 learners reported more cognitively demanding tasks, involving group discussions (n = 6) and presentations (n = 8). One participant, Mary (age = 18), recalled: “We have many interesting activities like presentations, role-plays, speech contests, and performances” (Excerpt 2; Theme: Learning experience), which illustrated the greater frequency and variety of authentic communicative opportunities at higher stages. Stage 2 represented a transitional pattern, characterized by a combination of repetitive, exam-oriented practices and occasional, teacher-guided interactive activities, as illustrated in the following interview excerpt. One participant, Peter (age = 15), shared this: “What impressed me most was when we studied The Million Pound Bank Note. The teacher asked us to do a role-play, and I played Henry. It was quite fun, and I even tried to memorize a few lines” (Excerpt 3; Theme: Learning experience). Notably, oral activities became more frequent and diverse across stages, offering greater opportunities for authentic communication at higher levels.
Regarding class types, only university students (n = 10) received full English instruction, whereas most Stage 1 and 2 learners experienced Chinese-dominant classrooms. As Peter explained: “Our lessons mainly focus on explaining vocabulary and grammar points in Chinese. Most of the time was spent going through exercises and explaining the answers” (Excerpt 4; Theme: Learning experience). Remarkably, even learners in urban key schools had limited access to target language immersion; instead, they experienced mechanized teaching practices that curtailed authentic L2 input and reduced opportunities for meaningful communication. Consequently, these constraints restricted learners’ ability to generate ideas and formulate utterances spontaneously.
4.2.1.2. After-Class Activities
After-class activities could be summarized into two types: receptive exposure (e.g., songs and movies) and productive practice (e.g., peer or self practice).
In Stage 1, learners (n = 10) frequently reported watching English movies or listening to songs, reflecting their relatively abundant leisure time available at lower educational stage. As one learner, Amy (age = 13), shared: “I really like Harry Potter. I have watched the series nearly ten times” (Excerpt 5; Theme: Learning experience). Several (n = 6) also noted the school-recommended use of oral practice software, demonstrating policy-driven requirements at the compulsory stage. Stage 2 learners expressed similar interests in music and films but engaged less in speaking practice beyond occasional software use (n = 3). One participant, Alex (age = 16), noted: “I watch English cartoons and sing along with songs, but I usually read the Chinese subtitles . . . I seldom practice oral English after class” (Excerpt 6; Theme: Learning experience). Such accounts highlighted the continued predominance of receptive activities at this stage, with limited progress in productive practice.
By contrast, Stage 3 participants described a broader range of after-class activities, including regular self practice with oral apps (n = 8) and interacting with foreigners (n = 7). As Mary reflected: “I often talk to my foreign teacher since we have become friends” (Excerpt 7; Theme: Learning experience). Such interactive practices provided authentic contexts for language use beyond the classroom.
Overall, the findings indicated a shift from predominantly receptive exposure at earlier stages to more varied and productive engagement at the university level, reflecting greater participation in authentic environments that foster fluency development.
4.2.1.3. Frequency of Practice
Practice frequency varied significantly across groups. In Stage 1, most learners reported practicing only once or twice per week (n = 4), mainly for examinations or assignments. As Amy noted: “We have oral test, so our school asks us to practice listening and speaking with software after class” (Excerpt 8; Theme: Learning experience), suggesting that practice was limited and institution-driven rather than self-initiated. Stage 2 showed a comparable pattern, with several (n = 6) reporting that heavy workloads restricted their opportunities to practice. One participant, Luke (age = 12), shared that “I usually practice speaking English like once or twice a week. But because there’s so much homework, I don’t really have time for it. I only get to practice more when we do speaking activities in class” (Excerpt 9; Theme: Learning experience). These comments underscored the restricted and irregular nature of practice at this stage.
By contrast, Stage 3 learners exhibited a substantial increase in practice frequency, with most (n = 7) practicing daily. As Mary commented: “We have foreign teacher classes, so there are many opportunities to practice oral English” (Excerpt 10; Theme: Learning experience). Such frequent and authentic practice played a central role in strengthening their spoken fluency.
Overall, the findings revealed a clear progression in practice frequency, shifting from sporadic, exam-oriented activities at the lower stages to more consistent and authentic use at the university level, which highlights the importance of regular language use in fostering fluency.
4.2.2. Emotional Factors
Three categories were observed under emotional factors, which are speaking anxiety, reluctance to communicate, and confidence in speaking.
In Stage 1, learners frequently reported strong speaking anxiety (n = 8) when engaging in oral tasks which often led to nervousness and hesitation. As Luke reflected: “I feel nervous when I am asked to talk to people in English” (Excerpt 11; Theme: Emotional factors). Such comments illustrated how anxiety constrained spontaneous engagement in oral English at lower educational stage.
In Stage 2, speaking anxiety remained a salient issue (n = 7), particularly concerning pronunciation and grammar. One participant, Haley (age = 16), explained: “Every time when I answer questions, I feel very nervous because I’m not quite sure if my pronunciation is correct, and I’m afraid of being laughed at” (Excerpt 12; Theme: Emotional factors). These responses emphasized how accuracy concerns translated into reluctance to speak, thereby limiting opportunities to practice speech planning.
By contrast, Stage 3 learners demonstrated greater confidence in speaking (n = 6), despite occasional anxiety (n = 4). As Mary explained: “I think it’s normal to make mistakes when practicing English, as long as everyone can understand” (Excerpt 13; Theme: Emotional factors). This attitude shift toward error tolerance reflected a developmental transition from avoidance to active engagement.
Overall, lower-level learners were constrained by fear and reluctance, whereas higher-stage learners increasingly exhibited confidence and communicative willingness, marking an important emotional shift in the process of fluency development.
4.2.3. Perception of Oral Fluency
Four categories emerged regarding learners’ perception of oral fluency: focus on oral production, driving forces, awareness of formulaic sequence usage, and challenges in oral production.
In Stage 1, fluency was often equated with speed and the ability to speak without pauses (n = 10). As Amy explained: “For me, being fluent means I can talk without stopping. But when I forget words, I don’t know how to continue, and sometimes I need more time to think how to say the word” (Excerpt 14; Theme: Perception of oral fluency). Such accounts highlighted how learners prioritized continuous speech over accuracy or complexity. Examination requirements were the primary motivator (n = 10). Reported challenges centered on lexical difficulties, especially pronunciation and limited vocabulary, followed by syntactic and discourse-level problems, all of which undermined confidence and restricted expression.
Stage 2 participants retained a focus on fluency but increasingly emphasized correctness in pronunciation and grammar. As Alex commented: “I can say words I’ve learned, but I always worry if the sentences I made are grammatically correct” (Excerpt 15; Theme: Perception of oral fluency). This indicated a shift toward balancing speed with accuracy and clarity. Moreover, intelligibility was also highlighted in this stage (n = 4). Examination demands were still a major motivator (n = 5), but interest and self-improvement started to emerge (n = 4). Challenges remained mainly at lexical and syntactic levels, with many citing pronunciation difficulties (n = 8), limited vocabulary (n = 9), and uncertainty in grammar (n = 7). Awareness of formulaic sequences appeared sporadically (n = 3), suggesting a gradual shift toward more strategic competence.
In Stage 3, learners presented a more balanced and strategic understanding of fluency, valuing not only continuous flow (n = 3) but also accuracy (n = 4) and complexity (n = 2). As one participant, Gloria (age = 18), reflected: “Sometimes after starting to share my opinions, I realize there is a better way to express them that gets my point across more appropriately, so I change how I say it” (Excerpt 16; Theme: Perception of oral fluency). Such responses also helped explain the increase in self-repairs. Meanwhile, motivations became increasingly intrinsic, with many citing interest in English (n = 8), future goals (n = 7), or inspiration from role models (n = 5). Challenges shifted toward discourse-level concerns, including idea organization and precision of expression, while lexical difficulties still persisted, particularly in word choice (n = 5). Overall, as proficiency advanced, learners shifted from prioritizing fluency, to integrating intelligibility, and ultimately to valuing precision and appropriateness through self-repairs.
In summary, the qualitative findings revealed three major themes influencing oral fluency characteristics across educational stages, which were learning experience, emotional factors, and perception of oral production. Correspondingly, the challenges learners faced evolved from basic lexical and pronunciation issues to more complex syntactic and discourse-level difficulties at higher stages. Together, these findings provided a more comprehensive understanding of the factors shaping oral fluency characteristics and complemented the previously reported quantitative results.
5. Discussion
The present study aimed to investigate the characteristics of oral fluency across educational stages, addressing a gap in the literature regarding how speed, breakdown, and repair fluency differ from junior to senior secondary and finally to the English-major freshman level. Specifically, it sought to explore not only quantitative trends in fluency measures but also the qualitative factors influencing learners’ oral production. In response to this research purpose, this section discusses the observed patterns of speed, breakdown, and repair fluency, along with possible reasons for the variation in their characteristics in light of previous research. Quantitative analyses revealed distinct trends: speed fluency demonstrated consistent improvement as proficiency levels advanced, breakdown fluency showed a steady decline, and repair fluency exhibited an imbalanced trajectory. These results could be accounted for by Kormos’ (2014) Bilingual Speech Production Model. In addition, the qualitative findings highlighted three factors that influenced fluency characteristics.
5.1. Speed Fluency
In response to research question 1 regarding the characteristics of speed fluency across three educational stages, quantitative results revealed significant differences in all three indicators of speed fluency, with particularly pronounced growth between Stages 2 and 3. This indicated overall improvement in learners’ ability to produce faster and longer stretches of speech as proficiency advanced. These findings were in agreement with Pan (2013), Albarqi (2025), and Yan et al. (2025), who also observed better speed fluency of learners at higher proficiency.
Specifically, speech rate improved significantly across stages, reflecting faster overall delivery as learners progressed. According to Kormos’ (2014) model, its development is strongly tied to learners’ ability to conceptualize messages, retrieve lexical-grammatical information, and reduce hesitation. At lower stages, limited exposure to authentic communication and reliance on repetitive practices constrained opportunities to practice rapid message generation. In contrast, Stage 3 learners benefited from dynamic learning environments with frequent English exposure, fully English-taught classes, and interactive tasks, which facilitated more efficient conceptualization and formulation, leading to faster and smoother speech production. Such results were in agreement with Hwang (2025), who emphasized the positive role of frequent L2 use, and Troesch et al. (2025), who demonstrated the benefits of extensive L2 exposure. Another salient factor is the use of formulaic sequences which increased gradually across stages. By Stage 3, learners were able to incorporate fixed expressions more naturally into their speech, which alleviated their cognitive load, facilitated faster retrieval, and reduced online processing time. This aligned with Lu (2025) and Tavakoli and Uchihara (2020), who emphasized the role of formulaic sequences in accelerating lexical retrieval and syntactic construction. Emotional factors further shaped performance: anxiety in Stages 1 and 2 hindered information generation and slowed delivery, whereas greater confidence and intrinsic motivation in Stage 3 promoted willingness to communicate and sustained speech. These findings were consistent with W. Wang et al. (2024), who reported that higher emotional intelligence enhanced oral fluency, and Bielak (2025), who found that higher anxiety levels were associated with slower, less fluent speech production.
Articulation rate showed a steady increase across stages, with the most pronounced gains at the university level. This finding was consistent with Albarqi (2025) who reported significant proficiency-related differences in articulation rate. Unlike speech rate, it isolates the speed of actual phonological encoding and articulation, offering a clearer view of whether learners can maintain fast and stable delivery independent of pausing. From the perspective of Kormos’ (2014) model, improvements in articulation rate reflect the increasing efficiency of the formulator and articulator. As proficiency advances, phonological encoding and motor execution become more automatized, reducing working-memory demands and enabling faster, more consistent syllable production once speech begins. Interview data further corroborated the developmental trend. Stage 1 learners often encountered challenges during the encoding process due to limited exposure to English and insufficient language knowledge. Many of them struggled with phonological encoding, often requiring considerable time to process polysyllabic words such as “laboratory,” “administration,” and “dormitory,” resulting in reduced articulation rate and more frequent and prolonged pauses. By contrast, Stage 3 learners described smoother delivery, facilitated by both greater phonological mastery and the ability to retrieve formulaic sequences as holistic units, thereby lowering encoding difficulty. The findings were in agreement with Takizawa et al. (2025) who demonstrated that automatized vocabulary knowledge of higher-proficiency learners played a crucial role in sustaining faster and more stable articulation. Emotional factors also shaped articulation: anxiety at lower stages led to hesitation and slowed pronunciation, while Stage 3 learners’ confidence and frequent practice allowed them to sustain faster articulation without compromising clarity.
Mean length of runs also increased markedly across stages, reflecting learners’ growing ability to sustain longer stretches of continuous speech. This indicator captures not only processing speed but also the scope of discourse planning, revealing whether learners can produce extended segments without being interrupted by pauses. According to Kormos’ (2014) model, longer runs suggest more efficient functioning of the conceptualizer and greater working-memory capacity for holding and realizing larger planning units. At lower stages, learners often struggled with “what to say,” leading to fragmented utterances composed of short phrases separated by long pauses. Interviews confirmed that many Stage 1 learners possessed limited life experiences and underdeveloped L2 episodic memory, which constrained their ability to expand descriptions beyond basic scenes, thereby limiting the length of speech runs. The phenomenon has been significantly improved among higher-proficiency learners, especially those in Stage 3, who demonstrated richer linguistic resources and broader life experiences. Their challenges have shifted to “how to say,” emphasizing the selection of appropriate vocabulary and syntactic structures to achieve more accurate and effective communication. In addition, higher-proficiency learners also exhibited frequent use of formulaic sequences, indicating a repository of conceptual chunks for quick retrieval and conversion into fluent speech. This finding echoed Tavakoli and Uchihara (2020), who emphasized the role of formulaic language in sustaining discourse continuity. Emotional factors also shaped run length: anxiety at lower stages often caused premature breaks and curtailed utterances, whereas higher confidence in Stage 3 encouraged learners to hold the floor and complete longer turns.
Collectively, the results revealed a clear progression in speed fluency as learners advance through the educational stages, which were driven by supportive learning experiences, increased use of formulaic sequences, and positive emotional states, together facilitating the transition from effortful word-by-word production to smoother, more automatic speech.
5.2. Breakdown Fluency
In response to research question 2, which examined the characteristics of breakdown fluency across educational stages, the quantitative results showed a clear downward trend in mean length of pauses, with the most pronounced reduction between Stages 1 and 2. This pattern indicated that lower-proficiency learners required extended time to generate ideas and plan expressions, whereas higher-proficiency learners achieved greater efficiency in information encoding, reflected in shorter and fewer pauses. These findings were consistent with the previous studies (Albarqi, 2025; Albarqi & Tavakoli, 2023; Suzuki & Kormos, 2023; Tavakoli & Uchihara, 2020; Tavakoli & Wright, 2020), which reported that advanced learners displayed fewer and shorter pauses, indicating enhanced speech construction skills and automaticity. According to Kormos’ (2014) model, shorter pauses reflect more efficient conceptualization and formulation, along with improved working-memory management that supports larger planning units before articulation. In this study, learners at lower educational stages frequently reported difficulties with lexical retrieval and pronunciation, which often led to hesitation and prolonged pauses. By contrast, Stage 3 learners benefited from richer exposure and practice, enabling them to resume speaking more quickly after pauses, as reflected in shorter mean pause length. However, development between Stages 2 and 3 appeared to plateau, possibly due to increased discourse complexity and heightened appropriateness monitoring at the university level.
Pause rate also declined significantly across stages, indicating that learners at higher proficiency levels exhibited notable improvements in pausing behavior, which aligned with Albarqi (2025) and Tavakoli and Wright (2020), who reported that high-proficiency learners showed improvements in information retrieval and encoding processes which were accompanied by a reduction in pause frequency. According to Kormos’ (2014) model, improvement in breakdown fluency is closely tied to the automatization of conceptualization and formulation. Difficulties with phonological encoding and lexical retrieval were frequently cited as reasons for hesitation, contributing to slow fluency development in Stages 1 and 2. Emotional factors also emerged as critical: heightened language anxiety increased hesitation, which is consistent with Bielak’s (2025) conclusion that language anxiety negatively affected L2 fluency by increasing cognitive load and disrupting speech planning. In contrast, Stage 3 learners displayed greater confidence, supported by richer learning experiences and familiarity with oral tasks, which enabled smoother and more continuous speech.
Overall, the decline in pause frequency and duration across stages indicated a steady improvement in breakdown fluency, facilitated by expanded language knowledge, greater exposure and practice, and reduced anxiety, which together helped learners plan and produce speech more smoothly, with fewer and shorter pauses.
5.3. Repair Fluency
In response to research question 3, which examined how repair fluency varies across educational stages, the findings revealed several distinct characteristics that set this dimension apart from the speed and breakdown fluency. Unlike the previously discussed two indicators, repair fluency exhibited a unique trajectory. False start rate followed a U-shaped trend, with significant differences across three stages. Learners in Stage 2 produced the fewest false starts, while the rate rebounded slightly in Stage 3, possibly because higher-proficiency learners devoted more attention to the complexity of oral English with more sophisticated structures, which required more frequent monitoring and modification. These findings aligned with Tavakoli et al. (2023), who reported that repair measures did not reliably distinguish between proficiency levels in the International English Language Testing System (IELTS) bands ranging from 5.0 to 7.5.
Repetition rate also reached significant differences, with a nonlinear decline as proficiency increased. As Kormos (2014) noted, repetition functions as a time-gaining mechanism; therefore, fewer repetitions indicate a higher degree of automatization and more available attention resources. This suggests that as learners progress, their online processing improves, reducing the need for frequent repetitions to extend planning time. Notably, several learners in Stages 2 and 3 even produced speech runs without repetitions, indicating a marked reduction in such disfluencies. In addition, the content of repetitions varied across stages. Lower-proficiency learners frequently engaged in phonological repetitions and frequently repeated the word “and” as a filled pause, reflecting weaker phonological encoding capability and reliance on repetition for additional online planning. However, the current findings on repetition rate contrasted with Tavakoli et al. (2017, 2023), who reported no significant differences in repetition across proficiency levels. This discrepancy may be explained by the stages of the learners as well as the variation in task design.
In contrast to these trends, the self-repair rate exhibited no significant differences across stages but showed a steady upward trend, indicating that higher-proficiency learners engaged more frequently in self-repairs. This was consistent with Albarqi (2025), who also reported limited development of repair fluency across proficiency levels, but contrasted with the findings of Tavakoli et al. (2017), who observed that speakers at both ends of the proficiency continuum were less active in reformulating their utterances. The discrepancy may be attributed to the varying proficiency ranges examined in these studies. Moreover, as Brédart (1991) noted, self-repairs encompass both error repairs and appropriateness repairs. The latter do not aim to correct errors but rather refine expressions for greater precision and contextual appropriateness. Therefore, this study posits that the increase in self-repair rate may reflect a dual phenomenon: on one hand, frequent self-repairs could indicate limited linguistic resources (Tree, 1995), as learners might struggle to retrieve or construct appropriate expressions smoothly, especially when handling more complex content; on the other hand, it also potentially signals enhanced self-monitoring abilities and a growing focus on accuracy and complexity. As shown in the interview data, learners at different proficiency levels allocated attention differently in oral production. Learners in Stages 1 and 2 focused primarily on fluency and accuracy of their oral expression, often exhibiting fewer but more error-driven repairs. In contrast, Stage 3 learners placed greater emphasis on accuracy and complexity of lexical choices and sentence structures, as well as the coherence and acceptability of language organization, often prioritizing these aspects over fluency and engaging in more appropriateness self-repairs.
Overall, three primary factors emerged as influential: learning experience, emotional factors, and perception of oral fluency. These factors collectively shaped how effectively learners can plan, process, and produce spoken language, and their interactions can either facilitate or hinder the development of smooth and coherent speech. This underscored the importance of creating engaging, supportive, and awareness-raising learning environments.
6. Conclusion
This study provided a comprehensive analysis of the characteristics of oral fluency development across three proficiency stages, focusing on speed fluency, breakdown fluency, and repair fluency within the framework of Kormos’ (2014) Bilingual Speech Production Model. Drawing on quantitative data and semi-structured interviews, the study demonstrated that oral fluency manifested distinct trajectories in each dimension: speed fluency showed consistent improvement, breakdown fluency steadily decreased, and repair fluency exhibited a complex and imbalanced trend.
Specifically, lower-proficiency learners showed less developed performance among all indicators, whereas significant progress emerged at higher educational stages. In terms of speed fluency, all three indicators displayed overall growth, although progress was particularly evident from Stage 2 to Stage 3. Breakdown fluency, measured by mean length of pauses and pause rate, exhibited a markedly nonlinear decrease: mean length of pauses continued to decline significantly across the three stages, whereas pause rate showed its sharpest decline between Stages 1 and 2. Regarding repair fluency, false start rate presented a U-shaped pattern, with an initial decrease followed by a slight rebound at Stage 3. Self-repair rate exhibited a non-significant nonlinear increase, indicating that learners at higher educational stages tended to refine expressions and have enhanced self-monitoring abilities. Repetition rate showed a significant nonlinear decrease, reflecting reduced reliance on repetitions for speech planning, production, and monitoring.
Interview data highlighted three factors shaping these patterns: learning experience, emotional factors, and perception of oral fluency. According to Kormos’ (2014) model, these factors may affect the input and automatization of L2 knowledge, the generation and encoding of messages in the conceptualizer and formulator, and the focus of self-monitoring during oral production. Together, these factors represented a comprehensive process from learners’ input to internalization and, ultimately, to output.
Based on these findings, several implications are proposed for multiple stakeholders. For teachers, prioritization of oral practice and providing individualized feedback tailored to learners’ observed strengths and weaknesses in fluency and error patterns are essential. Authentic communicative activities (e.g., role plays, debates, interviews) should be integrated to improve students’ oral skills and confidence. Controlled pronunciation drills, sentence-building exercises, and storytelling tasks can be adopted to establish essential foundational skills. Moreover, oral strategies and self-practice tools should be offered to foster learners’ autonomy. For learners, actively seeking practice opportunities (e.g., volunteering to present, engaging in discussions) would help build confidence and improve oral fluency. They should also focus on producing longer utterances, incorporating advanced vocabulary and complex sentence structures, and pursuing a balanced development of accuracy, complexity, and fluency. For policy-makers, curriculum designers, and material developers, greater allocation of resources and emphasis on oral competence are necessary, requiring the systematic integration of oral tasks in textbooks and instructional materials.
In summary, this study made meaningful contributions to L2 oral fluency research. First, it conducted a multidimensional analysis of oral fluency characteristics across three educational stages, integrating both quantitative and qualitative insights. Unlike prior studies focusing on learners within one specific learning stage and mostly the advanced learners, this research provided a holistic perspective on the overall characteristics across three educational stages, while also complementing existing findings with insights into the performance of younger learners in junior secondary school. Second, the study applied Kormos’ (2014) model to examine the cognitive underpinnings of fluency development, linking theoretical constructs to empirical findings and thereby enriching the understanding of fluency acquisition mechanisms. Additionally, the identification of unexpected characteristics, such as the increasing trend in self-repair, offered new insights into learners’ performance at higher educational stages. Finally, the study highlighted practical implications for several stakeholders, emphasizing the necessity for increased exposure, flexible practice methods, and balanced attention allocation during oral production.
However, this study has certain limitations that should be acknowledged. Although the proficiency levels were relatively comprehensive, the participants in the corpus were primarily drawn from Northeast China, limiting the generalizability of the findings to learners from other regions or diverse sociocultural backgrounds. Secondly, the study focused primarily on fluency indicators in controlled picture-description tasks, which might not reflect learners’ fluency in interactive communicative contexts. Thirdly, in terms of breakdown fluency, this study only explored the frequency and length of pauses, neglecting other features such as the position of pauses. Moreover, regarding self-repair, two types (error repairs and appropriateness repairs) were identified but lacked further analysis. In addition, this study focused exclusively on fluency measures while not addressing other crucial dimensions, such as accuracy and complexity, which are equally important for a comprehensive understanding of learners’ oral competence. Finally, this study did not employ stimulated recall, which could have provided more precise insights into learners’ thought processes during oral production.
For future research, adopting a multidimensional approach that simultaneously examines fluency, accuracy, and complexity would offer a more holistic perspective on oral proficiency development. Incorporating learners from diverse sociocultural and educational backgrounds would help validate the generalizability of findings and uncover potential context-specific influences. Furthermore, a more detailed analysis of self-repair features and pause positions could provide valuable insights into the development of learners’ self-monitoring strategies and hesitation patterns across proficiency levels. In addition, combining semi-structured interviews with stimulated recall may yield richer and more accurate reflections from learners, thereby offering a deeper understanding of the factors shaping fluency development. Finally, future research may explore how individual differences interact with instructional context to shape fluency development.
Supplemental Material
sj-pdf-1-ltr-10.1177_13621688261447957 – Supplemental material for Oral Fluency Characteristics of Chinese English-as-a-Foreign-Language Learners Across Different Educational Stages
Supplemental material, sj-pdf-1-ltr-10.1177_13621688261447957 for Oral Fluency Characteristics of Chinese English-as-a-Foreign-Language Learners Across Different Educational Stages by Huiping Zhang, Yexin Wang and Yansheng Jiang in Language Teaching Research
Footnotes
Funding
The authors disclosed receipt of the following financial support for the research, authorship, and/or publication of this article: “A Study on the Acquisition of Syntactic-Pragmatic Interface by EFL Learners,” RMB 200,000 from National Office for Philosophy and Social Sciences (CN), 2020 (grant number: 20BYY209).
Declaration of Conflicting Interests
The authors declared no potential conflicts of interest with respect to the research, authorship, and/or publication of this article.
Supplemental Material
Supplemental material for this article is available online.
Notes
References
Supplementary Material
Please find the following supplemental material available below.
For Open Access articles published under a Creative Commons License, all supplemental material carries the same license as the article it is associated with.
For non-Open Access articles published, all supplemental material carries a non-exclusive license, and permission requests for re-use of supplemental material or any part of supplemental material shall be sent directly to the copyright owner as specified in the copyright notice associated with the article.