
Abstract
In resistance projection welding, the softened material is squeezed out from the joint area. The two workpieces being joined together often have different geometries, leading to asymmetrical cooling. The flash formation and asymmetrical cooling are not well quantified in the literature. This study developed a coupled electrical-thermal-mechanical model with adaptive remeshing and glued contact activation techniques for projection welding of steel fitting to a steel shell. The model was used to calculate the evolution of temperature distribution in the fitting and shell for welds made under two different hold times. The cooling rates were then inputted into a literature model to predict the joint hardness values, which correlated well with the experimental data. Additionally, the main factors for the accurate prediction of flash shape and size were the use of temperature-activated glued contact and high-temperature flow stress. Specifically, a combination of no glued contact and low flow stress can lead to an overprediction of the flash geometry.
Keywords
Introduction
Resistance projection welding (RPW) is a variant of resistance spot welding (RSW) that utilises a projection (i.e. a geometrical feature such as a bump or dimple) to concentrate heat flux to rapidly create a fused nugget or a solid-state metallurgical bond.1,2 Owing to a short cycle time, tolerance for thickness mismatch, and ability to join similar/dissimilar materials, RPW finds extensive industry applications, particularly for joining fasteners such as threaded fittings, nuts and bolts to metal sheets.3,4
Compared to RSW, RPW has two distinctive features. The softened projection is squeezed out from the joint area by the electrode force, forming a flash. Similar to friction welding, 5 the extruded material carries oxides and other surface contaminations away from the joint area to create nascent surfaces that are in contact. If the extent of the flash formed is too small, the joint strength will be weak. On the other hand, if it is too large, the flash can interfere with the fittings as the extensive flash can block inner threads. Additionally, the two workpieces being joined together by RPW often have different geometries (e.g. a nut welded to a shell), leading to asymmetrical temperature distribution and cooling about the joint interface, which in turn can affect the local microstructure and properties of the joint.
Experimentally, the effect of RPW parameters on joint microstructure and mechanical properties has been extensively studied. For example, Sejč et al. 6 compared two welding modes: a so-called ‘hard’ mode characterised by high welding current, high electrode force, and short welding time versus a ‘soft’ mode with opposite parameters. The hard mode resulted in a narrower heat-affected zone (HAZ) and higher fracture strength than the soft mode, and the difference was attributed to the higher cooling rate in the former. High cooling rates were also shown to promote the martensite formation in the weld nugget and HAZ in RPW of low-carbon steel. 7 The hold phase, during which the water-cooled electrodes remain in contact with the workpieces after the welding current is switched off, is expected to significantly influence the joint cooling rates. 8 However, the effect of hold time on joint cooling is not well quantified in the literature.
Similar to RSW, numerical models, especially coupled electrical-thermal-mechanical models, have provided valuable insights into the evolution of temperature and deformation as well as nugget formation during the RPW process.9–11 These models, accounting for complex contact interactions including temperature-dependent and pressure-dependent electrical contact resistance, have evolved from two-dimensional (2D) axisymmetric geometries to full three-dimensional (3D) geometries such as a square nut.12,13 However, the existing models have the following limitations. The large deformation associated with the collapse of projection and extrusion of material can severely degrade the mesh quality, leading to inaccurate results and divergence. Such issue of mesh degradation has not been effectively handled in most of the existing models. Additionally, the standard contact interactions work fine when the faying surfaces are held together by the electrode force. When the electrode force is removed at the end of the hold phase, the faying surfaces can become separated from each other, an issue that also has not been effectively addressed.
This paper investigates the flash formation and asymmetric temperature distribution and cooling in RPW through a combination of experimental and numerical approaches. Experimentally, RPW of steel fitting to a steel shell using welding schedules with two different hold times was performed, and the resultant flash shape, microstructure, and hardness of the joints were measured. Numerically, a 2D axisymmetric model based on coupled electrical-thermal-mechanical analysis was developed to compute temperature and deformation fields during RPW. Cooling rates were extracted from the simulated temperature fields and used to determine the hardness in the joint region using existing analytical equations in the literature. The resulting cooling rates and hardness values were compared between the cases with different hold times.
Materials and methods
Experimental approach
Figure 1(a) shows a completed joint of a threaded fitting welded to a steel shell by RPW. The threaded fitting was made of ASTM A576 steel with the following chemical composition: 0.09 C, 0.32 Mn, 0.06 Si, 0.053 Al, 0.06 Cu, 0.03 Ni and 0.03 Cr in weight percent (wt-%). The steel shell, part of a water tank, was made of low alloy steel with the following composition: 0.07 C, 1.15 Mn, 0.49 Si, 0.033 Al, 0.12 Cu, 0.04 Ni, and 0.05 Cr in wt-%.
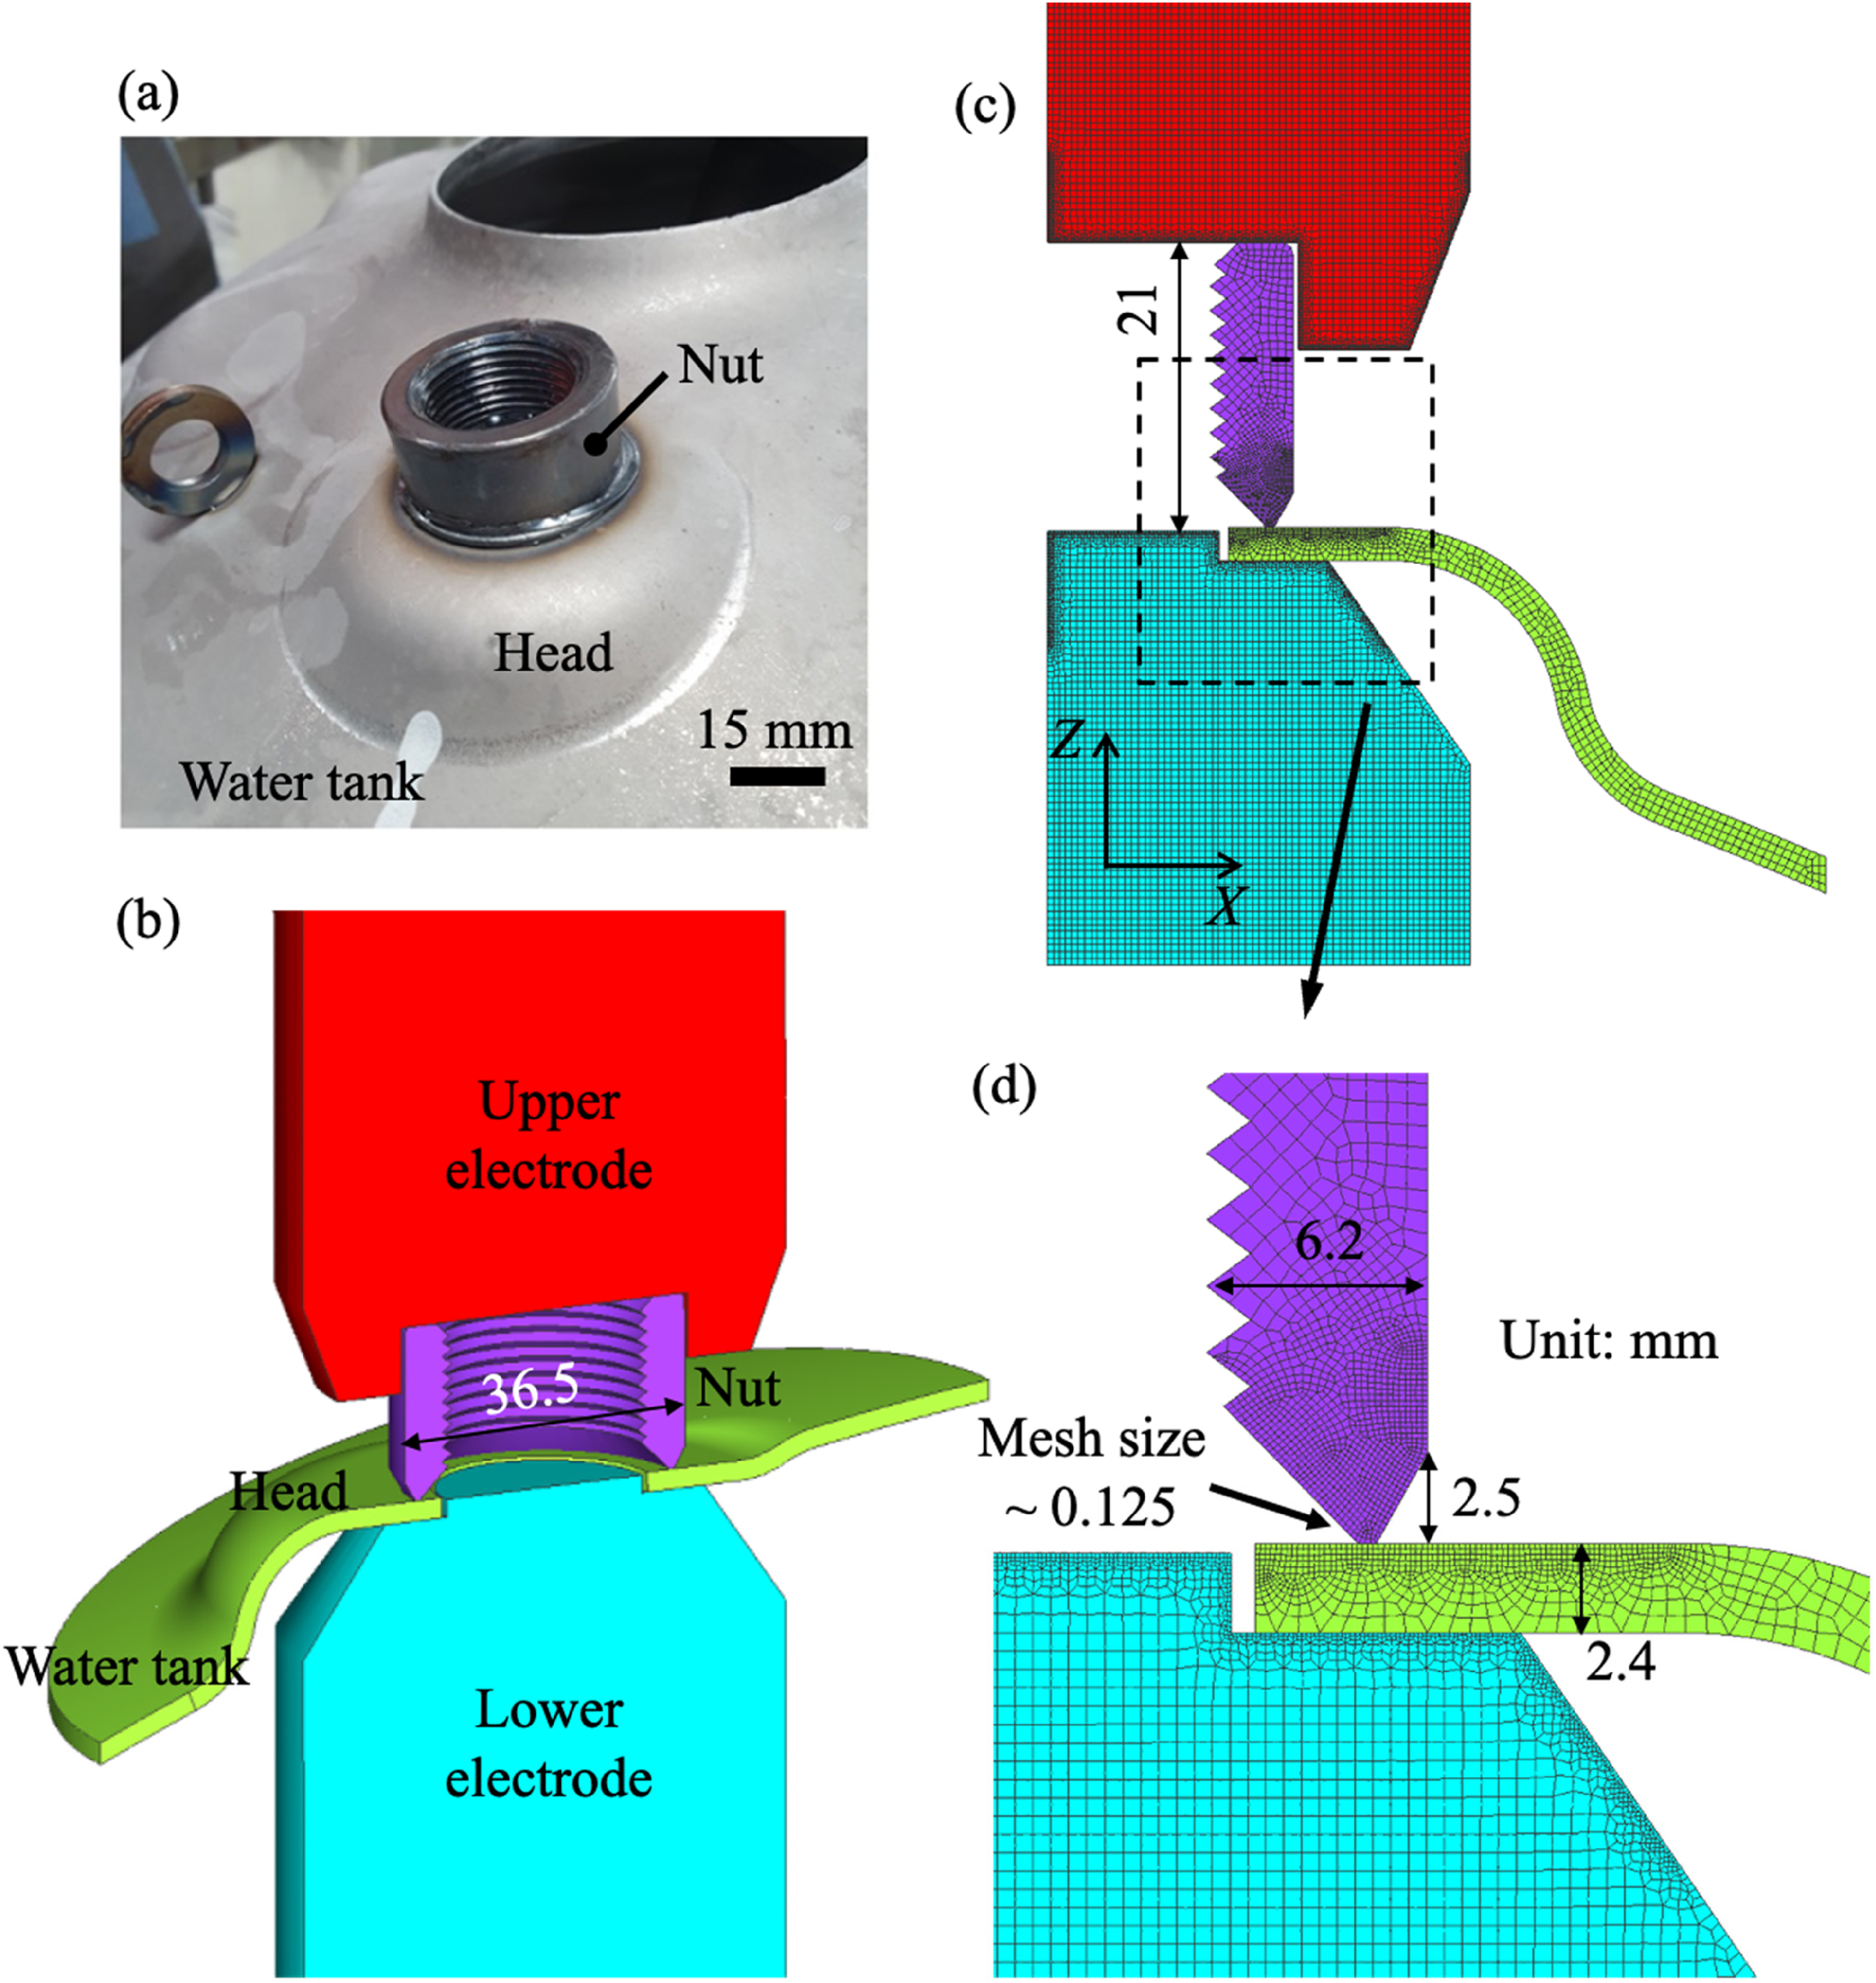
(a) Experimental weld of a threaded fitting (nut) to a torispherical head of water tank, (b) 3D cross-sectional view of the projection welding setup, (c) 2D axisymmetric model setup and graded mesh and (d) zoomed-in view of the graded mesh near the nut-head interface.
To facilitate projection welding, a torispherical shape with a flat top surface was formed on the water tank. For brevity, the threaded fitting and the torispherical feature are thereafter referred to as the nut and the head, respectively. The welding setup is schematically shown in Figure 1(b) to (d) where the key dimensions of the nut and head are annotated. Notably, the nut had a sharp projection, contacting with the head through a small flat tip with a width of 0.375 mm. Additionally, the head and nut were held by a pair of electrodes in such a way that the axis of the nut was aligned with that of the through-hole on the head.
The RPW experiments were performed in a medium-frequency direct current (MFDC) machine with welding parameters based on those used for water heater tank manufacturing. Specifically, the welding schedule comprised four phases: squeeze, weld, hold, and final cooling. The electrodes applied a constant squeeze force of 62.3 kN during the first three phases, and the welding current applied was 94 kA. The duration of squeeze and weld phase was 110 and 200 ms, respectively. Two hold times were investigated: 100 ms which is the current value used in the water tank welding, and an elongated hold time of 1500 ms. For brevity, these two cases are thereafter denoted as HT100 and HT1500. It is noted that the duration of the final cooling phase, during which the joint cools freely in the open air, was not a controlled parameter. For numerical simulations, a duration of 600 s was selected, which was sufficiently long to allow the joint to cool down to near room temperature.
The joints made with the two different hold times were cross-sectioned along the centre XZ plane (Figure 1(c)). The cross-sectioned samples were mounted in Bakelite, polished, and etched in a 2% Nital solution. The microstructure was observed in an optical microscope and a Thermo-Scientific scanning electron microscope (SEM). Microhardness measurements were conducted across the nut-head joint interface in a Leco microhardness tester with 200 g load, 13 s dwell time, and spacing of 0.15 mm.
Numerical modelling approach
The numerical model of RPW was based on the coupled electrical-thermal-mechanical analysis approach in the literature9,10 which is widely used for RSW process modelling. For brevity, the modelling approach including the analysis procedure, boundary conditions, contact interaction properties, and material properties is summarised in the Supplemental Material.
The welding assembly shown in Figure 1(b) is not an axisymmetric geometry although the local region around the circular weld is. Taking advantage of this local axisymmetry, a 2D axisymmetric model that covers the local section of the welding assembly around the projection weld was established. It included the entirety of the upper electrode, lower electrode and nut as well as a section of the head, as shown in Figure 1(c). Compared to a 3D model, the 2D model afforded the use of a fine mesh that was critical to capture the flash shape at a high resolution.
The RPW model employed the following two techniques to accurately simulate the flash formation and asymmetrical cooling. The first was the sticking or glued contact activation technique. Specifically, for the nut-head interface, the initial contact interactions were the standard ones for touching/sliding contact pairs (see Supplemental Section S1). When a temperature threshold (designated thereafter as glue temperature) was reached, the local contact condition was switched to glued, representing the local bond formation at the interface. For the glued contact, the electrical contact resistivity was zero, the contact thermal conductivity was infinity, and there was no relative sliding between two points on the opposite sides of the joint interface.
The second technique used was adaptive remeshing to handle large deformation. Specifically, the shape quality and accumulated strain for elements near the nut-head interface were monitored during the simulation. A new mesh was created when an element became overly skewed (e.g. an inner angle was > 175° or < 5°) or when the accumulated strain exceeded 10% since the last remeshing operation. The simulation results were mapped from the old mesh to the new mesh, and the calculation then continued on the new mesh.
The simulation was conducted in Hexagon Simufact, a commercial finite element code. Figure 1(c) and (d) shows the graded mesh strategy used. Regions near the bonding interface were discretised with fine elements of 0.125 mm while regions away were applied with gradually coarsening elements, reaching a maximum size of 0.3 mm. The initial element and node count were 34,337 and 35,509, respectively. Due to remeshing, the total number of nodes and elements changed during the analysis, and the final element and node count was 44,065 and 45,526, respectively. For time stepping, a fixed time step size of 0.41 ms was applied for the squeeze, weld, and hold phases. For the final cooling phase, an adaptive time step size was applied, with 0.01 ms at the beginning and 12 s towards the end. Note that these mesh sizes and time step sizes were determined based on convergence tests to ensure the calculated results did not vary significantly when the mesh and time step sizes were further reduced.
For hardness prediction, cooling rates were extracted from the simulated temperature fields and inputted into existing empirical equations developed by Ion et al. 14 A summary of the hardness calculation is provided in Supplemental Section S3. Additionally, a numerical sensitivity study was performed to identify the material parameters important for the predicted flash shape.
Results and discussion
Joint microstructure and hardness
Figure 2 shows the SEM images of the weld cross-sections for the two hold times of 100 and 1500 ms. For each weld, the five locations for observing the microstructure, that is, the nut's HAZ, bonding interface, head's HAZ, nut's base metal, and head's base metal, are marked in the bottom inset pictures. The base metal microstructure for the nut and the head (Figure 2(g) and (h), respectively) is predominantly composed of ferrite. Such ferritic microstructure is altered by welding in the following ways. When the hold time is 100 ms, the microstructure of the nut's HAZ and interface is still made of predominately ferrite. For the head, the interface region (bottom half of Figure 2(b)) is also mostly ferrite but with significant grain refinement when compared to the head's base metal (Figure 2(h)). Additionally, bainite or martensite appears in the head's HAZ (Figure 2(c)). When the hold time is 1500 ms, the amount of martensite formed is increased in all three locations. The nut's HAZ has a mixture of ferrite and martensite, and the interface and the head's HAZ are predominately lath-shaped martensite. Moreover, no dendritic structure is detected in the interface region, indicating a lack of molten pool formation.

Scanning electron microscope (SEM) images of welds made with a hold time of (a) to (c)100 ms, (d) to (f) 1500 ms, and base metal for the nut (g) and the head (h). These locations for microstructure observation are marked in the bottom inset pictures.
Figure 3 shows the hardness profiles across the bonding interface for the two cases. The lines to extract the hardness are indicated in the insets of Figure 2. The following observations can be made from the hardness profiles. First, the longer hold time leads to a higher hardness across the joint, with the increase being most pronounced for the head's HAZ. This hardness variation is consistent with the higher fraction of martensite formed for HT1500 shown in Figure 2. It indicates that the longer hold time results in faster cooling rates in the joint, a behaviour that is expected. Second, for both cases, the HAZ of the head is harder than that of the nut, which is expected given that the former has a higher hardenability than the latter (see Supplemental Table S1). Third, for both cases, there is a gradual decrease of hardness in the transition region from base metal (BM) to HAZ on the nut side. This is likely due to the nut being made by a cold heading process, which has work-hardened the nut. During welding, exposure to heat reduces the prior work hardening of the nut's BM, resulting in decreased hardness. A comparison between the measured and predicted hardness values is discussed later in the ‘Effect of hold time on cooling rate and hardness’ section.
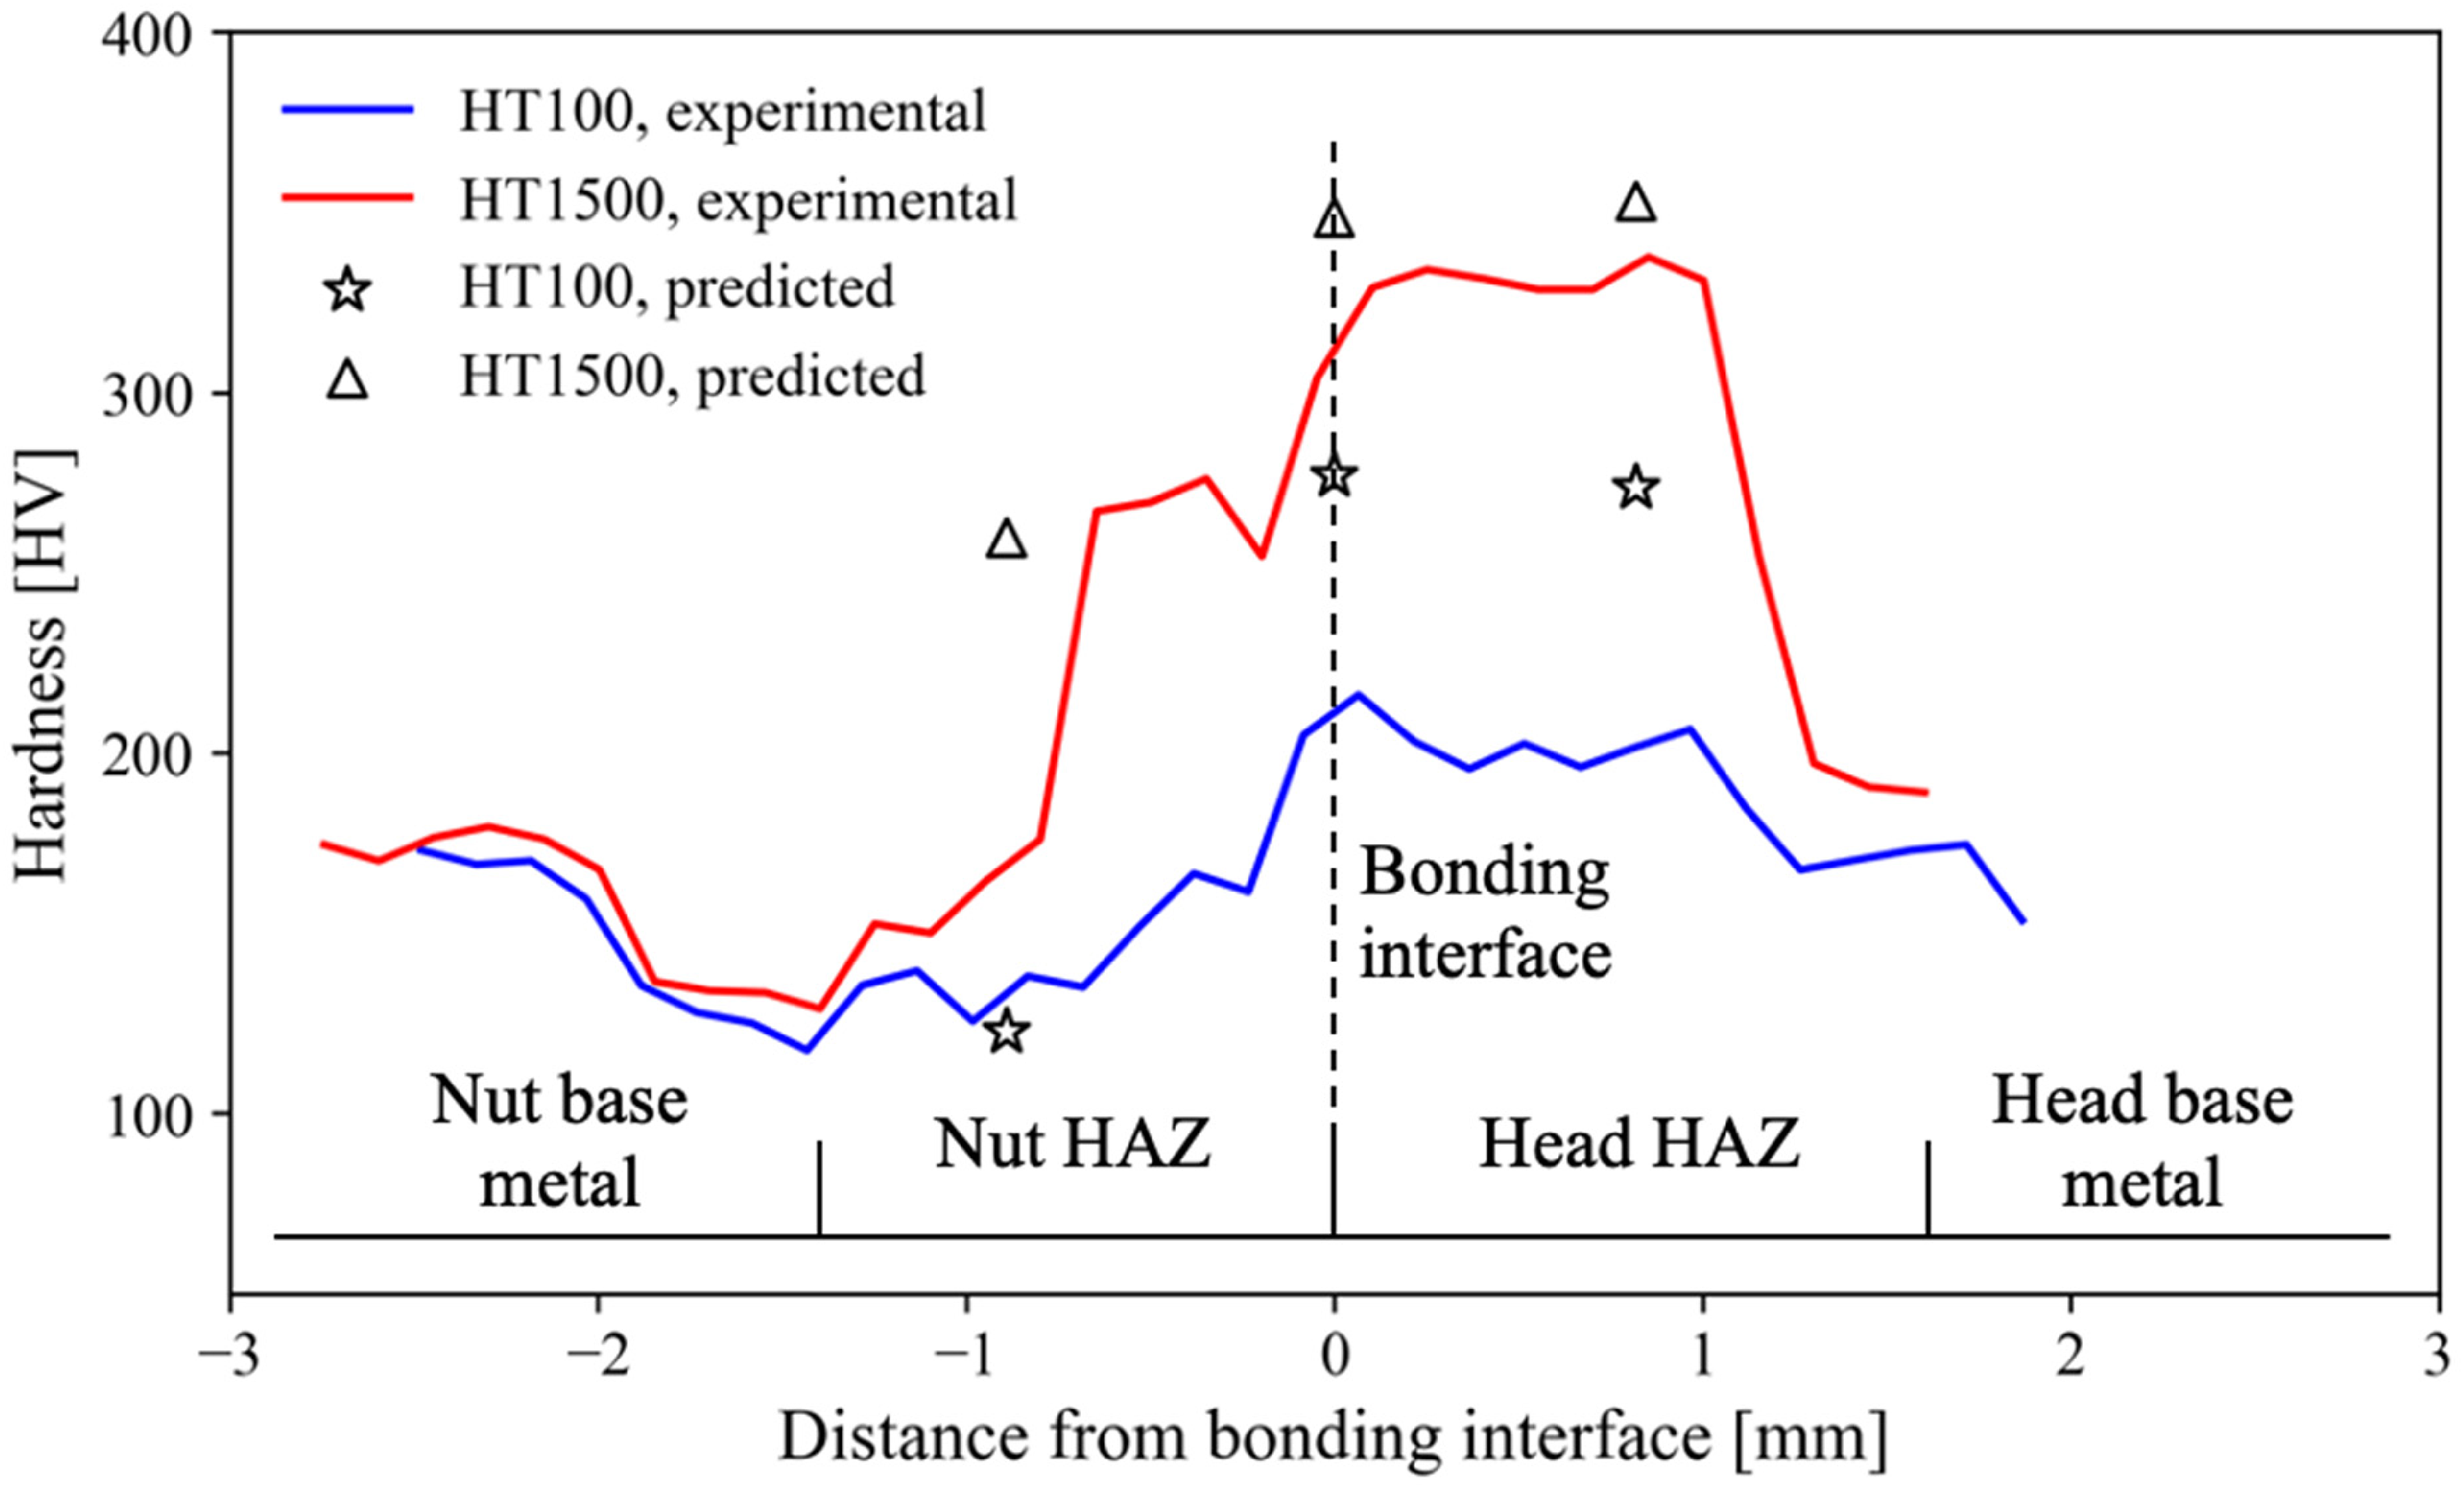
Experimental hardness profiles across the bonding interface for HT100 versus HT1500. The lines along which the hardness values are measured are indicated in the bottom insets of Figure 2.
Temperature and deformation evolution
Figure 4 shows the temperature evolution during the entire welding cycle for HT100. The temporal profiles of welding current and electrode force are depicted in the top inset, where the specific instants for plotting the temperature field are marked. During the squeeze phase, the electrode force gradually increases, establishing a contact between the nut's flat tip and the head, as shown in Figure 4(a) and (b). The limited contact area around the tip would result in a high current density and consequently a high heat generation rate. This leads to a rapid increase in temperature at the contact interface, as shown in Figure 4(c). As the material softens, the projection collapses under the electrode force (Figure 4(d) and (e)). Following the collapse, the contact area expands considerably, which would reduce the current density and the heat generation rate at the joint interface.
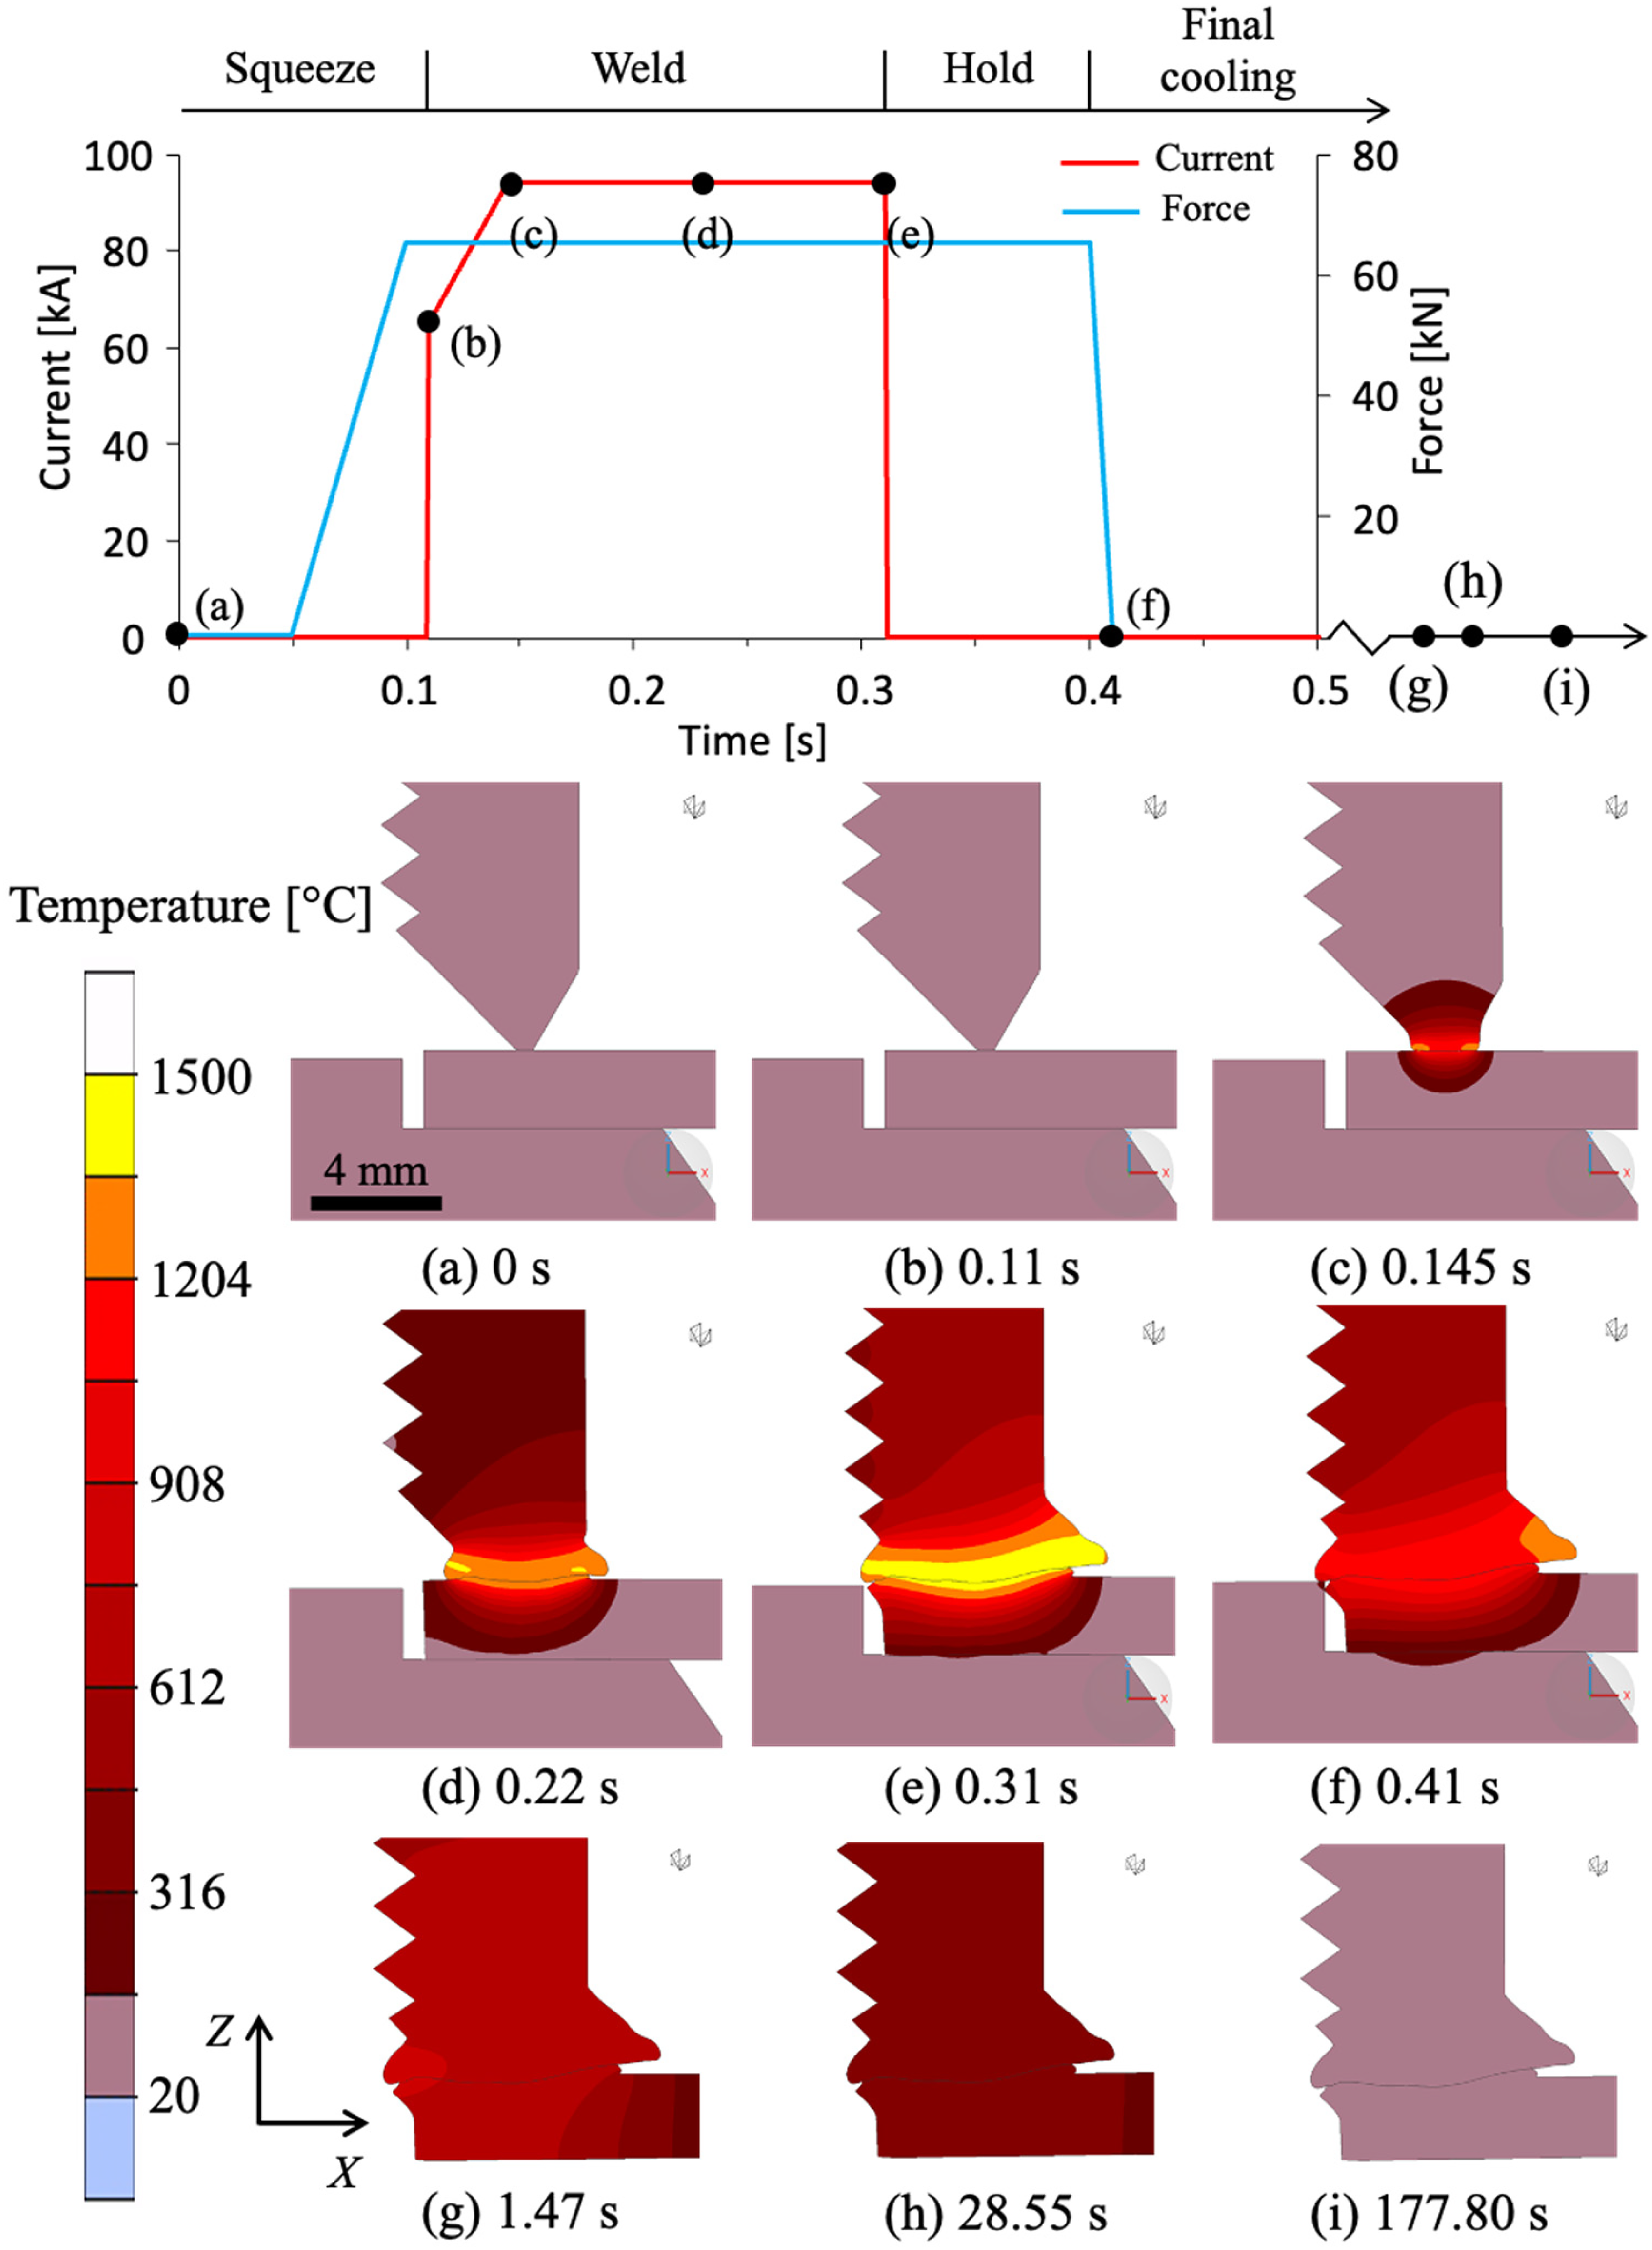
Evolution of temperature field and deformed shape during the entire welding cycle for HT100: (a) start of squeeze phase at time = 0, (b) current ramp-up at 0.11 s, (c) start of peak welding current at 0.145 s, (d) middle of welding current at 0.22 s, (e) end of welding current at 0.31 s, (f) end of hold phase at 0.41 s, and (g), (h) and (i) final cooling phase at 1.47, 28.55 and 177.80 s, respectively.
Upon cessation of the welding current, the joint starts to cool. During the hold phase, the electrodes maintain contact with the joint, resulting in a rapid temperature drop in the joint. Specifically, the maximum temperature at the bonding interface decreases from 1429 °C to 1100 °C from time = 0.31 s (Figure 4(e)) to 0.41 s (Figure 4(f)), respectively. An asymmetry in the temperature distribution is observed about the joint interface between the nut and the head. Such temperature asymmetry is expected given the difference in the two workpieces’ geometry. Furthermore, as shown in Figure 4(e) and (f), the isotherms are more compressed in the head than the nut, indicating a steep temperature gradient in the latter. It is because the head is directly contacting the lower electrode while the nut is further away from the electrode.
Right before the electrodes are retracted at 0.41 s, the joint is still at high temperatures (Figure 4(f)). After the electrode retraction, there is no longer heat loss to the electrodes, and heat dissipation then occurs via heat conduction to the steel tank as well as convection and radiation loss to the environment. Consequently, the temperature drops more slowly. Additionally, the previously observed steep temperature gradients are gone, and the temperature field becomes relatively uniform between the head and the nut, as evidenced in Figure 4(g) to (i). The above results underscore the effect of the lower electrode on the asymmetrical temperature distribution in the joint.
Figure 5(a) and (b) shows the experimental joint macrograph and the predicted peak temperature field for HT100, respectively. The experimental macrograph is the same as the lower-left inset image in Figure 2, but it is mirrored to facilitate the comparison with the predicted joint shape. As described in Supplemental Section S1, the contact parameters were calibrated by matching the calculated deformed shape and HAZ boundary with the respective experimental data. Hence, the following results verify how well the model with calibrated contact parameters could replicate the experimental data. Regarding the deformation, the predicted flash shape is generally consistent with the experimental result. Specifically, on the inner (left) side, the extrusion of the nut and head material is predicted although the extent of extrusion for the nut is underpredicted. On the outer (right) side, the nut material is extruded downward to form a toe-shaped feature, and the head material is extruded to form a rollover feature. Both features are captured by the simulation result in Figure 5(b).
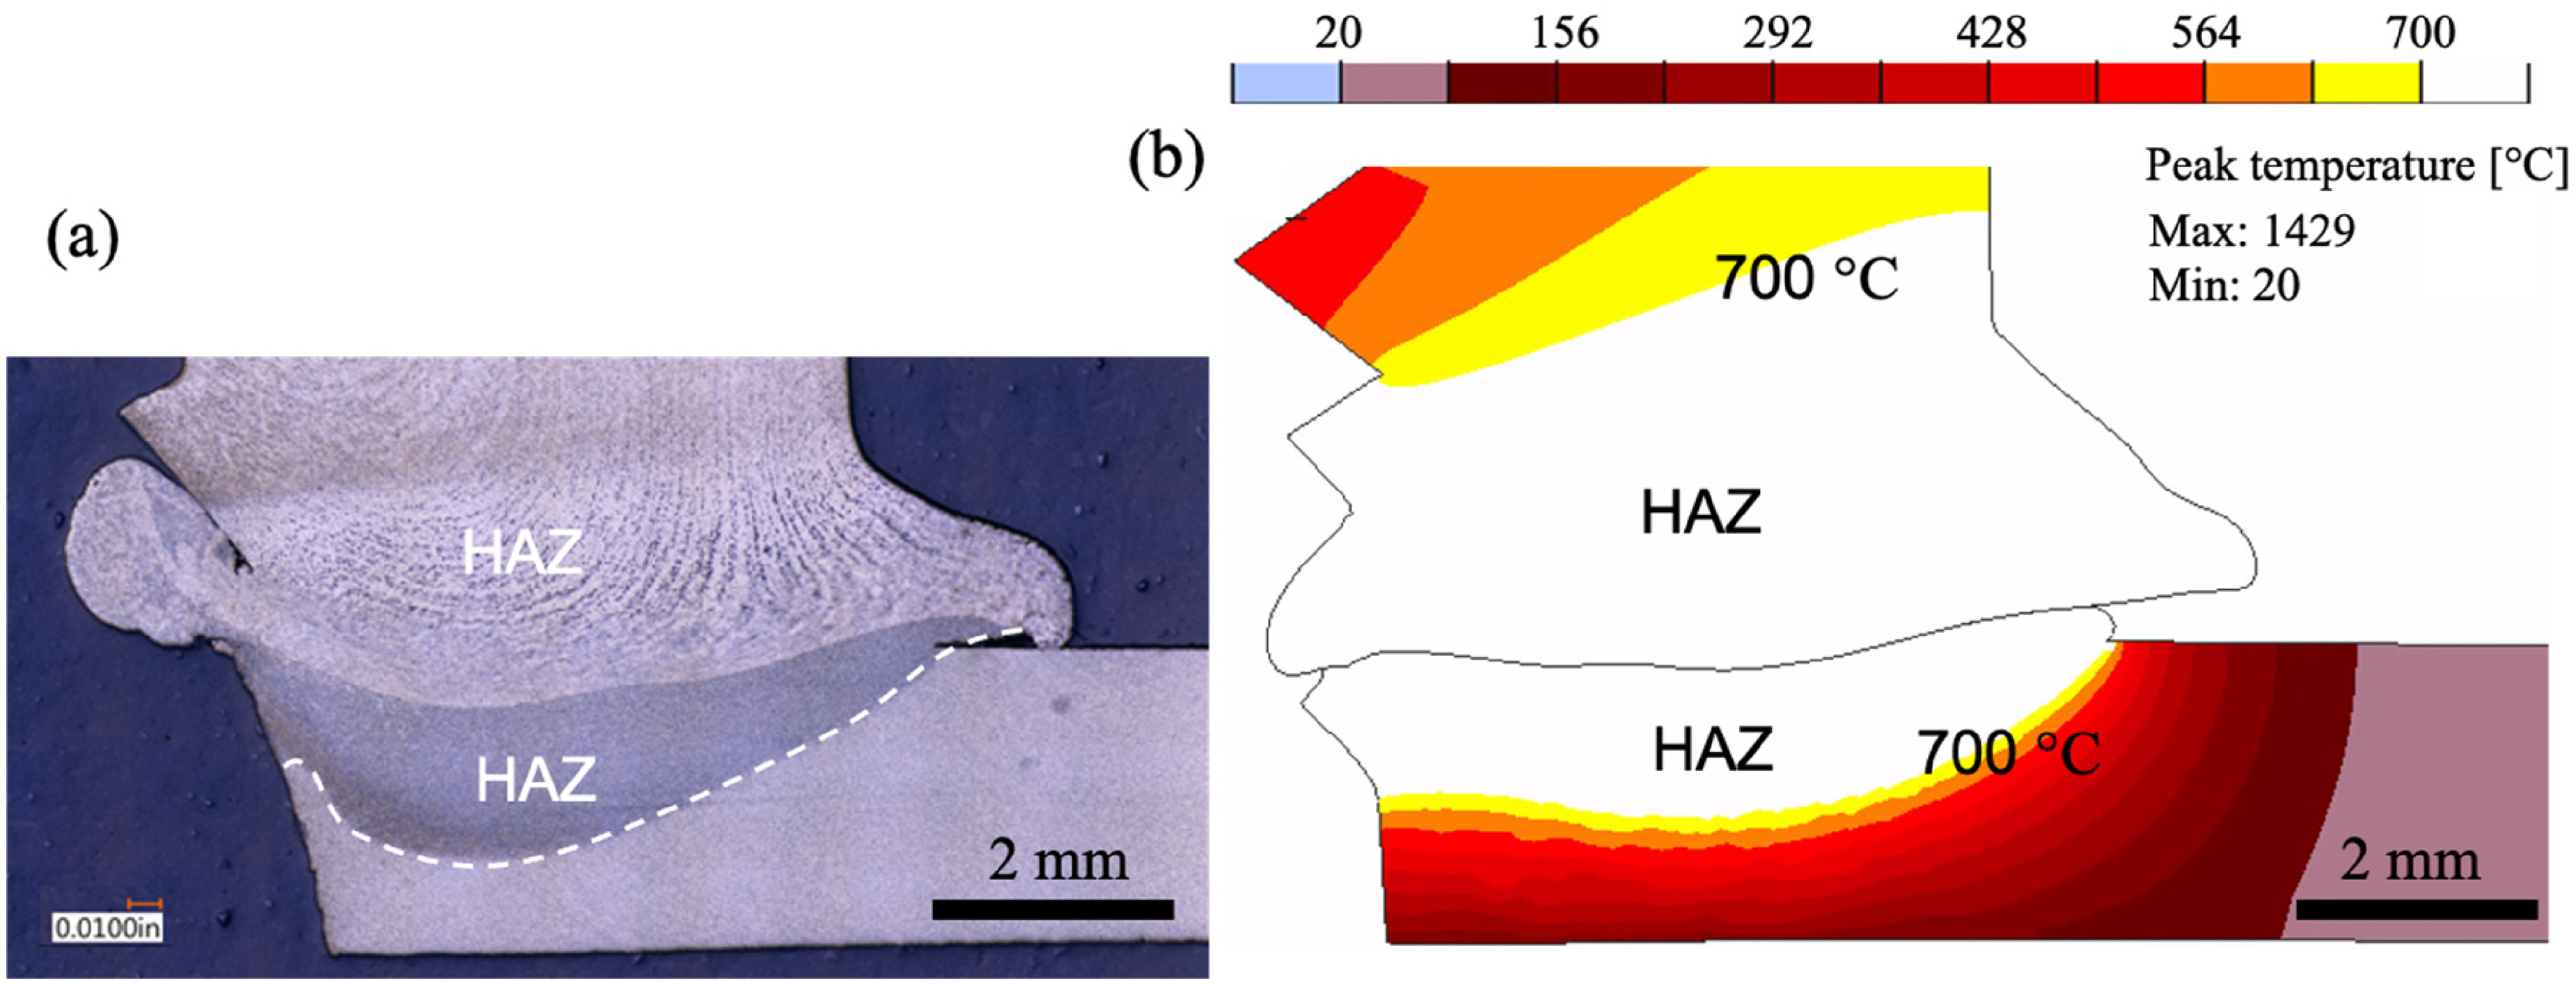
(a) Experimental macrograph of joint and (b) corresponding predicted results highlighting flash shape and heat-affected zone (HAZ) boundary. The predicted HAZ, the contour of the white-coloured region, is approximated by an isotherm of 700 °C. The hold time is 100 ms.
To verify the predicted HAZ boundary, the peak temperature contour plot is clipped at an isotherm of 700 °C, a temperature close to the A1 temperature of the two steels. Figure 5 shows that the predicted HAZ boundary in the nut is slightly overestimated while that in the head closely aligns with the experimental one in both shape and size.
Although the comparison in Figure 5 is done to verify the model, an interesting observation can be made on the maximum temperature experienced by the joint. As shown previously in Figure 4(e), the contact area expands considerably following the projection collapse, leading to a significant reduction in the heat generation rate. The maximum temperature reached (1429 °C) is below the solidus temperature of the steels (1466 °C for the nut and 1490 °C for the head), and melting thus does not occur. This observation indicates that the weld was formed through a solid-state bonding rather than fusion, a conclusion that is consistent with the experimental microstructure result in Figure 2(b) to (e).
Effect of hold time on cooling rate and hardness
Figure 6(a) shows the predicted temperature profiles for the two hold times at three locations: the nut HAZ, the bonding interface on the nut side and head HAZ, as indicated in Figure 6(b). As only the hold time varies between the two cases, the heating portion is identical. For both cases, the interface location reaches the highest peak temperature of ∼ 1400 °C, while the locations in the nut and head reach comparable peak temperatures of ∼ 1000 °C at the end of the weld phase.
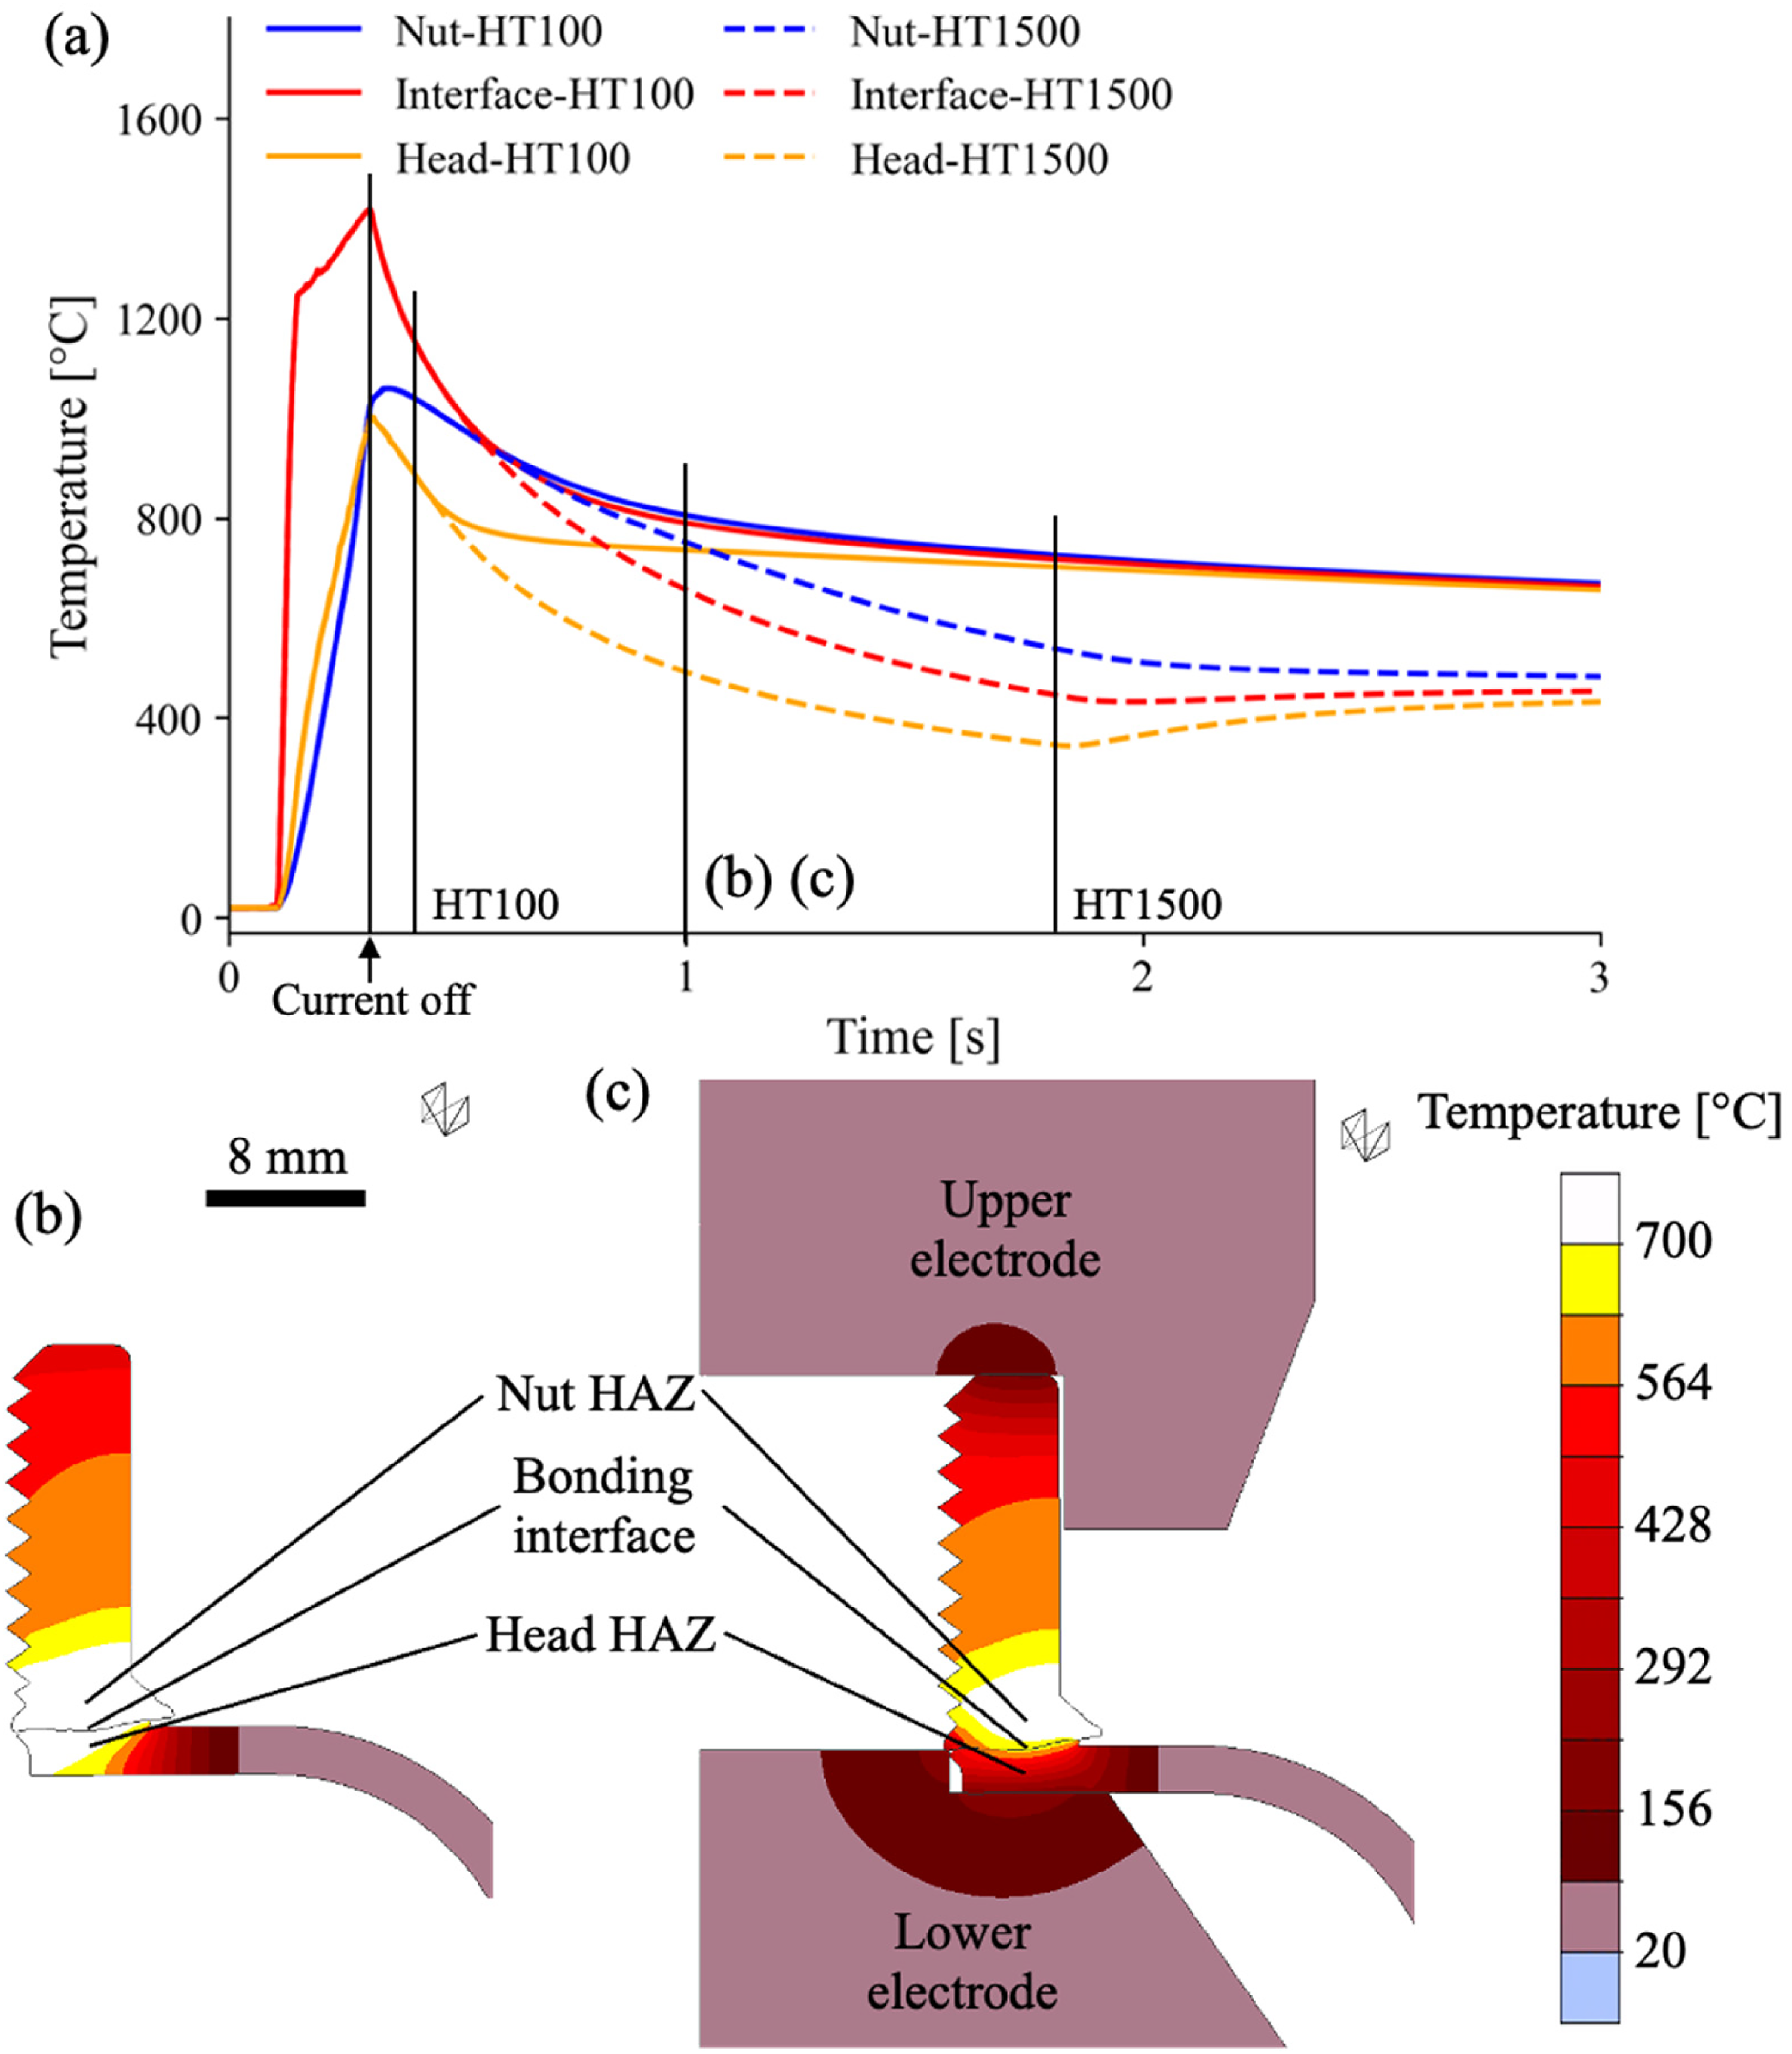
(a) Temperature profiles at three monitoring locations, that is, nut heat-affected zone (HAZ), bonding interface on the nut side, and head HAZ, for two hold times of 100 and 1500 ms. The temperature distribution is plotted at time = 1 s for (b) HT100 and (c) HT1500.
For HT100, as the hold phase starts, all three locations experience rapid cooling. Moreover, the head location experiences a faster cooling rate than the nut location, which is expected as the head location is much closer to the lower electrode. Once the hold phase ends, the cooling rates at all three locations are greatly reduced. The cooling curves at the three locations eventually converge into the same one once the temperature drops below ∼700 °C at time = 2 s.
When the hold time is 1500 ms, a significant increase in the cooling rate is observed for all three locations when compared to HT100. To further illustrate the effect of electrodes on joint cooling, Figure 6(b) and (c) compare the temperature distribution at time = 1 s (or 0.59 s after current cessation) between the two cases. The head region for HT1500 is significantly cooler than that for HT100 due to the heat loss to the lower electrode. Additionally, the temperature distribution in HT1500 exhibits a significant asymmetry about the joint interface with the nut region near the interface much hotter than the head region (Figure 6(c)).
The average cooling rate for the temperature range of 800 °C–500 °C (CR85), a quantity important for studying the final joint microstructure, is compared between the two cases. Specifically, for HT100, CR85 is 25.74, 30.21 and 28.99 °C/s for the three locations in nut HAZ, bonding interface and head HAZ, respectively. For HT1500, CR85 rises substantially to 230.43, 386.10 and 617.54 °C/s, for the three locations. With the longer holding time of 1500 ms, CR85 for the nut HAZ and the bonding interface experiences approximately a tenfold increase, while it rises ∼ 20-fold for the head HAZ. These findings again highlight asymmetrical cooling of the joint where the longer hold time has a more pronounced impact in the head region.
Using the predicted cooling rates, the hardness at different locations for the two cases is calculated. The resulting hardness values are plotted in Figure 2 with the detailed results summarised in Supplemental Table S1. The hardness values at all three locations for HT1500 align well with the experimental data. Additionally, the predicted fraction of martensite is 11%, 100% and 100% for the nut HAZ, bonding interface and head HAZ, respectively; these values are consistent with the observed microstructure in Figure 2(d) and (f). However, for HT100, the hardness values for the bonding interface and the head HAZ are overpredicted. This overprediction arises because the calculated volume fractions of martensite and bainite at those two locations (98% combined) are much higher than those observed in the experimental microstructure (Figure 2(b) and (c)). Such discrepancies in phase fractions and hardness are not unexpected given the empirical nature of the model by Ion et al. 14 The accuracy of the prediction can be readily improved in a future work by incorporating the continuous-cooling-transformation (CCT) diagram of the steels.
Sensitivity analysis of predicted flash shape
Many simulation runs have been performed to observe how the predicted flash shape is affected by the input parameters. In the following section, two parameters are discussed: high-temperature stress-strain relation represented by a single flow stress value at 1400 °C (σ1400), and glue temperature above which a local bond is formed at the nut-head interface. These two parameters are selected due to the difficulty in experimentally determining the values and their significant influence.
Figure 7 shows the predicted flash shape under six combinations of σ1400 and glue temperature. The σ1400 is set at two levels: 5 and 25 MPa, while the glue temperature is set at three levels: infinitely high and thus ‘no glue’, 900 °C, and 1100 °C. It is noted that the calibrated values used in the results shown previously are σ1400 = 25 MPa, and glue temperature = 1300 °C.
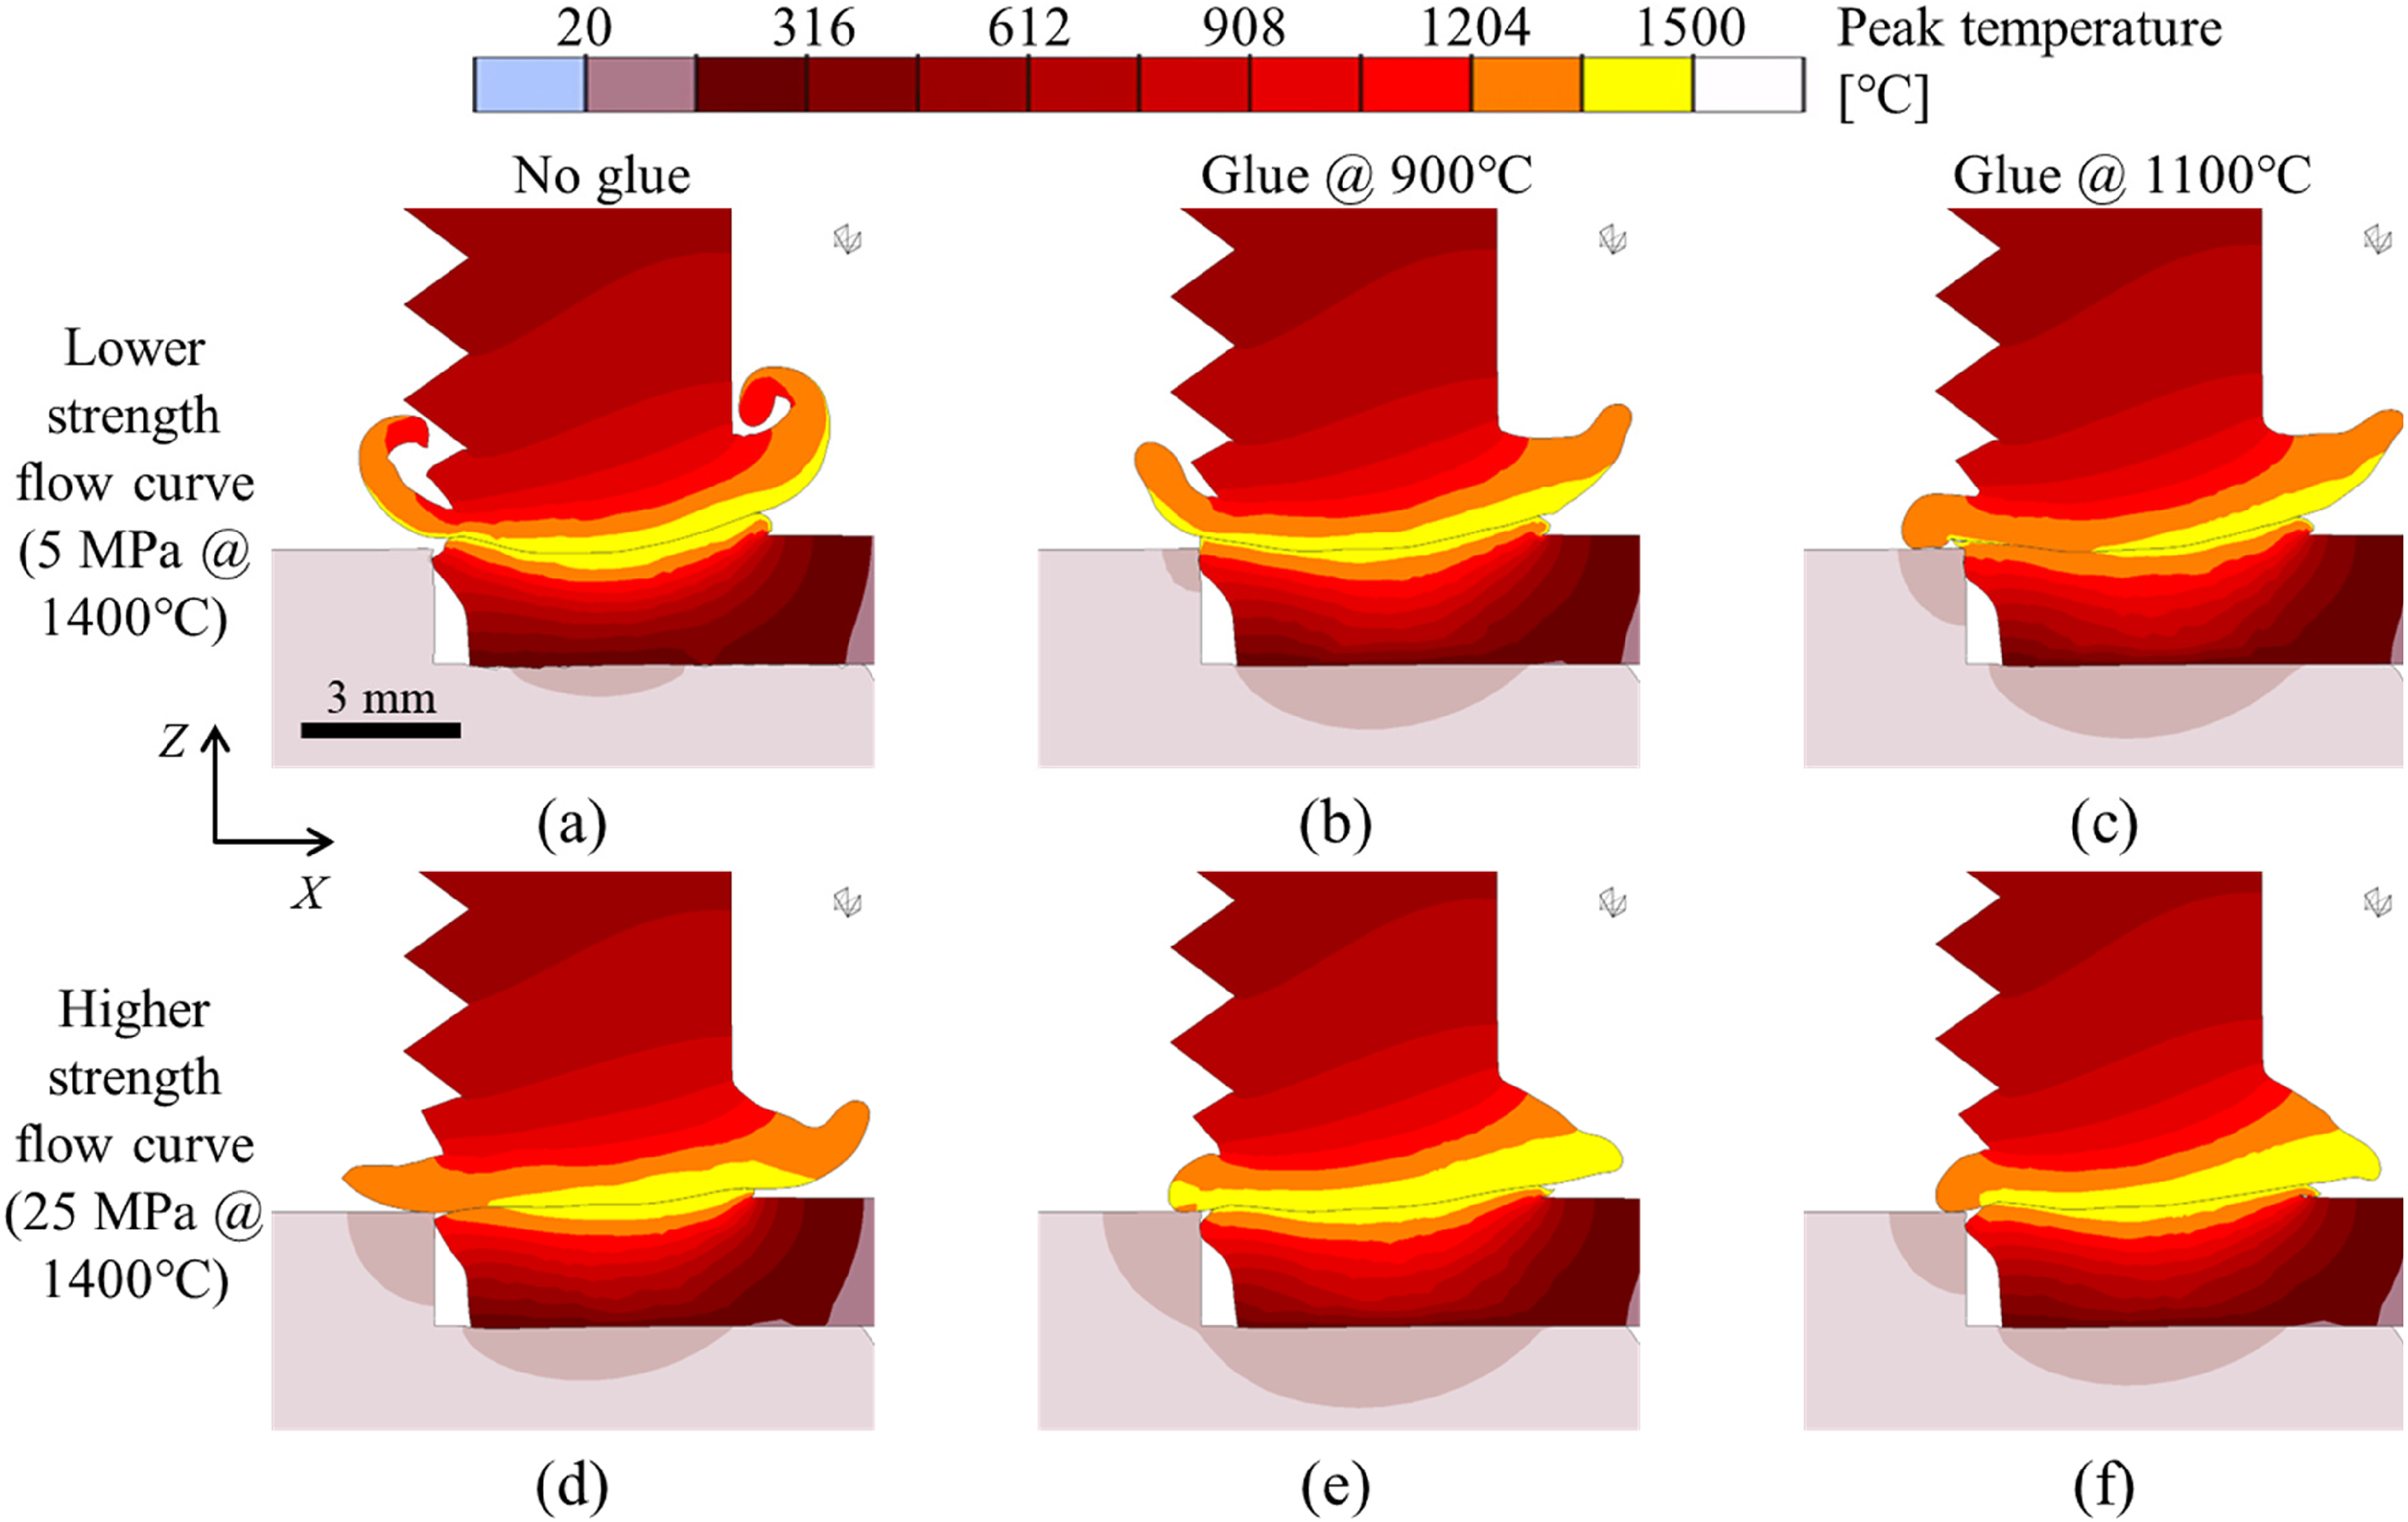
Predicted flash shape under six combinations of flow stress at 1400 °C and glue temperature. The calibrated values used in the results shown previously are σ1400 = 25 MPa, and glue temperature = 1300 °C.
When σ1400 is set to 5 MPa and no glue is used, the prediction shows an extensive, curly flash formed by the extruded nut material (Figure 7(a)). Compared to Figure 7(d), the high σ1400 of 25 MPa significantly decreases the extent of flash formed, a behaviour that is expected as the higher flow stress renders the steel less easy to deform plastically by the same electrode force. The same trend is observed for glue temperatures of 900 (Figure 7(b) to (e)) and 1100 °C (Figure 7(c) to (f)).
A comparison of Figure 7(b) to Figure 7(a) shows that the predicted flash is significantly shortened when the glued contact is enabled. The main reason is that there is a steep temperature gradient in the head due to the contact heat loss to the lower electrode. Hence, the thin layer of hot material at the interface is surrounded by the cold material outside, thus constraining the extrusion of the head material. When there is no glue at the interface, the nut material slides over the head, leading to the formation of an extensive flash shown in Figure 7(a). Conversely, when the nut material is glued to the head, the extrusion of the nut material is also constrained, leading to a shortened flash shown in Figure 7(b). Additionally, a comparison of Figure 7(b), (c) and Figure 7(e), (f) shows the predicted flash shape (especially that of the outer toe) is comparable between the two glue temperatures. Moreover, Figure 7(f) (glue temperature 1100 °C) has a similar flash shape to Figure 5(b) (glue temperature 1300 °C). These results indicate the predicted flash shape depends more strongly on the high-temperature flow stress than the glue temperature.
Summary and conclusions
In this article, a coupled electrical-thermal-mechanical model was developed for RPW process simulation. A glued contact activation technique was used so that the faying surfaces were bonded together locally when a threshold temperature was reached. This contact technique allowed the simulation of the entire RPW cycle, especially the final cooling phase when electrodes were retracted. An adaptive remeshing technique along with the use of a fine mesh afforded by the 2D axisymmetric model allowed the simulation of the flash shape at a high resolution. The model was used to simulate the temperature and deformation fields for RPW of a threaded fitting (nut) to a torispherical head of a water tank. The effect of hold time on the asymmetrical temperature distribution and cooling was demonstrated by comparing a standard hold time of 100 ms to an extended hold time of 1500 ms.
The conclusions are
Both the experimental and simulation results show the lack of bulk melting at the joint interface, indicating the bond formed between the nut and the head is a solid-state metallurgical one. A key factor for this is the large contact area resulting from the collapse of the projection which leads to a reduced heat generation rate at the interface. Increasing hold time from 100 to 1500 ms raises the cooling rate from 800 °C to 500 °C by more than 10 times, which in turn results in a hardness increase of ∼ 60%. This is because the joint microstructure for 1500 ms hold comprises primarily martensite, while that is made of mostly ferrite for 100 ms hold. Asymmetrical temperature distribution and cooling are observed between the nut and head regions during the weld and hold phases. In addition to the inherent difference in the workpieces’ geometry, another key factor for the temperature asymmetry is the cooling effect exerted by the lower electrode on the head. With a longer hold time, the cooling rate throughout the joint is increased, although the increase is more pronounced in the head region due to its proximity to the lower electrode. The sensitivity study reveals that the predicted flash shape is highly dependent on the flow stress at elevated temperatures (e.g. 1400 °C) and the glued contact conditions. Combinations of low flow stress and no glued contact lead to an overprediction of the flash geometry.
The present work underscores the complexity of projection welding and identifies the key parameters that affect simulation results. An improved understanding of these parameters is essential for a physics-based model that can accurately predict the heat imbalance in the workpieces, the amount of flash formed, and the microstructure in the finished projection weld. Such accurate prediction is important to achieve good quality of projection welds.
Supplemental Material
sj-docx-1-stw-10.1177_13621718241285309 - Supplemental material for Numerical investigation of flash formation and asymmetrical cooling in resistance projection welding
Supplemental material, sj-docx-1-stw-10.1177_13621718241285309 for Numerical investigation of flash formation and asymmetrical cooling in resistance projection welding by Nicholas Queiroz Avedissian, Xuesong Gao, Luke Walker, Fernando Okigami, Wei Zhang and Bruce W Krakauer in Science and Technology of Welding and Joining
Footnotes
Acknowledgements
The authors acknowledge the financial support from the U.S. National Science Foundation I/UCRC Manufacturing and Materials Joining Innovation Center (Ma2JIC) under Grant No. 1822144. The authors also thank Mr Jason Scott of A. O. Smith Corporation for the helpful discussion.
Declaration of conflicting interests
The author(s) declared no potential conflicts of interest with respect to the research, authorship, and/or publication of this article.
Funding
The author(s) disclosed receipt of the following financial support for the research, authorship, and/or publication of this article: This work was supported by the U.S. National Science Foundation I/UCRC Manufacturing and Materials Joining Innovation Center (grant number 1822144).
Supplemental material
Supplemental material for this article is available online.
References
Supplementary Material
Please find the following supplemental material available below.
For Open Access articles published under a Creative Commons License, all supplemental material carries the same license as the article it is associated with.
For non-Open Access articles published, all supplemental material carries a non-exclusive license, and permission requests for re-use of supplemental material or any part of supplemental material shall be sent directly to the copyright owner as specified in the copyright notice associated with the article.