
Abstract
Numerical heat transfer models are increasingly used to compute the temperature field, melt pool dimensions and thermal cycles for laser powder bed fusion but huge computational demand of these models is a perpetual challenge. We present a recently introduced novel dynamic meshing strategy to preserve a fine meshed region always beneath the laser beam and a gradually coarsened region away from the beam thereby notably reducing the overall model size and computational demand. Probed over a wide range of conditions, we show a reduction of the computational time and volume by nearly 6 to 10 times vis-à-vis little loss of accuracy in the computed results with the dynamic meshing strategy compared to traditional approaches with static uniform meshing.
Keywords
Introduction
A prior estimation of melt pool dimensions and thermal cycles during laser powder bed fusion (LPBF) helps in optimizing process variables and avoiding defects. Although the current numerical heat transfer models can simulate multi-track, multi-layer LPBF, their computational demand is a perpetual challenge.1,2 For example, the numerical heat transfer model of a 10 × 0.55 × 0.25 mm3 deposit volume required hundreds of CPU hours. 3 The comprehensive heat transfer and fluid flow models provided relatively more accurate melt pool dimensions and thermal cycles but are complex and required significantly higher computational time. 4 Simple and efficient numerical LPBF models are therefore in ever demand. 5
The computational time for modeling of LPBF ranges from a few seconds for analytical models to several hundreds of hours for high-resolution powder scale models. For instance, a numerical heat transfer model for LPBF of a few tracks took around 2 hours with a coarse mesh 6 and over 20 hours with a finer mesh. 7 Increasing the layers 8 and track length 9 doubled the time to over 40 hours. Heat transfer and fluid flow models of LPBF are computationally more intensive 10 even to simulate the deposition of only small volumes. 11 High-resolution powder scale models can capture individual powder particle behavior12,13 but demand the maximum computational time, for example, 100 to 200 CPU hours to simulate a deposit volume of around 0.01 mm3. 12 In contrast, simplified models using a line heat source, 14 uniform energy input 15 and aggregated layers 16 expedited the calculations but struggled with the accuracy of the computed results. Adaptive mesh refinement 17 and layer lumping 18 also reduced the computational demands. Dynamic meshing technique was used to simulate the AM deposition19,20 and LPBF, in particular,21,22 but these studies put limited emphasis on probing the accuracy of prediction for melt pool dimensions 21 and testing the model for a wide range of powder alloy properties 22 while attempting to reduce the overall computational time. Moreover, the temperature field and melt pool dimensions during LPBF oftentimes showed little variations beyond a few initial layers.23,24 It is therefore prudent to develop efficient computational strategies to simulate LPBF of at least a few tens of layers with a rational computational demand.
The present study aims at developing a computationally efficient three-dimensional (3D) heat conduction analysis of LPBF considering a recently introduced novel dynamic meshing strategy, which involves a fine mesh region beneath the laser beam and moving with the beam, and a gradually coarsening mesh away from the beam. The overall size of the model and the computational demand therefore remain the same irrespective of the number of tracks and layers. The energy input from the laser beam is accounted for by using a volumetric heat source, which is developed using a dimensional analysis and experimentally measured results. The proposed model is tested rigorously to compute the temperature field, melt pool dimensions, thermal cycles and cooling rates for a range of LPBF process conditions.
Theoretical model
A 3D transient heat conduction analysis is carried out with the governing equation as
3
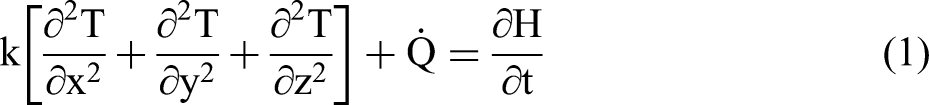
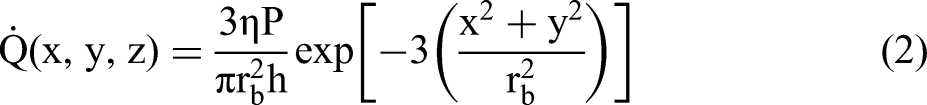
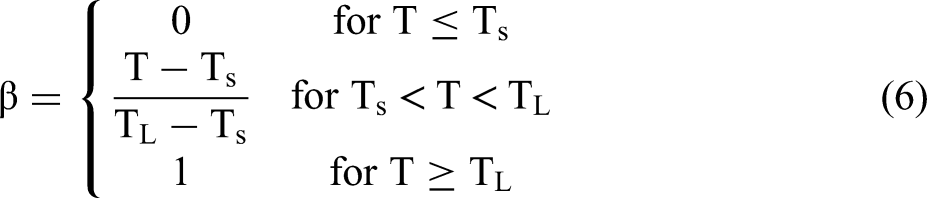
Figure 1(a) schematically illustrates the solution domain, with white, grey, and red regions representing the substrate, powder bed and build component, respectively. The melt pool depth (d), width (w), layer thickness (
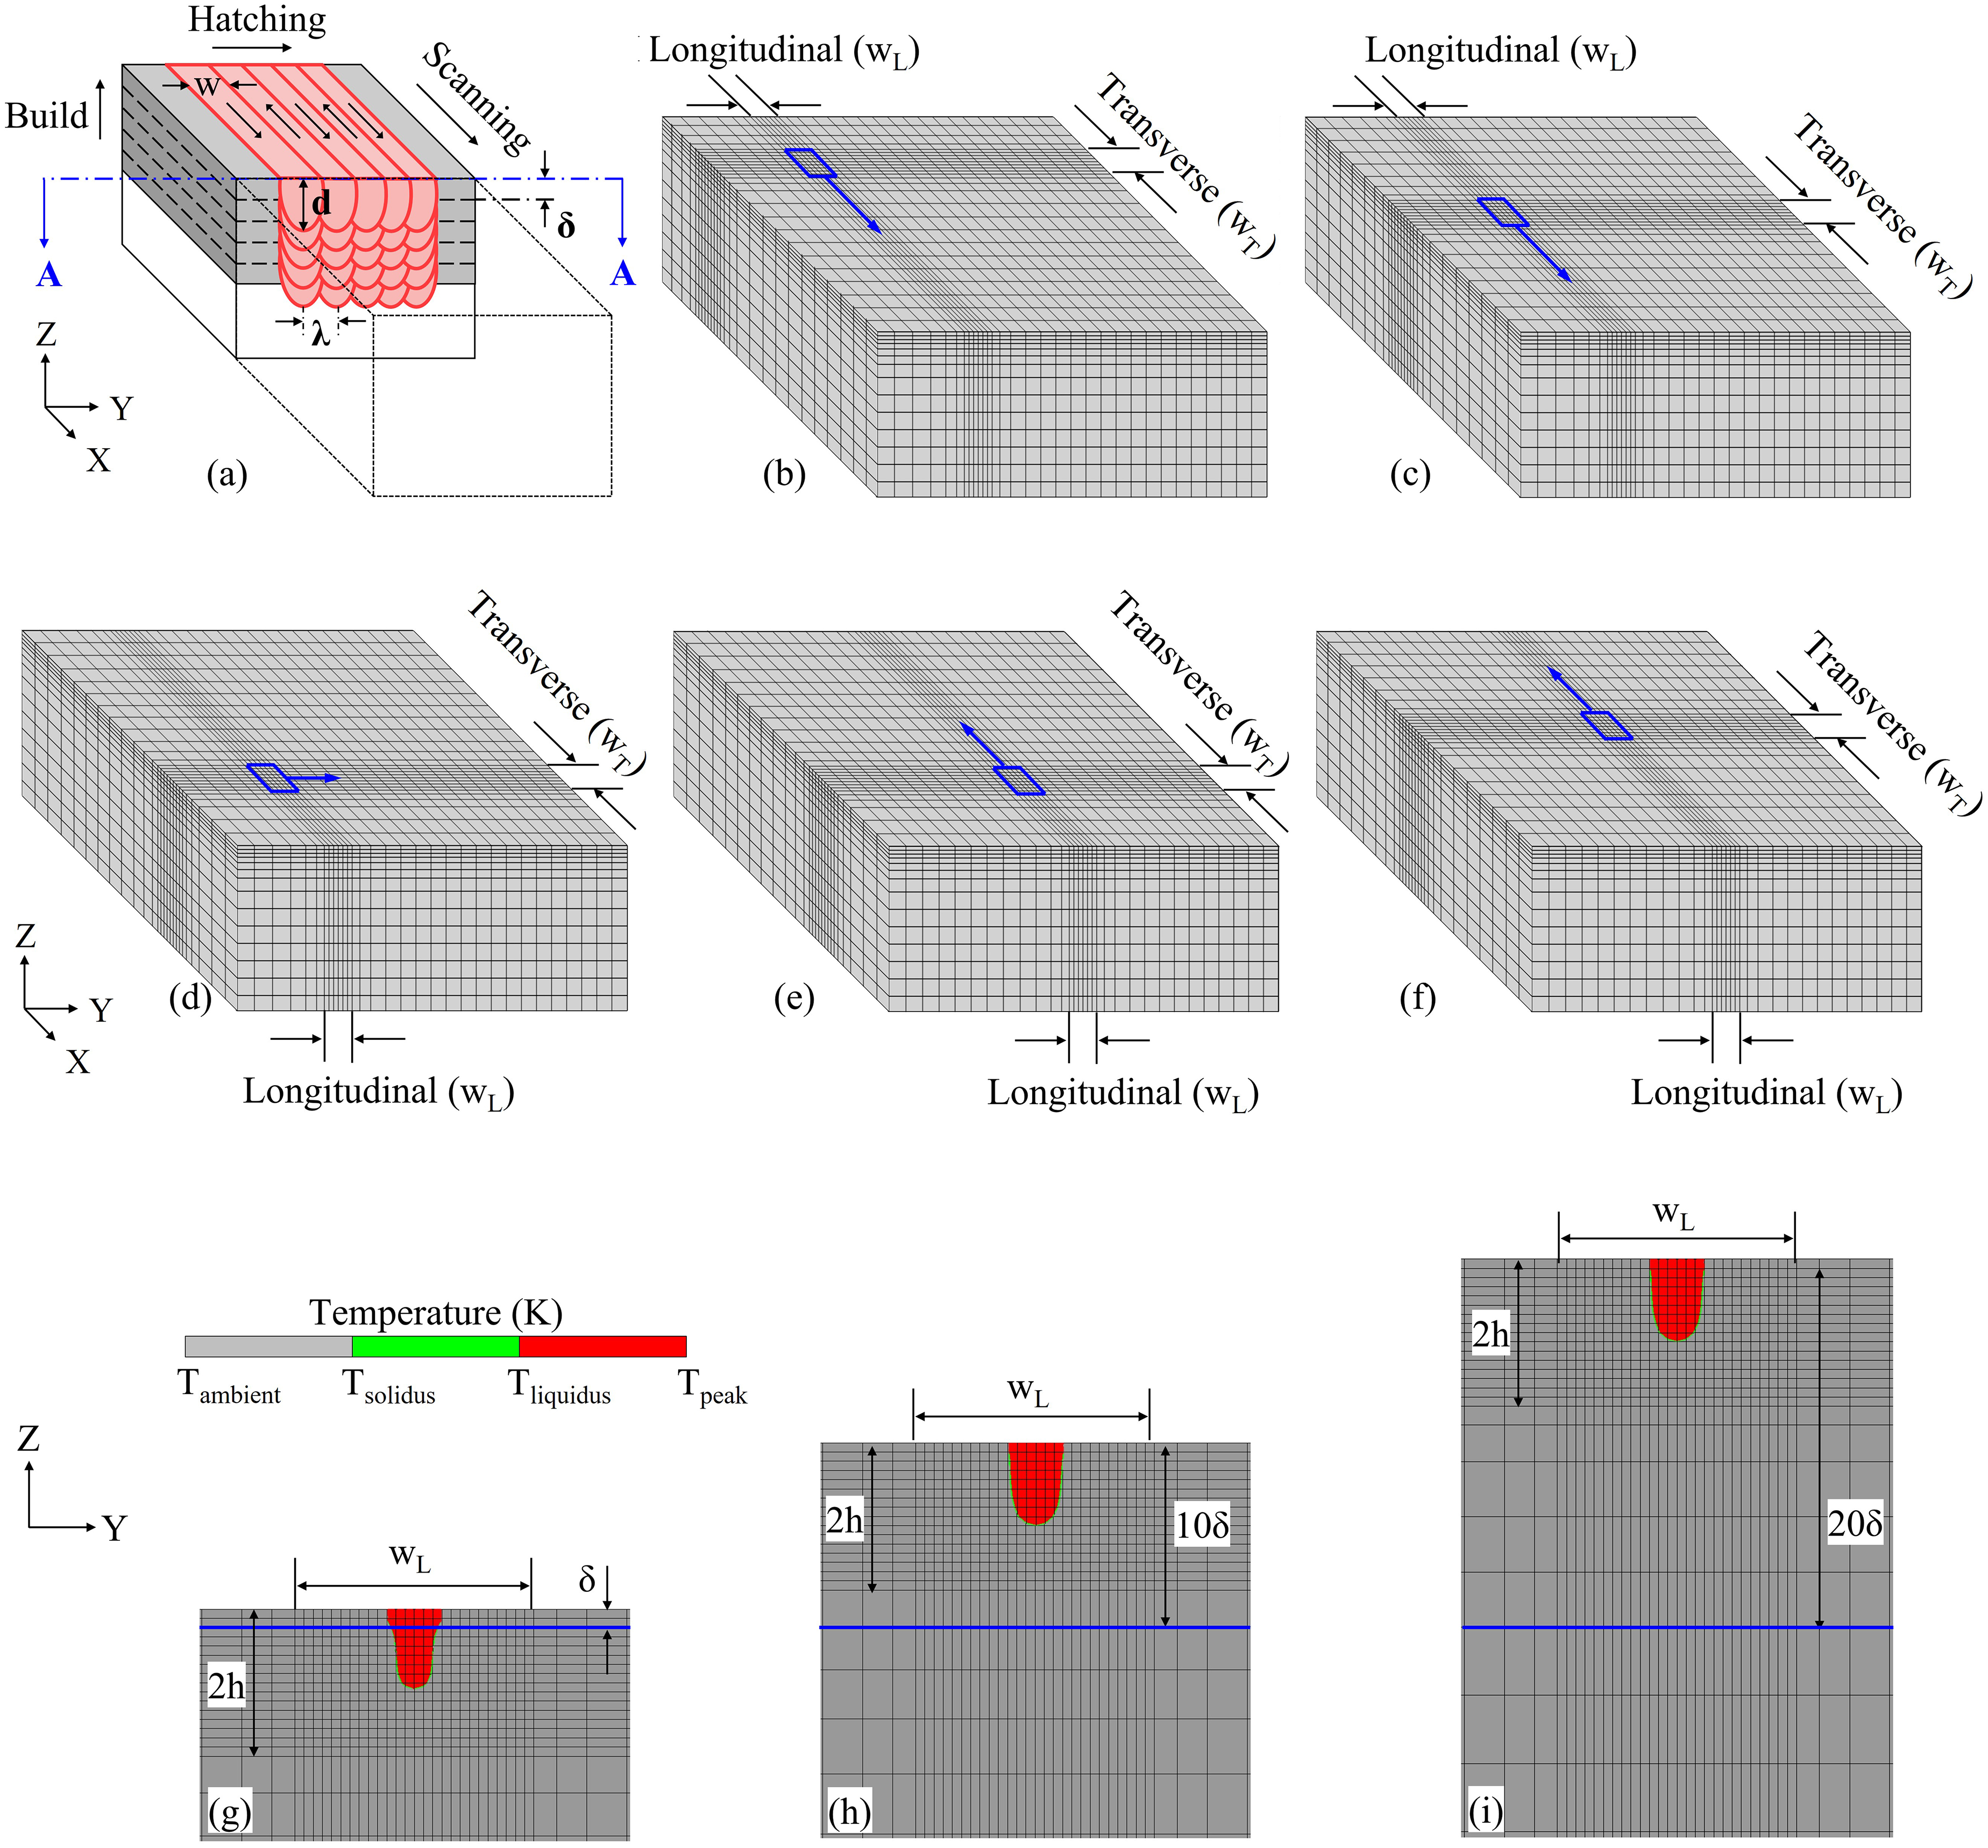
Schematic representation of (a) solution domain with the substrate (white), powder bed (grey) and the build (red) with cross-sectional view (A–A plane) of the melt pool at the mid-length of the tracks with layer thickness
Figure 1(b)–(f) depicts schematically the dynamic meshing strategy adopted in the present study. A finely meshed longitudinal region of width
Figure 1(g)–(i) schematically illustrates the upward progression of the fine mesh region along the YZ section (Figure 1(b)–(f)), in the build direction during successive layer simulations. The blue horizontal line in Figure 1(g)–(i) indicates the substrate-powder interface. In Figure 1(g), the first powder layer is represented by a finely meshed YZ section (
The dynamic mesh refinement with the progress of the tracks and layers is implemented using an APDL (ANSYS Parametric Design Language) macro in ANSYS (ver 2020). The powder layer elements are assigned thermophysical properties of the powder alloy, and are initially deactivated and activated in a layer-by-layer manner. The time-step
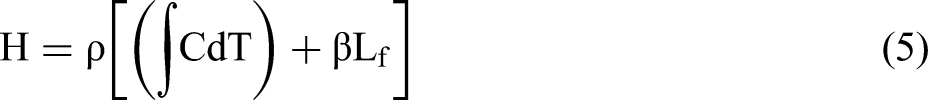
The detailed material properties, which are considered for the modelling calculations, are presented in the section S1 of the Supplemental Document. The density (


Dimensional analysis for heat source
The volumetric heat source term in equation (2) is a function of the laser beam power (P), absorption coefficient (
An increase in the laser power (P) results in a greater melt pool volume and its track depth.
29
An increase in the scanning speed (v) reduces the energy input per unit length of deposition resulting in a smaller track depth.
30
A smaller beam radius (
Considering the aforementioned eight variables (


The derivation of the π-terms in equations (7–10) are presented in the section S1 of the Supplemental Document. The π-terms in equations (7–10) are rearranged to express the track depth (
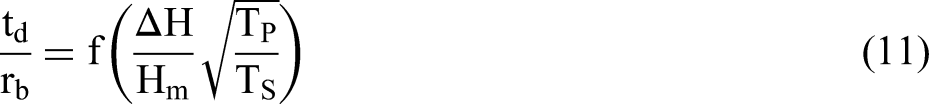
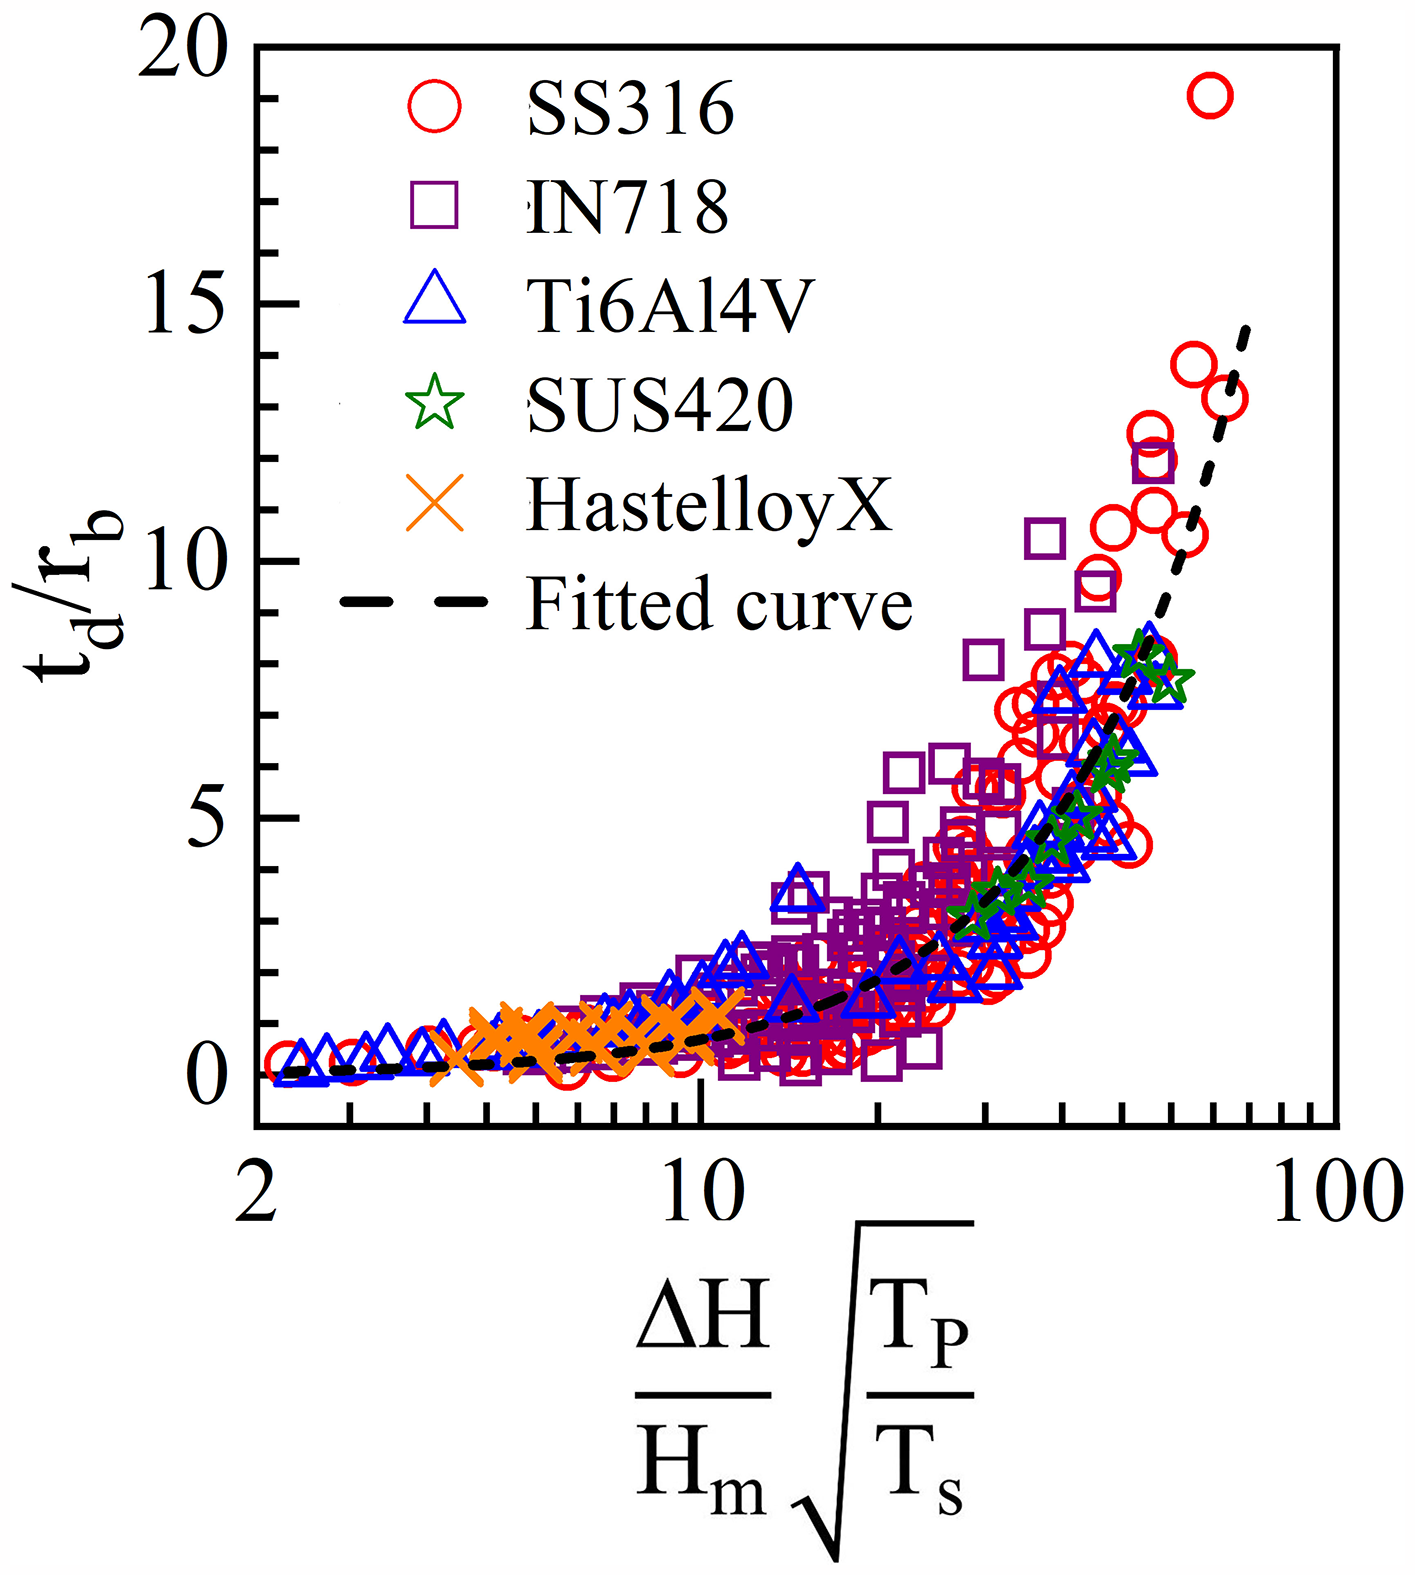
A range of experimentally measured track depths and the corresponding process conditions for LPBF of five commonly used alloy powders from literature27,29,38–50 are used to obtain the final form of equation (11) as
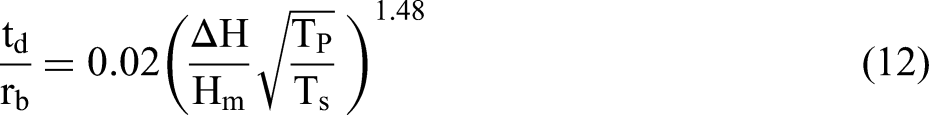
Figure 2 shows the best fit line for the term (
Experimental results
A commercial 3D printing system, iFusion SF1 (Intech Additive Solutions, India) with a continuous wave ytterbium fiber laser and the maximum laser power of 500 W is used to prepare the sample deposits within an Argon atmosphere with the oxygen content below 0.1%. The commercial powder alloys SS316L, IN718 and H13 tool steel are used with the powder size distributions of 15 to 48 μm (
Experimental conditions for LPBF.
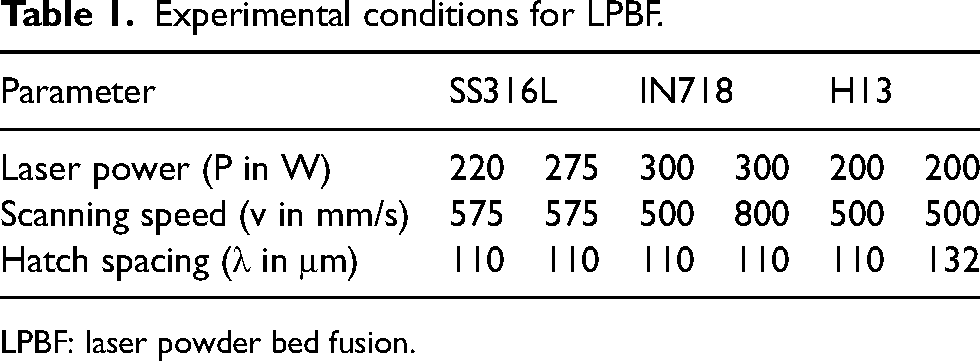
LPBF: laser powder bed fusion.
The deposited specimens are sectioned along the YZ plane (Figure 1(a)) and etched suitably for microstructural characterization. SS316L samples are etched electrochemically using 10% oxalic acid (4 V) at room temperature. The IN718 and H13 samples are subjected to chemical etching by Kaling's 2 reagent and 2% Nital solution, respectively. The samples are examined under a stereomicroscope (Zeiss, AXIO Imager) to view the melt pool morphology. The track depth is measured from the melt pool macrographs using ImageJ software.
Results and discussions
A solution domain of size 10 (length), 6 (width) and 5 mm (thickness) is used for the numerical modeling of all the five-track five-layer LPBF depositions. The track length is considered as 8 mm. The minimum element size for the fine mesh zone is considered to be 24 μm and the same is arrived at based on several numerical iterations, as presented in the section S3 of the Supplemental Document. The laser beam is set to scan through the entire track length with the activation of a preset number of elements in each time-step to account for the deposition of powder alloys. The modelling calculations are carried out in a desktop computer with a 3.4 GHz processor of 16 cores.
Model validation
Figure 3(a)–(c) shows the 3D view of the computed temperature field for the LPBF of SS316L for a laser power of 220 W and 575 mm/s. The melt pool is distinguished by the region enclosed by the liquidus temperature isotherm (1723 K). Figure 3(b) shows the top view of the melt pool with an elongated trailing edge. Figure 3(c) shows the transverse sectional view of the melt pool exhibiting the width along the top surface and depth in the thickness direction. A comparison of the computed temperature field and the melt pool dimensions using dynamic meshing strategy and uniform meshing strategy has showed a discrepancy of around 7% to 10%.
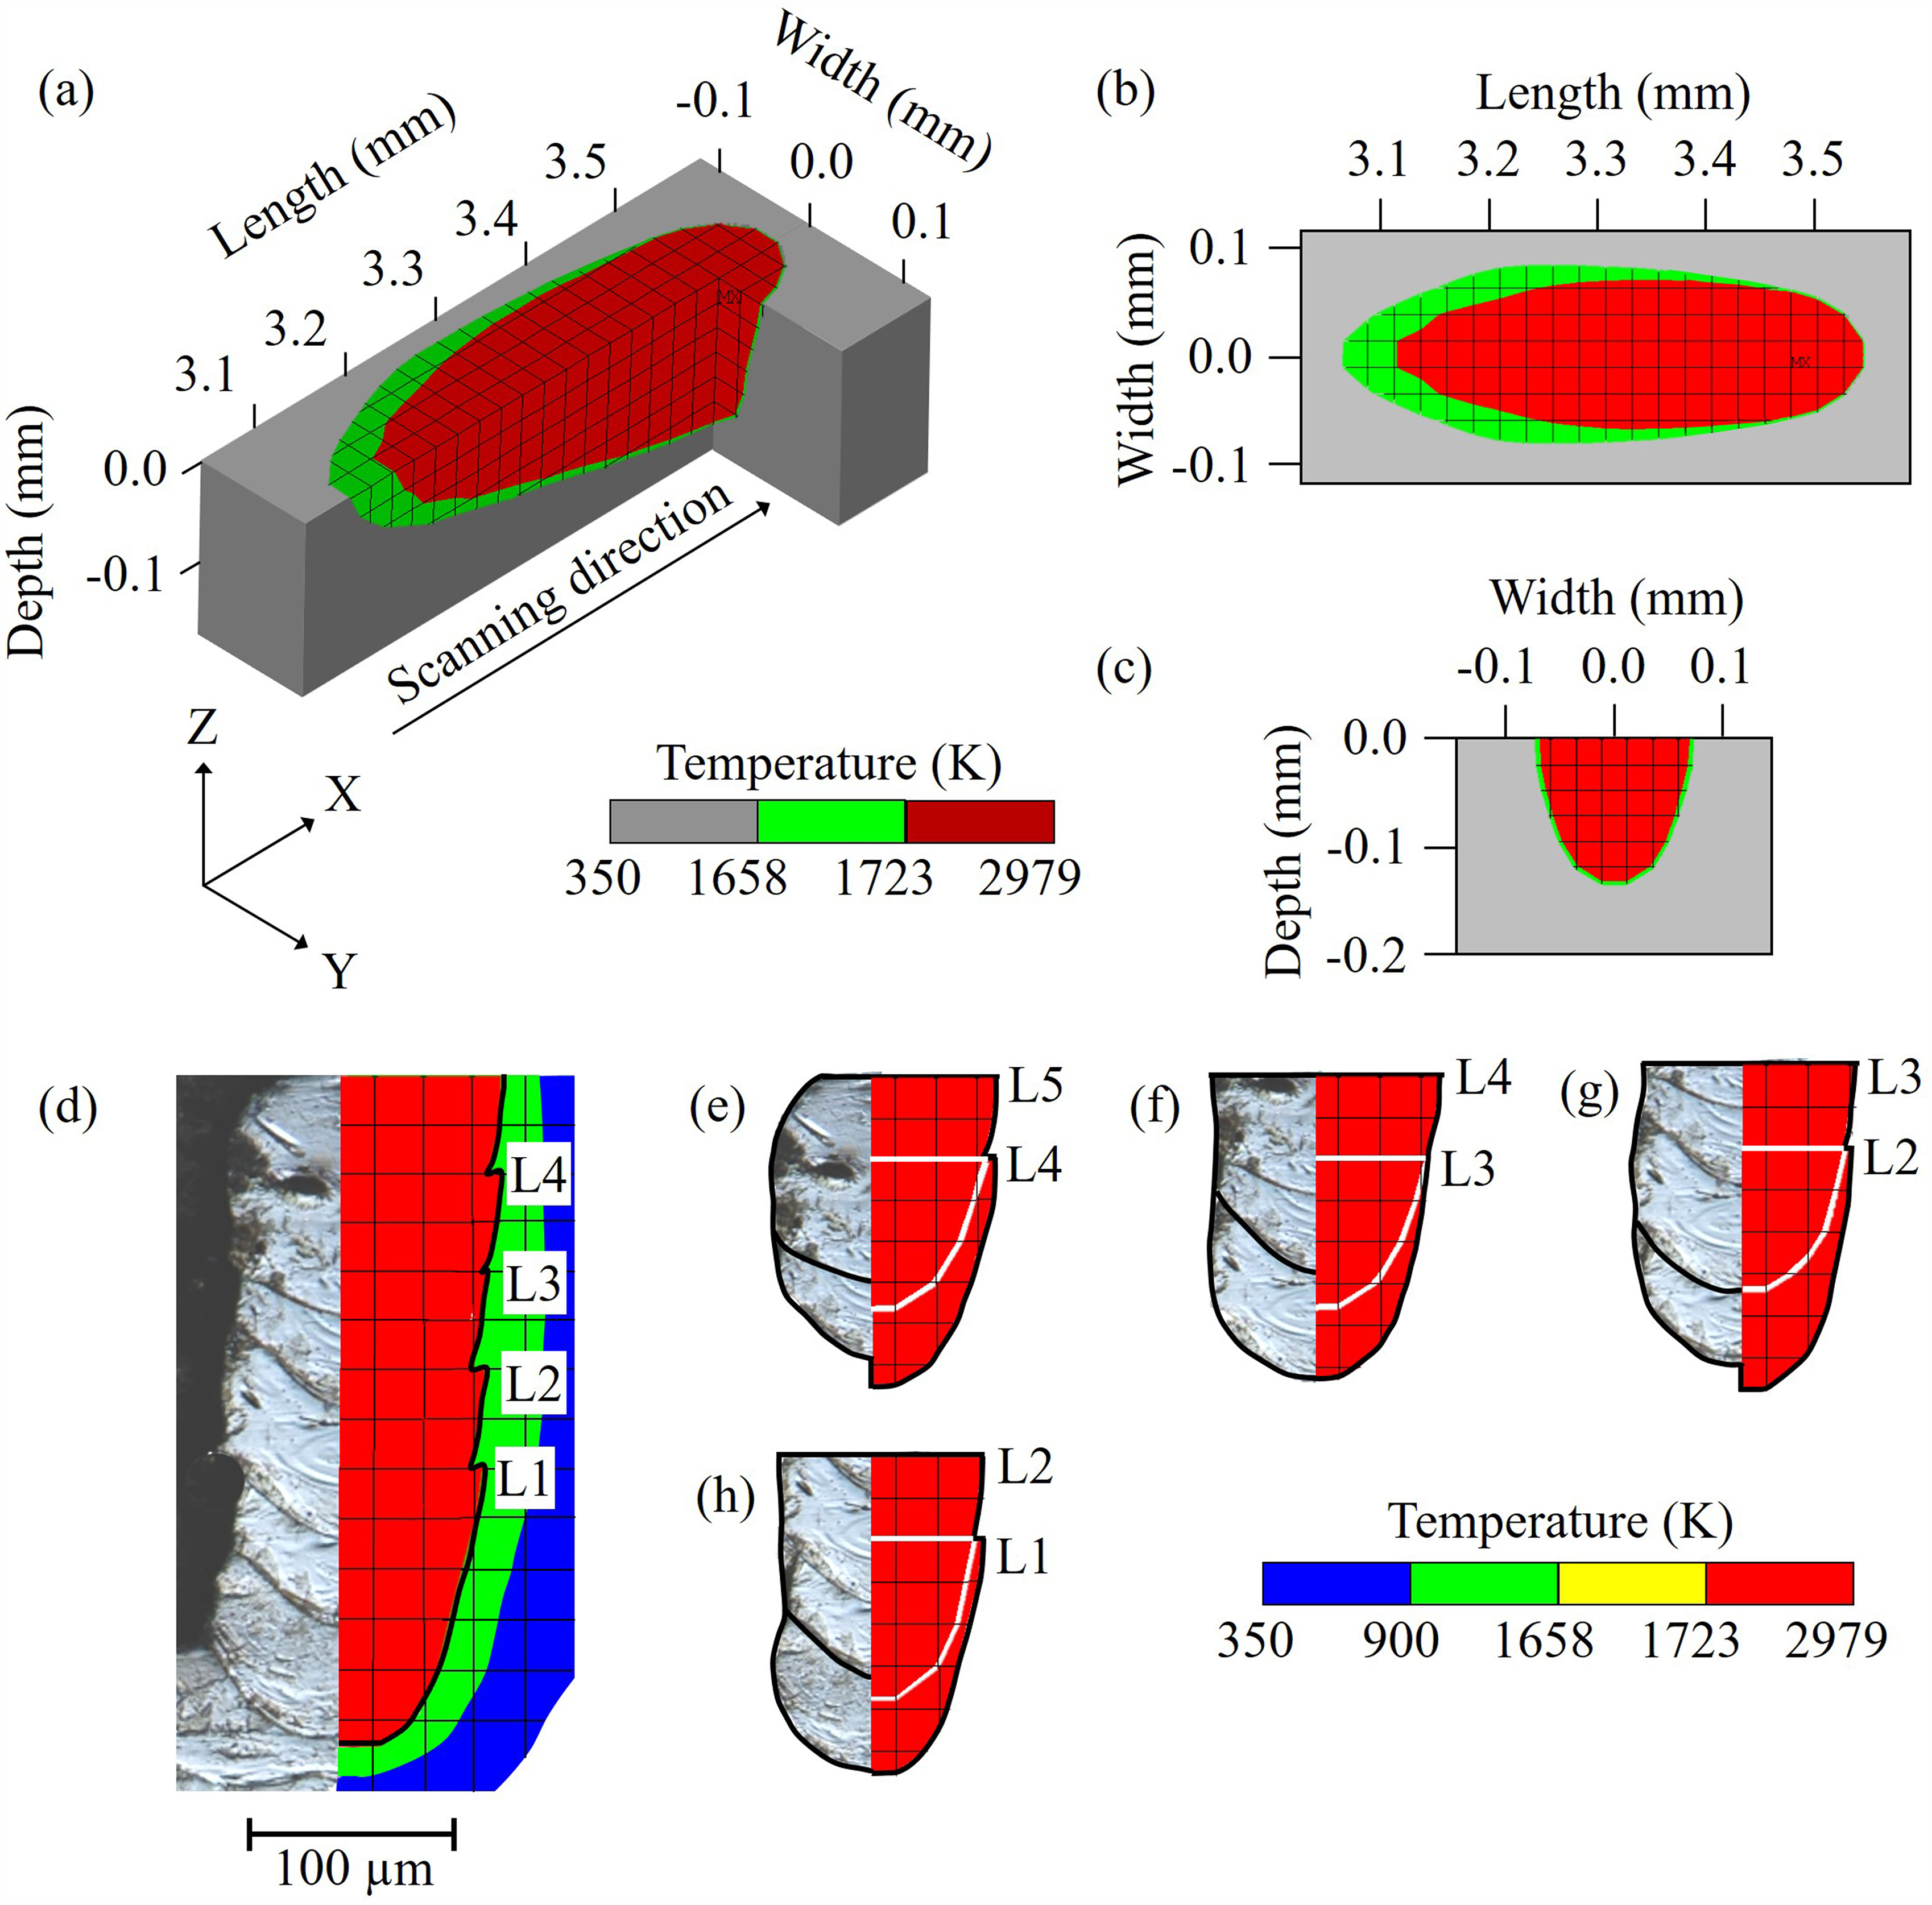
(a)–(c) Numerically computed temperature distribution for a single-track deposition of SS316L for a laser power of 220 W and scanning speed of 575 mm/s (a) three-dimensional view, (b) top view (XY) and (c) transverse cross-sectional view (YZ). (d)–(h) Experimentally measured and numerically computed melt pool cross-section of SS316L alloy for a laser power of 220 W and scanning speed of 575 mm/s, (d) single-track five-layer deposition, (e)–(h) layer wise build profile showing the melt pool profile of layers: (e) 5 and 4, (f) 4 and 3, (g) 3 and 2, and (h) 2 and 1.
Figure 3(d)–(h) shows a comparison of the numerically computed and the corresponding experimentally measured cross-section for a single-track five-layer LPBF of SS316L. The top surfaces of the layers are designated as L1 through L5, where L5 represents the topmost layer. A slight increase in the melt pool width from the bottom through the successive upper layers is noted in Figure 3(d), which is attributed to a decreasing rate of heat dissipation as the deposition moves to upper layers away from the substrate. 51
Figure 3(e)–(h) shows a fair comparison of the experimental measured and corresponding computed profiles of two consecutively deposited layers from the topmost to the bottom layers. Figure 3(e) shows that the deposition along the fifth layer L5 involves the remelting of the entire fourth layer L4, delineated by a white line, and even beyond that. Likewise, Figure 3(f)–(h) shows a significant remelting of the bottom layers during the deposition of the immediate upper layers for the selected LPBF condition. It is noteworthy that the numerically computed profiles can provide a distinct quantitative estimate of the remelting of the bottom layers during the deposition of an upper layer, which is difficult to realize in the actual measured profiles.
Figure 4(a) and (b) shows a comparison of the experimentally measured cross-section at the mid-length of the track and the corresponding numerically computed melt pool cross-section for a five-track five-layer LPBF of SS316L powder alloy for a laser power, scanning speed and hatch spacing of 220 W, 575 mm/s and 110 µm, respectively. The melt pool depth is measured only for the topmost layer as the remelting of the intermediate layers precludes any possibility to measure the pool depths of the lower layers. The average computed pool depth for the topmost layer is around 135 µm in Figure 4(b) in comparison to the corresponding measured values in the range of 122 to 158 µm in Figure 4(a). It can be noted that the numerical model assumes a flat top surface and is therefore incapable to account for the surface irregularity as observed in Figure 4(a).
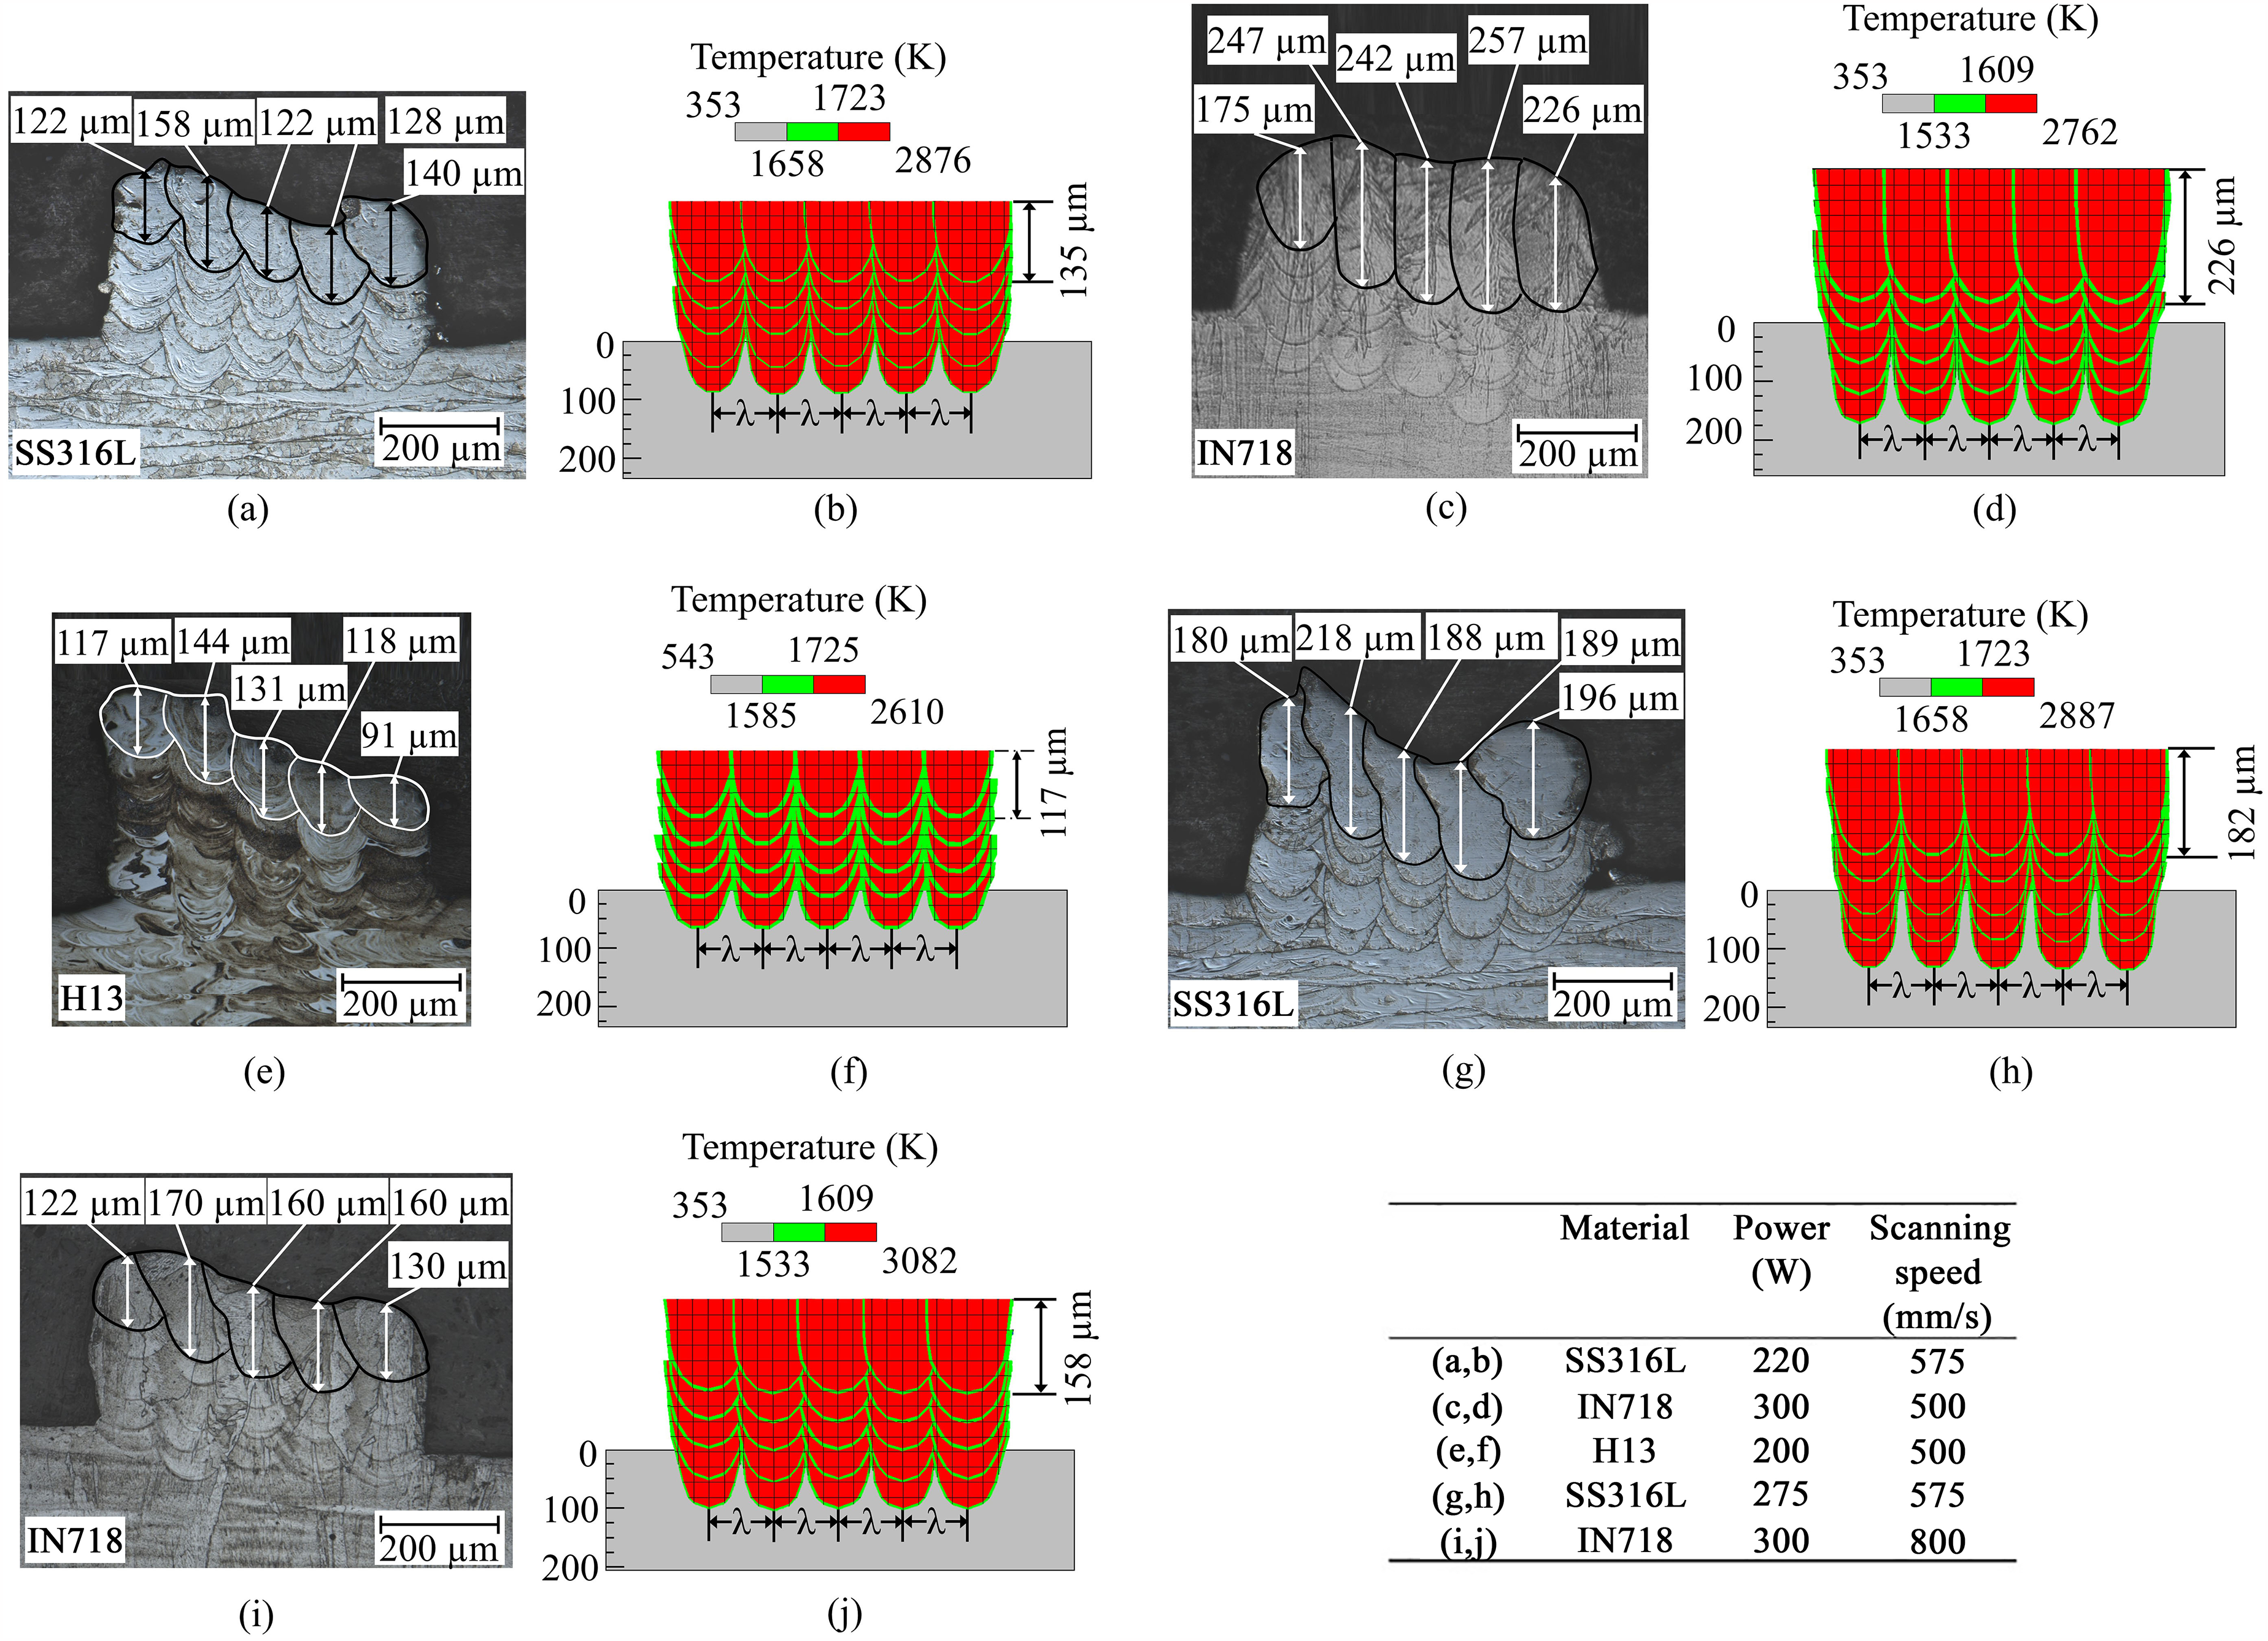
(a, c, e, g, i) Experimentally measured and the corresponding (b, d, f, h, j) computed melt pool cross-section of five-track five-layer LPBF of (a, b, g, h) SS316L, (c, d, i, j) IN718 and (e, f) H13 powder alloys. The corresponding LPBF process conditions are specified in the table. LPBF: laser powder bed fusion.
The proposed model is tested further to compute the melt pool dimensions for multi-track multi-layer LPBF of IN718 and H13 powder alloys. Figure 4(c) and (d) shows a comparison of the experimentally measured and the corresponding computed melt track dimensions for a five-track five-layer LPBF of IN718 powder for a laser power, scanning speed and hatch spacing of 300 W, 500 mm/s, and 110 µm, respectively. A comparison of Figure 4(a)–(d) shows a greater melt track depth in Figure 4(c)–(d) due to a higher energy input per unit length of deposition. The slightly reduced surface irregularity in Figure 4(c) is attributed to larger melt pool size and reduced angle of intersection between the adjacent pools. 52 A slight increase in the computed pool width from the left to right in the hatching direction in Figure 4(d) is attributed to the increase of resident temperature as more tracks and layers are deposited.
Figure 4(e) and (f) shows a comparison of experimentally measured and the corresponding computed melt track dimensions for a five-track five-layer LPBF of H13 powder for a laser power, scanning speed and hatch spacing of 200 W, 500 mm/s, and 110 µm, respectively. A comparison of Figure 4(a), (b), (e) and (f) shows a smaller melt track size in Figure 4(e)–(f), which is attributed to higher thermal diffusivity of H13 powder alloy. The discrepancy between the computed and the corresponding measured melt track dimensions in Figure 4(a)–(f) is well within 5% that manifests the robustness of the model computed results for LPBF of different powder alloys with varying thermophysical properties.
Influence of LPBF variables
The capacity of the proposed model to account for the impact of a range of LPBF variables on the computed melt track profiles is illustrated in Figure 4(g)–(j). A comparison of Figure 4(a), (b), (g) and (h) shows that an increase in the laser power from 220 to 275 W has resulted in an increase in the melt track depth for LPBF of SS316 powder alloy. Likewise, a comparison of Figure 4(c), (d), (i) and (j) shows a decrease in the melt track depth for LPBF of IN718 powder, which is attributed to a higher scanning speed from 500 to 800 mm/s and the reduced energy input per unit length of deposition. Figure 4(g)–(j) shows a fair agreement between the computed and corresponding experimentally measured deposited track profiles although the surface irregularity cannot be accounted for in the model.
The proposed numerical model was also validated against LPBF data from independent literature.46,47 For SS316L, Philo et al. 46 reported melt pool depths of 102, 150, and 244 µm for laser powers of 100, 150 and 200 W, respectively, at 300 mm/s scanning speed, while the model computed melt pool depths were 98, 135 and 225 µm, respectively. Similarly, Kamath et al. 47 observed the track depths of 124, 144 and 205 µm for scanning speeds of 1500, 1200 and 800 mm/s, respectively at 300 W laser power, with the model yielding corresponding values of around 113, 132 and 188 µm. These comparisons demonstrate the model to be fairly competitive and robust.
Estimation of the lack-of-fusion defects
Figure 5(a) and (b) compares the cross-section of the experimentally measured and the corresponding numerically computed melt pool shapes for LPBF of H13 powder alloy. A comparison of Figures 4(e) and 5(a) shows a tendency to lack-of-fusion with a greater hatch spacing of 132 µm (Figure 5(a)). The computed melt pool in Figure 5(b) also shows a reduced overlap between the adjacent tracks compared to that in Figure 4(f). An insufficient overlap between the melt pools is correlated with the lack-of-fusion defects in LPBF, 39 consistent with reports of increased voids at higher hatch spacing. 53 The model was further tested for conditions from literature, 4 where an increase in scanning speed from 700 to 1100 mm/s during LPBF of SS316L caused lack-of-fusion voids between the adjacent tracks. The proposed model also reproduced these results showing lack-of-fusion voids, attributed to insufficient energy input per unit deposition length at higher scanning speeds. 53
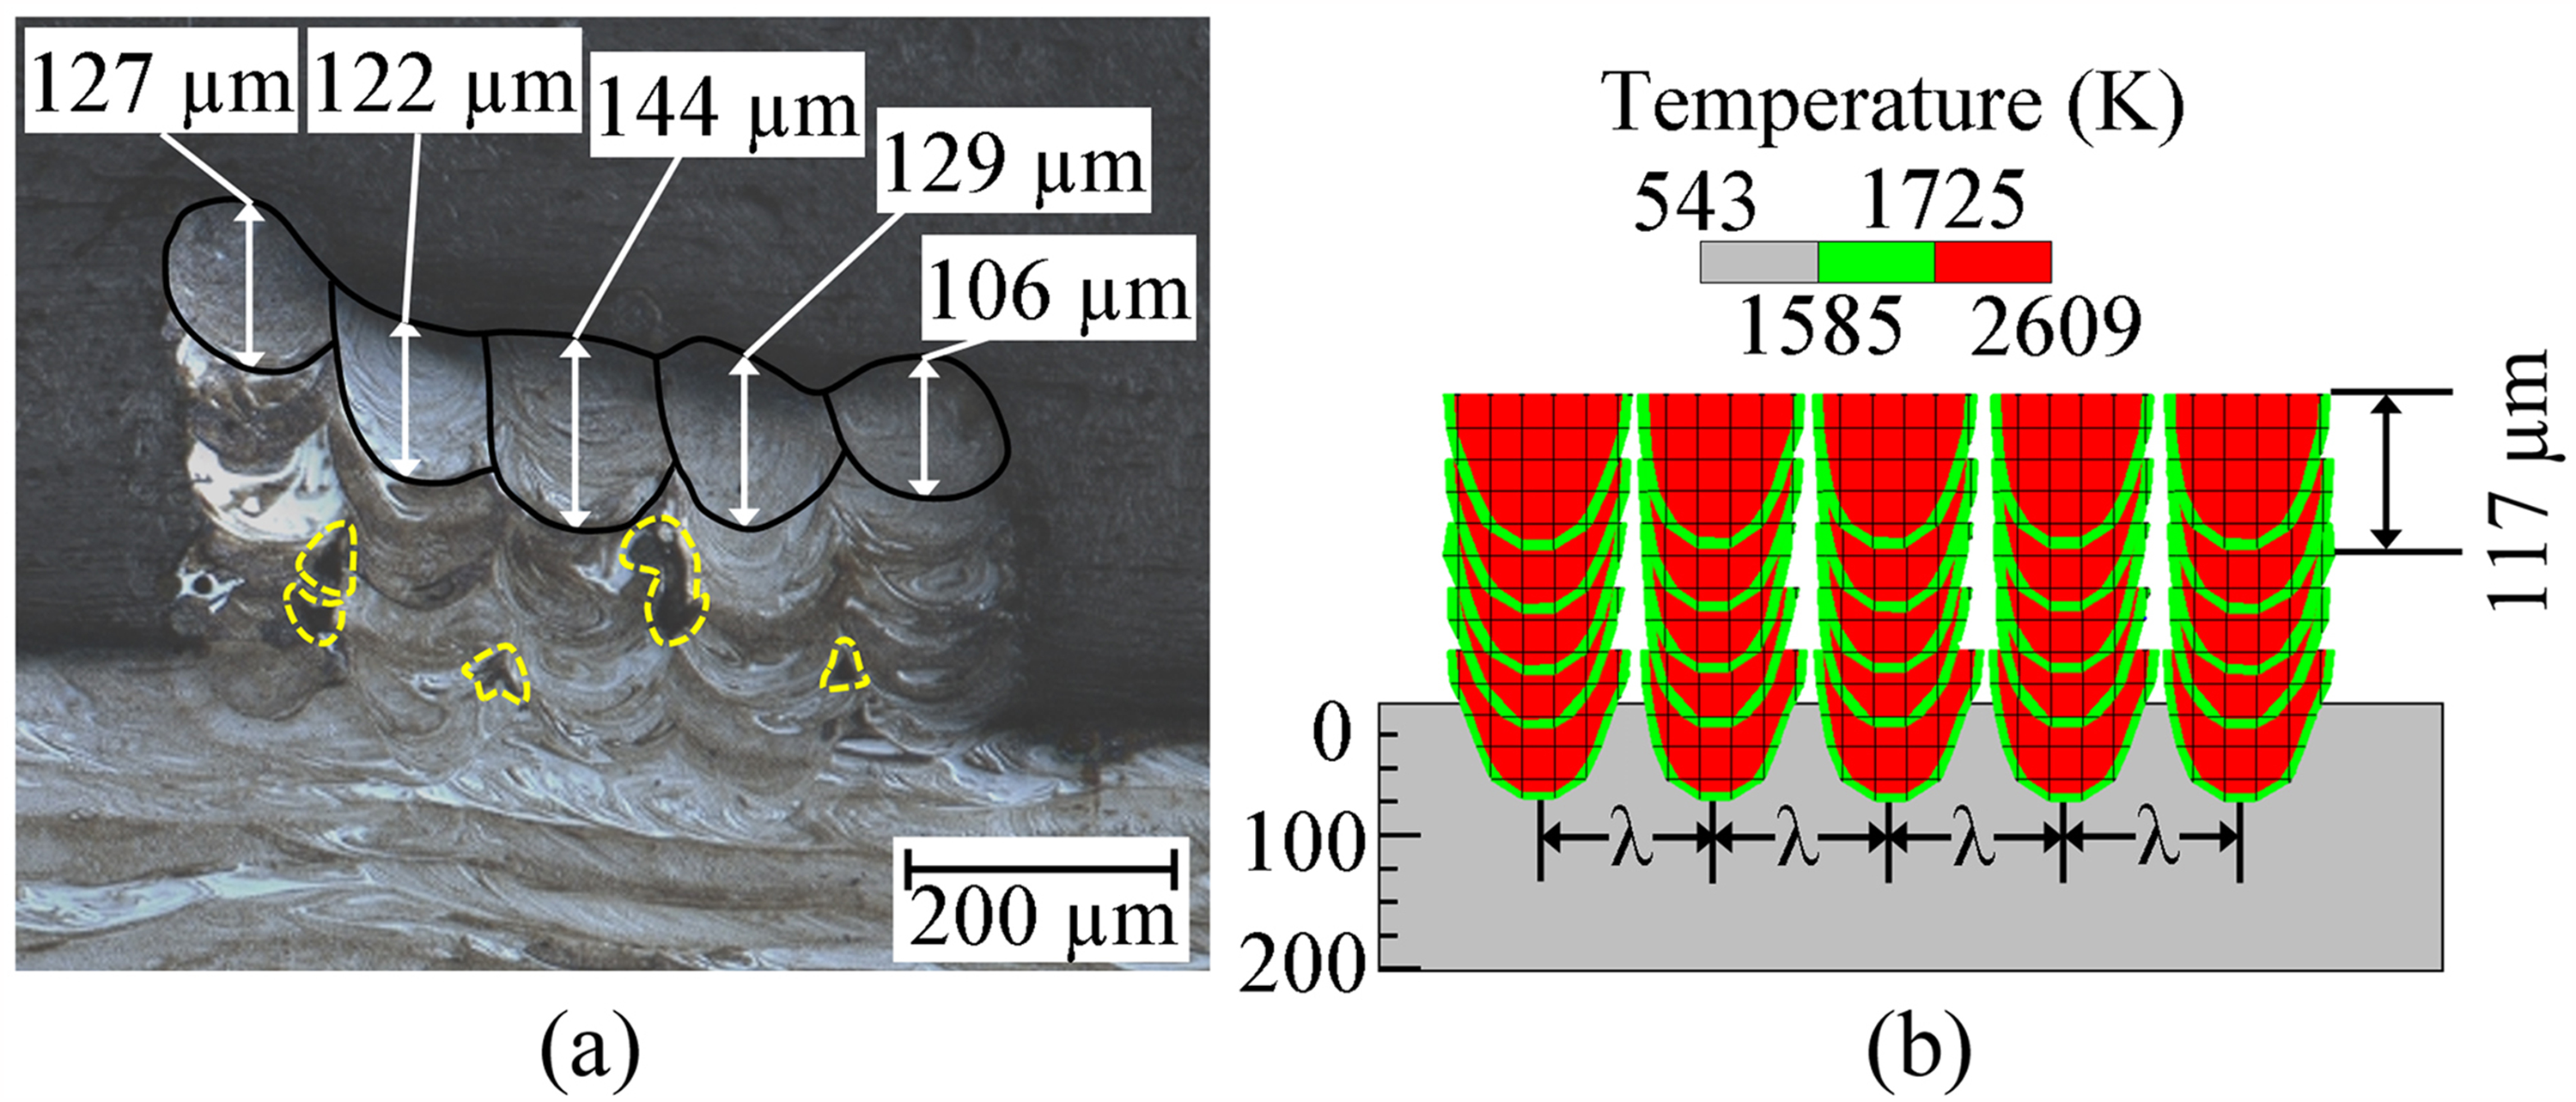
(a) Experimentally observed and the corresponding, (b) numerically calculated melt pool profiles of five-track five-layer deposition of H13 for a laser power of 200 W, scanning speed of 500 mm/s and hatch spacing of 132 µm. The regions marked in yellow lines indicate the lack-of-fusion defects (a).
Cooling rate
The numerically computed temperature field is used next to calculate the solidification cooling rate, which is crucial for determining LPBF part structure. Figure 6(a)–(c) compares the solidification cooling rates from the proposed model with the corresponding experimental data from literature54–59 for LPBF of common alloys. These figures show a decrease in the solidification cooling rate at upper layers, which is attributed to slower heat dissipation as the depositing layers move away from the substrate. Since the substrate acts as a heat sink, the temperature gradient decreases with each successive layer, lowering the cooling rate. The higher values of the computed solidification cooling rate are attributed to the neglect of the convective heat transport within the melt pool.60,61 Nevertheless, Figure 6(a)–(c) represents a fair agreement between the computed and experimental solidification cooling rates across various powder alloys and conditions.
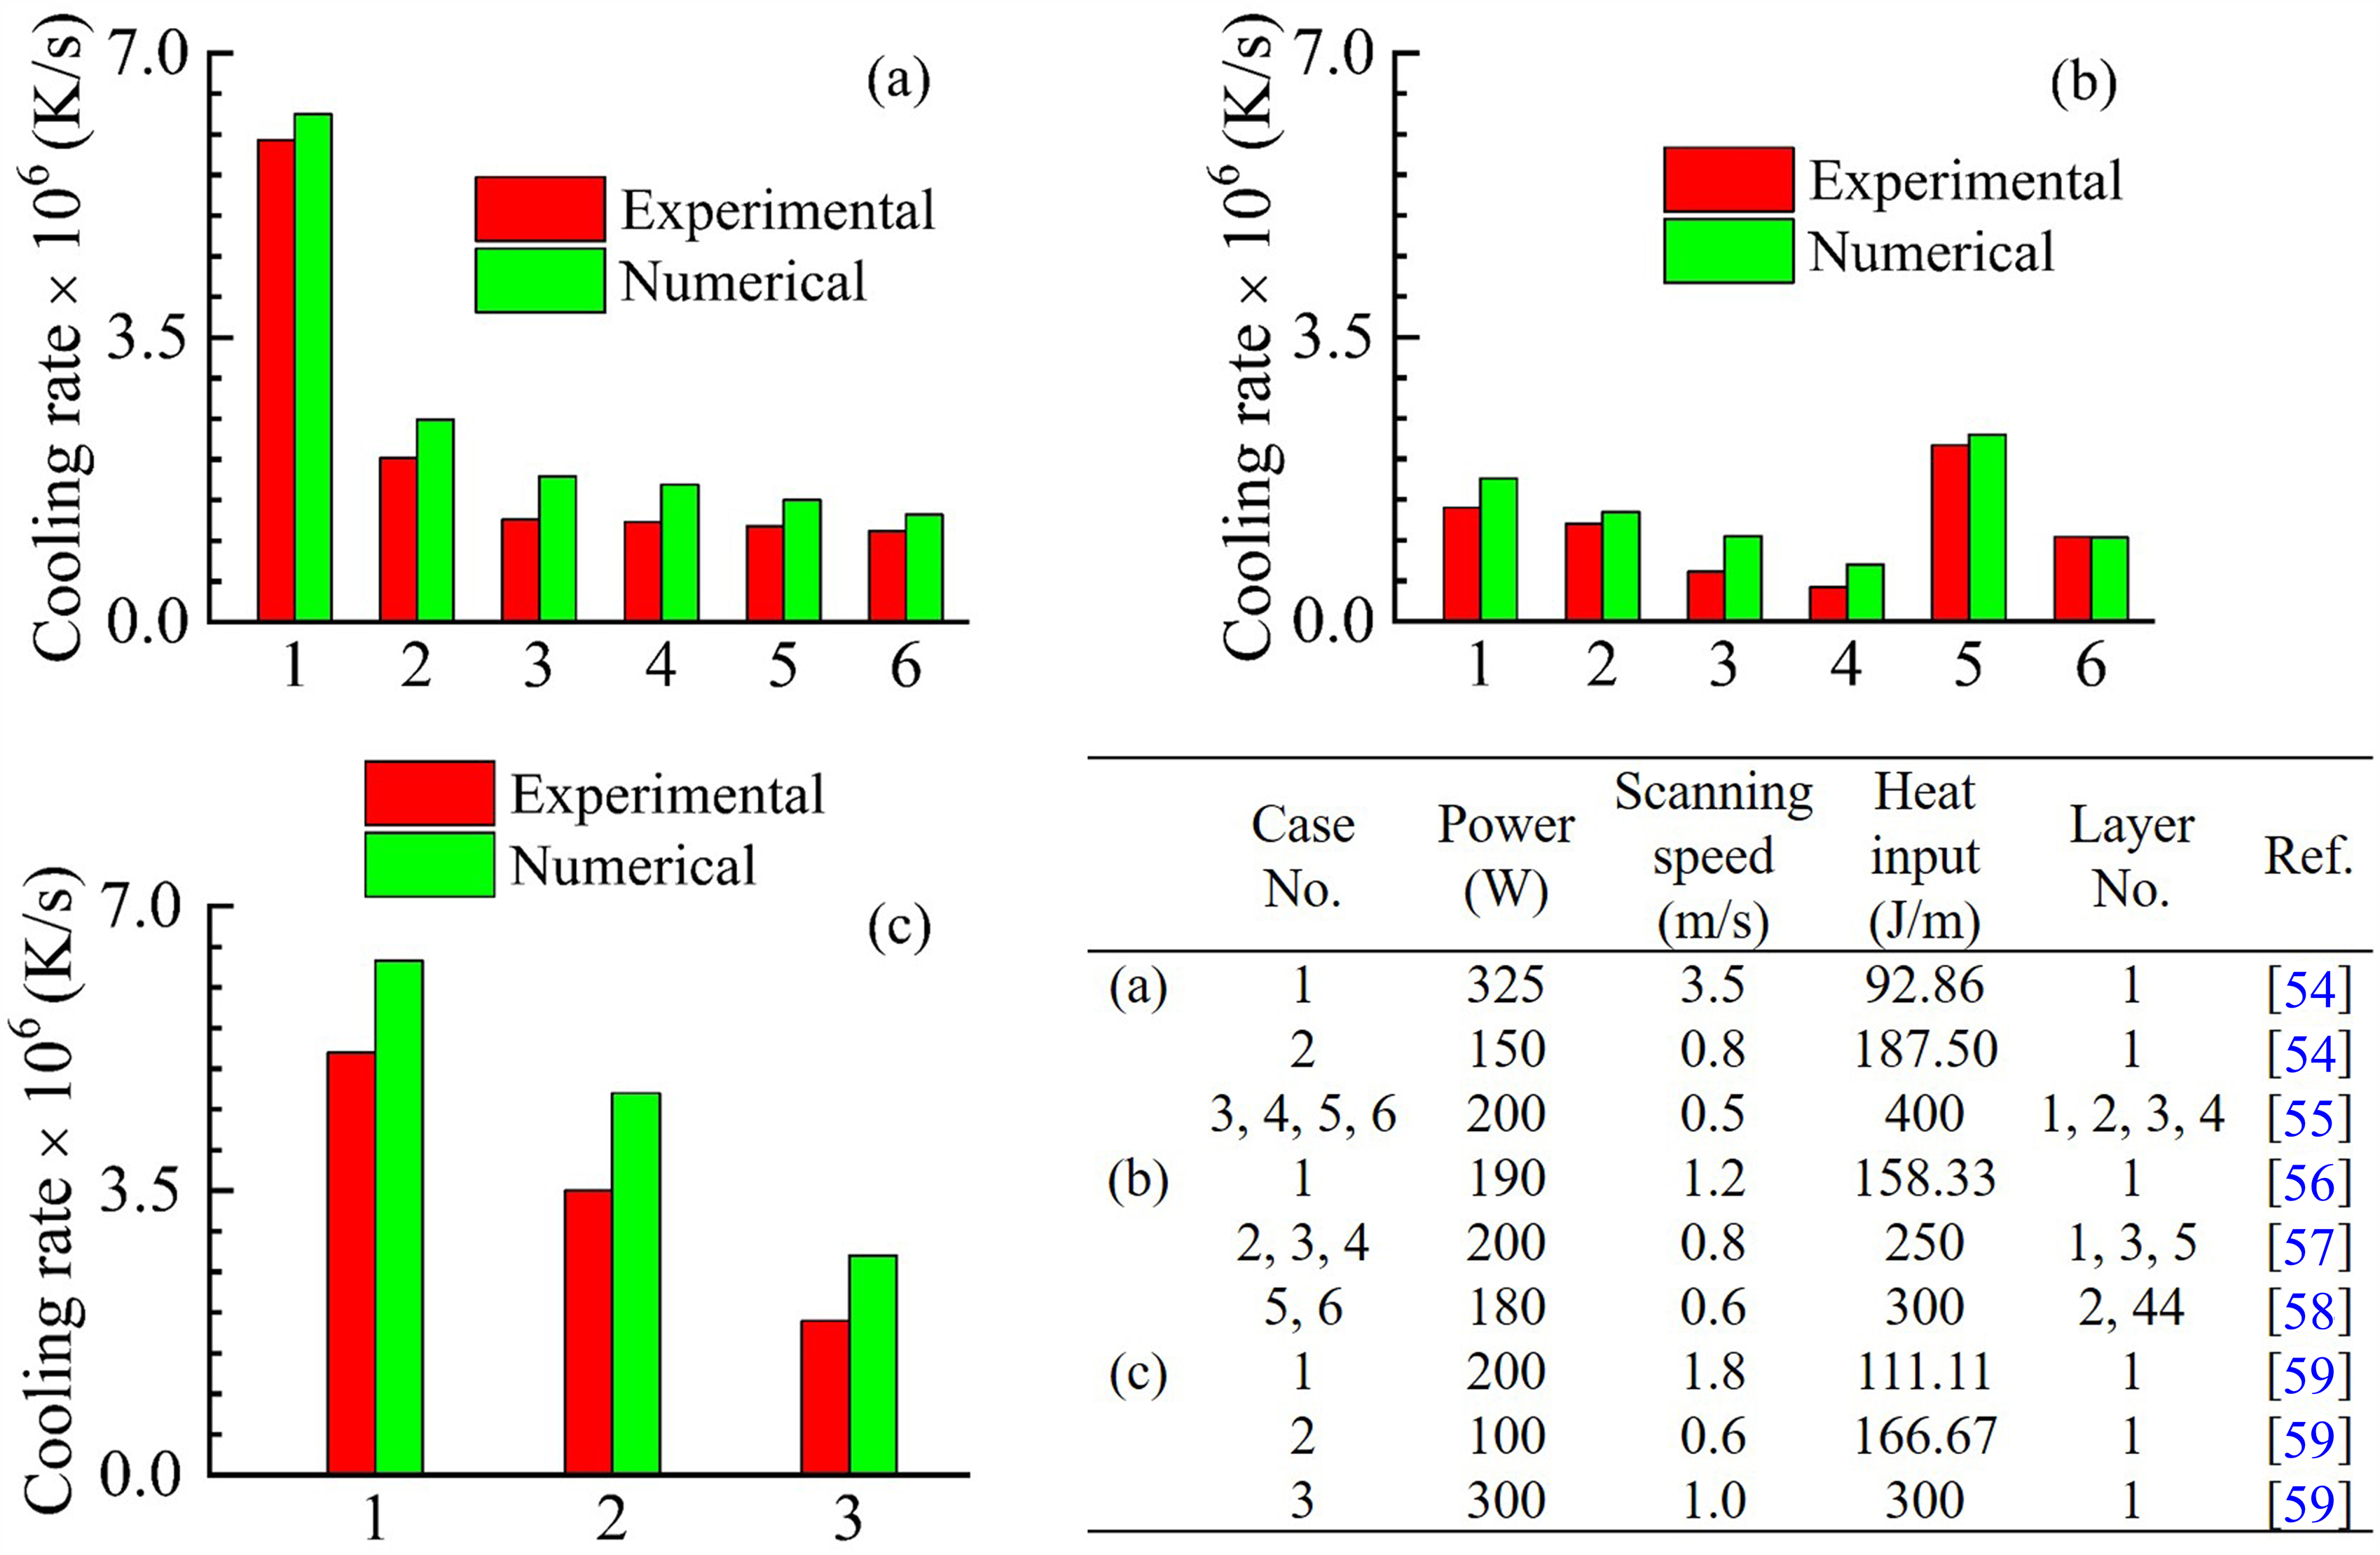
Comparison of the numerically computed and corresponding experimentally measured cooling rates for LPBF of (a) SS316L, (b) IN718 and (c) H13. The corresponding LPBF process conditions are specified in the table. LPBF: laser powder bed fusion.
The present model is also used to compare the solidification cooling rates with those reported in literature.55,62 Huang et al. 62 computed a solidification cooling rate of 3.3 × 10⁶ K/s at the center of the fourth layer for Ti-6Al-4V deposition with 50 W laser power and 500 mm/s scanning speed. The present model computed a reasonably comparable value of 3.56 × 10⁶ K/s. Similarly, Waqar et al. 55 reported a solidification cooling rate of 1.12 × 10⁶ K/s for 200 W laser power and 500 mm/s scanning speed, which also matches well with the computed value of 1.31 × 10⁶ K/s from the present model.
Computational time
Figure 7(a) and (b) compares the total number of nodes and CPU time for the uniform and dynamic meshing strategies for three test cases of (tracks × layers). As shown in Figure 7(a), the dynamic meshing strategy restricts the number of nodes even with increasing tracks and layers. Figure 7(b) shows a significant reduction in the computational time with the proposed model with dynamic meshing strategy, compared to that with the uniform mesh model. The computational efficiency becomes more evident with increasing tracks and layers, owing to the movement of the dynamic mesh with the laser beam.
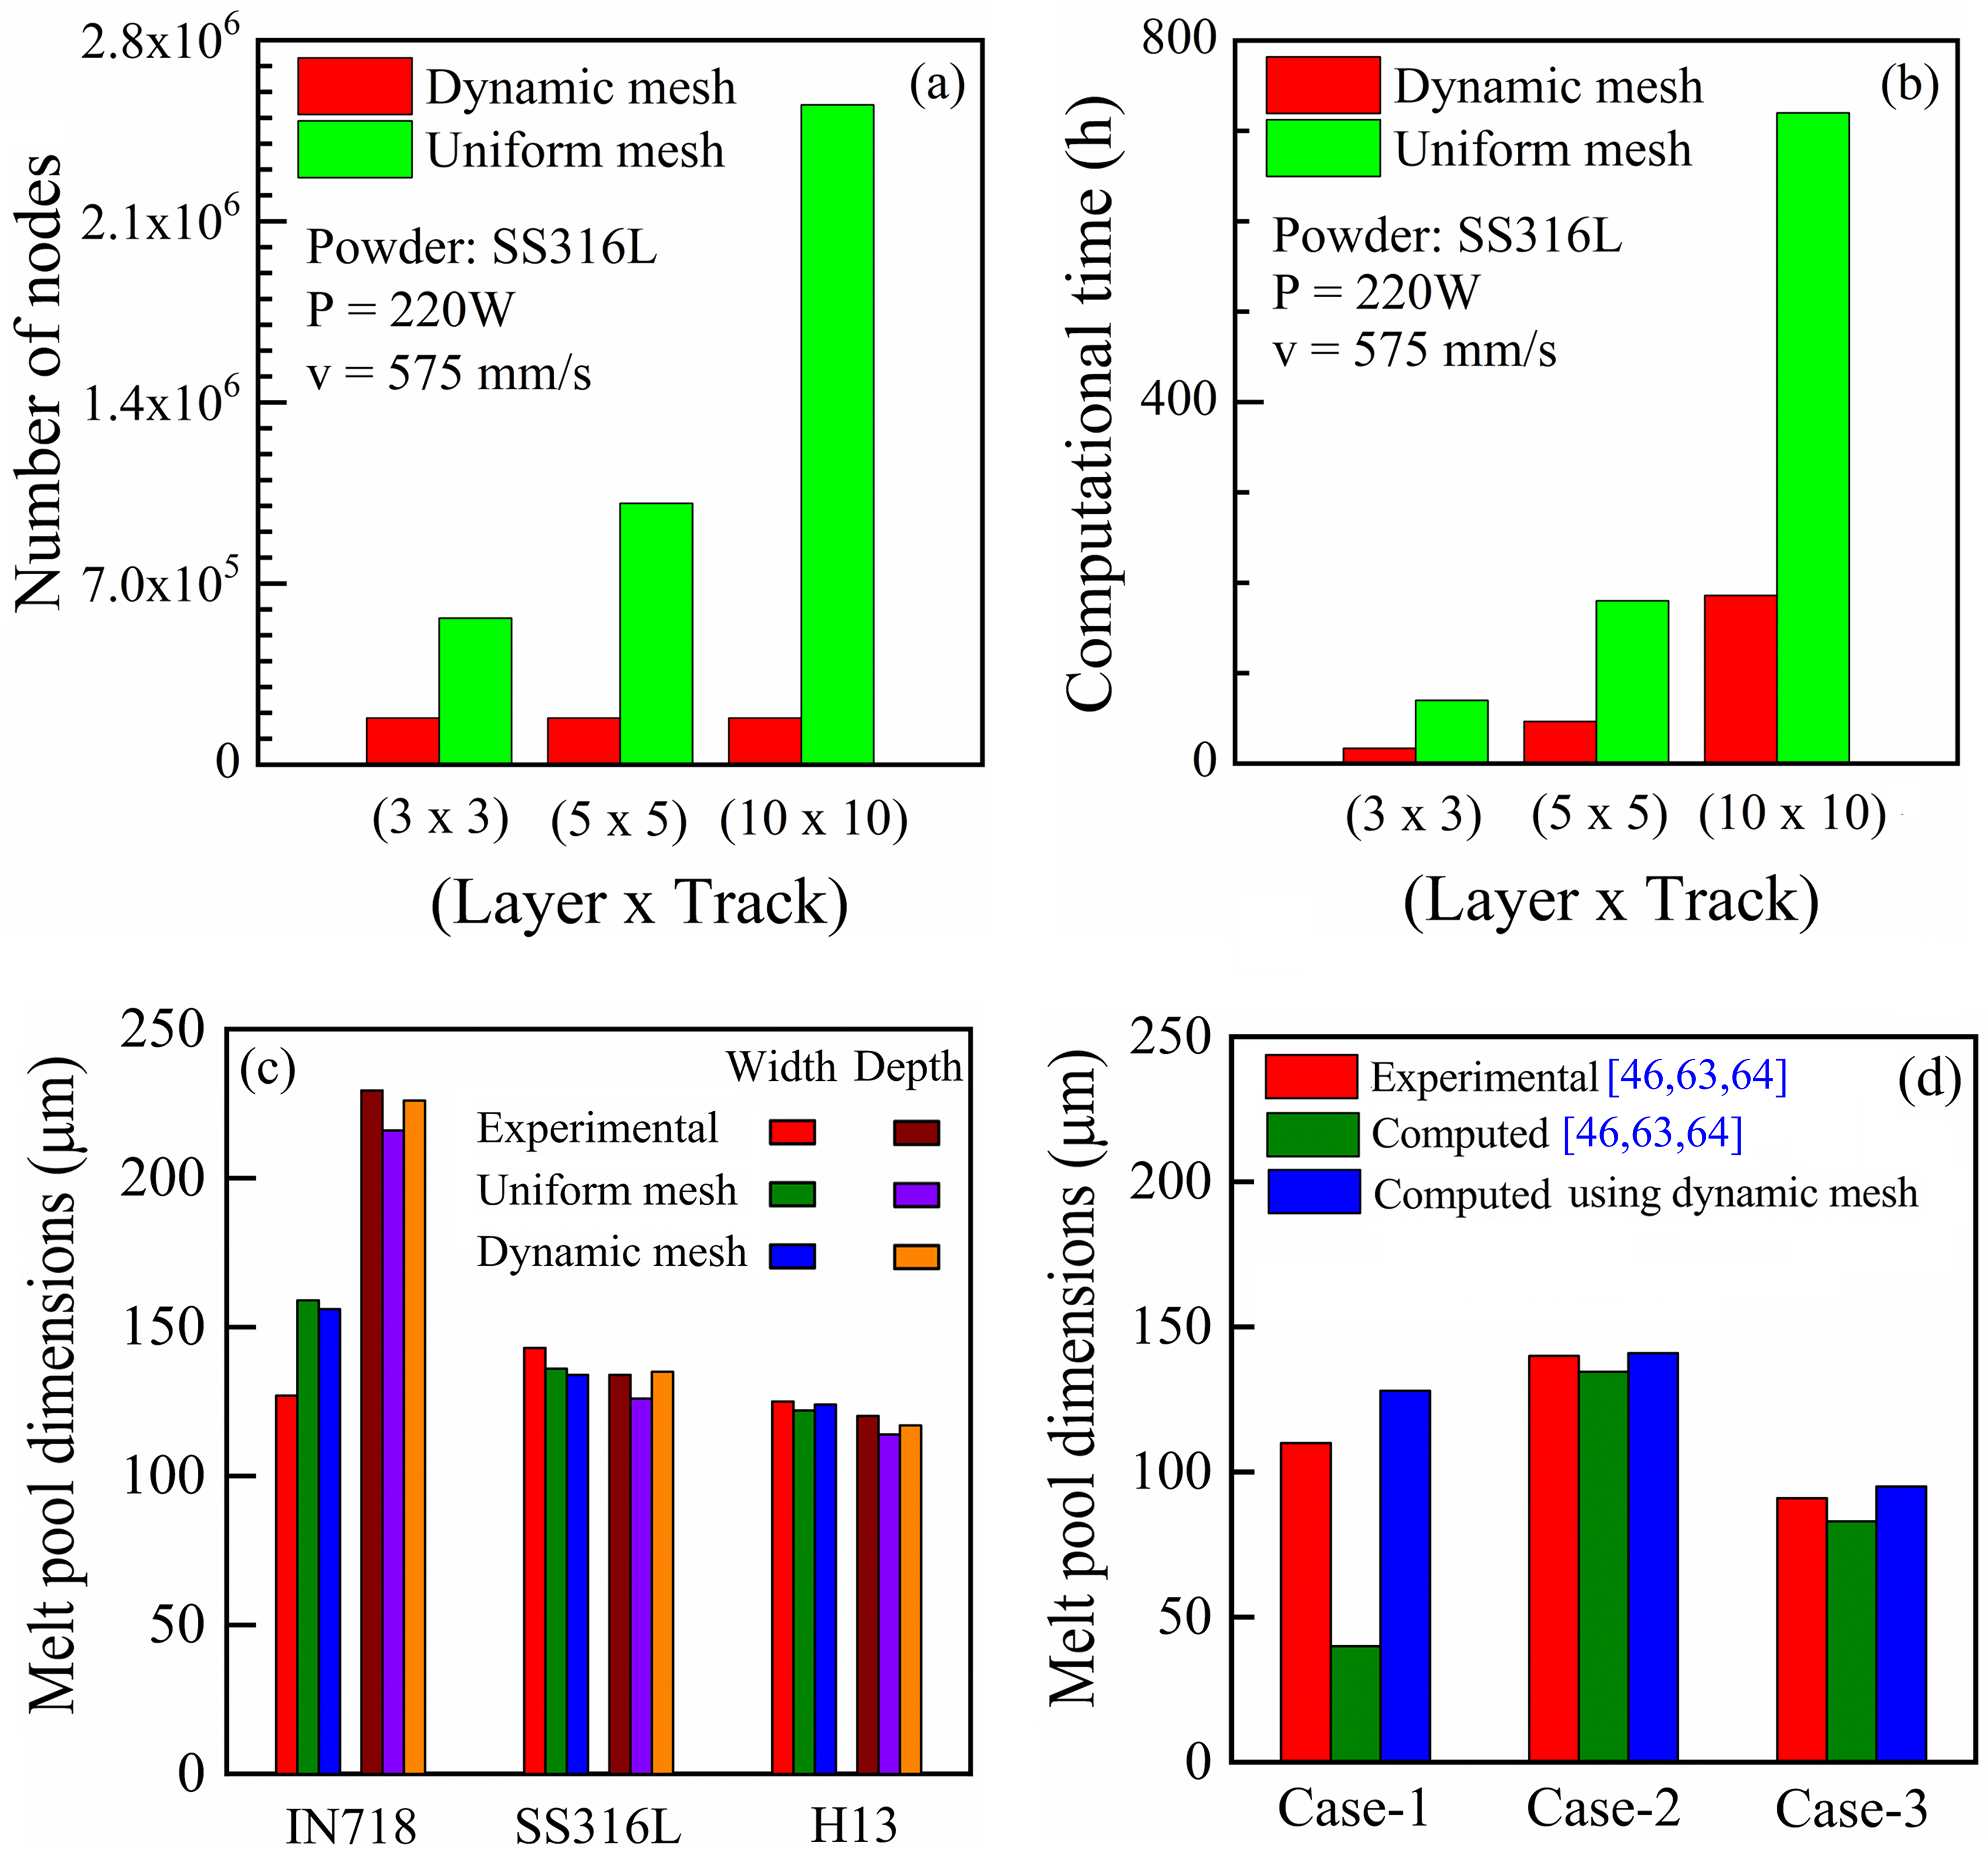
(a, b) Comparison of the (a) number of nodes and (b) CPU time for simulating diverse configurations of (layers × tracks) for LPBF of SS316L using dynamic and uniform mesh models, for a laser power (P) of 220 W and scanning speed (v) of 575 mm/s; (c, d) comparison of numerically computed and corresponding experimentally measured melt pool dimensions using uniform and dynamic meshing strategy for (c) LPBF of IN718, SS316L and H13, considered in this work, and (d) from literature46,63,64 for various configurations of (layers × tracks) for LPBF of SS316L; case 1 46 : (1 × 1) for P = 200 W and v = 400 mm/s; case 2 63 : (3 × 1) for P = 150 W and v = 100 mm/s; case 3 64 : (1 × 5) for P = 200 W and v = 400 mm/s. LPBF: laser powder bed fusion.
Figure 7(c) depicts a comparison of the computed melt pool dimensions using uniform and dynamic meshing strategies, and the corresponding experimentally measured results in the present study for IN718 (Figure 4(c)), SS316L (Figure 4(a)) and H13 (Figure 4(e)). The melt pool dimensions computed using the dynamic mesh exhibit a reasonable agreement with those obtained from the uniform mesh and the corresponding experimental results. Notably, the CPU time for uniform mesh calculations in Figure 7(c) is around 180 hours, which is significantly higher than that for the calculations using dynamic mesh strategy (∼ 45 hours). Figure 7(d) presents a comparison of the computed melt pool dimensions from the reported numerical models46,63,64 and the proposed numerical model in this work using dynamic mesh model against the corresponding experimentally measured values.46,63,64 The computed results from the proposed model in this work show a fair agreement with the corresponding experimentally measured values from the literature.
A further detailed comparison of the node numbers, computational and the result file size between the dynamic meshing strategy and uniform meshing is presented in the section S4 of the Supplemental Document. While the proposed model can be extended for modelling LPBF of a larger number of tracks and layers, applying it to part scale modeling would still entail significant computational challenges. The strength of the model is best appreciated for modeling up to around tens of tracks and layers, which is sufficient for a detailed analysis of local melt pool dynamics and solidification cooling rates. Efforts to enhance the computational efficiency for part scale modeling of LPBF are beyond the scope of the present study
Conclusions
A rapid 3D numerical heat transfer model is developed using dynamic meshing strategy and a unique heat source model to estimate the temperature field, melt pool dimensions and cooling rates during the deposition of multiple tracks and layers in LPBF. The numerically calculated results are validated against corresponding experimentally measured results, and the error percentages in the results are reported. In particular, the proposed model captures the influence of process conditions on the melt pool profile and cooling rates, for a wide range of powder alloys. This model allows to acquire a qualitative insight of the lack-of-fusion defects. The dynamic meshing framework provides a significant reduction in the computational time compared to a conventional uniform mesh. Following are the main conclusions.
The dynamic meshing strategy contrary to a uniform fine mesh for the entire deposition volume, depicted a significant reduction in the computational demand for numerical heat transfer analysis of LPBF. The proposed model with a tailored volumetric heat source term, provided a fair estimation of melt pool dimensions for LPBF of commonly used powder alloys across various process conditions, with a reasonable accuracy of around 95% vis-a-vis the corresponding experimental results. The computed results of the melt pool dimensions for a few tracks and layers are used to evaluate the susceptibility of a LPBF condition to lack-of-fusion defect with a reasonable accuracy. The nature of the progressively decaying cooling rates from the bottom to the upper layers for LPBF of multiple tracks is very well captured by the proposed model for a range of process conditions. This further shows the robustness of the numerical heat transfer model with the dynamically moving fine mesh region. An average of five-fold reduction in the computational time is achieved using the dynamic mesh model, which is attributed to the significant reduction of the total number of discrete elements and nodes. In summary, the dynamic meshing strategy offers a substantive route to undertake numerical modelling of multi-track multi-layer LPBF process with reasonable computational infrastructure.
Footnotes
Data availability
The raw/processed data required to reproduce these findings cannot be shared at this time due to technical or time limitations.
Declaration of conflicting interests
The authors declared no potential conflicts of interest with respect to the research, authorship, and/or publication of this article.
Funding
The authors received no financial support for the research, authorship, and/or publication of this article.
Supplemental material
Supplemental material for this article is available online.
References
Supplementary Material
Please find the following supplemental material available below.
For Open Access articles published under a Creative Commons License, all supplemental material carries the same license as the article it is associated with.
For non-Open Access articles published, all supplemental material carries a non-exclusive license, and permission requests for re-use of supplemental material or any part of supplemental material shall be sent directly to the copyright owner as specified in the copyright notice associated with the article.