
Abstract
This study aims to increase the penetration depth of an aluminium (A5052) weld pool in alternating current tungsten inert gas welding by controlling the cathode spot behaviour through the application of an external magnetic field. The external magnetic field direction was parallel to the base metal surface and perpendicular to the welding direction. The heat input from the distributed cathode spots was experimentally investigated using a high-speed video camera. The penetration depth almost doubled as a result of applying the optimal magnetic flux density of 5.5 mT. At this magnetic flux density, the largest number of cathode spots was concentrated in the weld pool, causing intensive heat input owing to the large cathode fall voltage and consequently leading to deeper penetration.
Keywords
Introduction
Aluminium alloys have excellent specific strength, corrosion resistance, and processability, making them essential materials in a wide range of industrial fields, including aerospace, automotive, marine structures and power and energy-related fields.1,2 Joining technology for aluminium alloys is essential for the construction of these structures. When using fusion welding, such as arc welding for joining, achieving sufficient penetration depth and stable joint quality for aluminium alloys remains a major technical challenge.3,4 Aluminium alloys have a thermal conductivity three to four times higher than steel and nickel-based alloys. Because the thermal energy provided from the arc diffuses rapidly into the base material, it is difficult to effectively utilise the energy for localised melting. 5 While this characteristic has the advantage of reducing welding distortion, it also has a disadvantage in achieving deep penetration. In addition, an oxide layer (Al2O3) with a high melting point (∼2070 °C) is always present on the surface, which is much higher than the base metal's melting point of ∼660 °C. The oxide layer not only hinders the conduction of the arc current but also causes defects if it is caught in the weld pool. As a result, arc welding of aluminium alloys tends to cause defects such as insufficient penetration, incomplete fusion, slag inclusion and porosity.6,7
To perform arc welding on aluminium alloys stably, it is essential to remove the oxide layer on the base metal. In arc welding, the cleaning action of the cathode spot (CS) is used to remove this oxide layer. 8 CSs are formed on the surface of the base metal during the electrode positive (EP) period, when the electrode is positive, and the base metal is negative.
Metal inert gas (MIG) welding, which enables highly efficient welding, is usually performed in direct current EP (DCEP) mode. This allows numerous CSs to constantly form on the base metal, actively removing the oxide layer. On the other hand, alternative current-tungsten inert gas (AC-TIG) welding, which enables high-quality welding, alternates between EP and electrode negative (EN) periods. During the EP period, the oxide layer on the base metal is removed by the CSs. During the EN period, the arc is stably formed at the centre of the weld pool, which is thought to increase the concentration of heat input to the centre of the weld pool. Furthermore, during the EP period, the tungsten electrode acts as the anode, preventing cooling by thermionic emission from the electrode surface, resulting in increased electrode consumption. 9 This study focuses on AC-TIG.
When current flows from the arc to the cathode, an exchange of charged particles, such as electrons and ions, is necessary between the two. In the case of TIG with DECN mode, the tip temperature of the tungsten cathode rises close to its melting point, resulting in sufficient thermionic electron emission from a wide area near the tip, allowing the cathode to function as a stable thermionic cathode. 10 On the other hand, if the cathode material is a low-boiling-point material such as aluminium, the cathode material evaporates as the temperature rises, preventing the cathode from reaching a temperature high enough to emit thermionic electrons. At this time, numerous localised current-concentration regions, called CSs, with diameters of the order of 10 μs, form on the cathode surface to maintain the current. 11 These CSs prefer locations where electron emission is easy and tend to form preferentially on the oxide layer, which has a lower work function than metals. There are various theories about the removal mechanism of oxide layers by CSs, but it is believed that ion bombardment of the oxide layer due to the ion current from the arc to the cathode plays a major role. 12
Research into oxide layer removal by CSs has been actively conducted, mainly in the field of material surface treatment using vacuum arcs.13,14 For example, Takeda and Takeuchi 13 developed a simple model for the removal of oxide layers on stainless steel surfaces by CSs. This model assumes that the oxide layer is heated by intense localised heat input at the CS, and that it is eventually vaporised and removed. On the other hand, there have been very few studies on AC-TIG under atmospheric pressure.15–17 Sarrafi et al. 15 and Sarrafi and Kovacevic 16 successfully visualised the oxide layer removal process during AC-TIG using laser illumination. They showed that the EP ratio was the most dominant welding parameter in terms of oxide layer removal, while the current and welding speed had little effect.
The behaviour of CSs directly governs the oxide layer removal process and is therefore a very important factor that must be understood to realise advanced AC-TIG. However, the movement velocity of CSs is very fast, making observation difficult, and research reports on this subject are very limited.18–20
Phan et al. 18 conducted a detailed study of the behaviour of CSs during stationary AC-TIG of aluminium using argon gas, employing an ultra-high-speed camera for observations at 500,000 fps. The number of CSs and their movement velocity were quantitatively evaluated. The surface temperature field of the weld pool was also measured using a two-colour pyrometry. The results revealed that the CSs were distributed in a ring shape, avoiding a radius of ∼1 mm at the centre of the weld pool where the surface temperature was high. Immediately after the start of the EP period, almost all CSs were distributed on the weld pool. However, as time passed, they migrated outward, and part of CSs reached the oxide layer. At the end of the EP period, the number of CSs located on the weld pool decreased to 37.4%.
Further expanding on the above research, the behaviour of CSs using helium gas was also investigated, and the differences with the argon gas case were discussed. 19 The number of CSs in helium AC-TIG was reduced compared to argon. It is well known that the heat input from the arc increases significantly with helium AC-TIG. As a result, the surface temperature at the centre of the weld pool increased significantly, and the area where CSs were not seen expanded to a radius of ∼2 mm. Consequently, comparison of both cases showed that CSs did not exist in areas where the surface temperature exceeded 1300 K.
Next, the effect of the magnesium content of the base metal in argon AC-TIG was also examined. 20 It was found that the number of CSs increased as the magnesium content increased. It was also shown that the range of the area without CSs expanded. The high content of magnesium, which has a low boiling point and is easily vaporised, resulted in the CS distribution like that observed when the weld pool temperature increased.
Thus, it was shown that the behaviour of CSs was strongly dependent on the composition of the shielding gas and base metal. The above results suggest that the generation of metal vapour from the weld pool is closely related to the distribution of CSs. A particularly important point is that CSs are distributed over the weld pool and oxide layer to avoid the local high-temperature regions generated on the weld pool by the EN arc, and this determines the efficiency of oxide layer removal by the CSs and the heat input distribution to the weld pool.
In AC-TIG, EN and EP periods alternate, and the heat input to the base metal during each period is known to be strongly dependent on the fall voltage in the boundary layer between the base metal surface and the arc. This fall voltage has been measured to be ∼6.0 V on the anode side and 11.0 V on the cathode side, making the cathode side approximately two times larger than the anode side. 21 Because the location of the heat input related to this fall voltage depends on the current path, that of the cathode side is strongly influenced by the CS distribution.
The effect of EP ratio on penetration depth in AC-TIG was investigated by Miyasaka et al. 22 and Dutra et al., 23 who showed that as the EP ratio increased, the cleaning width and penetration depth increased. They also found that penetration depth increased linearly with input power. Cho et al. 24 also showed that electrode consumption increased with EP ratio.
Liu et al. 25 developed a welding power source capable of high-frequency AC-TIG. They varied the frequency up to 500 Hz and showed that increasing the frequency resulted in a constricted arc and increased penetration depth. Although the article did not discuss the relationship between CS behaviour and penetration depth, it is expected that increasing the frequency will affect the distribution of CSs. Siewert et al. 26 used a DCEP arc with a water-cooled electrode to achieve full penetration in a 10-mm-thick aluminium alloy.
In this way, several processes that utilise heat input to the base metal through the CS during the EP period have been investigated. However, there appear to be few research results on improving heat input to the base metal by precisely controlling the CS behaviour in conventional AC-TIG welding.
The Lorentz force generated by the application of an external magnetic field (EMF) significantly changes the current density field, temperature field and flow field in arc welding. 27 Research on arc welding control using various types of EMFs has been conducted.28–30
Bui et al. 28 applied an axial EMF to MCAW and investigated its effect on penetration depth. The application of EMF created a swirling flow in the arc, increasing the flow velocity toward the weld pool on the arc axis, which depressed the weld pool surface and increased penetration depth.
Yu et al. 29 applied a horizontal EMF perpendicular to the weld direction to plasma-metal active gas (MAG) welding and clarified its effect on metal transfer stability in MAG. Changing the excitation current of the EMF electromagnetic coil significantly changed the metal transfer mode and metal transfer frequency in MAG, demonstrating the possibility of stabilising metal transfer using EMF.
Shoichi et al. 30 successfully prevented burn-through of a fully penetrated weld pool by placing an electromagnetic coil below the base metal in TIG, generating an upward Lorentz force within the weld pool. This technique was also shown to be effective in overhead welding.
As such, many studies have explored the control of the arc, weld pool, and metal transfer through the Lorentz force generated by EMF. However, to the authors’ knowledge, no research has been found that aims to increase penetration depth through control of CS behaviour by applying EMF in AC-TIG under atmospheric pressure.
In this study, electromagnetic coils were placed below the base metal, and a horizontal EMF perpendicular to the weld direction was applied in AC-TIG of aluminium alloy. By optimising the heat input distribution onto the weld pool through control of CS behaviour using EMF, the penetration depth was increased under constant welding parameters such as the arc current, AC frequency, EP ratio and welding speed.
Experimental method
Figure 1 shows a schematic diagram of the experimental setup for arc appearance and cathode spot observation. A TIG welding power source (DA300P, OTC Daihen) established an AC arc between a tungsten electrode with a diameter of 3.2 mm and a base metal with dimensions of 150 mm × 100 mm × 8 mm. The base metal material was aluminium alloy A5052. The distance from the electrode tip to the base metal was 3.0 mm. The current waveform was measured with a clamp meter (3285, HIOKI) to send it to a data logger (NR-500/NR-HV04, Keyence).
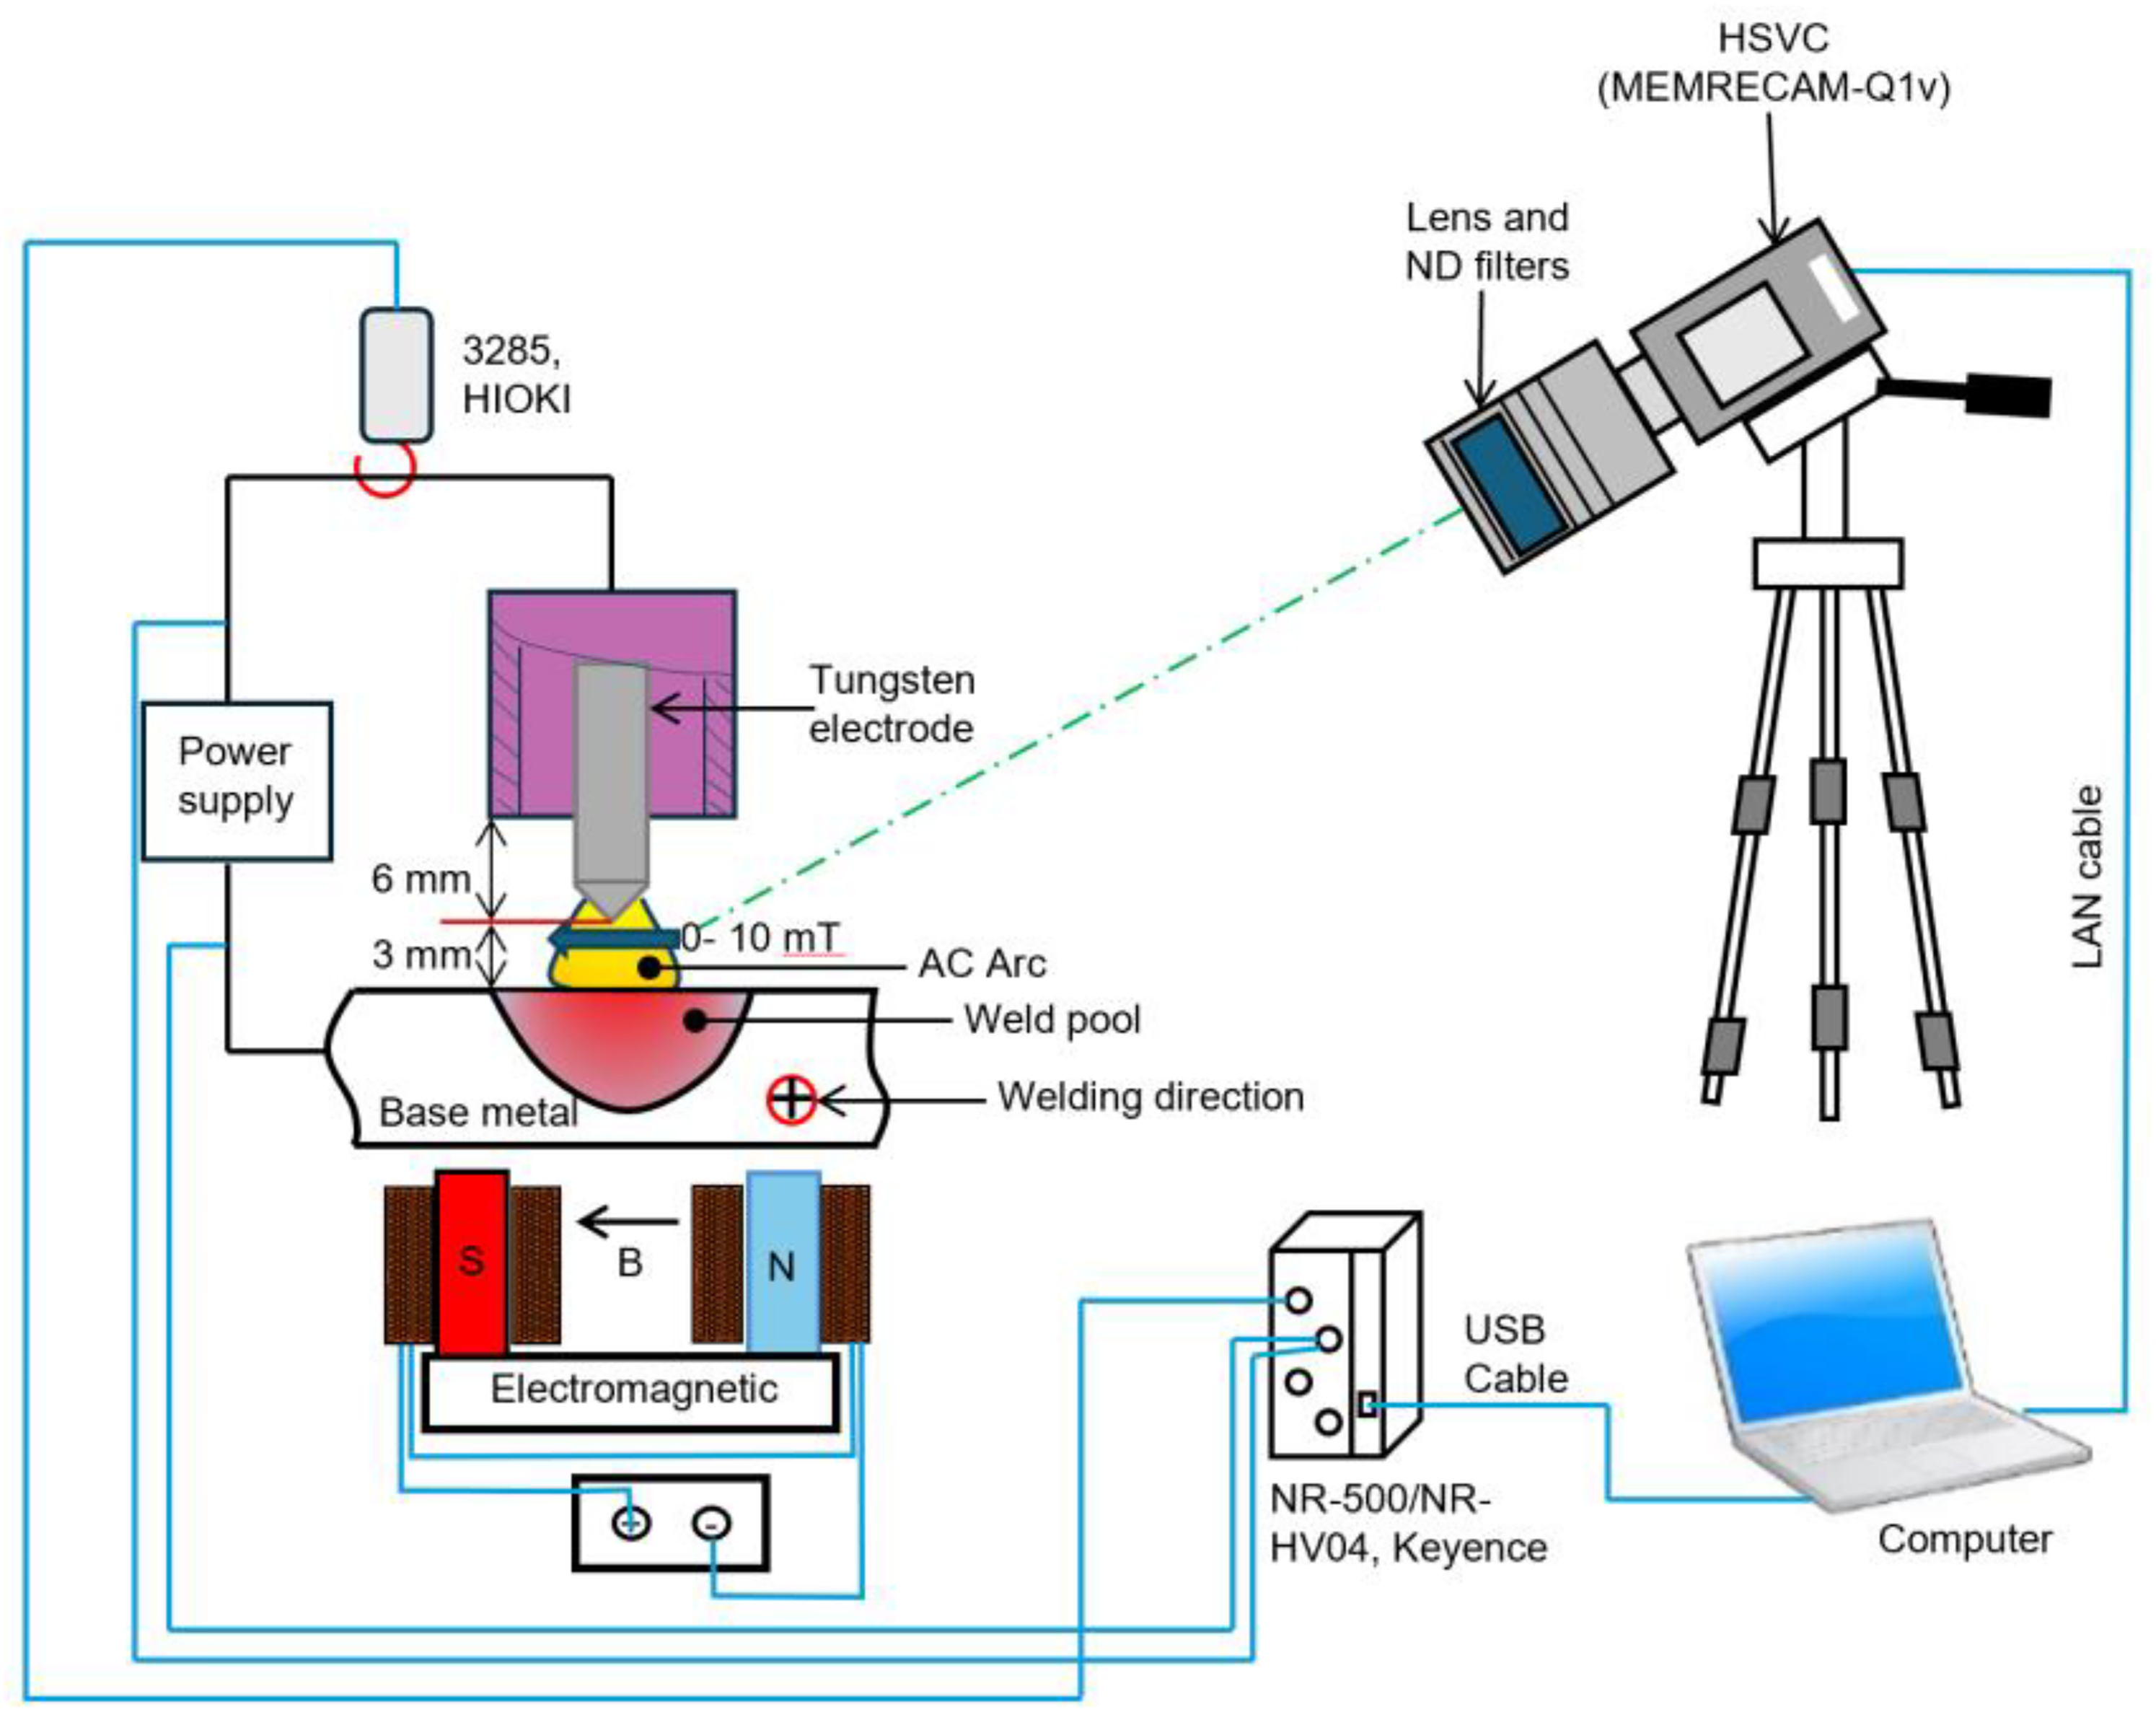
Schematic diagram of the experimental setup for arc appearance and cathode spot observation.
Two electromagnetic coils were installed on the bottom side of the base metal, connected to a power supply in series. The power supply for two coils could be adjusted to change the magnetic flux density (MFD) under the electrode tip up to 9.0 mT. The synthetic vector of the magnetic field was parallel to the base metal surface and perpendicular to the welding direction. The MFD was measured at the central position between the electrode tip and the base metal surface before welding.
The weld pool surface was observed from the upside-down direction, perpendicular to the welding direction, using a high-speed video camera (HSVC) (Memrecam-Q1v, Nac Image Technology) and a lens (Micro-NIKKOR, Nikon) featuring a 200 mm focal length and a 1:4 focus ratio. The video had a resolution of 640
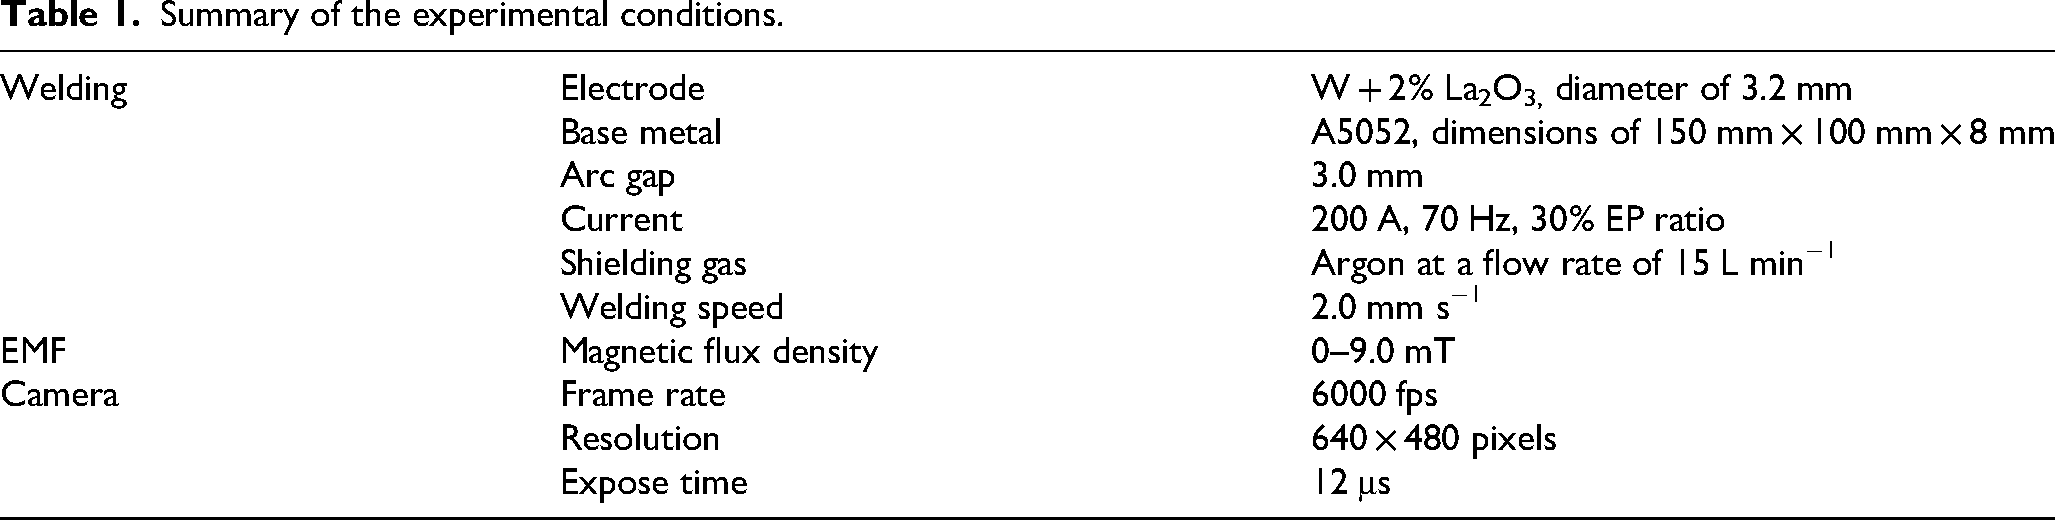
The welding current was 200 A, and its setting frequency and EP ratio were 70 Hz and 30%, respectively. The shielding gas of pure argon was introduced at a flow rate of 15 L min−1. Besides, the electrode was ground to a tip angle of 60
Summary of the experimental conditions.
Experimental results and discussion
Weld bead appearances and cross sections
Figure 2 shows the weld bead and solidified weld pool appearances with the MFDs of (a) 0 mT and (b) 5.5 mT. Generally, the difference of weld bead appearances between two cases could be seen in the oxide-cleaning zone and weld pool shape. The yellow dashed-dot line illustrated the weld pool's boundary, while the green dashed-dot line indicated the range of the CS distribution, including the oxide-cleaning zone. Without EMF, the weld pool had a likely round shape with a diameter of ∼10.05
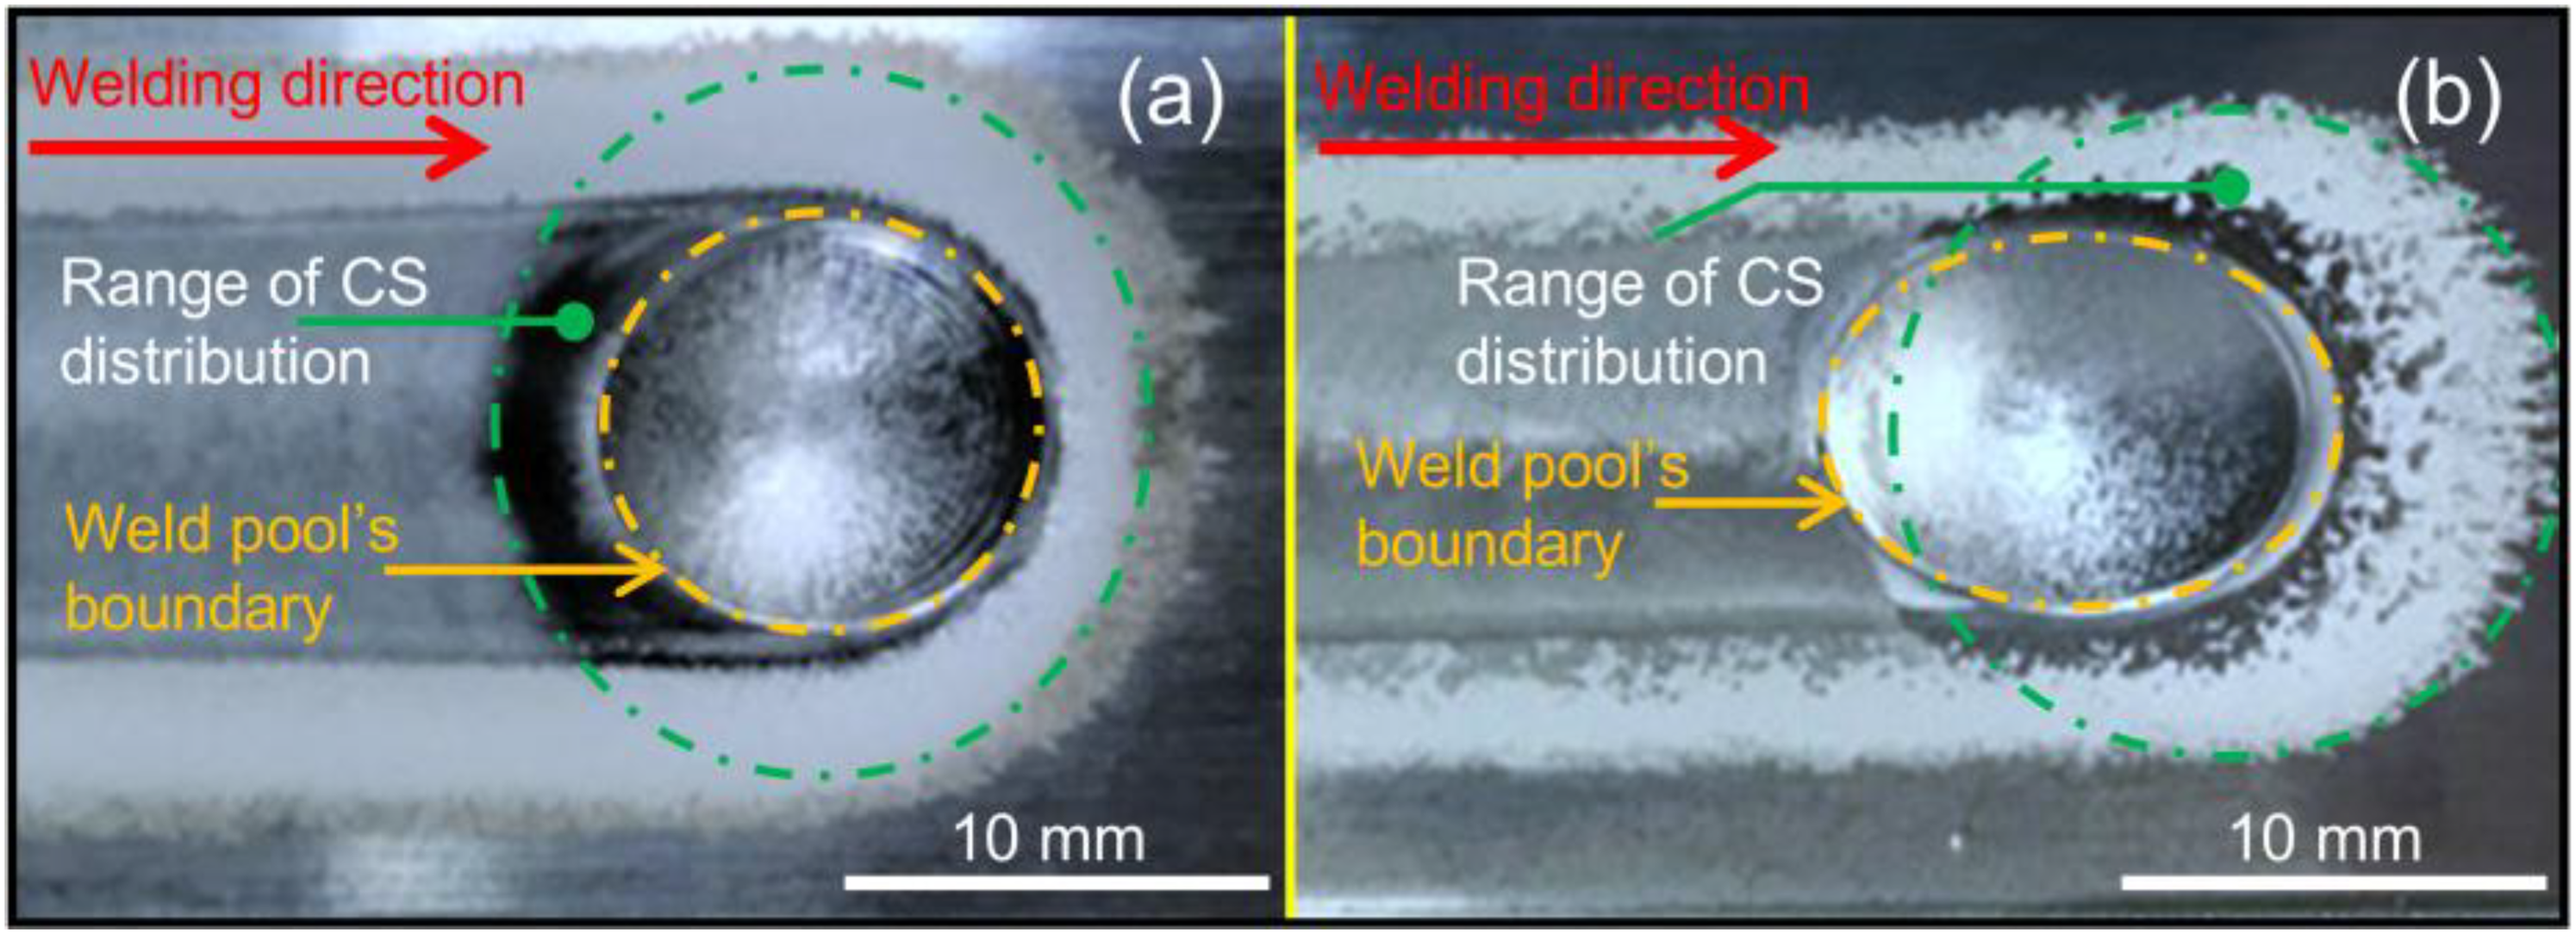
The weld bead and solidified weld pool appearances with the magnetic flux densities (MFDs) of (a) 0 mT and (b) 5.5 mT.
Figure 3 shows (a) cross sections of the weld bead and (b) penetration depths at a distance of 20 mm from the end of the weld as a function of MFD. The dimensions were calculated as an average value of three-time measurements using the ImageJ software for each MFD condition. These three measurements were obtained from three independent welds. As mentioned in the ‘Experimental method’ section, the cross-sectional positions were similar for all welds. Error bars represent the standard deviation. The weld bead width was considered almost unchanged with the increase in the MFD (around 9.30
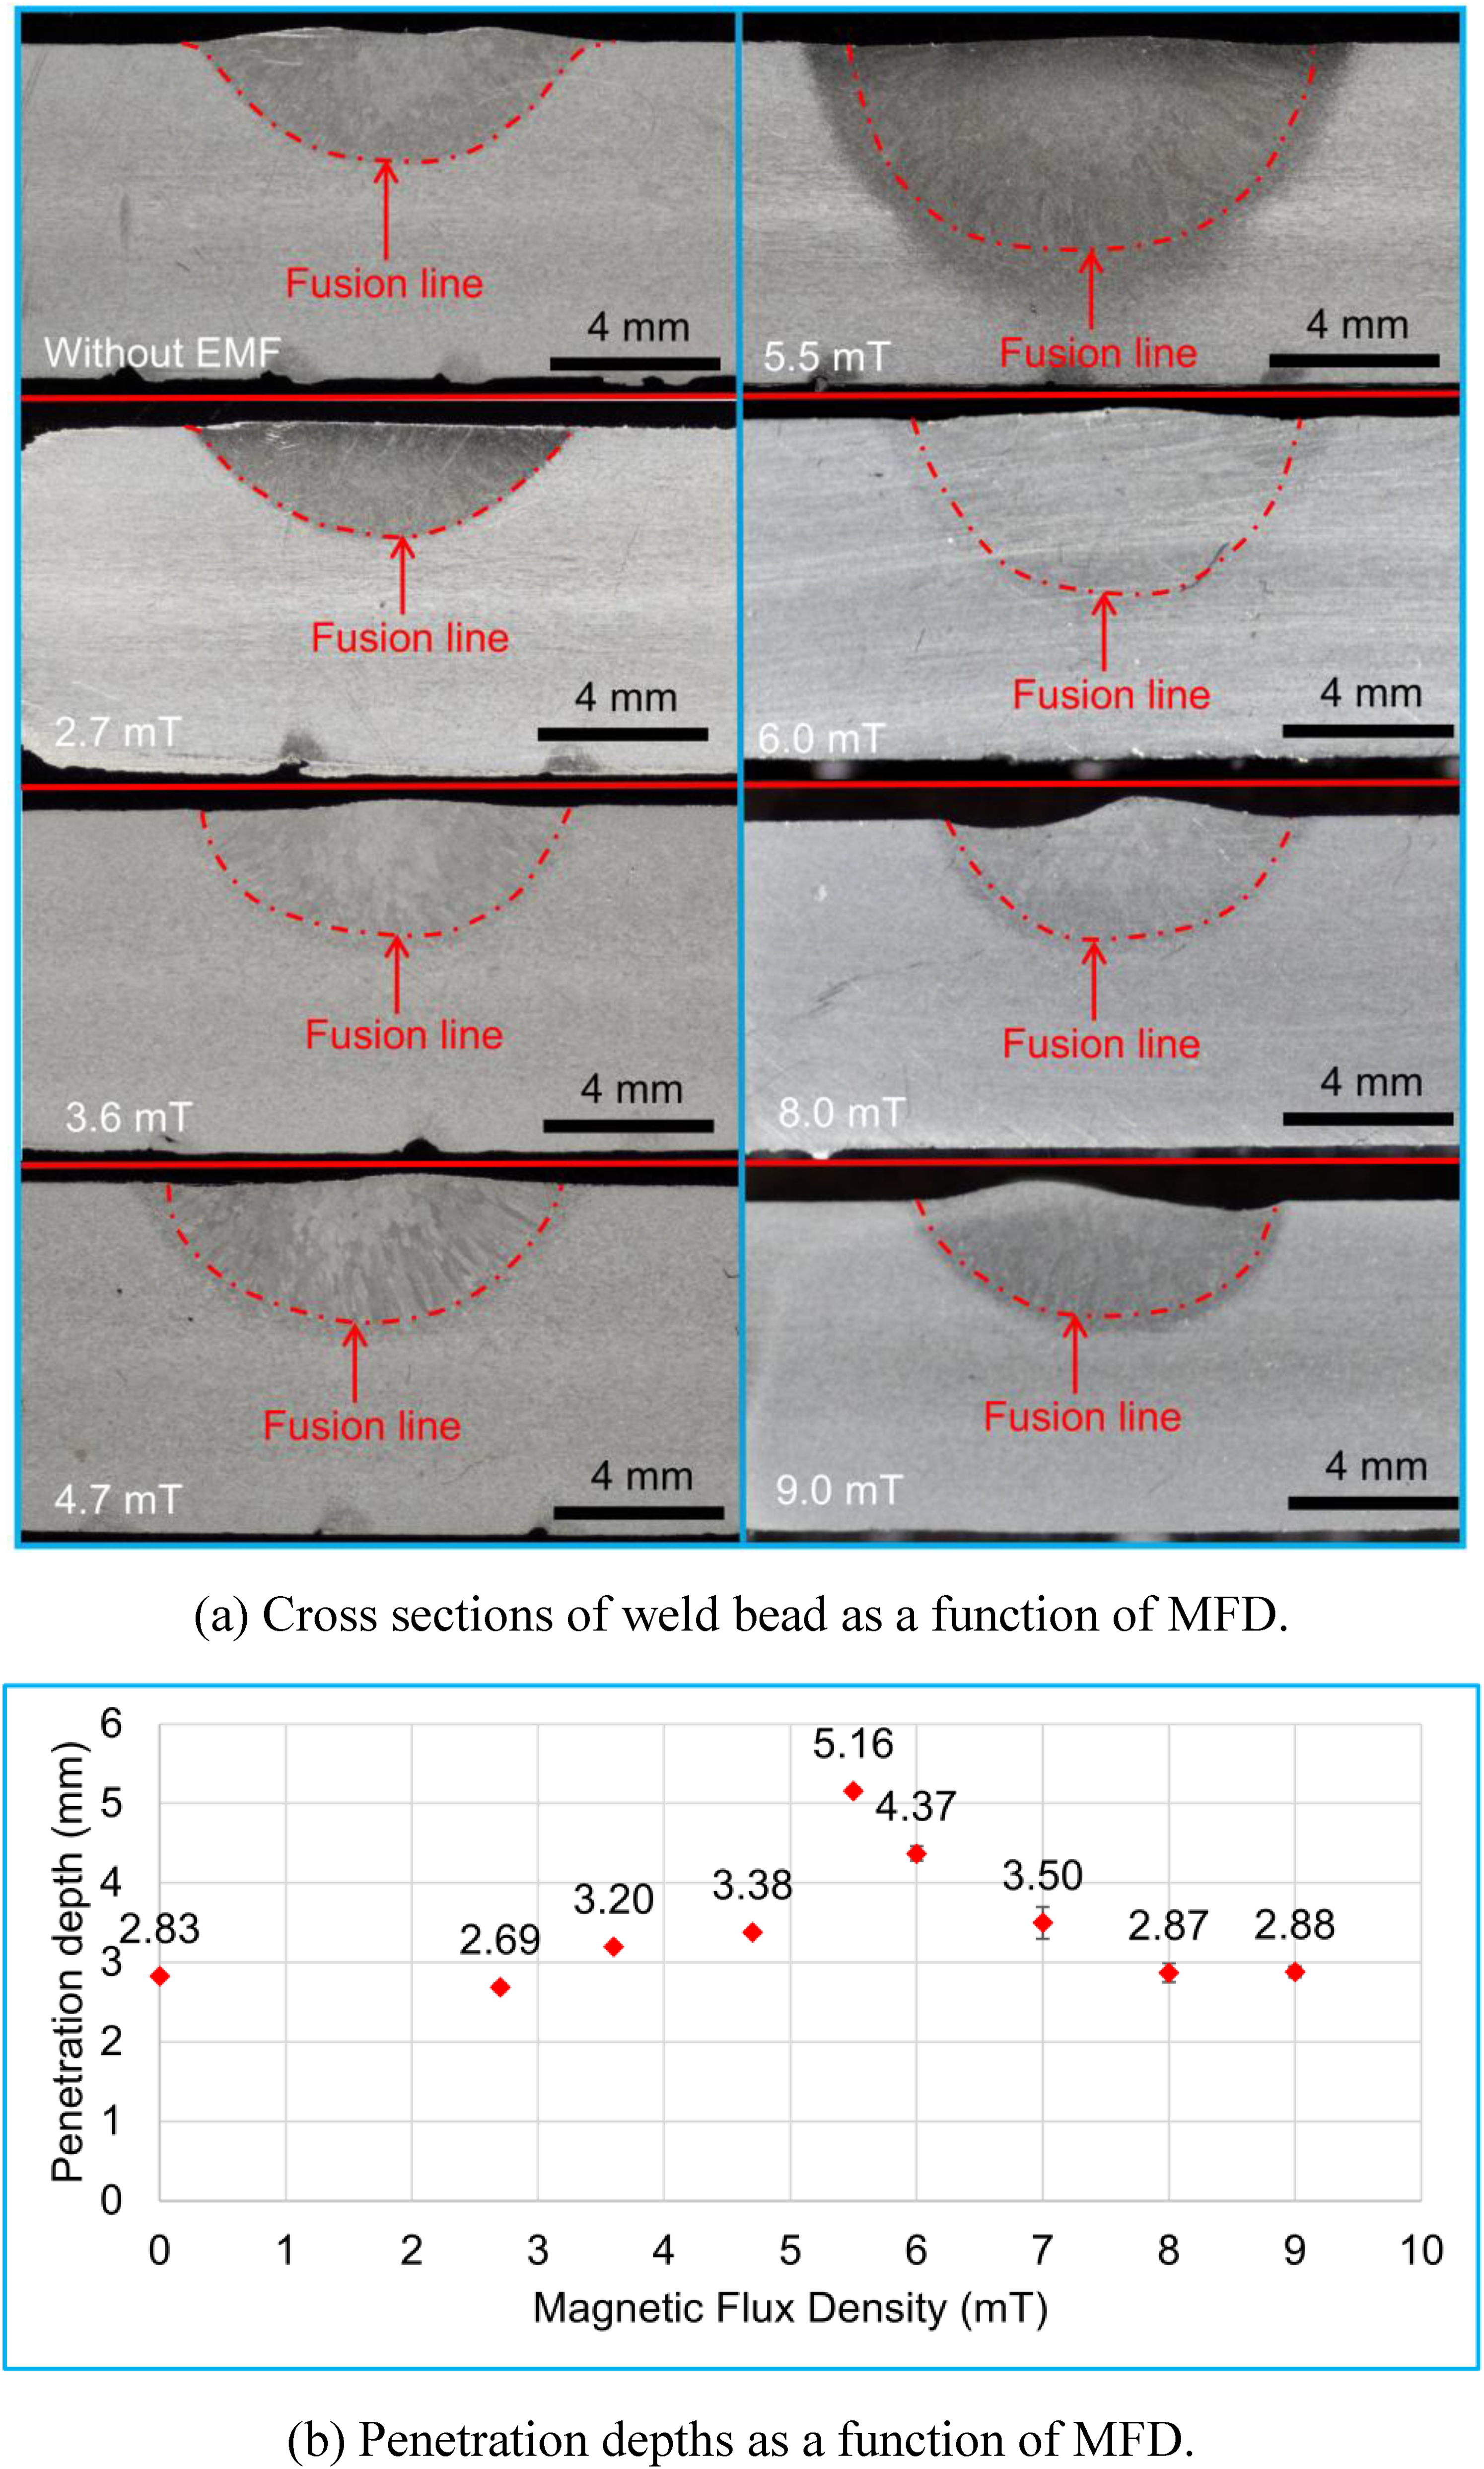
(a) Cross sections of the weld bead as a function of magnetic flux density (MFD) and (b) penetration depths at a distance of 20 mm from the end of the weld as a function of MFD.
Without the EMF, the penetration depth was 2.83
Arc and CS characteristics
Figure 4 shows the typical images of the arc appearance in EN polarity and at 2 ms after the polarity switching to EP with the MFDs of (a) 0 mT, (b) 5.5 mT and (c) 9.0 mT. During welding in the EP polarity, slight melting occurred at the electrode tip. This produced a rounded shape that remained stable throughout the welding. However, the tip of the tungsten electrode was sometimes deformed by an accidental disturbance and solidified partly as shown in Figure 4(a). Additionally, the electrode wear would not affect arc behaviour or CS distribution significantly. In EP polarity, current was mainly carried by the CS. 19 The welding pool surface condition and its temperature had stronger effects on the CS distribution than the electrode state. In EN polarity, electrode wear influenced arc behaviour more or less. However, its overall effect was thought to be limited.
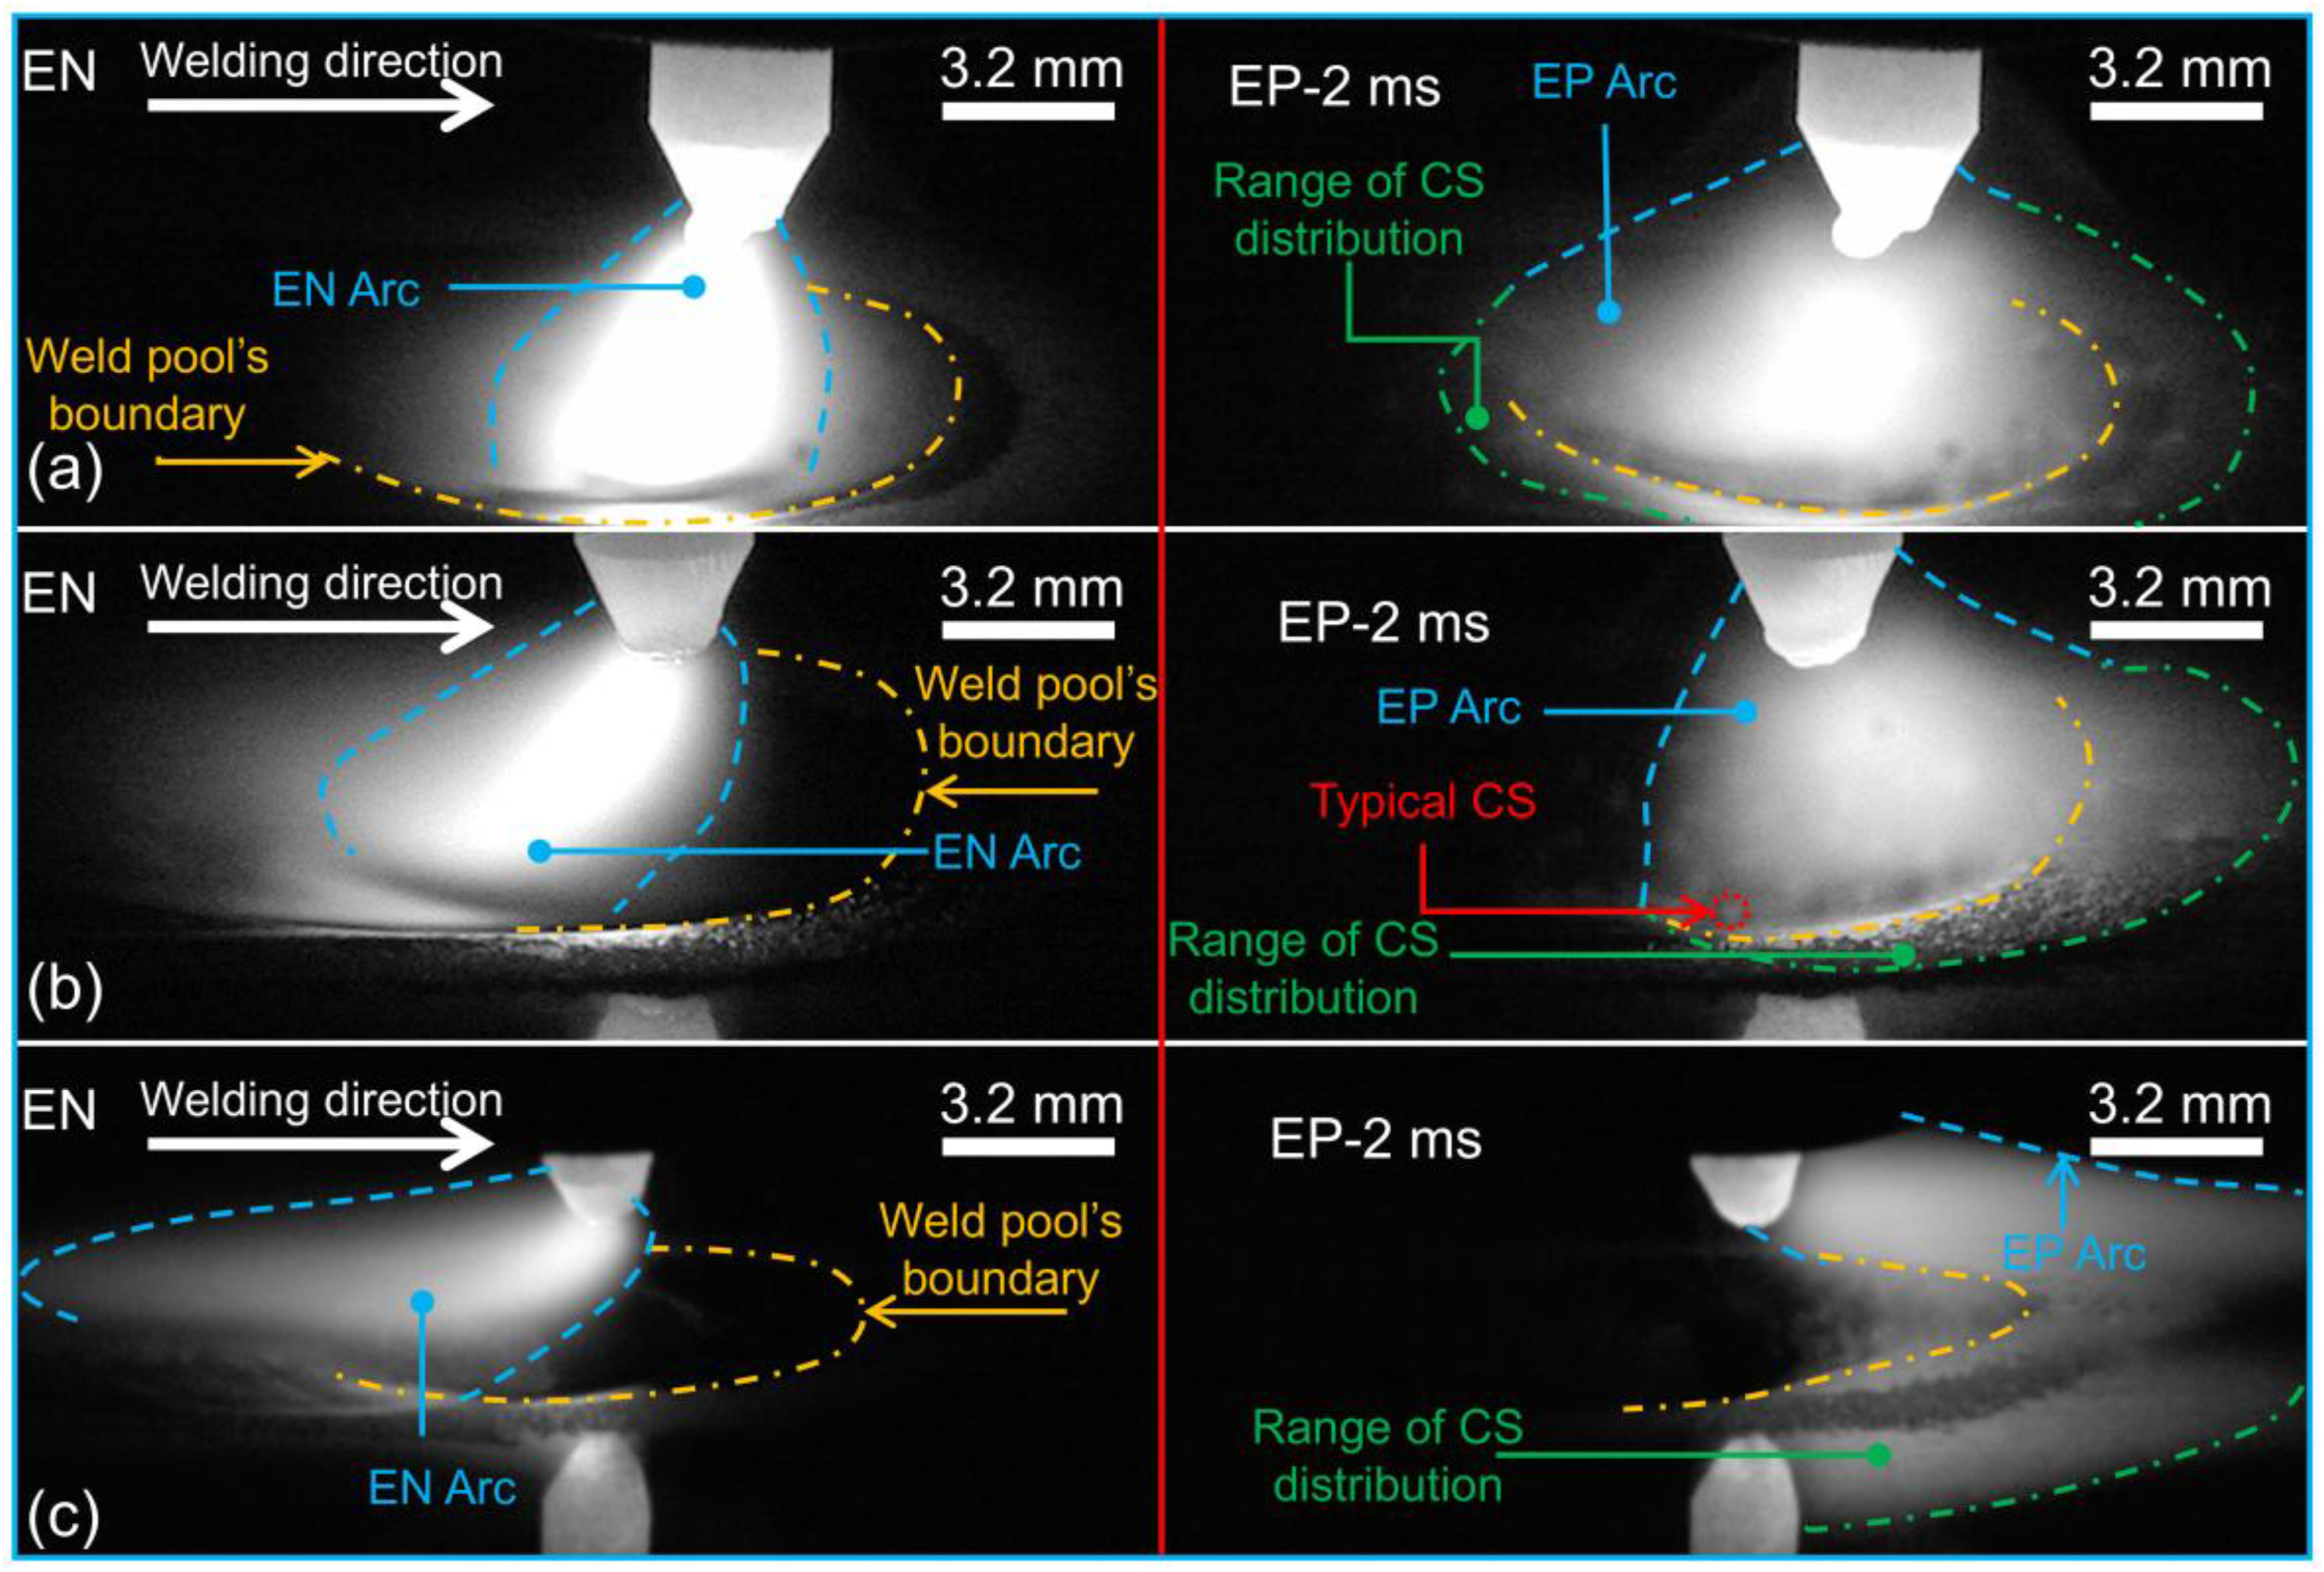
Typical images of the arc appearance in EN polarity and at 2 ms after the polarity switching to EP with the MFDs of (a) 0 mT, (b) 5.5 mT and (c) 9.0 mT.
When EMF was applied, the EN and EP arcs were deflected backward and forward, respectively. The magnitude of deflection increased with increasing MFD. In EP polarity, the arc column was radially expanded compared to that in the EN polarity, and a large number of CSs were formed at the bottom of the arc column. As presented in the figure, CSs were widely distributed on the weld pool and the oxide surrounding it, but the ratio of the number of CSs on the weld pool to those on the oxide varied greatly depending on the magnitude of the MFD. During EP duration, there was occasional incipient melting at the tip of the tungsten electrode due to lack of cooling by electron emission, as shown in Figure 4, however the voltage signal indicates this did not affect the welding operation. For more details, the welding current and voltage waveforms during the AC-TIG corresponding to the images with the MFDs of 0 and 5.5 mT are shown in Figure 4.
Figure 5 shows the current and voltage waveforms with the MFDs of (a) 0 mT and (b) 5.5 mT. The output current was 200 A in both cases. The arc voltages had a slight difference between the two cases. Without EMF, the voltage in EP polarity increased from about 16.0 to 17.5 V and the average value was around 16.9
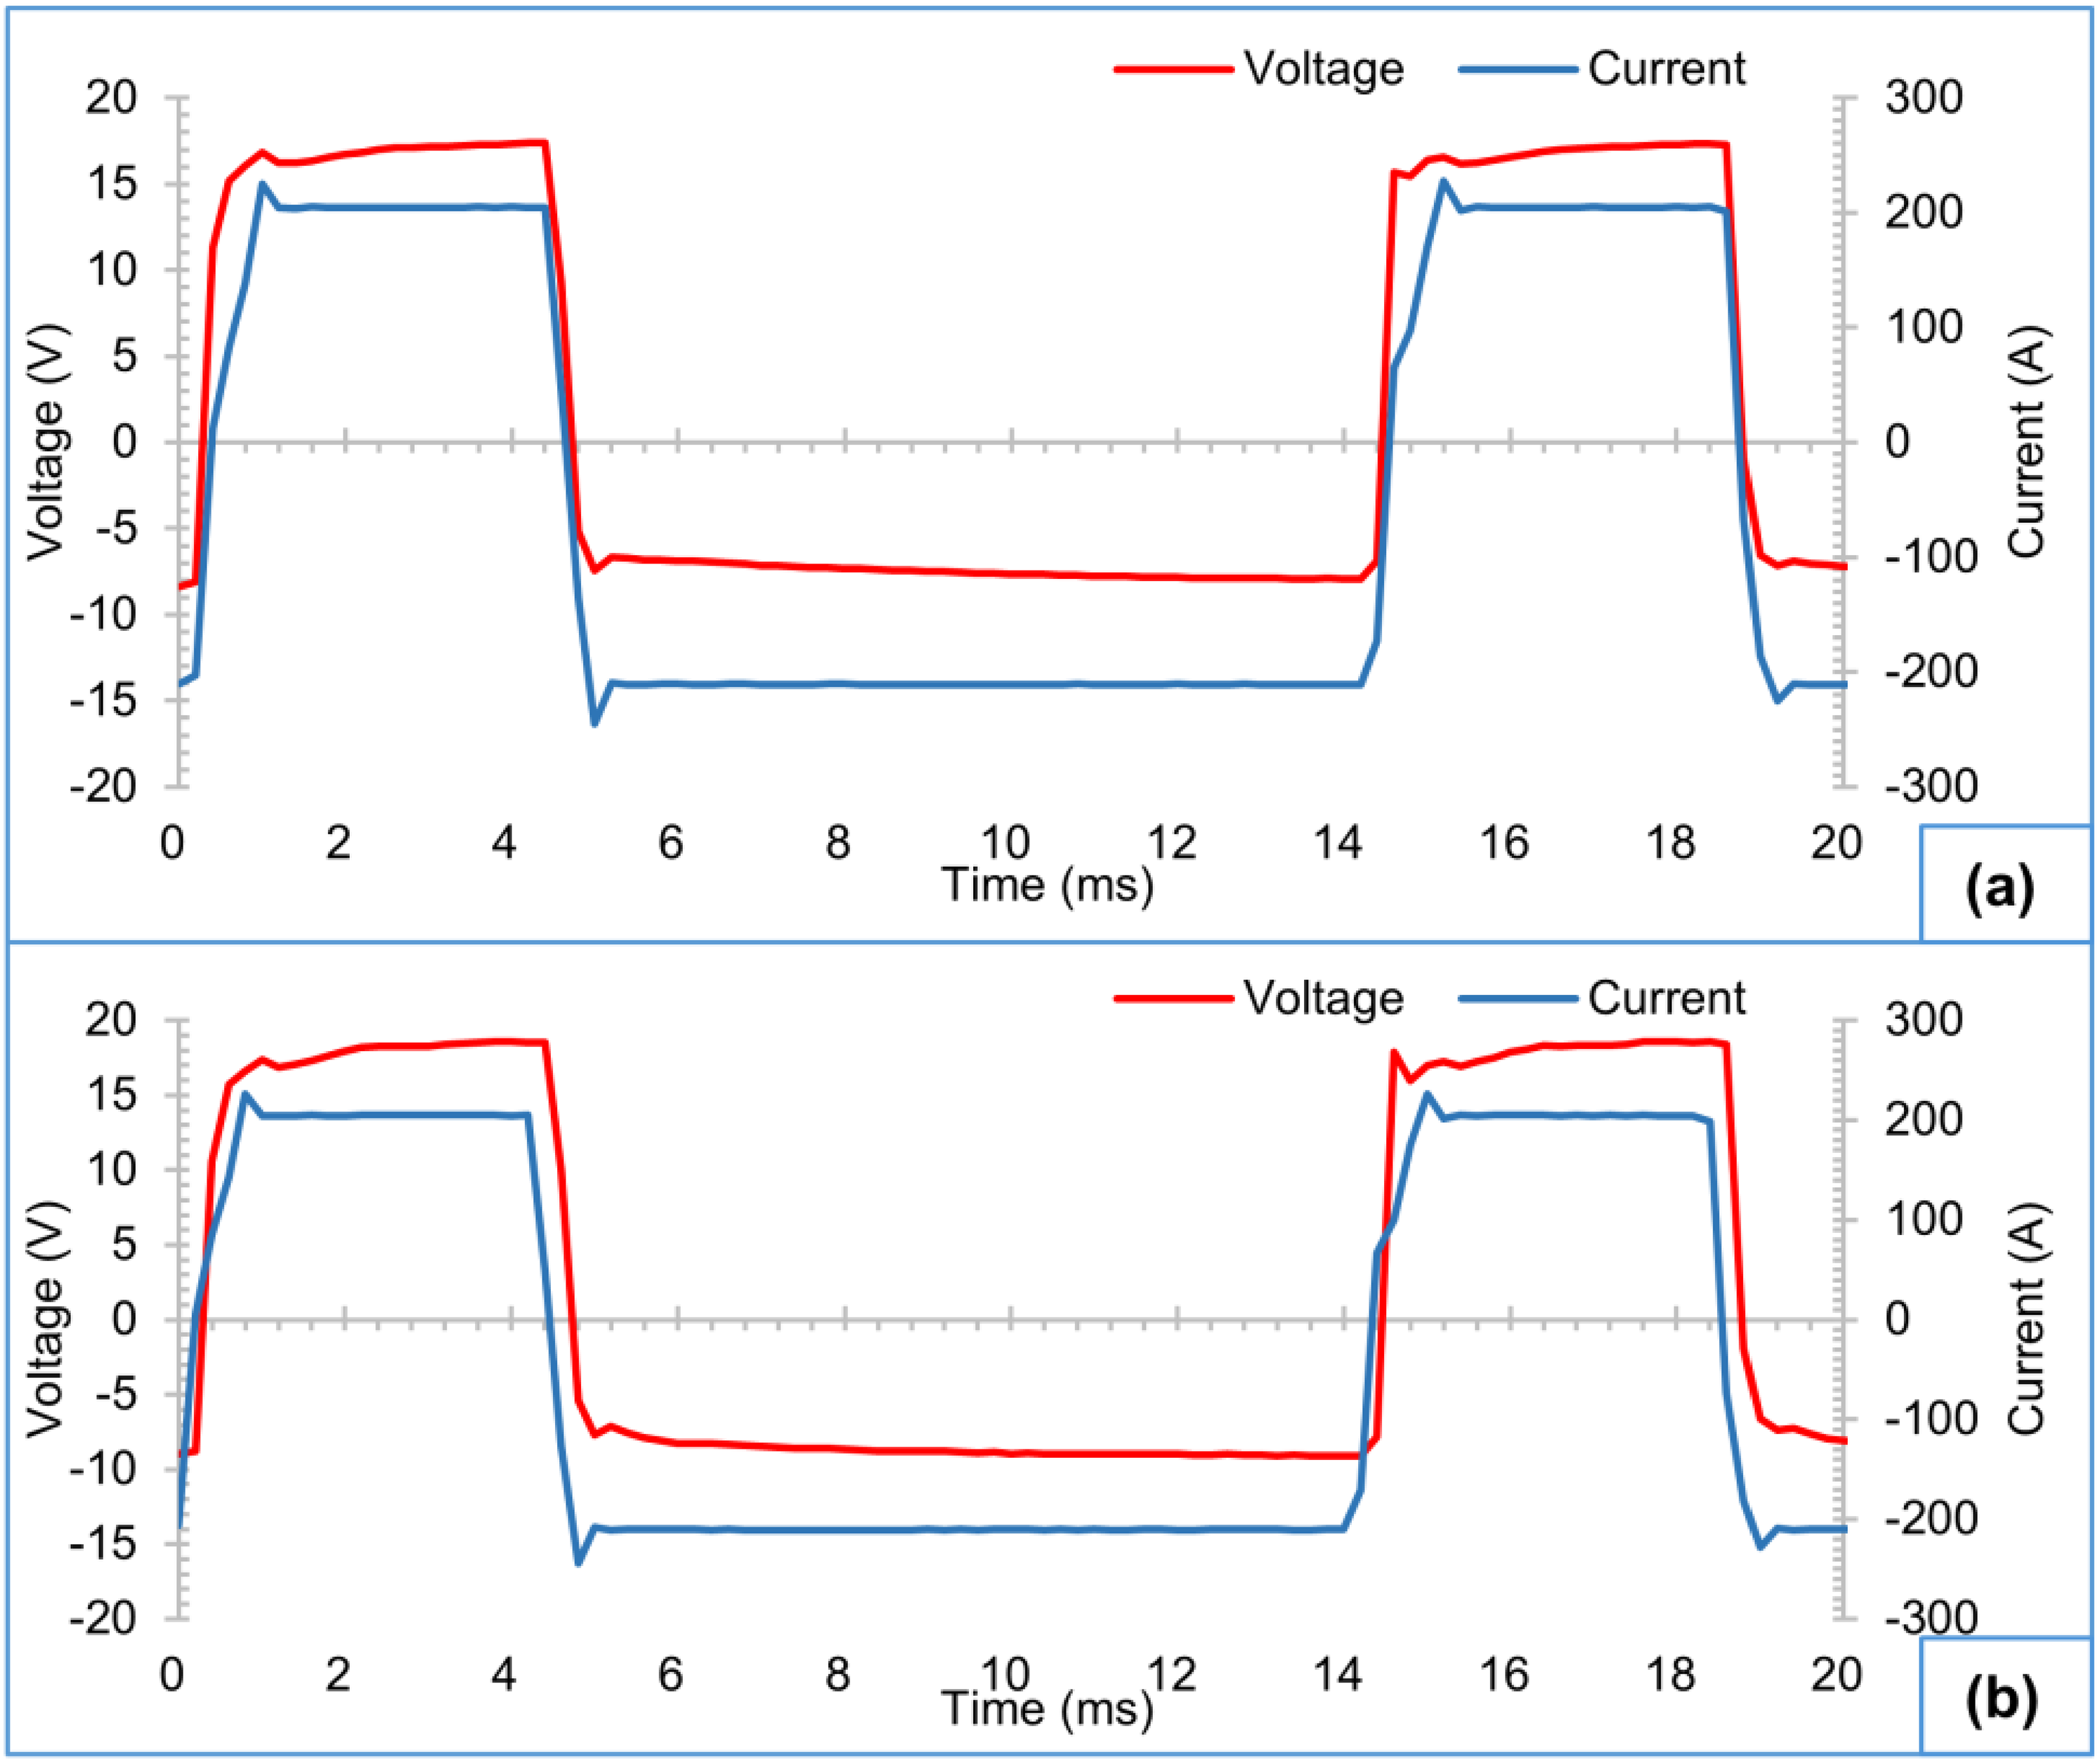
Current and voltage waveforms with the magnetic flux densities (MFDs) of (a) 0 mT and (b) 5.5 mT.
For a better understanding, a more quantitative estimation of the effective heat input to the weld pool is estimated. Effective heat input into the aluminium base metal mainly comes from two sources: (1) fall voltage multiplied by the current. (2) A second source of heat input is the conduction and radiation from the arc, which is a fraction of the power dissipated in the arc: Power of arc column = arc column potential 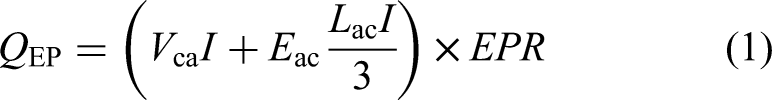
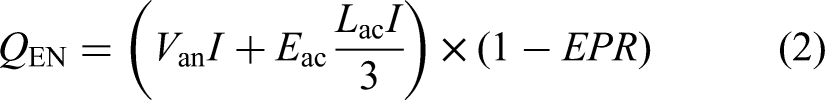
After solving these two equations, the heat input into the base metal during the EP and EN phases are 708 and 952 W, respectively. When applying EMF, the cathode and anode voltages can be assumed to remain more or less constant, but the arc column voltage increases with the arc length. The power dissipated in the arc column increases, and about 1/3 of this increase goes to the base metal. The increase in arc voltage with the increase in the MFD from 0 to 5.5 mT was about 1.0 V. Accordingly, the increase in heat input is estimated to be around 60–70 W, which is around 4% of the total heat input (1660 W). Therefore, the change in total heat input to the base metal would be negligible.
Figure 6 shows the distribution for the relatively minimum and maximum positions of the weld pool, EN arc area, and oxide-cleaning zone by the CS group along the welding centreline under the range of MFD used. The positions were roughly determined from the movies. The welding direction along the welding centreline was defined as the X-direction, where a positive value indicated a frontside position. The X-position of 0 mm corresponded to the position just under the electrode tip.
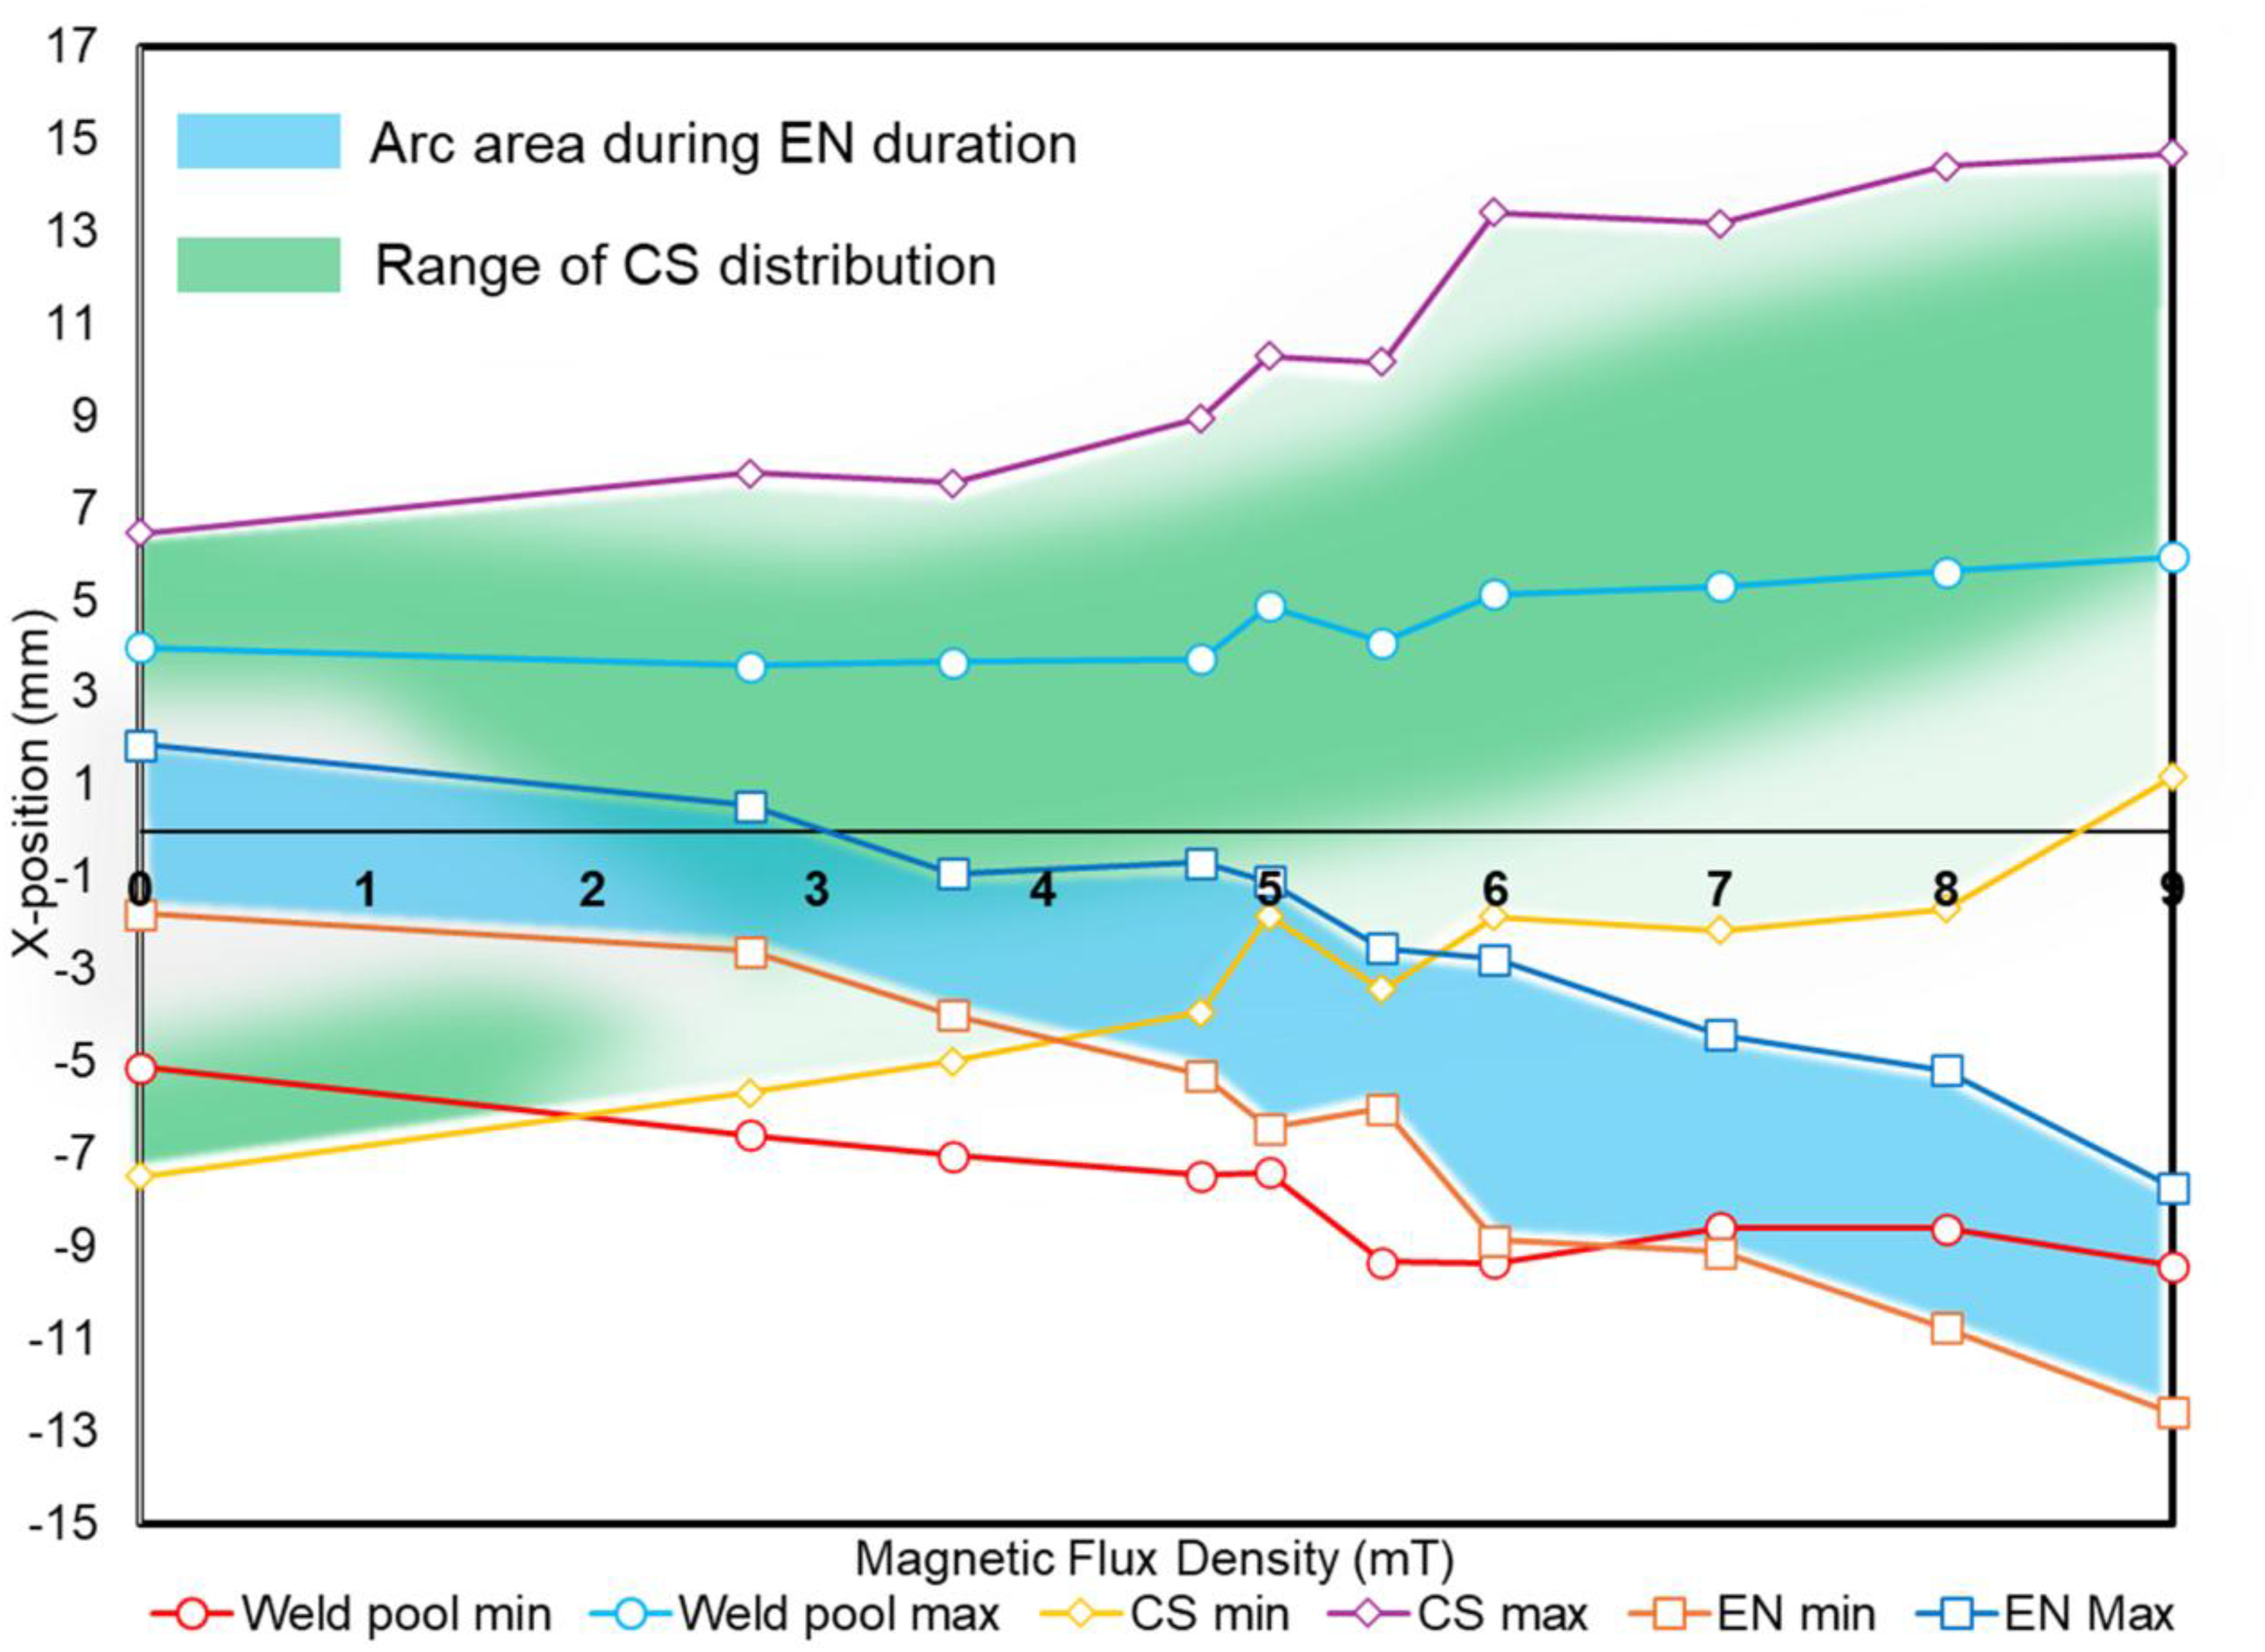
Distribution for the relatively minimum and maximum positions of the weld pool, EN arc area and oxide-cleaning zone by the CS group along the welding centreline under the range of MFD used.
Generally, along the welding direction, the weld pool dimension in the X-direction (the yellow area shown in Figure 6) increased from ∼9.0 to ∼15.4 mm with increasing the MFD. Owing to the Lorentz force produced by the EMF, the EN arc was deflected backward along the welding direction, whereas the CS zone during the EP period – the green area shown in Figure 6 was deflected forward. The CS region ahead of the weld pool widened from ∼ 2 to 8 mm as the MFD increased from 0 to 9.0 mT. The region on the weld pool surface where the EN arc gave the heat input (defined as the EN arc region) was found to be shifted behind the electrode tip, presented as the blue area in the figure.
Figure 7 presents the schematic diagram of the CS distribution in EP polarity and the arc appearance in AC-TIG with the MFDs of (a) 0 mT, (b) 5.5 mT and (c) 9.0 mT. Without EMF in Figure 7(a), the EN arc region was located almost around the centre of the weld pool. As presented in the previous study by Phan et al., 18 the CSs are considered to distribute on the weld pool surface in a non-Gaussian shape, but a ring shape in EP polarity, avoiding the EN arc region with high temperature. Under similar welding conditions without EMF by Phan et al., 18 the ratio of the number of CSs located in the weld pool to the total number of CSs at 2 ms after starting EP polarity was 57.4%. Compared to the EN polarity, during the EP polarity, a significant amount of energy was applied to the weld pool at the location where the CS existed due to the high cathode fall voltage (11.0 V 21 ). Therefore, in these conditions, even though the heat input by the EN arc was fully applied to the weld pool, only half of that provided by the CSs could be used for heating the weld pool.
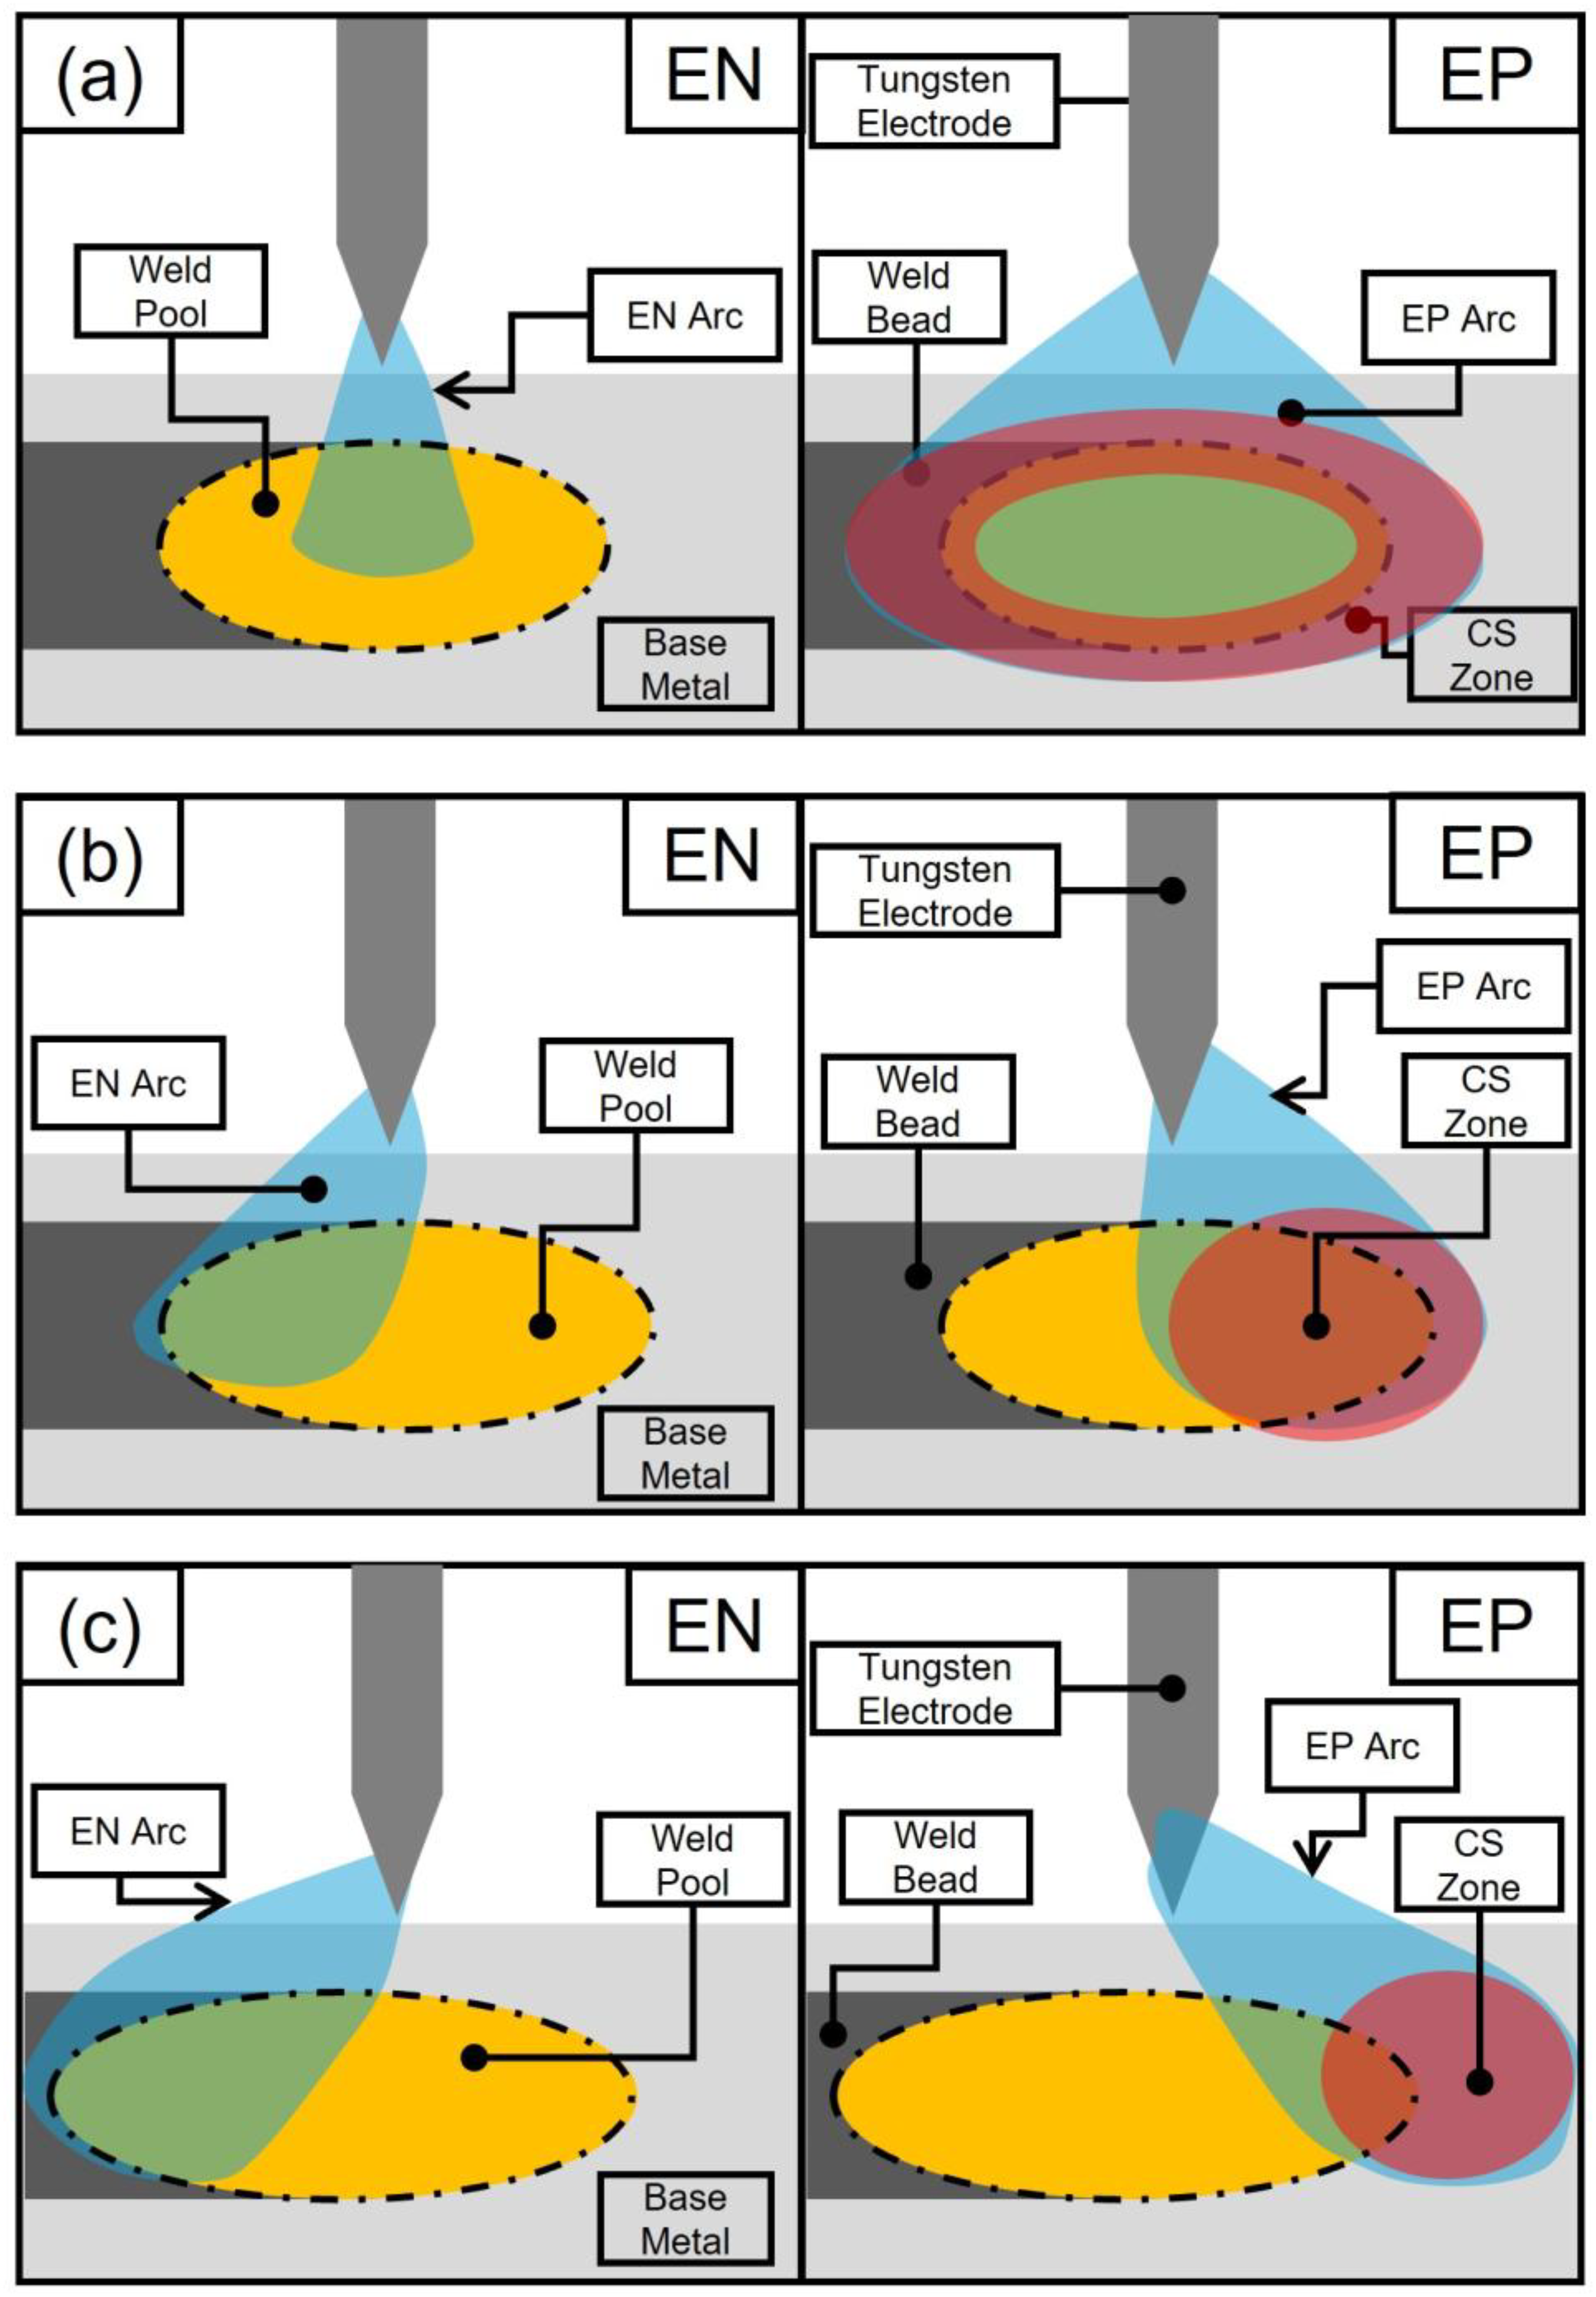
Schematics of the CS distribution in EP polarity and the arc appearance in AC-TIG with the MFDs of (a) 0 mT, (b) 5.5 mT and (c) 9.0 mT.
At the MFD of 5.5 mT as depicted in Figure 7(b), the EN arc region with the high-temperature area was thought to be located at the back half within the weld pool. Meanwhile, as the EN arc region moved backward, a sufficient area with lower temperatures was produced in the front half of the weld pool, allowing many CSs during EP polarity to exist within the weld pool in a tighter distribution with increased power density at the centre of the distribution. As a result, both the heat inputs of the EN arc and those of CSs were given to the weld pool effectively. As a result, the increased heat input to the weld pool produced a deeper penetration compared with that observed at 0 mT.
When the MFD increased further to 9.0 mT (Figure 7(c)), the EN arc and CSs were deflected outside the weld pool. Therefore, the heat input to the weld pool decreased significantly. This mechanism may therefore explain the gradual decrease in penetration depth as the MDF increased beyond 5.5 mT.
Additionally, it is thought that penetration increased mainly by the spatial redistribution of CSs. The EN arc column is known to expand a little with the application of EMF, 31 leading to shallower and wider penetration. Therefore, it is thought that the former effect is important for achieving deep penetration.
In summary, the MFD from 0 to <5 mT had a negligible effect on weld penetration due to insufficient heat into the weld pool centre. In contrast, within the range of ∼5.0–6.0 mT, the penetration of the weld increased significantly without disturbing the arc, with an optimal condition near 5.5 mT. However, as the MFD exceeded 6.0 mT, the effectiveness of CS distribution deteriorated, leading to unstable arc behaviour and welding effects.
These results define a practical operating window of ∼5.0–6.0 mT for enhancing weld penetration without compromising arc stability. This range is considered suitable for AC-TIG welding, as it provides practical and easily adjustable MFDs for welders.
In this study, the coils were positioned under the base metal. This configuration severely limits the degree of freedom when actually performing welding. In future work, the coils will be installed on both sides of the welding torch. 32 This change is expected to allow the EMF to exert its maximum effect regardless of the shape or size of the base metal.
Conclusions
In this study, electromagnetic coils were placed below the base metal, and a horizontal EMF perpendicular to the weld direction was applied in AC-TIG welding of aluminium alloy A5052. By optimising the heat input distribution onto the weld pool through control of CS behaviour using EMF, the penetration depth increased under constant welding parameters such as the arc current, AC frequency, EP ratio and welding speed. The conclusions can be summarised as follows:
When MFD was increased from 0 to 9 mT, the EN arc and CS distribution were gradually deflected backward and forward, respectively. CS distribution was changed from a ring shape at 0 mT to a tighter distribution with increased power density at the centre of the distribution with increasing MFD. At MFD of 5.5 mT, the heat input by both the EN arc and CSs was given to the weld pool most effectively. The penetration depth increased by almost double when applying the optimum strength of MFD of 5.5 mT.
Footnotes
Ethical approval and informed consent statements
Not applicable.
Author contributions
Le Huy Phan: investigation, visualisation and writing–original draft preparation. Shinichi Tashiro: conceptualisation and writing–review and editing. Dang Khoi Le: visualisation and writing–review and editing. Van Hanh Bui: supervision and writing–review and editing. Kenta Yamanaka: supervision and writing–review and editing. Patricio Fernando Mendez: supervision and writing–review and editing. Manabu Tanaka: supervision and writing–review and editing. All authors have read and agreed to submit the current version of the manuscript.
Funding
The authors disclosed receipt of the following financial support for the research, authorship, and/or publication of this article: This work was supported by JSPS KAKENHI (Grant Number JP25K08344), the Project on Design & Engineering by Joint Inverse Innovation for Materials Architecture (DEJI2MA) from the Ministry of Education, Culture, Sports, Science and Technology (MEXT), an OU Master Plan Implementation Project promoted under Osaka University.
Declaration of conflicting interests
The authors declared no potential conflicts of interest with respect to the research, authorship, and/or publication of this article.
Data availability statement
Data can be available based on the requirements to verify this work.