
Abstract
In situ diagnostics for defect detection and compositional assessment remain critical for addressing persistent challenges in Additive Manufacturing (AM). Among the available diagnostic techniques, Optical Emission Spectroscopy (OES) stands out for its strong capability to provide in situ and non-intrusive monitoring of the AM process. As part of our ongoing efforts to develop a low-cost, real-time AM monitoring tool, this study represents an initial investigation focused on the concentration of key species in the Tungsten Inert Gas (TIG) wire-arc plasma generated during welding of an aluminum (Al-6061-T6) sheet using OES. Emission spectra from the arc plasma were analysed to identify and quantify key spectral lines associated with aluminum and potential alloying elements. The plasma temperature and electron number density were estimated to support quantitative analysis through Boltzmann and Saha methods to enable accurate concentration determination by calibration-free approach. The results demonstrated the potential of OES as an effective tool for monitoring and optimizing the aluminum welding operations through in situ non-intrusive plasma composition analysis.
Keywords
Introduction
Additive manufacturing (AM) has emerged as a transformative technology across diverse industrial sectors, including aerospace, biomedical, and automotive engineering.1–4 Among Contemporary AM process, wire arc AM (WAAM)-which employs an electric arc as the heat source (tungsten inert gas (TIG) or MIG) in conjunction with a metallic wire feedstock has gained significant attention.1,4 However, defects, including composition loss, porosity, cracks, and low repeatability often render components unsuitable for many practical applications. 5 Therefore, monitoring and controlling the welding process is essential to ensure build quality. Both traditional methods, such as measuring welding current, arc voltage, gas flow rate, welding speed and wire speed rate 6 ; and non-traditional approaches, including optical,1,7–9 acoustic,1,10 X-ray,8,11,12 Ultrasonic13,14 and thermal sensing, 15 have been implemented to monitor and control the welding processes, ensuring consistent build quality.6,16,17 However, most of these techniques are often limited by inherent constraints, higher costs, resource and time-intensive.10–12,15 Consequently, cost-effective monitoring methods using arc plasma optical emissions have gained attention. In WAAM, arc plasm is the highly energetic, ionized region between the cathode and workpiece, which governs the energy transfer and weld pool formation. While the cathode is heated via Joule heating and collisions with ions and atoms, electron emission provides cooling, and near-surface plasma reactions, including ionization and recombination, influence particle dynamics. The emitted arc light contains critical information on plasma temperature, composition,1,7,8,14,18–28 which in turn are strongly correlated with welding parameters and weld quality. Optical emission spectroscopy (OES) was relatively a simple but powerful technique that has been widely used for the diagnosis of arc plasma to measure plasma temperature and electron number density,18,20,25,26,29,30 non-intrusive monitoring of welding process,19,24,31 anode metal vapors,22,32 and the shielding gases.21,25,27 More recently, OES integrated with artificial intelligence enhanced defect detection and closed-loop process control during in situ monitoring of AM processes.1,14,33
Aluminum, though one of the most economical metals for its corrosion resistance, high strength-to-weight ratio, and alloying flexibility, remains challenging to process by AM. Alloys like 2xxx, 5xxx, and 6xxx, common in automotive applications, are prone to hot cracking, porosity, and compositional variations during fabrication.5,11,34–36 These challenges are further exacerbated by aluminum's high reflectivity and thermal conductivity, strong tendency for porosity formation, and the rapid solidification rates inherent to AM processes.5,11,31,35,36 Additionally, the weld metal composition can be significantly altered due to the selective vaporization of volatile alloying elements, particularly magnesium, thereby adversely affecting mechanical properties, corrosion resistance, and hot crack susceptibility.31,37,38 Cieslak et al, 37 reported that magnesium vaporization during laser welding leads to a measurable decrease in weld metal hardness compared to the base material, with alloys such as 5456 and 5086 exhibiting pronounced softening due to reduced magnesium content in the weld pool. Furthermore, compositional and microstructural heterogeneities across the weldment can degrade corrosion resistance. Zhang et al 31 proposed the correlation between the spectral parameters and structural parameters such as forming width, composition, grain size, and porosity defects. Also, Aluminum alloy susceptibility to hot cracking is strongly composition-dependent.11,34–38 Therefore, making real-time compositional assessment, alongside plasma temperature and properties, essential for effective in situ welding monitoring and control.1,14,34,37,39 However, continuous monitoring of metal composition during welding typically requires multiple standard reference materials to establish and maintain calibration curves, which can be time-consuming and impractical in dynamic manufacturing environments. 39 To address this limitation, Calibration-free OES (CF-OES) emerged as a promising alternative by using plasma parameters along with spectroscopic constants to determine species concentrations without external standards. This reduces experimental complexity and cost while enabling rapid, real-time compositional analysis, ideal for real-time monitoring.
As part of our ongoing efforts to develop a low-cost, real-time WAAM compositional monitoring tool based on CF-OES, this study presents an initial investigation focused on the OES analysis of TIG arc plasma generated from aluminum (Al 6061-T6) sheets, aiming to characterize key plasma parameters, including plasma temperature, electron number density, and species concentration to assess their relevance for quality control monitoring in WAAM. By analysing the characteristic emission lines from aluminum plasma, as well as shielding gas (argon) constituents, species concentration values were obtained using CF-OES under varying arc current conditions.
Experimental setup
The experimental setup was designed to perform in situ OES of TIG wire-arc plasma generated during the welding of commercially available aluminum sheet (Al 6061-T6, M/s McMaster-Carr) measuring 6″ × 12″ with a thickness of 1.0″ as shown in Figure 1. A Miller Dynasty 350 Dx constant-current TIG welding power source was used with a non-consumable tungsten electrode and pure argon shielding gas at a flow rate of 15 L/min for the arc plasma generation as shown in Figure 1(a).

Experimental setup for OES collection from TIG arc Al plasma. OES: optical emission spectroscopy; TIG: tungsten inert gas.
Optical emissions from arc plasma were collected at 45° angle above the base plate perpendicularly to welding direction using a simple 2-m long UV–Visible Optical Fiber (QP400-1-UV-VIS, M/s Ocean Optics) of 400 µm core diameter with 0.22 NA from 2-feet distance thus avoiding the intensity attenuation setup to observe the total emissions from the Al arc plasma without saturating the spectrometer as shown in Figure 1(b). The collected optical light was delivered to a low-cost, low-resolution (∼ 1.5 nm) wavelength and Intensity calibrated handheld spectrometer (FLAME-T-UV-VIS-mini, M/s Ocean Optics) equipped with 600 lines/mm grating blazed at 300 nm and covering a wavelength range of 185–1047 nm. The collected spectra were time-integrated over 10 ms intervals to capture steady-state plasma behavior. Such 10 spectra were collected to ensure reproducibility and calculate the plasma parameters with error bars. The optical spectrum was collected at three different arc currents: 150, 200 and 250 A to visualize the effect of arc power on the plasma parameters. The ablated regions of the Al sheet were shown in Figure 1(c). Due to the intense visible and ultraviolet radiation emitted by the TIG arc, stringent eye protection measures were implemented while collecting the optical spectra, Operators wore welding helmets with auto-darkening filters rated to shade level 10 or higher for eye protection and the spectrometer was handled from a safe place to collect the data.
Results and discussion
Analysis of OES spectrum
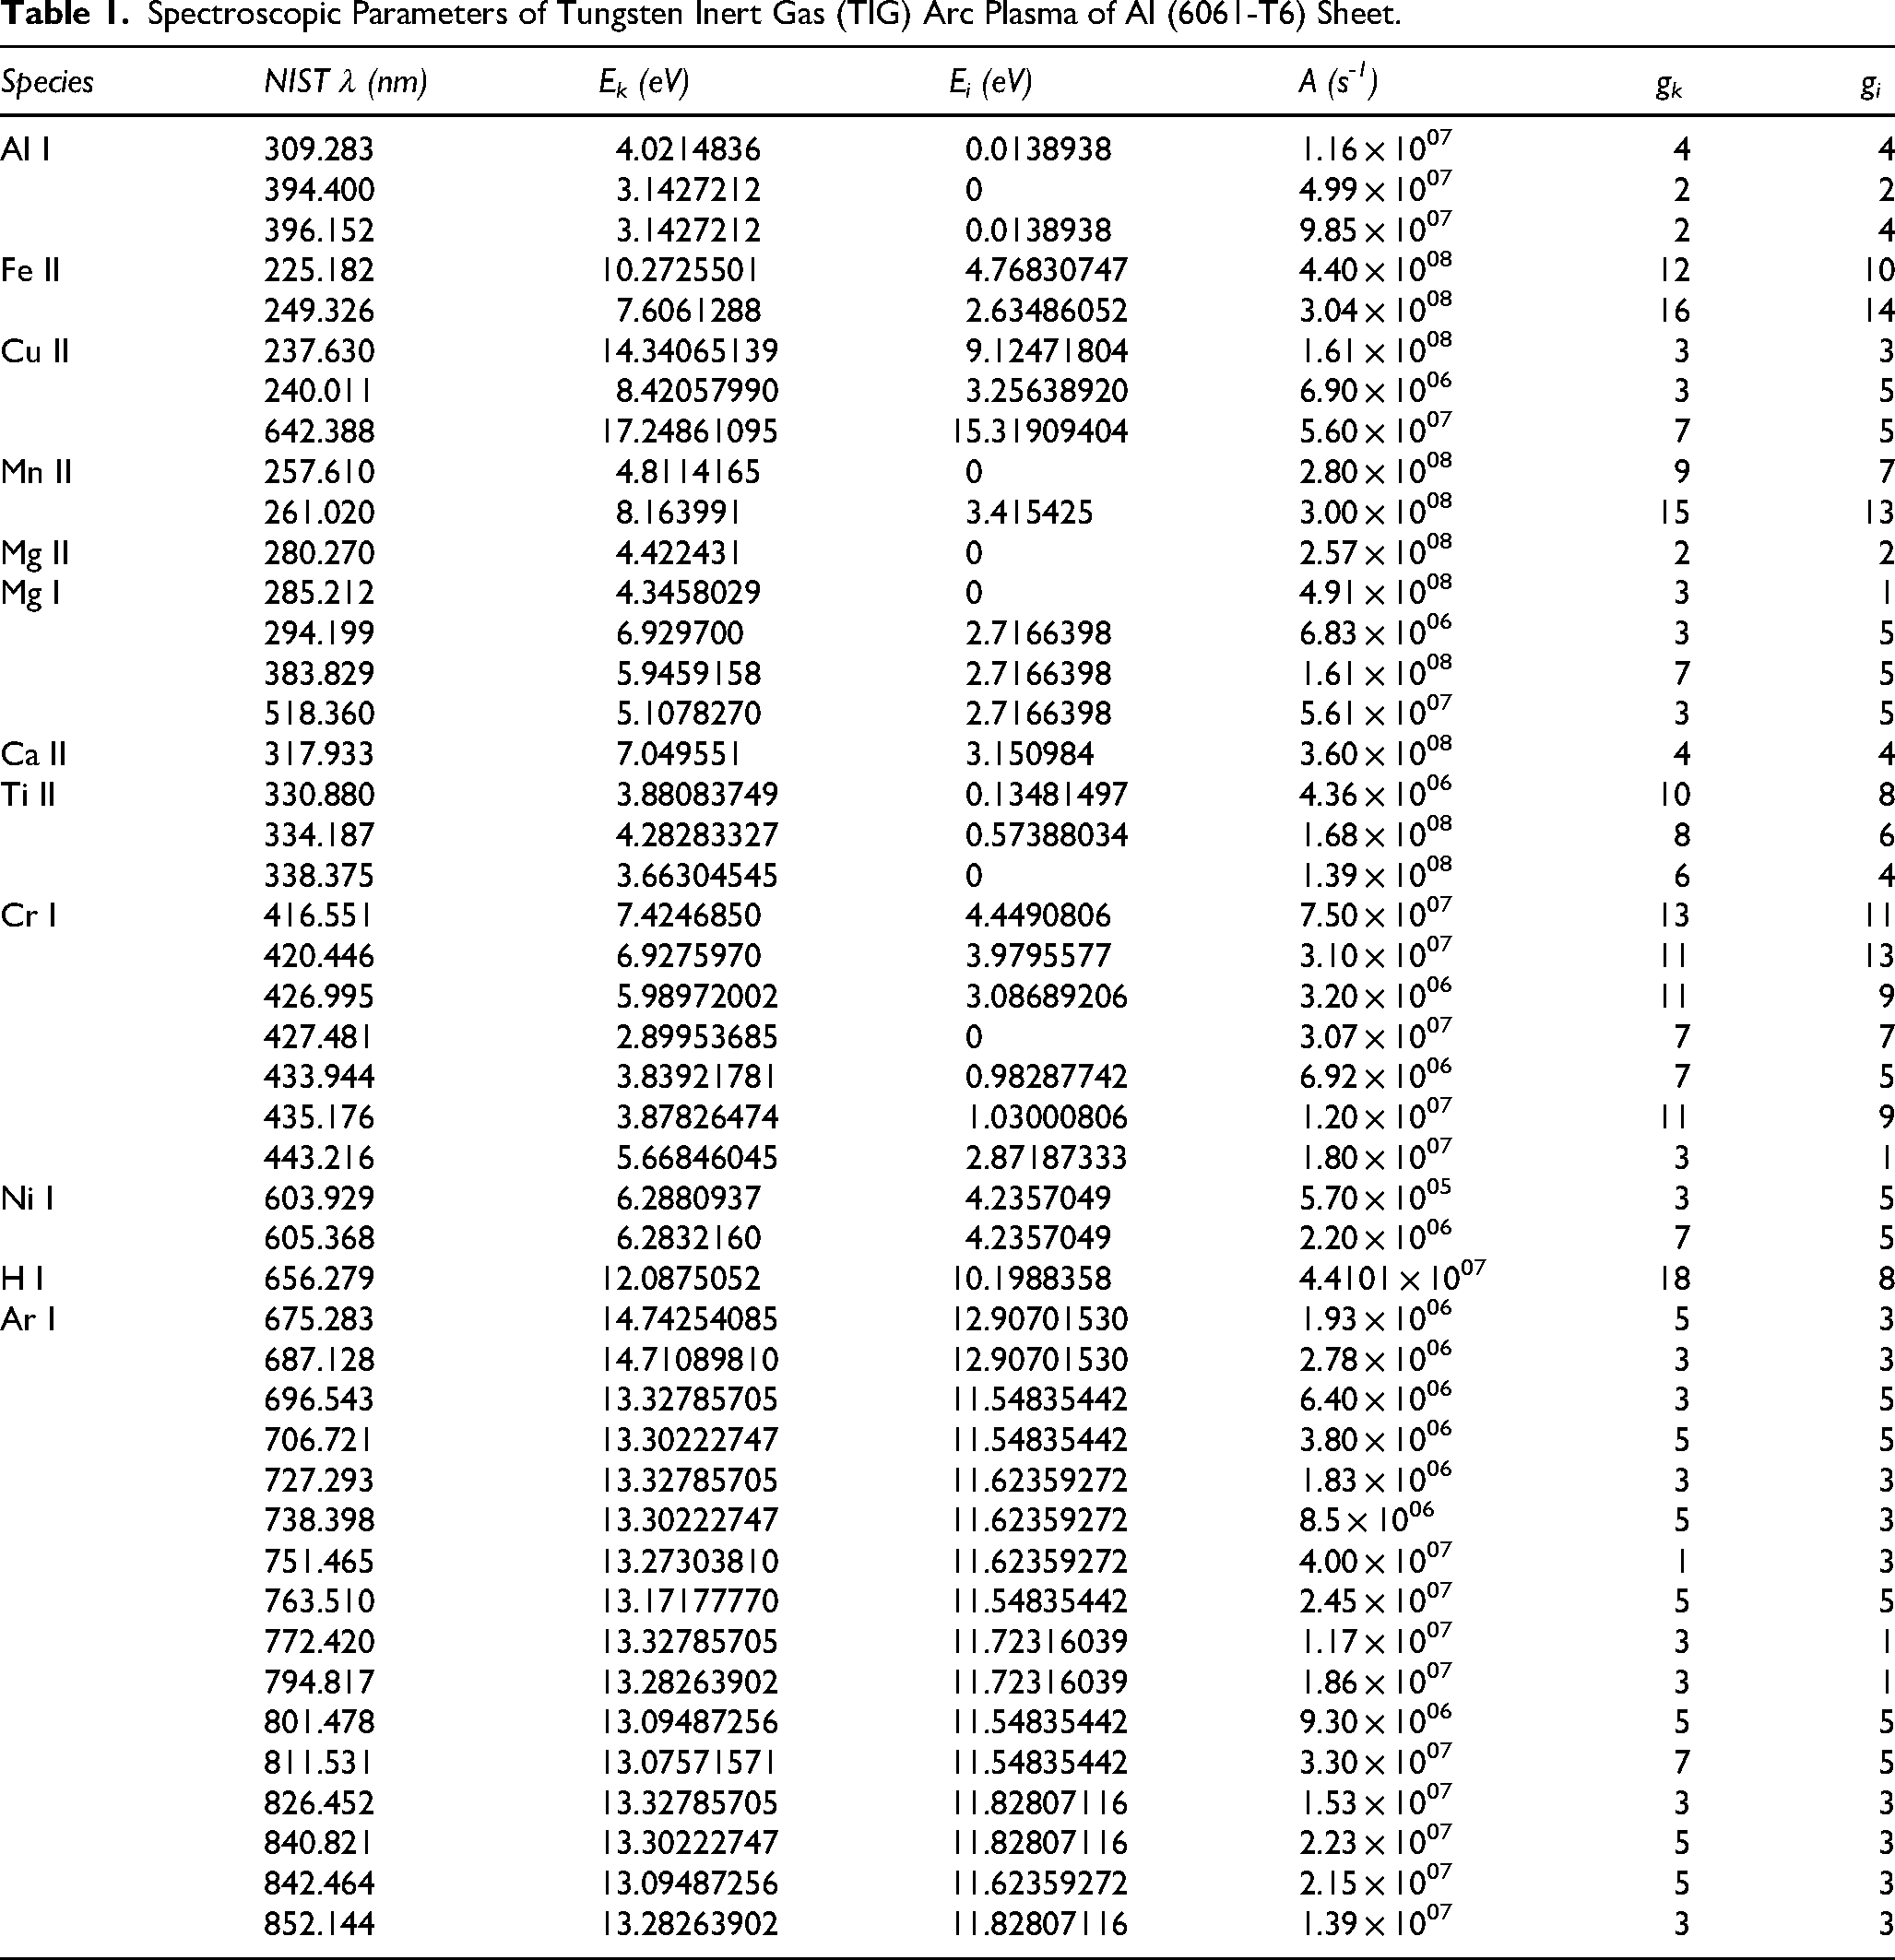
The averaged optical spectrum acquired from TIG arc plasma of Al (6061-T6) sheet was shown in Figure 2. The spectra showed strong atomic emissions of Aluminum (Al I) at 309.697, 394.44 and 396.15 nm, Magnesium ionic (Mg II) and atomic (Mg I) emissions at 280.2, 285.6, 294.2 and 383.63 nm, respectively. Trace emissions of Iron (Fe II), Titanium (Ti II), Chromium (Cr I), Manganese (Mn II), Nickel (Ni I), Calcium (Ca II) and Copper (Cu I) were also observed, indicating minor contamination or alloying additives. Apart from these, the spectrum also showed several strong emissions from the argon shield gas (Ar I) in 660–860 nm wavelength range compared to Al emission lines intensity. Argon was a monoatomic gas, so it does not lose energy through vibration/rotational modes, and the high flow rate of Ar gas could increase the Ar gas density near the arc by pushing the quickly ionized and condensed Al vapor away from the hotter and stable arc plasma core. Thus, more energy was available for Ar electronic excitations due to its relatively low excitation threshold (∼11.5 eV) at arc center led to the stronger Ar optical emissions in 660–860 nm range than Al metal and its impurities. The standard wavelengths and their corresponding spectroscopic parameters of each emission line were summarized in Table 1 with the help of NIST atomic database. 40 All emission spectrum line intensities were prone to fluctuations due to the probabilistic behavior of the plasma breakdown process, fluctuations in the TIG plasma source and light transmission through the optical elements, etc. To maintain a better signal-to-noise ratio and evaluate the experimental uncertainties in the plasma properties, the experiment was repeated 10 times at the same experimental conditions.
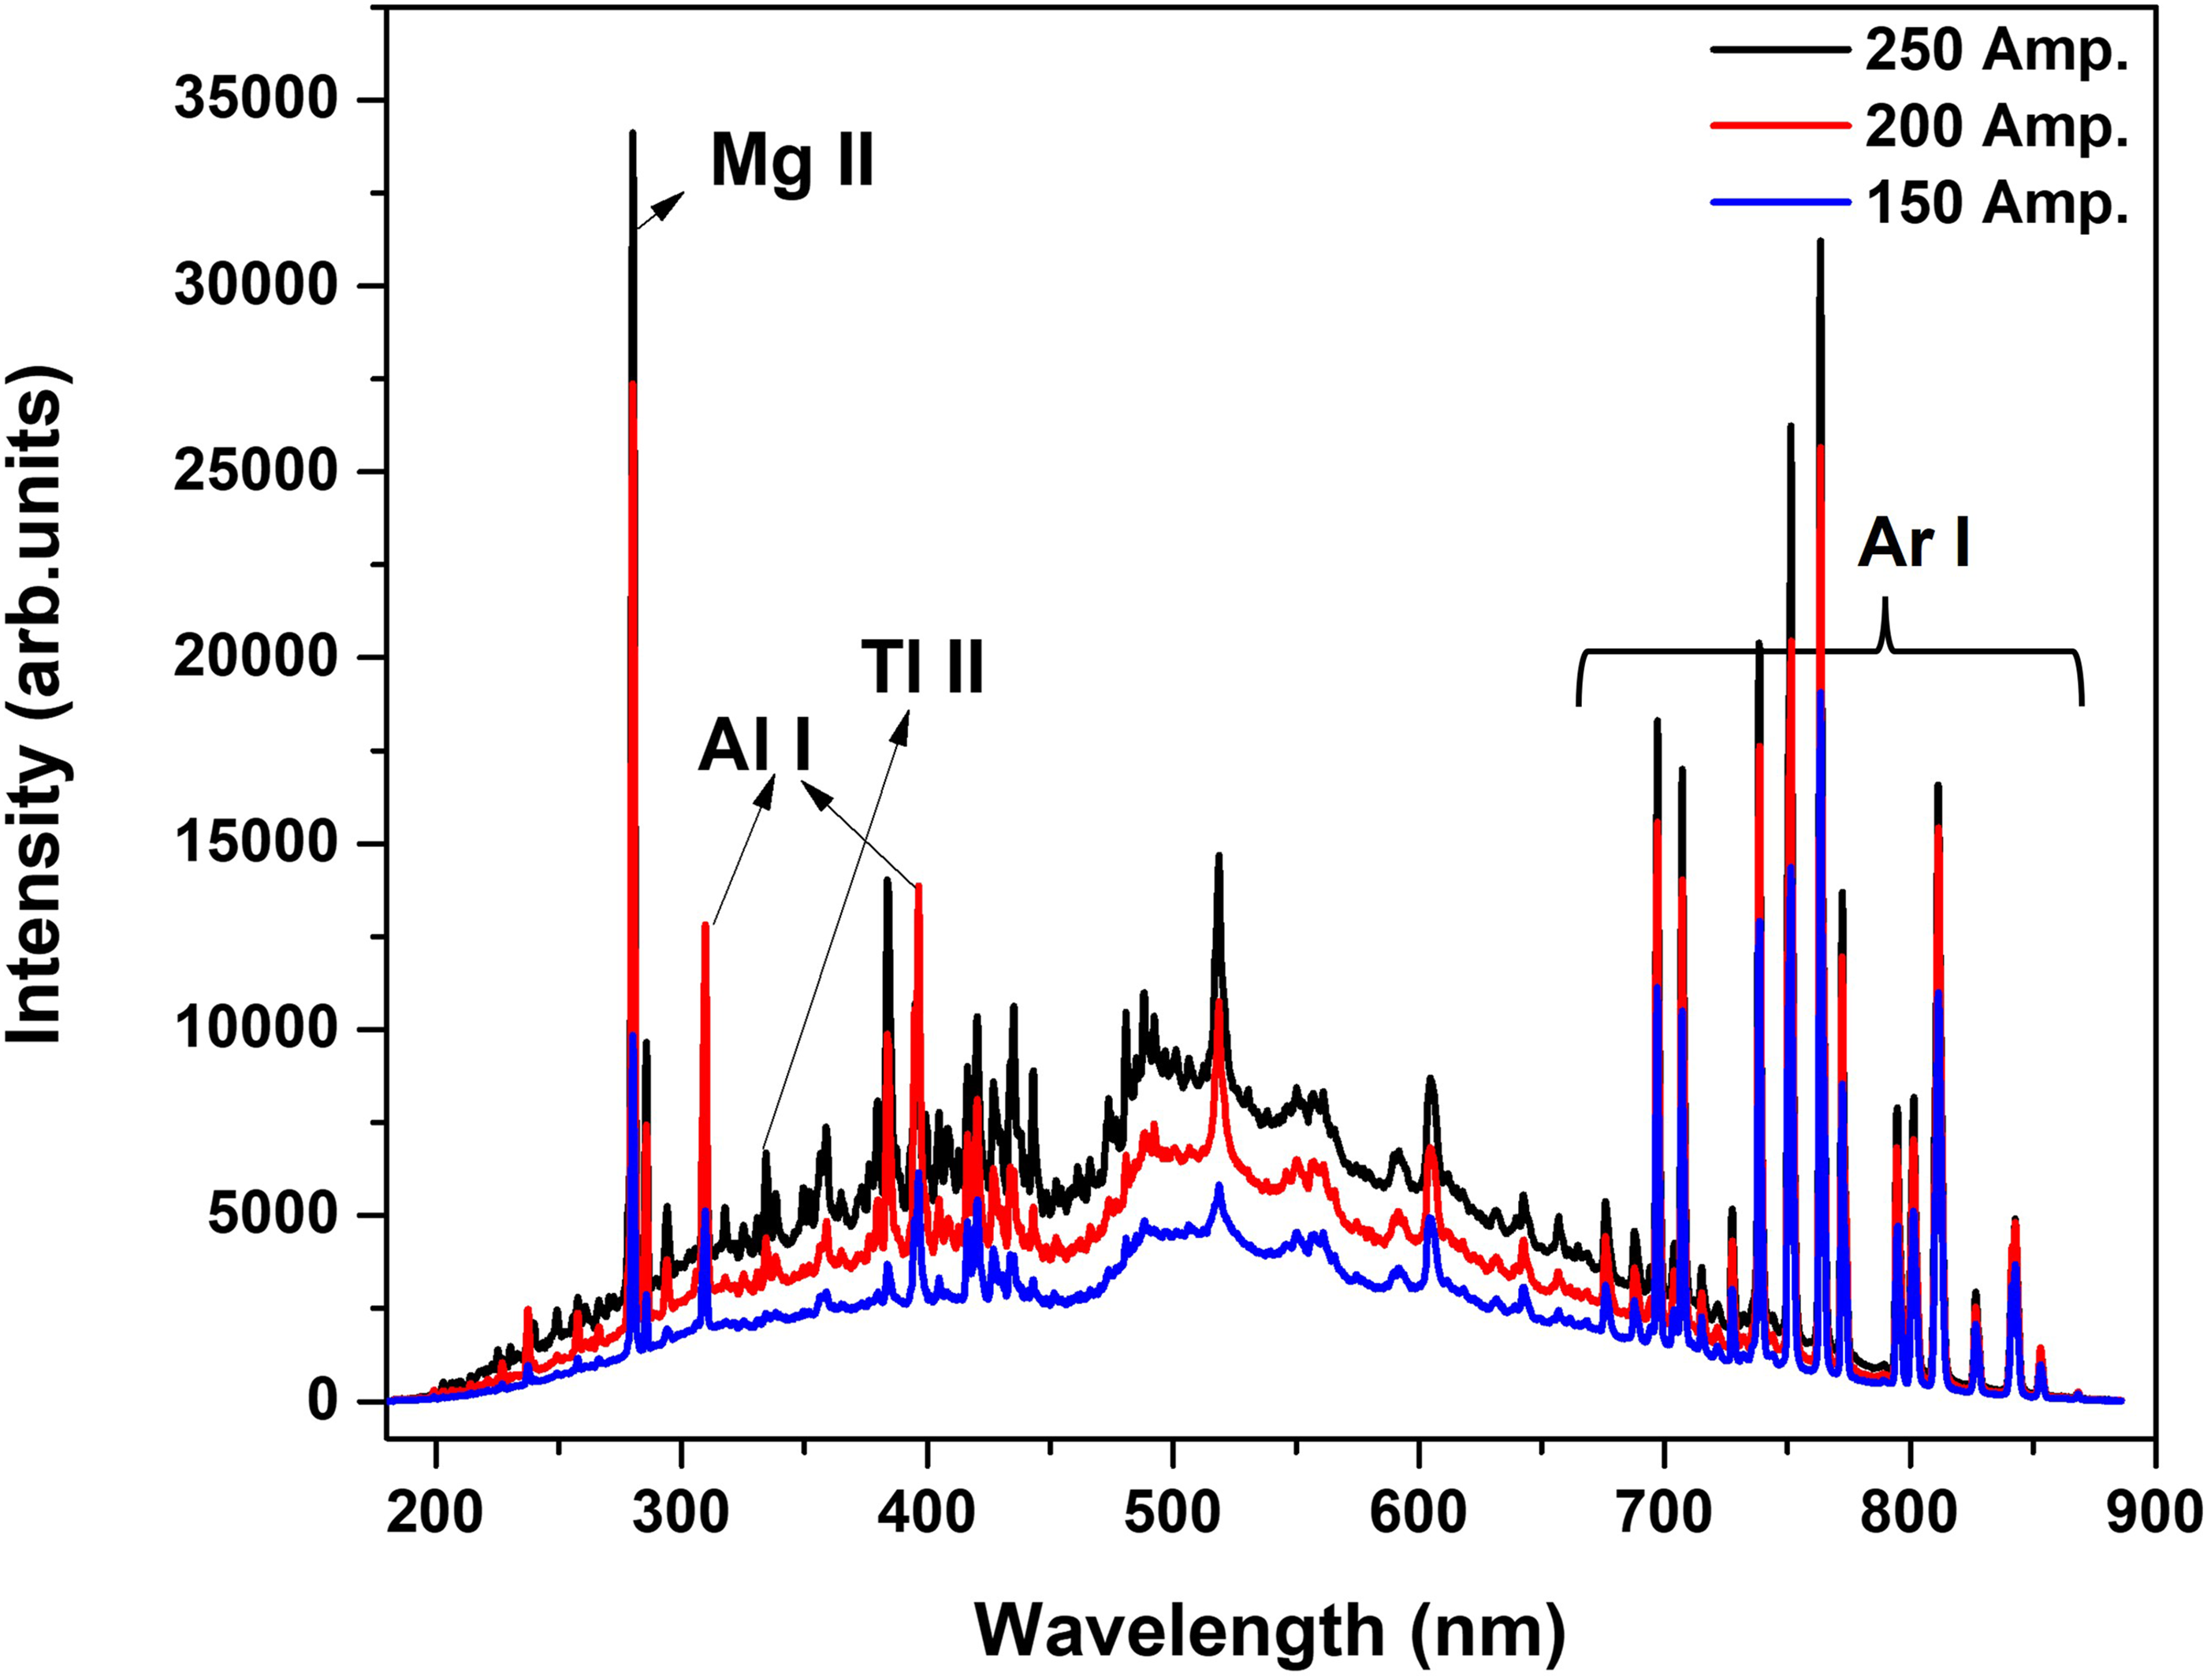
Averaged optical spectrum of tungsten inert gas (TIG) arc Al plasma at 150, 200 and 250 A arc currents.
Spectroscopic Parameters of Tungsten Inert Gas (TIG) Arc Plasma of Al (6061-T6) Sheet.
The spectrum was collected at different TIG arc currents: 100, 150, and 200 A as shown in Figure 2 to understand the effect of arc power on the emission line intensity and plasma properties especially, the plasma temperature, which plays a key role in measuring the species composition. As the arc current increased the arc plasma power also increased, led to increased intensity of the optical emissions as shown in the collected spectrum. For better visualization of the variation of each emission element intensity with increased arc current, the collected spectrum was divided into multiple wavelength region spectra with identification of the important optical element emission wavelength from the TIG arc plasma of Al sheet was showed in Figure 3(a-l).
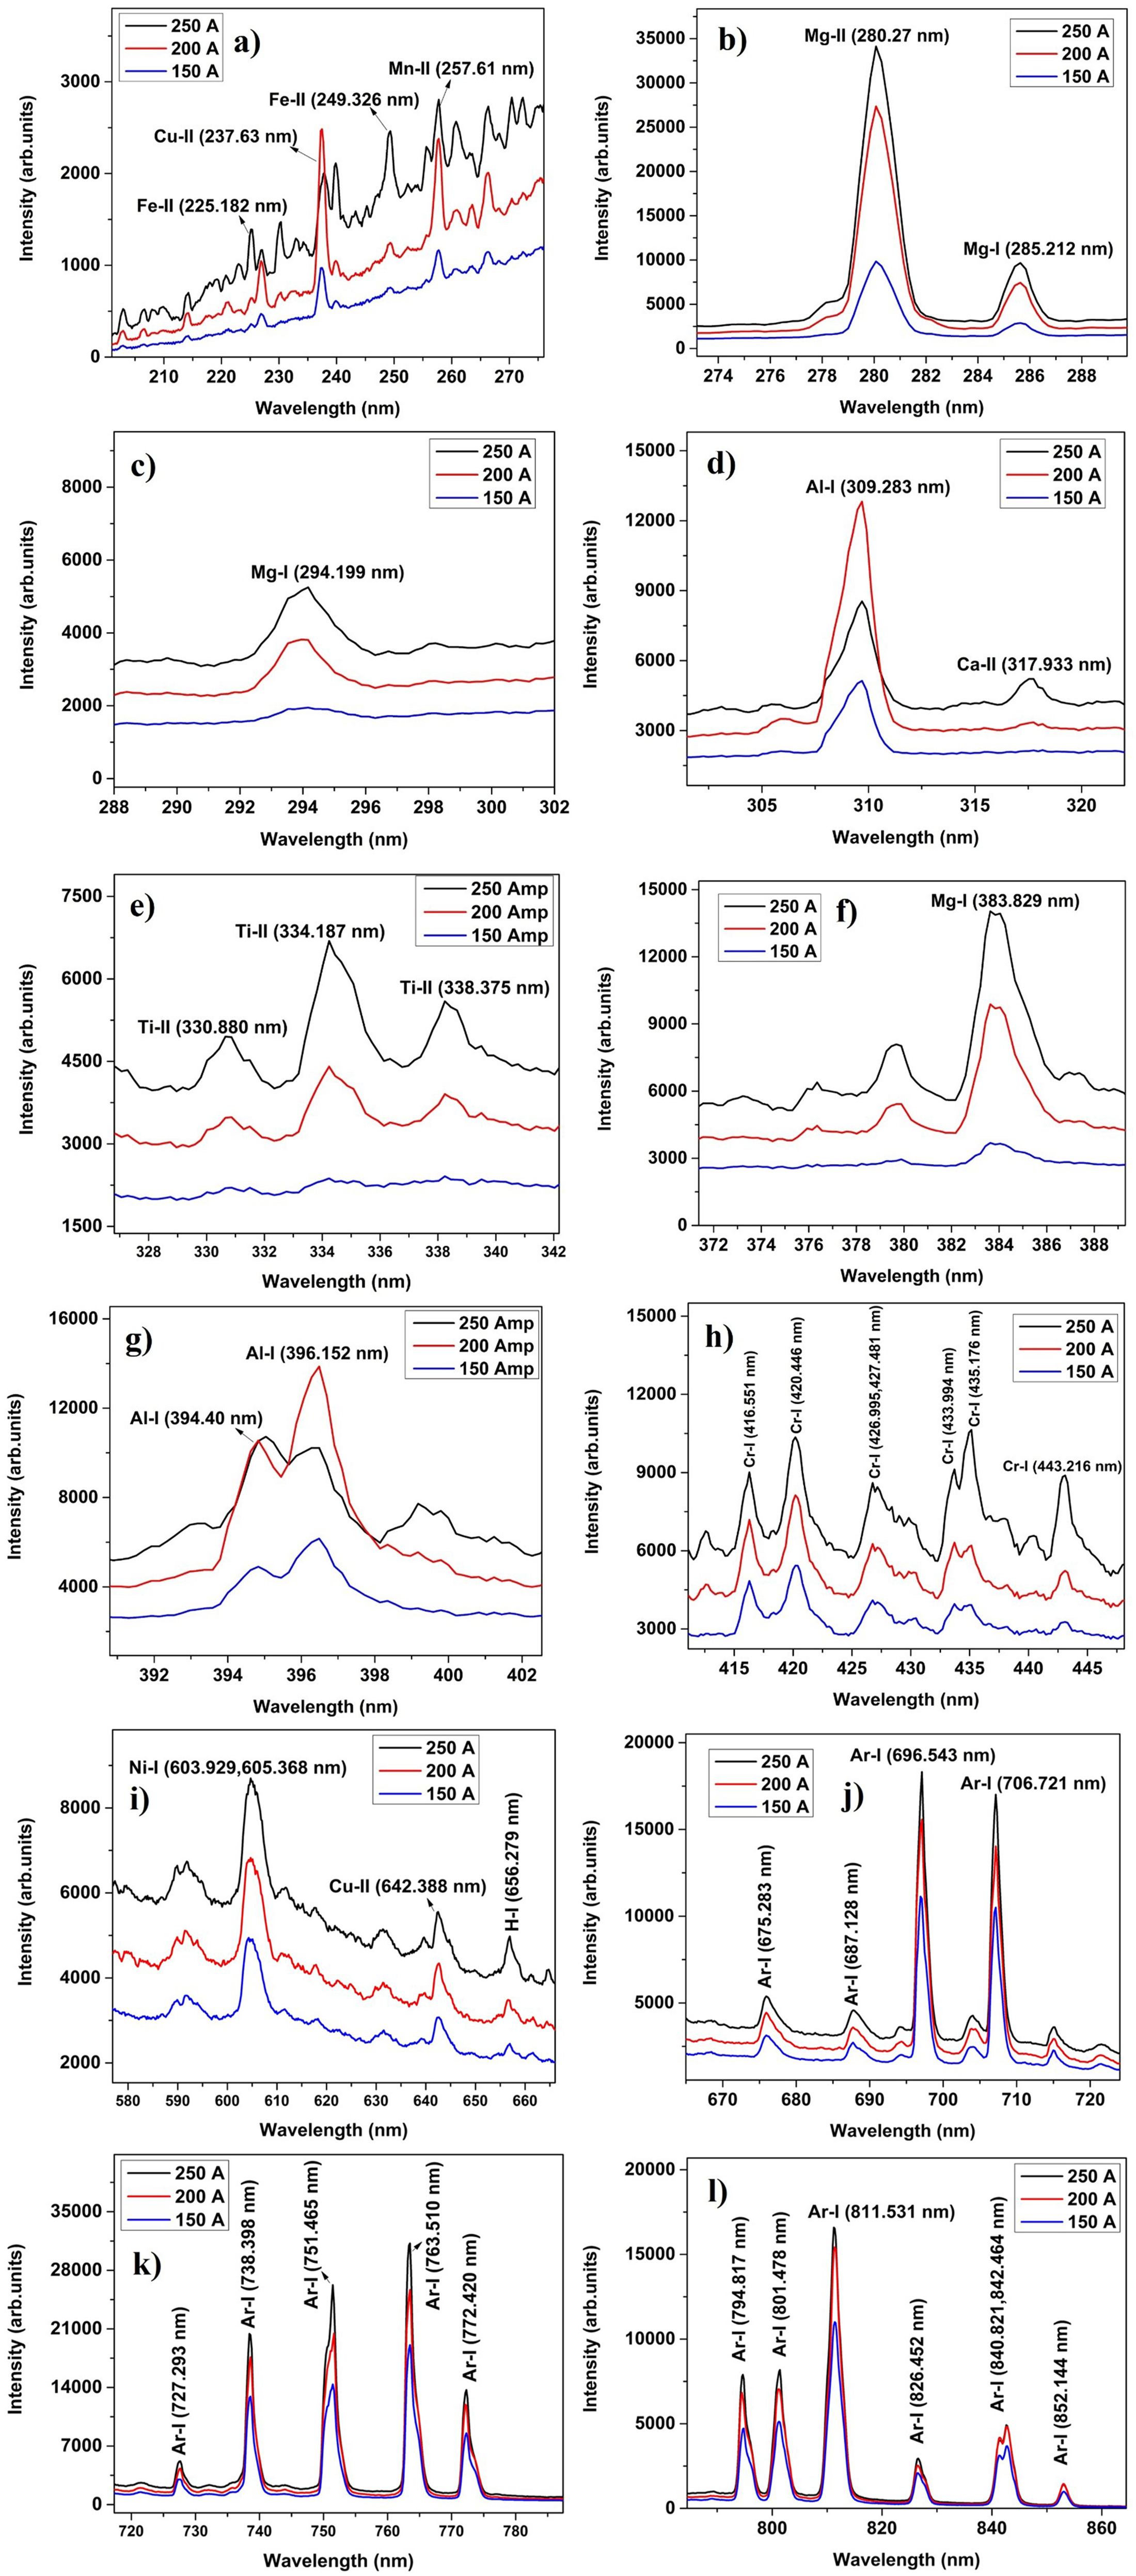
Different optical emission lines and their intensities observed in tungsten inert gas (TIG) arc Al plasma.
The increment in the arc current increased all the optically emitted element intensity except the Al emissions as shown in Figure 3(d) and (g). As the Al has low boiling point (∼ 2743 K), the metal vaporization from Al is modest at low currents or short arc times. So, at higher arc currents the Aluminum species (Al I, Al II) can self-absorb at certain transitions due to the optical thickness of the Al plasma, reducing the net emission intensity from the metal itself. The self-absorption was an unavoidable phenomenon at higher plasma temperatures, such as arc plasma, which causes the observed line intensity to be lower than expected and elemental line shape distortions lead to inaccurate temperature calculations and misleading spectral ratios, thus causing an underestimation of element concentration making to think the species is less abundant in the test sample.
Plasma temperature (Te) and electron number density (ne)
Plasma temperature is a critical thermodynamic property that governs various plasma characteristics, including the molecular distribution across energy levels, the relative abundance of different ionization states, optical thinness, electron number density, species concentration and the overall behavior of the plasma. Two primary methods are prevalent in measuring plasma temperature: line intensity ratio and the Boltzmann plot method.41,42 Although the Boltzmann plot method stands out as the best preferred approach, in the case of self-absorption prone plasmas such as TIG arc plasmas, the line intensity ratio method gives a better plasma temperature estimation. The line intensity ratio method leverages the analysis of multiple spectral lines emitted by the same element in the same ionization state. With the assumption of local thermodynamic equilibrium (LTE), the plasma temperature can be calculated from the relative intensity ratio of spectral lines from the same element ionization stage according to the Boltzmann distribution, using the equation,41,42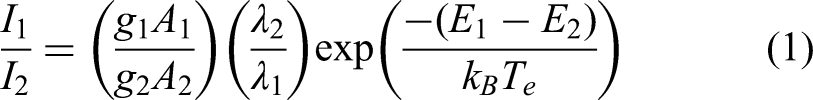
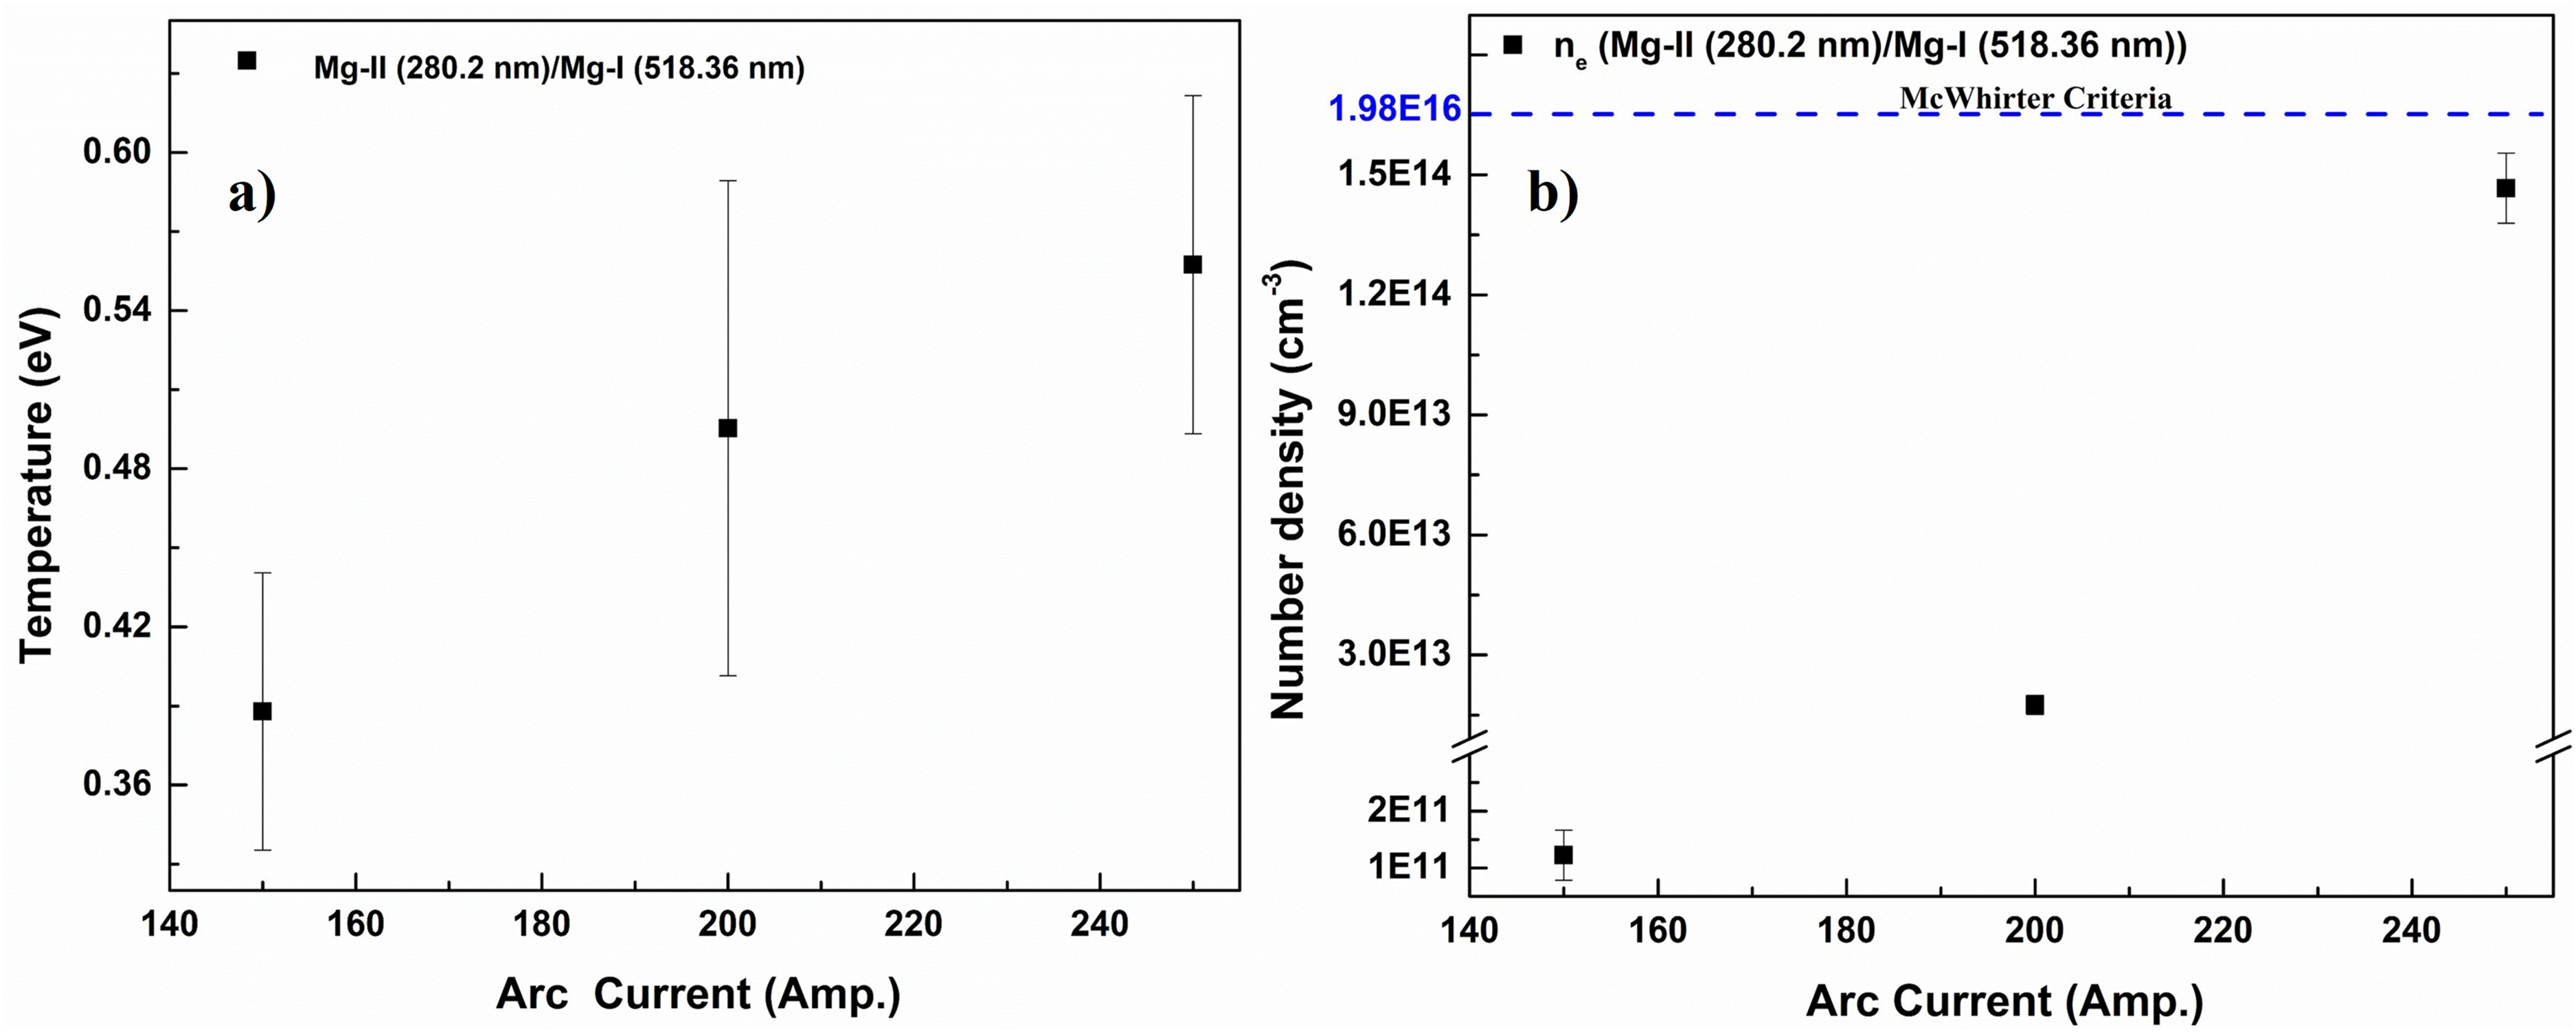
Plasma temperature (Te) and electron number density (ne) for 150, 200 and 250 A arc currents.
The electron number density (ne) of the plasma was estimated from the well-resolved Mg neutral and singly ionized lines at 280.27 and 285.21 nm using Saha-Boltzmann equation method. The Saha-Boltzmann equation was given by41,42: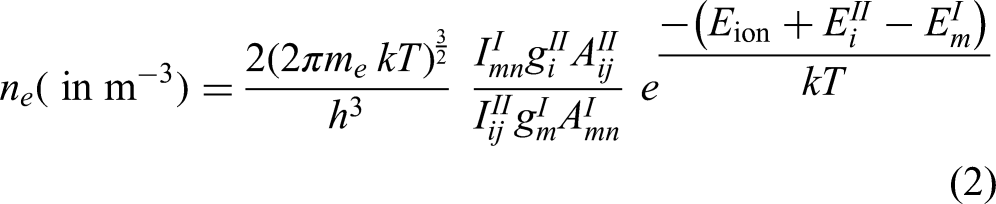
Local thermal equilibrium condition and McWhirter criteria
The assumption of LTE was a fundamental for OES-based diagnostics of plasmas. Under LTE, the populations of atomic and ionic excited states are governed by the Boltzmann distribution, while the balance between different ionization stages follows the Saha equation, both characterized by a single plasma temperature. This condition is valid when collisional processes dominate over radiative processes, ensuring that the excitation and ionization kinetics are controlled by local electron collisions rather than photon exchange.41,42
According to McWhirter criteria, the necessary but insufficient condition for LTE was given by
where T is the plasma temperature (in K) and ΔE is the excitation energy gap (in eV) from the ground state to the lowest level. For TIG arc plasma of Al sheet, the McWhirter criteria was estimated as: 1.98
Species concentration measurement
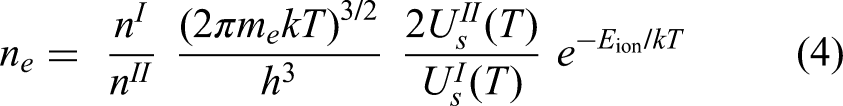
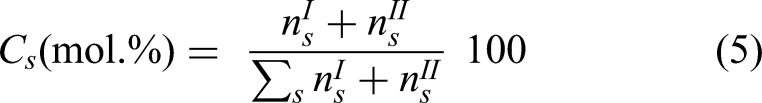
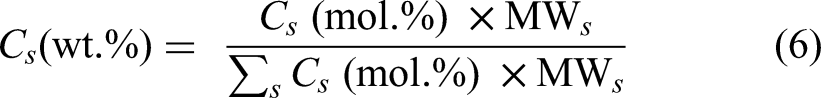
In the typical time window of the OES experiment, the elemental concentration in the plasma was represented by neutral atoms and singly charged ions of the corresponding element to a significant degree. Hence, the concentration of an element (Cs) will be proportional to the sum of population number densities (ns) of neutral atoms and singly charged ions41,42 i.e.,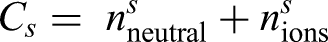
Under partial Local Thermal Equilibrium (LTE) conditions, the population number densities (ns) of Al, Mg and Ti lines were estimated using Boltzmann distribution in terms of Integrated line intensity41,42: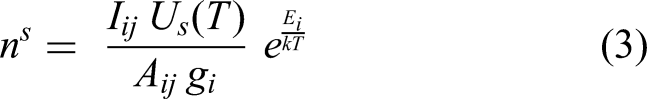
where Cs is the element concentration;
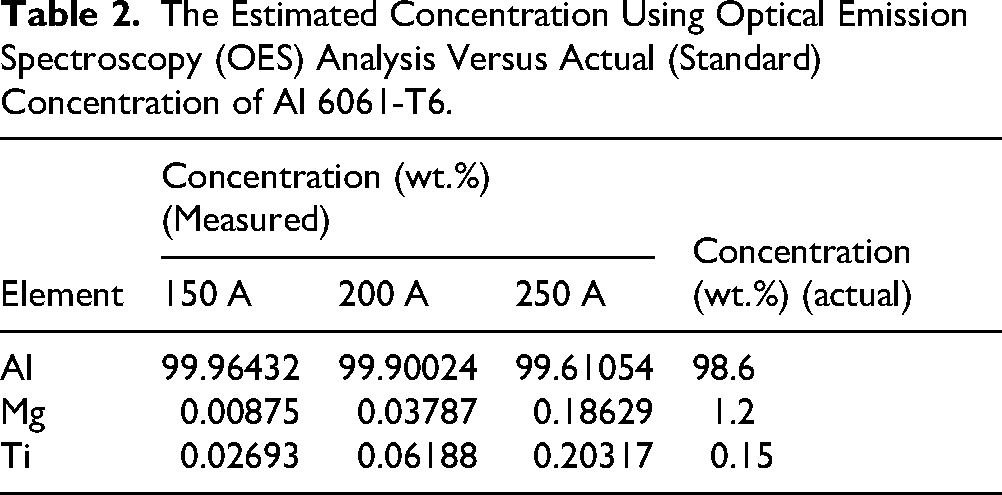
The Estimated Concentration Using Optical Emission Spectroscopy (OES) Analysis Versus Actual (Standard) Concentration of Al 6061-T6.
Error analysis
The estimated error in the concentration measurements in CF-OES from the certified values was measured using the root mean square error (RMSE) of composition as:
where
Summary and conclusions
In summary, the OES data from the TIG arc plasma of Al sheet (Al 6061-T6) was collected using low-cost, low-resolution spectrometer from 2-feet distance without saturation thus avoiding the intensity-reducing filter setup to observe the original spectral emissions from the arc plasma. The analysis of OES data showed that the observed spectra was undergone self-absorption phenomena, commonly occurs in high-power arc plasmas. We confirmed that, for self-absorbed TIG arc plasma of Al sheet OES spectra the line intensity ratio method worked better than the Boltzmann plot method for plasma temperature calculations. Different elements (Al, Mg, Ti and Cr) emission lines were tried to estimate the plasma temperature using line intensity ratio method but only Mg lines shown in Figure 4(a) resulted in the temperature values of 4500–6500 K range, proportional to the increase of arc current. However, the estimated electron number densities with the observed plasma temperature values were below the McWhirter criteria, confirming the plasma was under partial LTE condition. This suggested that the OES spectra were collected from the outer regions of the arc plasma. The species concentrations of Al, Mg and Ti were calculated using the Boltzmann and Saha equations as explained in the results section. Although, the estimated concentrations values were either over-estimated or under-estimated due to the self-absorption and inaccurate plasma temperature values, the RMSE errors were below ± 1 wt.% for three arc currents, which were within the acceptable range. This shows that the OES analysis with low-cost, low-resolution spectrometer can be utilized for the online species concentration monitoring tool of TIG arc plasma. This will be the most cost-effective and accurate solution for at least major species concentration monitoring during the welding process.
Supplemental Material
sj-docx-1-stw-10.1177_13621718261460943 - Supplemental material for Optical emission spectroscopy of tungsten inert gas wire-arc plasma for in situ monitoring in additive manufacturing
Supplemental material, sj-docx-1-stw-10.1177_13621718261460943 for Optical emission spectroscopy of tungsten inert gas wire-arc plasma for in situ monitoring in additive manufacturing by Nagaraju Guthikonda, Goodspeed Devon, Camden Carroll, Sudarsanam S Babu, Bradely Jared and Zhili Zhang in Science and Technology of Welding and Joining
Footnotes
Acknowledgment
This research was supported by NSF and DOE.
Authors contributions
Nagaraju Guthikonda: Conceptualization, Investigation, Methodology, data collection, Formal analysis, and Writing-original draft and editing. Godspeed Devon: Data collection, TIG arc operation. Camden Carroll: Data collection. Sudarsanam Suresh Babu: Conceptualization and Writing-review. Jared Bradely Howell: Conceptualization, Resources, and Writing-review. Zhili Zhang: Funding acquisition, Project Administration, Resources, Supervision, and Writing-review and editing.
Funding
The authors received no financial support for the research, authorship, and/or publication of this article.
Declaration of conflicting interests
The authors declared no potential conflicts of interest with respect to the research, authorship, and/or publication of this article.
Supplemental material
Supplemental material for this article is available online.
References
Supplementary Material
Please find the following supplemental material available below.
For Open Access articles published under a Creative Commons License, all supplemental material carries the same license as the article it is associated with.
For non-Open Access articles published, all supplemental material carries a non-exclusive license, and permission requests for re-use of supplemental material or any part of supplemental material shall be sent directly to the copyright owner as specified in the copyright notice associated with the article.