
Abstract
Time spent in sedentary behavior is largely due to time spent engaged with electronic screen media. Little is known about the extent to which sedentary behaviors for children with autism spectrum disorder differ from typically developing children. We used parental report to assess and compare time spent in sedentary behaviors for 53 children with autism spectrum disorder and 58 typically developing children aged 3–11 years. We also determined how sedentary behavior was related to child weight status (body mass index z-score). Overall, children with autism spectrum disorder spent an hour more in sedentary behaviors on weekdays compared to typically developing children (5.2 vs 4.2 h, p = 0.03), and most of this difference was due to screen time. The age- and sex-adjusted estimate of weekday total daily screen time was 1.6 h (typically developing) compared to 2.5 h (autism spectrum disorder, p = 0.004 for difference). A significant relationship between BMI z-score and total sedentary behavior time on weekend days was observed among young children with ASD, but not among TD children. The modest association between weekend sedentary behaviour time and BMI z-score among children with ASD suggests that sedentary behaiour is linked to relative weight status in these children. Further research is needed to confirm these findings and identify causal pathways.
Introduction
There is growing concern about the amount of time children and adolescents spend engaged in sedentary behaviors, especially time spent watching television, playing video games, and using computers (“screen time”). National health objectives seek to increase the proportion of youth whose television/video viewing is limited to less than 2 h on school days (US Dept of Health, Healthy People 2020), yet estimates based on parent- and self-reports suggest that approximately one-third of typically developing (TD) children aged 2–15 years do not meet this guideline (Sisson et al., 2009). Boys and adolescents are less likely to meet this guideline compared to girls and younger children (Hardy et al., 2010; Sisson et al., 2009). A report from the Kaiser Family Foundation, based on data from a nationally representative sample of US children aged 8–18 years, presents a striking picture of the increase in media use among US children and adolescents (Rideout et al., 2010). Between 2004 and 2009, the average daily time youth spent watching television increased by 38 min, computer use increased by 27 min, and total media use increased by over 70 min (Rideout et al., 2010). These increases are concerning given evidence from population-based studies of TD children, which find that high levels of media use are associated with attention problems, aggression, poor school performance, delayed language development, and obesity (Crespo et al., 2001; Garrison et al., 2011; Pagani et al., 2010; Sharif et al., 2010; Villani, 2001; Zimmerman and Christakis, 2005). Television viewing has been linked to weight status in both cross-sectional and longitudinal studies (Jordan and Robinson, 2008; Mendoza et al., 2007; Must and Tybor, 2005; Rey-Lopez et al., 2008) and to adverse cardiovascular risk factors (Danielsen et al., 2011; Hardy et al., 2010). More time spent watching television is also related to increased snacking, which may influence weight status by increasing energy intake (Brown et al., 2011).
The combination of increased availability and use of electronic media, decreased levels of physical activity, and an increase in the prevalence of obesity has led to concerns that sedentary behaviors may be displacing more physically active ones in children. There are ample data which indicate that time spent in physical activity is decreasing. Using accelerometry-based measures of physical activity from 2003 to 2004 National Health and Nutrition Examination Survey (NHANES), Troiano et al. (2008) found that 42% of children aged 6–11 years met the recommended 60 min of activity on most days of the week; this percentage differed by gender and declined sharply with age, to only 8% in children aged 12–15 years (Troiano et al., 2008). While some research provides support for a displacement of physical activity by sedentary behavior (Baggett et al., 2010; Barnett et al., 2010), other analyses find that physical activity and sedentary behavior are not correlated (Biddle et al., 2004; Marshall et al., 2002). In a review article addressing this issue, Biddle et al. (2004) argue that high media use can coexist with adequate physical activity levels, with data indicating that many children have time for both kinds of behaviors (Biddle et al., 2004).
In contrast to extensive research on these behaviors in TD children, far less is known about the screen time behaviors of children with intellectual and developmental disabilities. Autism spectrum disorder (ASD) is a developmental disability whose prevalence has increased substantially over the last few decades (Fombonne, 2005). Research comparing physical activity levels in this population of children has yielded mixed findings. Pan (2008) found that children with ASD had significantly lower physical activity levels during recess than their TD peers, as measured by accelerometry (Pan, 2008). In contrast, we found that overall daily physical activity levels between children with ASD and TD children were similar based on accelerometry; however, children with ASD participated in fewer specific parent-reported physical activities (Bandini et al., 2013). The social, behavioral, or intellectual impairments evidenced by children with ASD make participation in formal and informal forms of physical activity more difficult, potentially increasing the amount of time they spend in sedentary behaviors. Parents of children with ASD also report using television for its calming effect on their children and as a respite from the challenges of caring for them (Nally et al., 2000). A small focus group study conducted with parents of children with ASD revealed that television and video games are often used as a way of managing child behavior, but also that parental disagreements around child viewing patterns were often a source of stress within the family (Nally et al., 2000).
Prior research suggests that children with ASD are particularly visually oriented, which may manifest as high interest in television and computers; however, as noted by Mazurek et al. (2012), few studies have examined this issue directly. Children with ASD have shown better responses to verbal directives delivered via video clips than via live human presentations (Shane and Albert, 2008). While an affinity for visual material has been used successfully to increase communication and adapt learning strategies for children with ASD (Charlop-Christy et al., 2002; Corbett and Abdullah, 2005), screen time may also have unintended negative consequences related to weight control and other aspects of health. In a study of electronic screen media in children diagnosed with autism, Shane and Albert (2008) found that the children spent more time engaged with electronic screen media than any other leisure activity (Shane and Albert, 2008). In particular, children who spent three or more hours per day viewing television/movies did so by excluding other leisure-time activities, such as playing.
To date, few studies have assessed and compared measures of sedentary behavior, as reflected in time spent watching television/videos, playing video games, or using computers, in TD children and children with ASD. Furthermore, to our knowledge, no data on the relationship between sedentary behavior and weight status among children with ASD have been published. We hypothesized that children with ASD would spend significantly more time in screen-based sedentary behaviors than TD children and that sedentary behavior time would be positively correlated with body mass index (BMI) z-score, a measure of relative weight status.
Methods
The Children’s Activity and Meal Patterns Study (CHAMPS) was a cross-sectional study conducted in 2007–2008 that included children with ASD and TD children aged 3–11 years. Participants were recruited via outreach to local schools and community programs, online postings, existing participant databases at the University of Massachusetts Medical School–Shriver Center, autism support organizations, and with the assistance of the Interactive Autism Network (IAN) Project at the Kennedy Krieger Institute, Baltimore, Maryland. Inclusion criteria required that the child be in good health and free from diseases or disorders that could affect dietary and/or physical activity habits (e.g. diabetes, cystic fibrosis, chronic gastrointestinal illness, cerebral palsy). In addition, we excluded participants taking medications known to impact appetite, such as steroids, atypical antipsychotics, mood stabilizers, tricyclic antidepressants, anticonvulsants, and stimulants. Our recruitment efforts were designed to frequency-match the two groups, in order to achieve groups balanced by age and sex. The study was approved by the Institutional Review Board at the University of Massachusetts Medical School. Parents were compensated for their participation, and children were given a gift certificate to a book store.
The diagnosis of ASD was verified via the Autism Diagnostic Interview–Revised (ADI-R) (Rutter et al., 2003), which was administered by research-reliable clinicians to the parents of children who indicated their child had ASD. All participants met the cutoff for diagnosis on this instrument. The Vineland Adaptive Behavior Scales (2nd edition) (Sparrow et al., 2005) was used to characterize adaptive skills (Adaptive Behavior Composite), and we administered the Differential Abilities Scale General Conceptual Ability (DASGCA, original 1990 version) (Elliott, 1990) to assess the cognitive abilities of the children with ASD.
All children were weighed and measured in light clothing without shoes using a Seca™ portable scale and wall-mounted stadiometer. BMI was calculated from measures of height and weight (kg/m2) and referenced against the sex- and age-specific Centers for Disease Control and Prevention (CDC) childhood growth reference (Kuczmarski et al., 2002). Obesity and overweight were defined as a BMI-for-age at or above the 95th or 85th percentiles, respectively; underweight was defined as a BMI-for-age below the 5th percentile, as recommended by the CDC (2011).
A parent-completed questionnaire designed to determine a child’s participation in organized and unstructured physical activities was used to estimate the number of hours spent in physical activity each year, as previously detailed (Bandini et al., 2013). Briefly, parents were asked to indicate the types and frequency of physical activities their children engaged in over the previous 12 months (17 activities total).
Assessment of sedentary behavior
To determine each child’s level of sedentary behavior, parents completed a questionnaire developed by our research team. Parents were asked, “Over the past
Reliability of sedentary behavior measures
We re-administered the questionnaires within 10–30 days with 44 parents (13 parents of children with ASD and 31 parents of TD children). The estimates for total sedentary behavior time on the two questionnaires were significantly correlated (weekday: Spearman’s r = 0.87 for ASD, Spearman’s r = 0.72 for TD; weekend: r = 0.58 for ASD, r = 0.70 for TD) as were television time (weekday: r = 0.91 for ASD, r = 0.80 for TD; weekend: r = 0.93 for ASD, 0.80 TD) and total screen time (weekday: r = 0.91 for ASD, r = 0.75 for TD; weekend r = 0.84 for ASD, r = 0.88 for TD). Furthermore, the mean error did not differ between the two groups for either measure before or after adjustment for age and sex.
Statistical analyses
Analyses were conducted in SAS Version 9.2 (SAS Institute, Cary, NC) and PASW Statistics for Windows Version 18 (SPSS, Chicago, IL), with the alpha level set at 0.05. Distributions of sedentary time measures were evaluated for normality. We used t-tests for continuous variables and chi-square or Fisher exact tests for categorical variables to determine whether TD children and children with ASD differed with respect to age, sex, race (White, non-White), parental education (earned a college degree or not), number of siblings (0 vs ≥1), and child weight status (underweight, normal weight, overweight, or obese). A series of linear regression analyses were conducted with sedentary behavior as outcome variables. Covariates that differed for the two groups of children were considered as potentially confounding variables in adjusted analyses. To assess group differences in sedentary behavior time, t-tests were used for normally distributed variables and the Mann–Whitney U test was used for variables with skewed distributions. Least square means regression was used to assess group differences adjusting for potentially confounding variables. We used Pearson and Spearman correlations and multiple linear regression analyses to evaluate the association between sedentary behaviors and BMI z-score, and to assess the association between cognitive ability and the sedentary behavior variables among children with ASD. In each regression model, we tested the significance of an interaction term for autism status and measure of sedentary behavior in association with BMI z-score to evaluate whether the associations differed for children with ASD and TD children. Because the interaction was significant for one variable (weekend total sedentary time) and of borderline significance for another (weekend screen time), we present the results of the linear regression analyses stratified by group. We declare results with a p-value <0.05 to be statistically significant, and indicate results of borderline significance when 0.05 < p < 0.10.
Results
A total of 53 children with ASD and 58 TD children completed the study. The two groups did not differ relative to age, gender, race, parental education, or weight status, but TD children were more likely than children with ASD to have no siblings (i.e. to be only children) (Table 1). After stratifying by group status, we observed no statistically significant difference in television time, total screen time, or total sedentary behavior between male and female subjects (all p > 0.05). Among TD children, there was a significant negative correlation between age and both weekday TV time (r = −0.38, p < 0.01) and weekday total sedentary behavior (r = −0.30, p < 0.05). Among children with ASD, there was a significant positive correlation between age and weekend screen time (r = 0.30, p < 0.05). Among children with ASD, there was no statistically significant relationship between weekday or weekend TV time, total screen time, or total sedentary behavior and cognitive ability as assessed by the DASGCA (Spearman’s r ranged from −0.24 to 0.05, all p > 0.05).
Demographic characteristics in TD children and children with ASD.
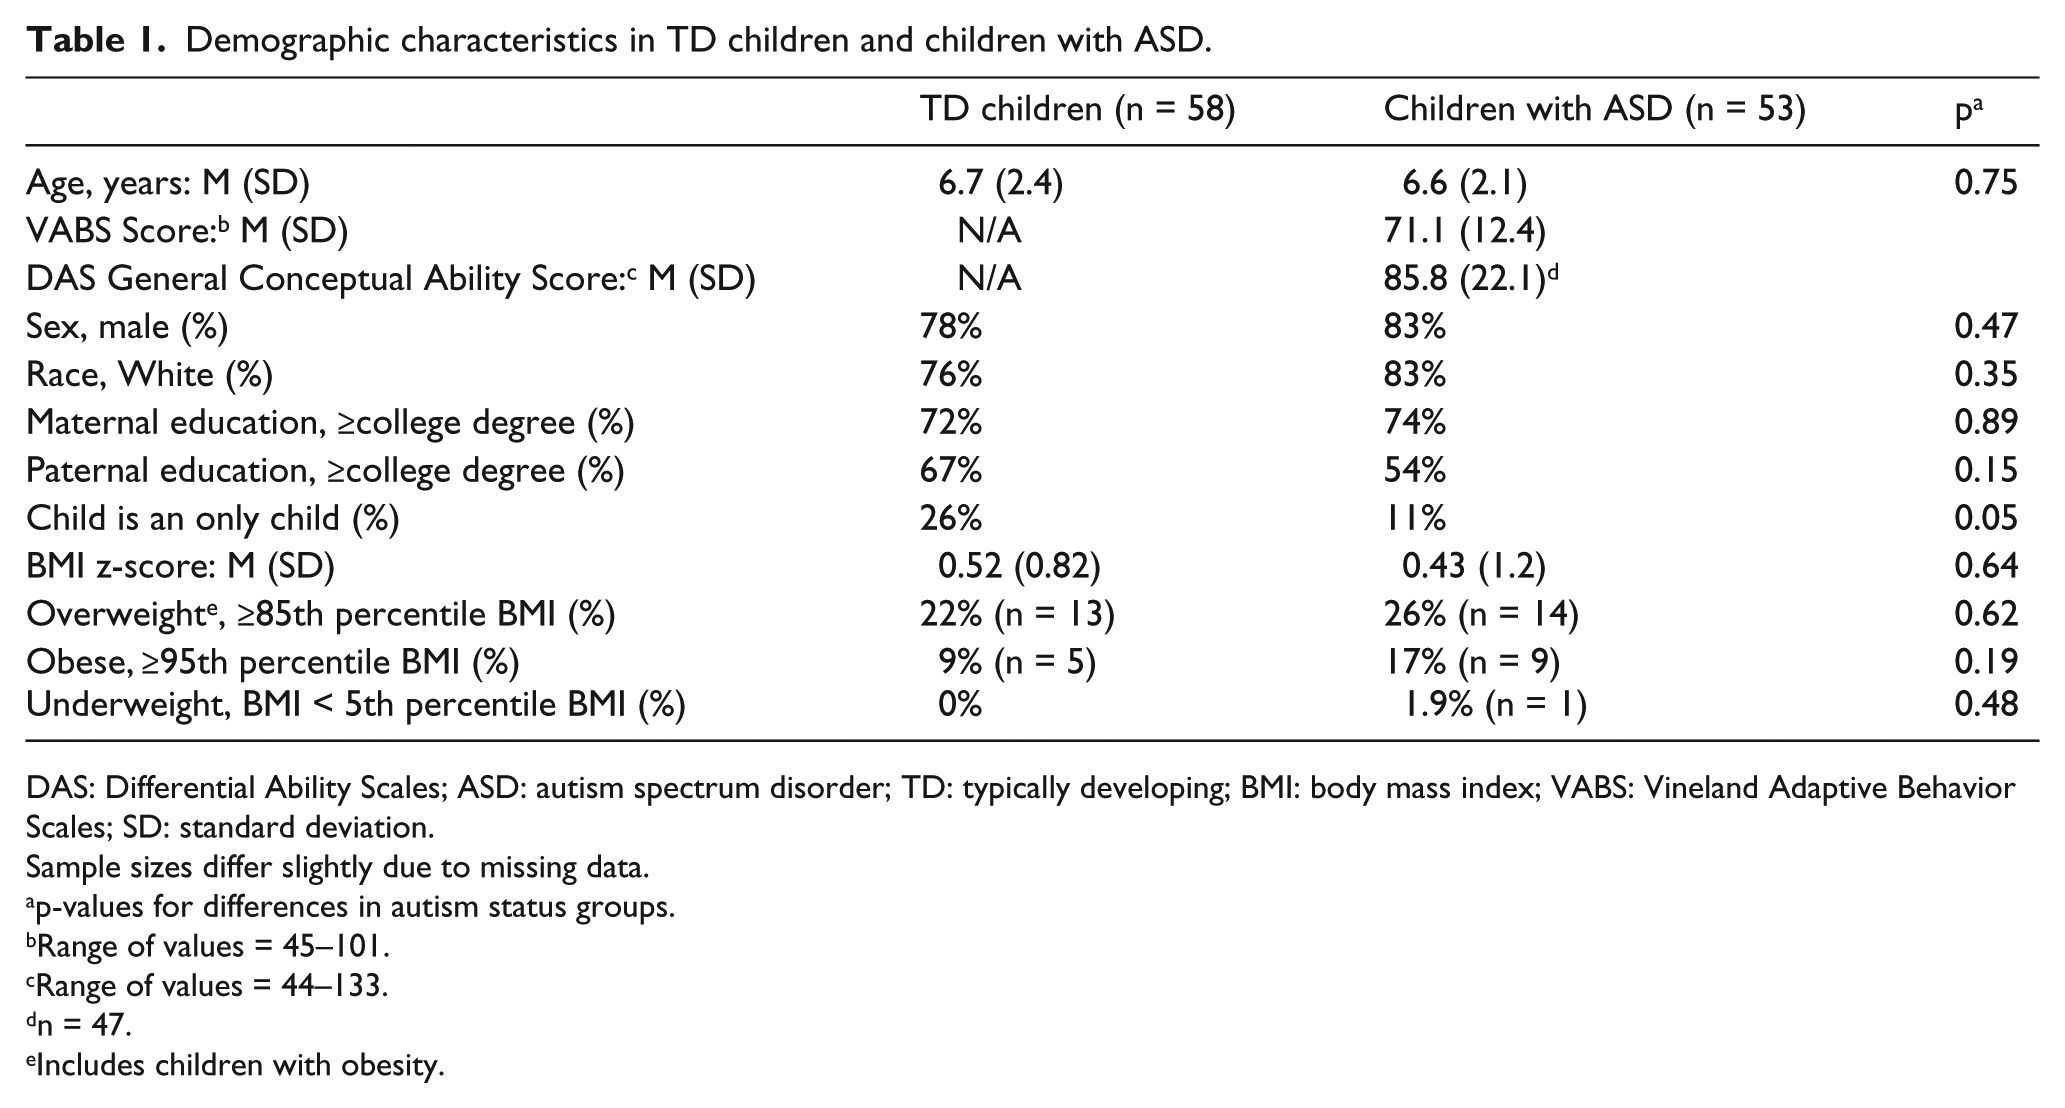
DAS: Differential Ability Scales; ASD: autism spectrum disorder; TD: typically developing; BMI: body mass index; VABS: Vineland Adaptive Behavior Scales; SD: standard deviation.
Sample sizes differ slightly due to missing data.
p-values for differences in autism status groups.
Range of values = 45–101.
Range of values = 44–133.
n = 47.
Includes children with obesity.
Unadjusted measures of sedentary behavior by group status are presented in Table 2. Children with ASD had higher average weekday and weekend screen time than did TD children although screen time was higher on weekends as compared to weekdays for both groups of children. On weekdays, total screen time was 2.6 h per day for children with ASD compared to 1.6 h per day for TD children (p < 0.01). On weekends, total screen time was 4.0 h per day for children with ASD compared to 3.0 h for TD children (p = 0.03). The proportion of children with two or more hours of screen time on the weekdays was greater among children with ASD than TD children (63% vs 40%, p = 0.02 by chi-square). A similar pattern was observed on weekend days (90% of children with ASD had two or more hours of screen time on weekend days versus 62% of TD children, p = 0.001). Television viewing was the predominant source of screen time for all children, with children with ASD watching an average of 1.8 h per weekday and TD children watching an average of 1.0 h per weekday (p < 0.01) (Table 2). Television viewing time was higher on the weekends for both groups, with children with ASD watching an average of 2.5 h per weekend day and TD children watching an average of 1.9 h per weekend day (p = 0.03). Children with ASD also used computers for more time each day than did TD children, but these between-group differences were not always statistically significant (Table 2). Video game use was the smallest component of screen time, and it did not differ between ASD and TD children.
Unadjusted estimates of sedentary behavior for children with ASD and TD children.
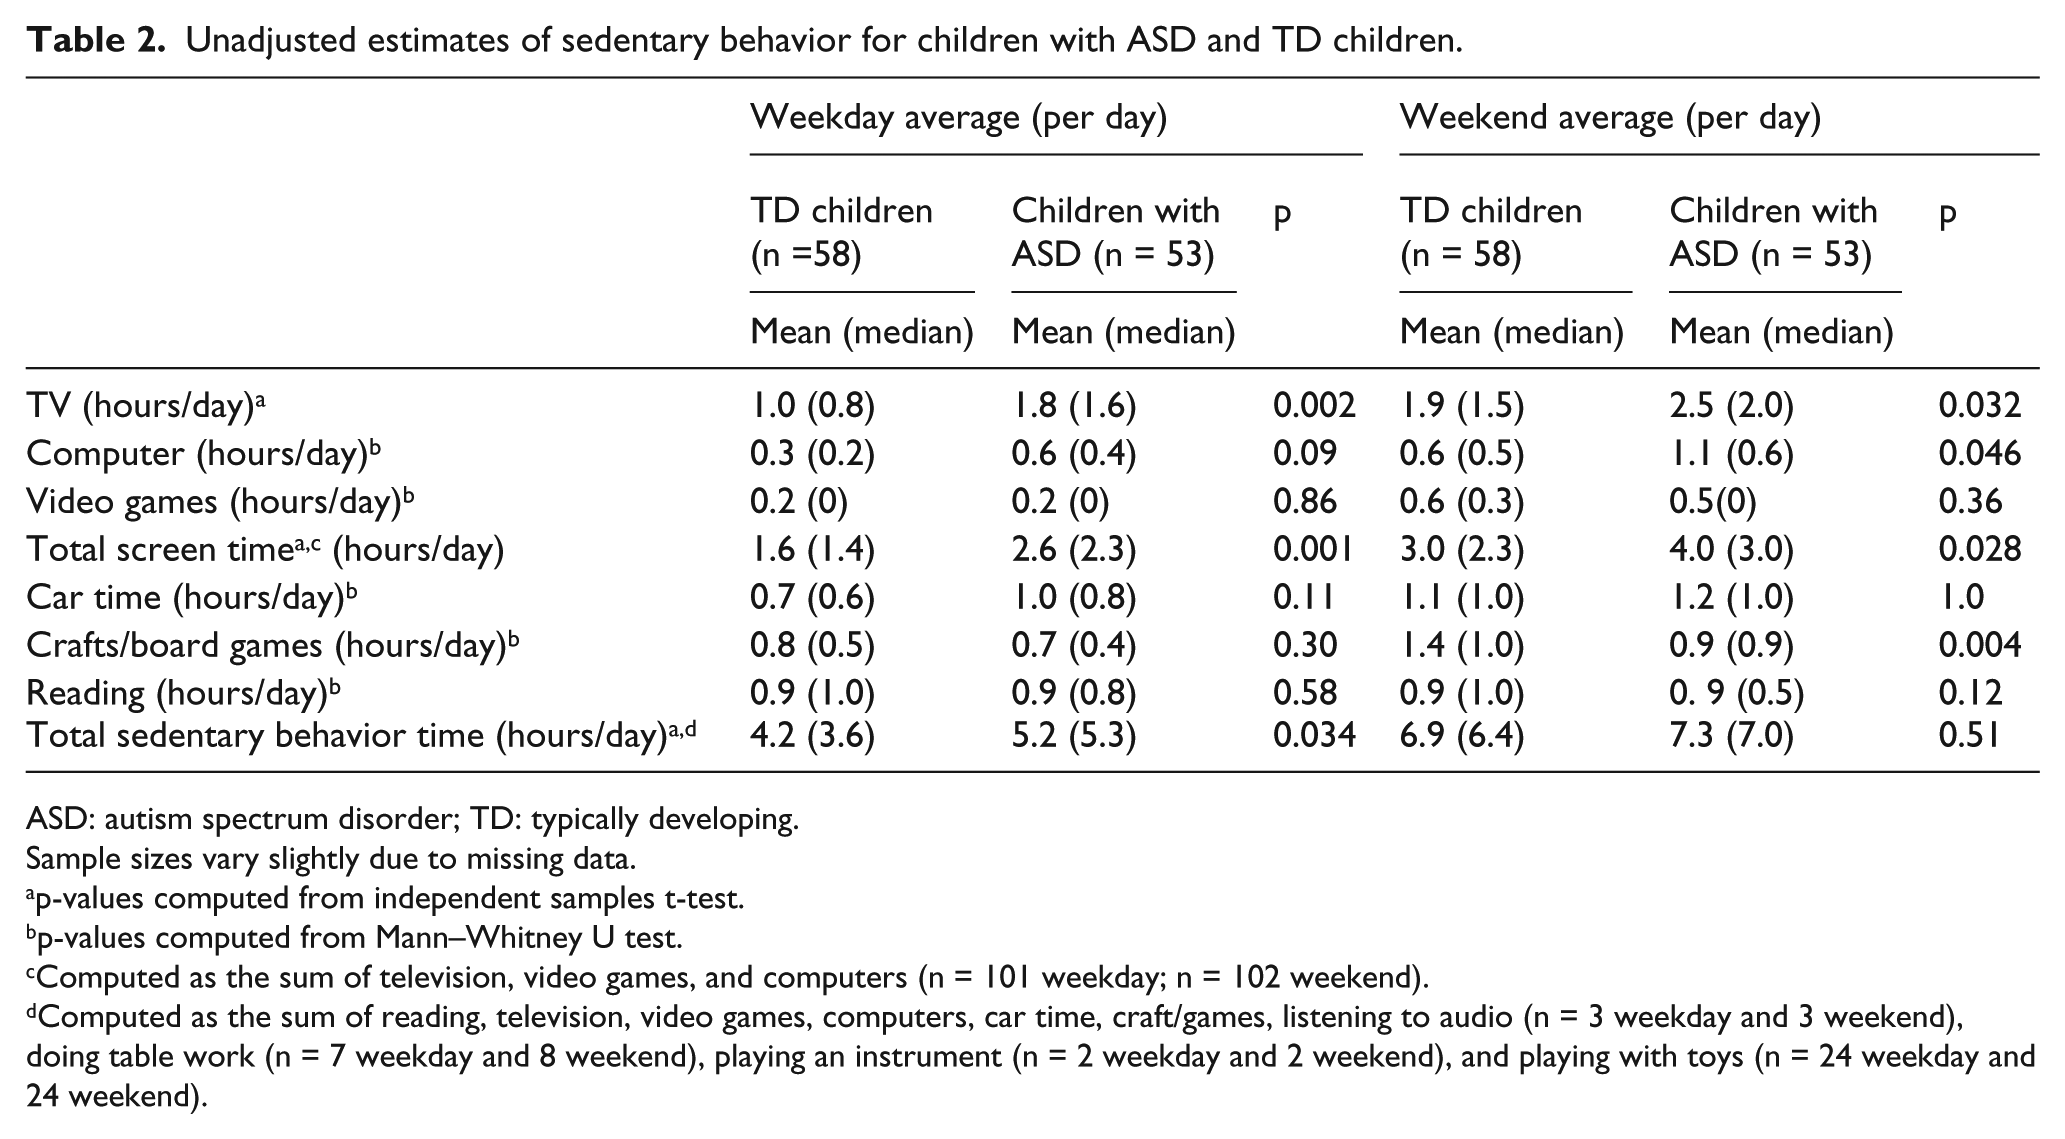
ASD: autism spectrum disorder; TD: typically developing.
Sample sizes vary slightly due to missing data.
p-values computed from independent samples t-test.
p-values computed from Mann–Whitney U test.
Computed as the sum of television, video games, and computers (n = 101 weekday; n = 102 weekend).
Computed as the sum of reading, television, video games, computers, car time, craft/games, listening to audio (n = 3 weekday and 3 weekend), doing table work (n = 7 weekday and 8 weekend), playing an instrument (n = 2 weekday and 2 weekend), and playing with toys (n = 24 weekday and 24 weekend).
We also examined other types of sedentary behavior. The time children spent in the car or reading each day was similar between the two groups, but TD children spent more time on weekend days doing crafts and playing board games than did children with ASD (1.4 vs 0.9 h/weekend day, p < 0.01). When all sources of sedentary behavior were combined, total sedentary behavior was significantly higher on weekdays among children with ASD (ASD = 5.2 h, TD = 4.2 h, p = 0.03), but not on weekends (Table 2).
In regression analyses adjusted for age and sex, or for age, sex, and only-child status, the least square means estimates of sedentary behavior between the groups were largely unchanged from the unadjusted estimates, with the exception of total screen time on the weekends (Table 3). After adjustment for age, sex, and only-child status, total screen time on weekend days remained greater for ASD than for TD, but differences were of only borderline significance (ASD = 3.9, TD = 3.1, p = 0.08).
Adjusted estimates of sedentary behavior for children with ASD and TD children.
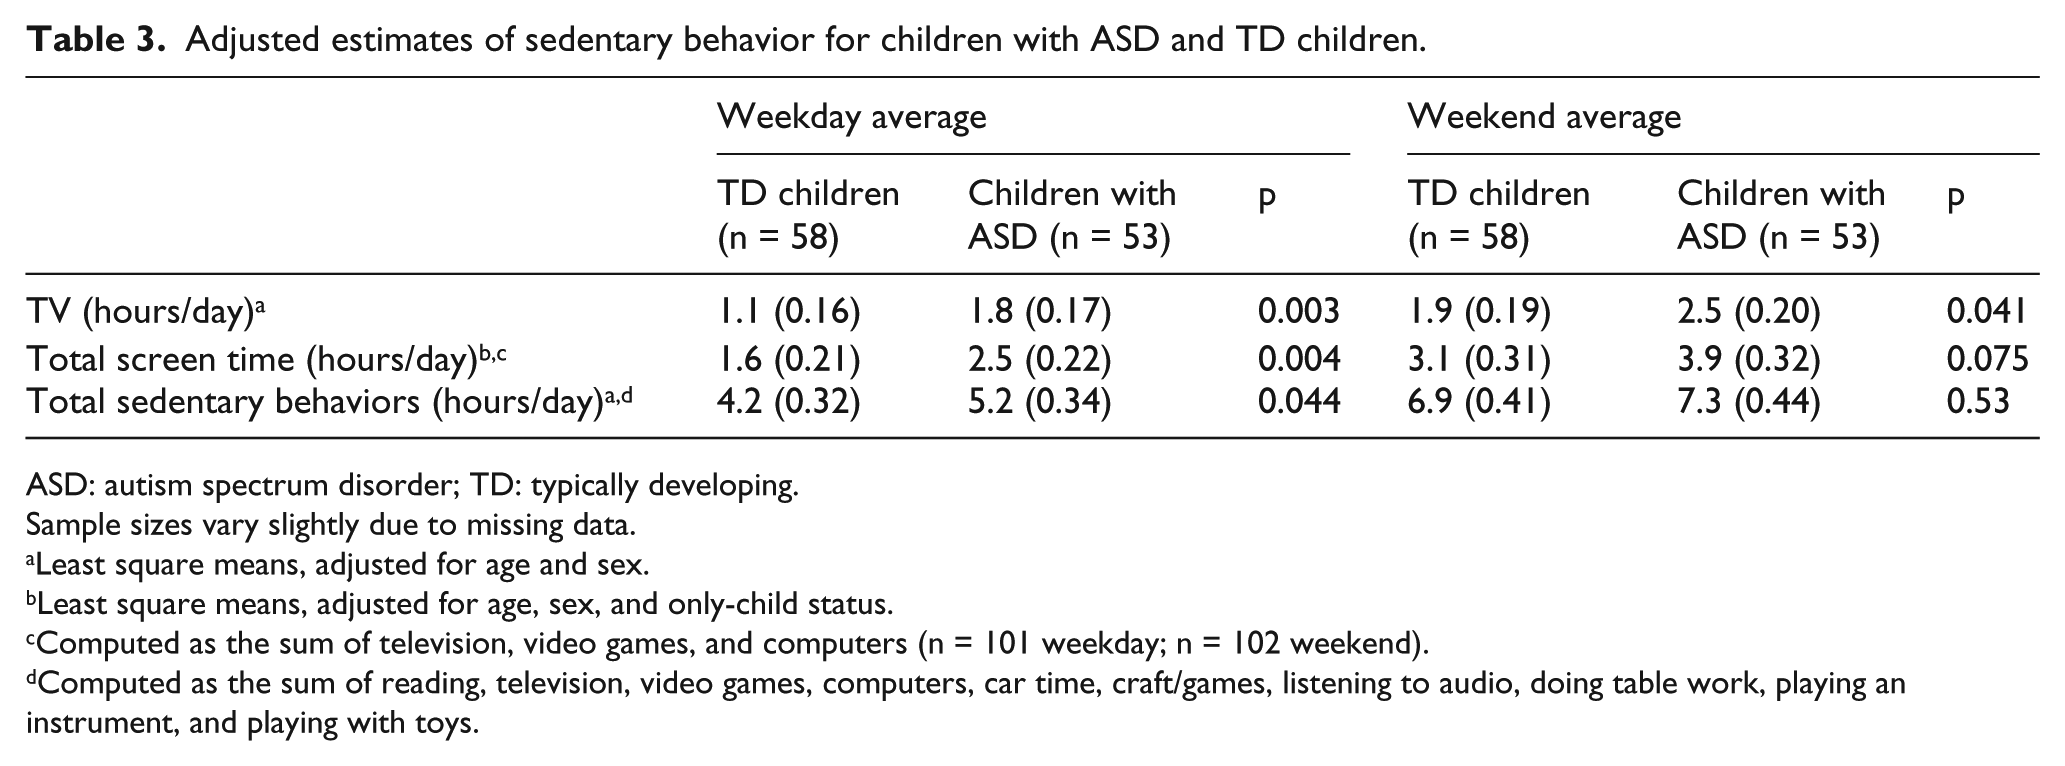
ASD: autism spectrum disorder; TD: typically developing.
Sample sizes vary slightly due to missing data.
Least square means, adjusted for age and sex.
Least square means, adjusted for age, sex, and only-child status.
Computed as the sum of television, video games, and computers (n = 101 weekday; n = 102 weekend).
Computed as the sum of reading, television, video games, computers, car time, craft/games, listening to audio, doing table work, playing an instrument, and playing with toys.
We examined the relationship between BMI z-score and television time, total screen time, and total sedentary time separately for weekdays and weekend days (stratified by group). On weekdays, there were no statistically significant correlations between these measures of sedentary behavior and BMI z-score in either group. On weekend days, however, we observed statistically significant correlations between BMI z-score and TV time (r = 0.35, p = 0.01), total screen time (r = 0.42, p = 0.003), and total sedentary time (r = 0.39, p = 0.005) among children with ASD only.
In linear regression models predicting BMI z-score from aggregate measures of sedentary behavior (stratified by group status), among children with ASD after adjustment for age and sex, we observed a statistically significant relationship between weekend total screen time (β (standard error (SE)) = 0.18 (0.06), p = 0.009) and weekend total sedentary time (β (SE) = 0.13 (0.05), p = 0.008) (Table 4). No significant relationship was observed after adjustment for age and sex, between the aggregate measures of sedentary behavior and BMI z-score among TD children. Estimates from these regression models indicate that among these children with ASD, higher total screen time on weekends was associated with higher BMI z-score—each hour of total daily screen time was associated with an increase in BMI z-score of 0.18 units on average. Similarly, each hour of total sedentary behaviour on weekends was associated with an increase of 0.13 BMI z-score units on average.
Results from linear regression analyses predicting BMI z-score from total screen time and total sedentary time, stratified by group. a
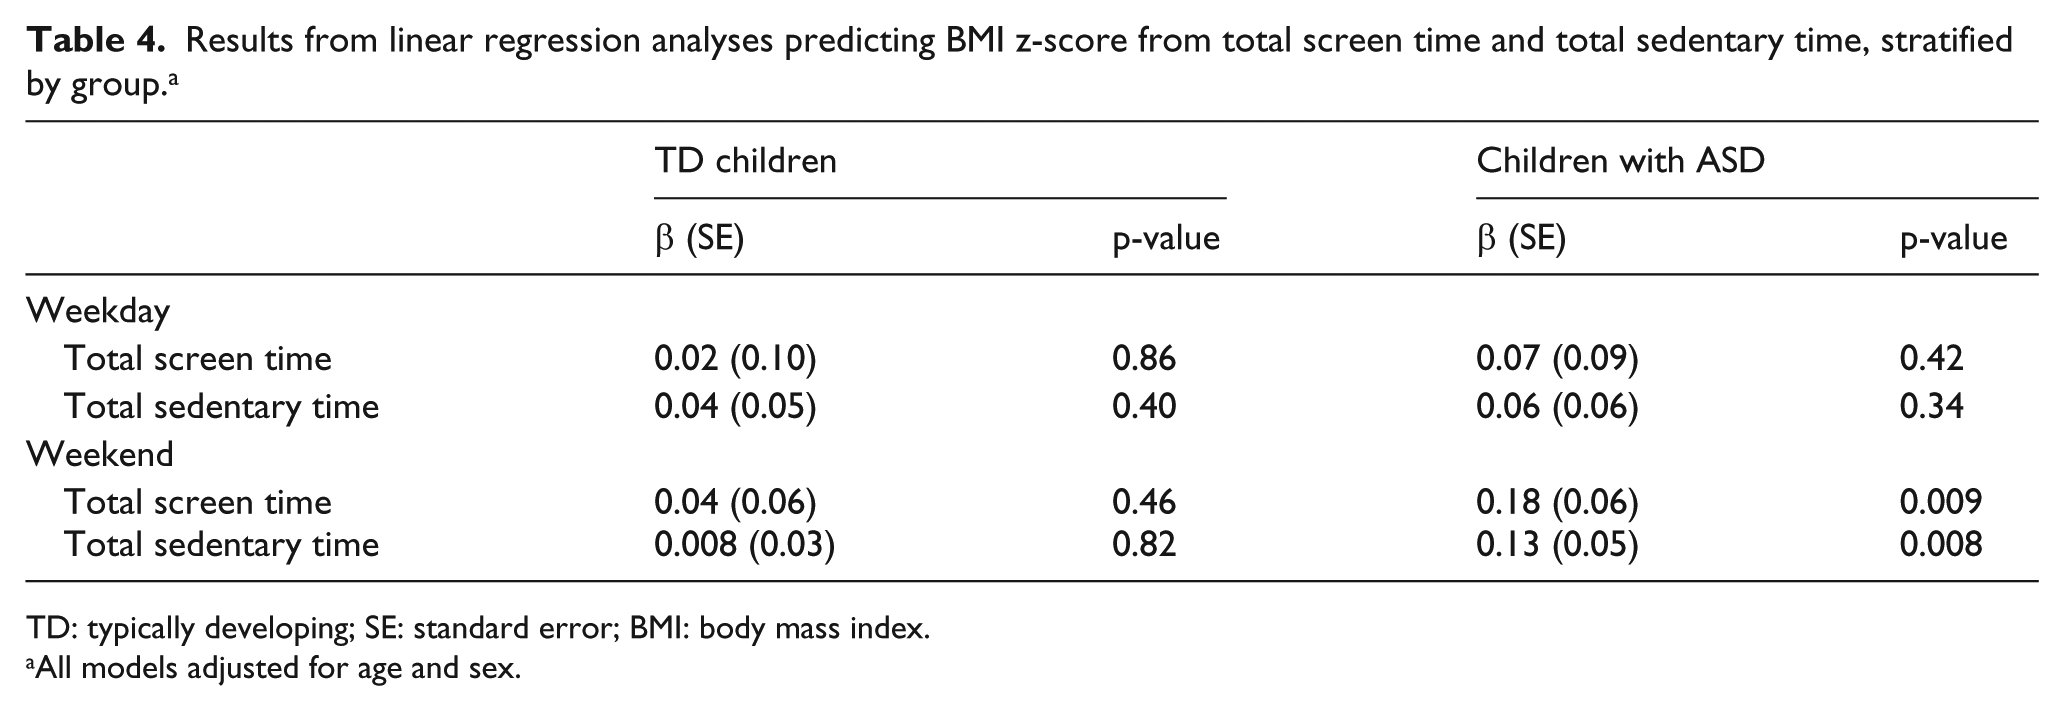
TD: typically developing; SE: standard error; BMI: body mass index.
All models adjusted for age and sex.
The number of hours spent in physical activity per year was not significantly correlated to either total screen time or total sedentary behavior among TD children. In children with ASD, physical activity hours per year was inversely correlated with both weekday total screen time (r = −0.39, p = 0.006) and weekday total sedentary behavior (r = −0.29, p = 0.04). When this physical activity variable was included in models predicting BMI z-score from total screen time or total sedentary behavior, effect sizes were unchanged.
Discussion
We hypothesized that children with ASD would spend more time in sedentary behavior than TD children. This hypothesis was supported for several of the sedentary behaviors assessed. Television viewing time, computer time, and total screen time were significantly higher in children with ASD compared to TD children on both weekdays and weekends. A significant, but modest, association between BMI z-score and total weekend sedentary behavior and screen time was identified in children with ASD only. Although the temporal association is not established, our cross-sectional results would suggest for a child at the 50th percentile BMI (median), an additional hour of weekend screen time would put that child at the 57th percentile, and an additional 3 h at the 71st percentile.
Our study adds to the few published studies that characterize patterns of sedentary behavior specifically in children with ASD. Our findings of higher television and screen time among children with ASD compared to TD children are in agreement with a few other studies conducted in this population, although the magnitude of the difference between the groups differs among studies. A Thai study of children with ASD and TD children found that children with ASD watched more than twice as much television compared to TD children and were less likely to watch television with caregivers (Chonchaiya et al., 2011). In a US study of parents of children aged 2–11 years with ASD and TD peers reported in abstract form only, May et al. (2010) found that children with ASD watched 3.8 h of television daily compared to 3.1 h in TD peers. They also found that school day television viewing was greater among subjects with ASD (May et al., 2010). Using nationally representative data from the National Longitudinal Transition Study-2 (NLTS-2), Mazurek et al. (2011) found a higher prevalence of what they describe as “solitary screen-based media” (i.e. television and video games) and a lower prevalence of “socially interactive media” (i.e. email or chat room participation) among youth with ASD compared to children with other disabilities. About two-thirds of youth with ASD were reported to spend “most of his/her time when not working or going to school” using nonsocial media (TV, videos, and electronic or computer games) and approximately 40% spent most of their free time playing video games. Interestingly, none of the variables considered as covariates (age, gender, race, income, family status, conversation ability, social competence, and functional cognitive skills) were significantly related to high levels of TV viewing during “free time.” Based on repeated time use diaries completed by mothers of adolescents with ASD, Orsmond and Kuo (2011) found that watching television was the discretionary activity most frequently reported. Adolescents with ASD spent an average of 2.3 h watching television and 1.7 h using a computer (Orsmond and Kuo, 2011). The estimates of television viewing in the studies described above are somewhat higher than those found in our study, but these differences may be related to differences in age, region, or other sample characteristics. The children in the Thai study were significantly younger than the children enrolled in our study, whereas the participants in the study by Orsmond et al. were substantially older. The data from the NLTS-2 are nationally representative but cannot be compared directly with our results, as the participants were adolescents and an estimate of actual number of minutes spent viewing television was not reported.
The lack of gender differences in screen time in our analysis is in contrast to other studies of TD children; however, such differences appear to be most evident in studies of older TD children. In a previous publication based on nationally representative data from 4- to 11-year-old children in NHANES, gender differences in screen time were more pronounced among the 9- to 11-year-old children (Anderson et al., 2008). Furthermore, the predominance of boys among children with ASD and in our study, which was frequency-matched on gender between the two groups, may have precluded our ability to detect any gender differences.
We observed a significant relationship between BMI z-score and both total screen time on weekends and total sedentary time on weekends among children with ASD. No significant relationship between BMI z-score and sedentary behavior was observed among TD children on weekdays or weekend days. Previous research has found that children with ASD are as likely or more likely to be obese than TD children; in the nationally representative National Survey of Children’s Health, the prevalence of obesity was 30.4% in children with autism compared to 23.6% of children without autism (p = .075) (Curtin et al., 2010). In the current convenience sample, 17% (n = 9) of children with ASD were classified as obese (BMI >95th percentile) and 9% (n = 5) of TD children were classified as obese (p = 0.19).
Although sedentary behavior has been associated with weight status in many studies in TD children that have examined this association (Must and Tybor, 2005), the positive relationship may be influenced by level of physical activity. In one recent study, the relationship between obesity and sedentary behavior was extinguished after controlling for moderate-to-vigorous physical activity (MVPA) (Mitchell et al., 2009). In our analysis, the inclusion of physical activity did not modify our findings. Scant data exist to evaluate this relationship among children with ASD. The presence of a relationship of sedentary behavior with BMI z-score only on weekend days among children with ASD may reflect more “obesogenic” weekend family time use patterns in families with a child with ASD, with either lower levels of overall energy expenditure or snacking accompanying sedentary activities, or both. Given that increased energy intake and displaced time for other physical activity have been demonstrated correlates of screen use in some studies (Jordan and Robinson, 2008), these may be more likely to manifest as part of weekend family routines. The qualitative focus group findings that families of a child with ASD often used television and video games to manage their child (Nally et al., 2000) lend support to this notion. This area would benefit from additional in-depth qualitative study.
Several limitations in this study are noteworthy. Our assessment of reported sedentary behavior for both children with ASD and TD children was via parent report, which may be subject to recall bias and/or reporting error. However, our reliability studies, conducted on a subset of 44 participants, found high correlations between time spent in sedentary behaviors gathered a few weeks apart. Given that the questions querying sedentary behavior asked about the previous month and the reliability questionnaires were administered 10–30 days after the initial survey, the high correlations observed lend support to the idea that screen time behaviors tend to be habitual. We did not collect information about attendance in school, summer camp, or day-care. A total of 13% of subjects were seen during the summer months, when activity patterns may be different than during the school year. Roughly equal numbers of children with ASD and TD were studied over the summer months (6 and 8, respectively), however. With respect to the association between sedentary time and BMI z-score, the cross-sectional nature of the study precludes the temporal separation of exposure and outcome. The age range of the population was large; it is possible that a sample restricted to older children would have shown greater contrasts and higher levels of video and computer use. Furthermore, the variability in season along with the wide age range may have contributed to the different findings on weekend and weekdays. Some of the 3-year-olds may not have been in school, while some of the children with ASD may have attended summer school programs. It is also worth noting that the study was conducted before the widespread use of tablet computers, such as the iPad®; it is not known if uptake of this new technology would differ by autism status. With respect to our analyses of sedentary behavior and BMI z-score, we acknowledge that cross-sectional data are poorly suited to establish temporal relationships, and it is possible that children with higher relative weights have higher levels of total screen or sedentary time because they are more attracted to sedentary activities, less comfortable engaging in physical activity, or more socially isolated. Retrospective or prospective cohort studies are needed to provide evidence of causal pathways (Must and Tybor, 2005). Finally, despite our efforts to recruit a sample with socioeconomic and racial/ethnic diversity, the final sample was predominantly White and well-educated, which may limit generalizability.
Among the study’s strengths are confirmation of the ASD diagnosis through neurodevelopmental testing, utilization of a control group, a moderate study size, reliability testing of the parent/guardian report, and statistical control for a large number of potentially confounding variables. Furthermore, although the age range of the study was large, we frequency-matched the two study groups by age and sex.
In summary, we found differences of about 1 h in daily time spent in sedentary behaviors, especially time spent viewing television and working on a computer between children with ASD and TD children, in our convenience sample of 3- to 11-year-old children. We also found evidence of a positive association between weekend sedentary behavior and BMI z-score, a measure of weight status, in children with ASD. Given that time in sedentary behaviors, especially screen time, increases with age, the association with BMI z-score may become stronger later in childhood. Acknowledging that their particular affinity for nonsocial electronic media may also have real benefits for the cognitive, behavioral, and social development of children with ASD, a better understanding of potential health consequences is needed. Future studies of sedentary behavior in samples of older children with ASD, which employ a longitudinal design, are needed to better elucidate these relationships and establish its role in changes in weight status.
Footnotes
Funding
This research received no specific grant from any funding agency in the public, commercial, or not-for-profit sectors. This research was supported by National Institutes of Health Grants HD048989, HD041473, and NIHDK046200.