
Abstract
Although still a matter of some debate, there is a growing body of research supporting Early and Intensive Behavioral Intervention as the intervention of choice for children with autism. Learning rate is an alternative to change in standard scores as an outcome measure in studies of early intervention. Learning rates can be displayed graphically as developmental trajectories, which are easy to understand and avoid some of the counter-intuitive properties of changes in standard scores. The data used in this analysis were from 453 children with autism, previously described by Eldevik et al. Children receiving Early and Intensive Behavioral Intervention exhibited significantly steeper developmental trajectories than children in the control group, in both intelligence and adaptive behaviors. However, there was a considerable variability in individual learning rates within the group receiving Early and Intensive Behavioral Intervention. This variability could partly be explained by the intensity of the treatment, partly by children’s intake intelligence quotient age-equivalents. Age at intake did not co-vary with learning rate.
Keywords
Early and Intensive Behavioral Intervention (EIBI) is a comprehensive treatment based on applied behavior analysis (ABA) for children with developmental disabilities including autism. It is comprehensive in that it targets all behavioral deficits and excesses displayed by a particular child. Although there is some diversity in how EIBI is delivered, both in terms of treatment settings and how it is described in different treatment manuals, it has some common core elements (Green et al., 2002): The intervention is individualized and comprehensive. A number of different ABA principles and procedures are used to build new behavioral repertoires and to reduce maladaptive behaviors (e.g. differential reinforcement, prompting, discrete-trial teaching, natural environment teaching, incidental teaching, task analysis, modeling procedures, stimulus control techniques). Professionals with advanced training in ABA and EIBI supervise the intervention. Typical development guides treatment goals. Parents are included in treatment delivery as co-therapists. Treatment proceeds from one-to-one instruction to group instruction according to the progress of the individual child. Treatment typically starts at home and is subsequently carried out in preschools, kindergartens, or schools or treatment starts in schools and is subsequently introduced at home. Treatment starts early in the child’s life (preferably before the child is 4 years old); it is intensive (20–30 h per week) and long term (typically more than 2 years). A more thorough description of EIBI can be found in Klintwall and Eikeseth (2013).
Several outcome studies have investigated the effectiveness of EIBI for children with autism. The findings have generally been positive, with a recent review concluding that four meta-analyses have found a positive effect of EIBI compared to control conditions (Reichow, 2011). For instance, Eldevik et al. (2009) analyzed results from nine outcome studies and found a Hedge’s g effect size of 1.10 for intelligence quotient (IQ) and 0.66 for adaptive behaviors. Several authors have concluded that EIBI is evidence based (Eikeseth, 2009; Eldevik et al., 2009; Rogers and Vismara, 2008), and a recent Cochrane report supports this (Reichow et al., 2012). However, the individual variation in outcome is considerable, with some children showing large gains, and others only modest or no gains. Several variables have been suggested to explain this variability, such as age at intake (e.g. Harris and Handleman, 2000), intellectual functioning and adaptive functioning at intake (e.g. Ben-Itzchak and Zachor, 2007), and treatment intensity (e.g. Granpeesheh et al., 2009).
Outcome research has focused mainly on change in standard scores, usually in tests of intellectual (IQ) and/or adaptive functioning (such as the Vineland Adaptive Behavior Scales (VABS); Sparrow et al., 2005). Standard scores constitute the raw scores from a test, compared to the results of peers with the same chronological age (CA), and are thus a figure expressing the child’s functioning relative to those of age-matched peers. A score of 100 is defined as the mean, with a standard deviation (SD) of 15. Normal functioning is often defined, broadly, as a score within two SDs from the mean (i.e. 70–130), a range which by definition includes 96% of all individuals (Colangelo and Davis, 2002).
An alternative to standard scores is age-equivalents, which is the age for which that level of functioning—or raw score—would be typical. For instance, an individual who is just starting to use two-word sentences has, roughly, a language age-equivalent of 2 years, regardless of CA. For results on IQ tests, age-equivalents may be referred to as the child’s mental age (MA). In the early tests of intelligence developed at the beginning of the 20th century, IQ was computed by dividing the child MA with CA and then multiplying with 100 (IQ = MA/CA × 100) (Colangelo and Davis, 2002). Today, this is often referred to as the ratio IQ. Some of the studies evaluating EIBI have employed ratio scores when no standard scores (norms) are available for a particular child because of very low functioning. A MA is then obtained from the test manual, and a ratio score is calculated.
Age-equivalents can be used to calculate learn rate, which can then be graphed as a developmental trajectory. Learn rate is the change in age-equivalents over a defined period of time. For example, a perfectly typical child develops, by definition, one age-equivalent-year for every chronological year. This gives a learn rate of 1.00 (12 months/12 months = 1). A child who increases his or her age-equivalent by only 6 months during 1 year has exhibited a learn rate of 0.50 (6/12 = 0.5). Learn rates can be used to compare outcomes even when children have received intervention for different lengths of time. An identical measure, called the Intervention Efficiency Index, has been suggested before by Bagnato and Neisworth (1980).
A child who does not acquire any new measurable skills will have a learn rate of 0.00. This can be contrasted with standard scores, for which lack of progress (or slow progress) will turn out as a decrease in scores. This is because with standard scores, higher CA means that the child will be compared to older children, and the criteria for obtaining the same score will be higher. This leads to the counter-intuitive phenomenon that children who learn slowly will obtain progressively lower standard scores, which may be misinterpreted as regression. This apparent regression will be larger for younger children, as typically developing children increase their raw scores faster at younger ages. This problem does not arise with learn rates, which may make it more suitable for presenting outcome data to parents and decision makers. Also, for parents, professionals, and decision makers not trained in psychological testing and psychometrics, age-equivalents and developmental trajectories may be easier to understand than standard scores. This point has been argued before (e.g. Roos, 2002), although we have not been able to find any research that supports this. Learn rates and developmental trajectories may thus be a useful measure that can be used both for outcome studies and for presenting individual progress for children in treatment (for an example of such a graph, see Eikeseth et al., 2012).
Analyzing outcomes as learn rates has the benefit of using a measure that can be compared intuitively in between individuals. A learn rate of 1.6 (for example, an increase in MA of 16 months during an intervention of 10 months) is actually twice as much as a learn rate of 0.8 (e.g. an increase in MA of 8 months during an intervention of 10 months). Such comparisons cannot be made in any reasonable way with standardized scores: an increase of 20 IQ points is not twice as much as 10 points, only a change in relationship to a norm group.
A disadvantage of standardized scores is that they might mask differences in intervention effectiveness across levels of functioning. For instance, it is possible that an intervention is more efficient for a child functioning at the age-equivalent level of 2 years than for a child functioning at the age-equivalent level of 4 years. Given the right difference in CA between these children they would have the same standard score. Analyzing intake standard score as a predictor of change would hide the fact that the intervention is more efficient for the lower functioning child. However, if one instead analyzed intake age-equivalent scores as a predictor, we could be able to detect this relationship.
One should be cautioned, however, against assuming that two children on the same level of age-equivalents are functioning identically. No measure captures the whole repertoire of behaviors. One obvious example is that an age-equivalent is based on a number of subtests or subscales, so that two children with the same full-scale age-equivalent can have completely different profiles across the scores that make up the full-scale score (Maloney and Larrivee, 2007). Also, the children might have reached the same level by following different developmental pathways. Even more importantly, one must remember not to think of a learn rate as a causal explanation of the change, but a description of it. This, of course, does not differ from the use of IQ scores or scores of adaptive functioning. Such scores are always descriptive and never causal (Borsboom et al., 2003). It would seem less likely that laypeople or psychologists would interpret changes in learn rates as a change in a latent trait, as compared to changes in standard scores in IQ. Thus, it fits well with a behavioral perspective on developmental delays. However, as with reporting test scores in general there are problems with age-equivalents which need to be carefully considered when using them as an outcome measure (for a critical discussion of age-equivalents, see Maloney and Larrivee, 2007).
Several authors have argued that autism is best understood in terms of deviant development rather than as a static entity or disease (Chevallier et al., 2012; Dawson, 2008; Karmiloff-Smith, 1998). In other words, autism can be seen as an emergent behavioral disorder, or more precisely, as acquiring social and communicative skills at a very slow rate (Kiaei and Pelaez, 2011). Developmental trajectories (rather than change in standard or ratio scores) might be a useful way to conceptualize this. For example, developmental trajectories have been used to show that children with autism do indeed acquire adaptive behaviors but at a slower rate than most children (Baghdadli et al., 2012; Landa et al., 2012).
To summarize, age-equivalents and developmental trajectories have several benefits as compared to standard scores and changes in them. First, it avoids the counter-intuitive effects of children with no development receiving a negative change in scores. Second, it makes it possible to compare children functioning at a similar level regardless of their age. Third, children with differing durations of treatment can be compared. Fourth, it may be easier to communicate results to parents and researchers outside the field. Fifth, focus may shift from changing some latent trait (such as IQ) to increasing the rate at which these children learn.
The purpose of the present analysis was twofold: First, to compare developmental trajectories for children receiving EIBI with children in a control group, and second, to investigate whether the developmental trajectories for children in EIBI could be predicted by age-equivalents at intake and also with variables often assumed to predict change, such as age at intake and the intensity of intervention.
Methods
Study selection
Data for the children included in the present analysis have been published previously in a meta-analysis of individual participant data (Eldevik et al., 2010). Eldevik et al. (2010) identified 16 group outcome studies investigating behavioral interventions for children with autism spectrum disorders (ASD) or pervasive developmental disorder–not otherwise specified (PDD-NOS) and obtained individual participant data from the authors of those studies (Anderson et al., 1987; Ben-Itzchak and Zachor, 2007; Birnbrauer and Leach, 1993; Cohen et al., 2006; Eikeseth et al., 2002, 2006; Harris and Handleman, 2000; Hayward et al., 2009; Howard et al., 2005; Lovaas, 1987; Remington et al., 2007; Sallows and Graupner, 2005; Smith et al., 1997, 2000a, 2000b; Weiss, 1999). Some of these studies include a group receiving another specified form of intervention of similar intensity (a comparison group), and some of the studies had a control group receiving an unspecified (or unknown) intervention. As there were no significant differences in outcome between the control group and the comparison groups (Eldevik et al., 2010), we chose to collapse them into one control group for the purpose of this study.
For specific information on selection process and a description of both the EIBI and control conditions, see Eldevik et al. (2010). Note that included studies do not necessarily fulfill all the criteria of EIBI listed above (i.e. Green et al., 2002). For instance, some studies included children older than 4 years (e.g. Eikeseth et al., 2002), described interventions with intensity lower than 20 h per week (e.g. Eldevik et al., 2006), and shorter intervention durations than 2 years (e.g. Howard et al., 2005).
Selection of participants
From the database used in Eldevik et al. (2010), children with an intake age of 5 years or younger were selected for the present analysis. This ensured that the EIBI and control group were similar at intake (when including all children, the EIBI group was significantly older than the comparison group. All statistical analyses were also carried out with the full sample, with no significant differences in the results). When calculating learn rates of IQ, only children with both intake and follow-up data in IQ were selected. This resulted in 295 children receiving EIBI and 135 children in the control condition. When calculating learn rates in adaptive behaviors, only children with VABS intake and follow-up data were selected. This resulted in 284 children receiving EIBI and 112 children in the control condition. Note that most but not all children were included in both analyses. For prediction of individual learn rates, all children receiving EIBI and for whom IQ, VABS and treatment intensity data was available were included in the analysis. This resulted in 244 children. Intake characteristics for these groups are presented in Table 1.
Mean intake IQ and mean intake adaptive behavior scores for EIBI and control group across different sample selections.
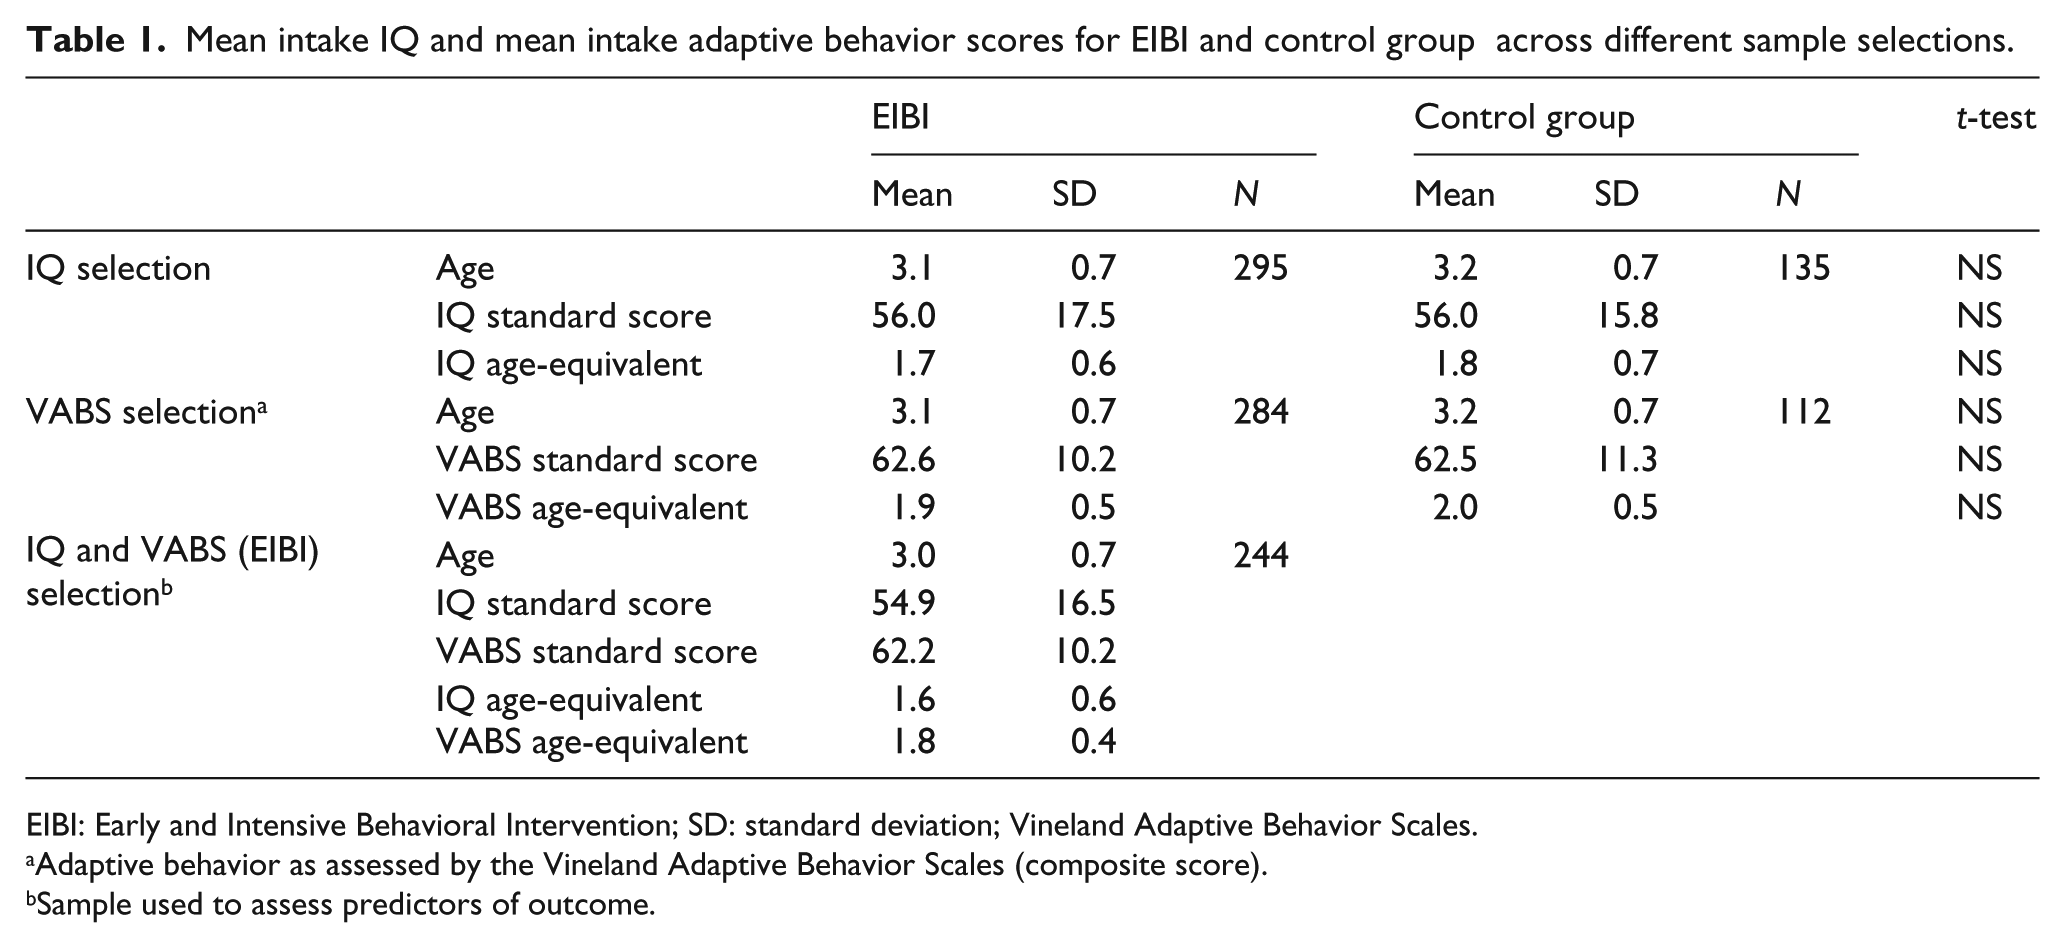
EIBI: Early and Intensive Behavioral Intervention; SD: standard deviation; Vineland Adaptive Behavior Scales.
Adaptive behavior as assessed by the Vineland Adaptive Behavior Scales (composite score).
Sample used to assess predictors of outcome.
Computing age-equivalents and learn rates
We analyzed data using age-equivalents and changes in them. Age-equivalents were computed using the formula for computing ratio IQ explained above; multiplying the CA with standard score and divided by 100 (in other words, a standard score of 100 yields an age-equivalent which is equal to the CA, whereas a standard score of 70 gives an age-equivalent of 70% than that of the CA). Changes in age-equivalents between intake and follow-up were computed as learn rates: the change in age-equivalents divided by the duration of the intervention (identical to the Intervention Efficiency Index (Bagnato and Neisworth, 1980)). This can also be thought of as the slope of the developmental trajectory.
Statistical analysis
Independent t-tests were conducted to assess between-group differences in learn rates. Learn rates were also analyzed as Hedge’s g, expressing the difference between EIBI and control groups. Tested predictors of learn rates within the EIBI group were intake age, intake age-equivalents in IQ and VABS, and intensity of treatment. Test of putative predictors was made by a linear regression with all predictors included. To decrease the number of analyses (and the risk for type-I errors), dependent variable in the predictor model was computed as IQ and VABS mean learn rate, henceforth called a combined learn rate.
Results
Learn rates and developmental trajectories
For the children in the EIBI group, mean IQ learn rate was 1.03 (SD = 0.55). For children in the control group, the mean IQ learn rate was 0.59 (SD = 0.48). This difference was significant (t(428) = 7.903: p < 0.001) and yields a Hedge’s g effect size of 0.85 (95% confidence interval: 0.80–0.90). In other words, the EIBI group exhibited 75% faster learn rates than the control group (calculated as difference between groups, divided by the learn rate for the control condition).
For the children in the EIBI group, mean adaptive behavior learn rate was 0.80 (SD = 0.49). For children in the control group, the mean adaptive behavior learn rate was 0.58 (SD = 0.35). This difference was also significant (t(394) = 4.386; p < 0.001) yielding a Hedge’s g effect size of 0.48 (95% confidence interval: 0.44–0.53). In other words, the EIBI group exhibited 38% faster learn rates than the control group.
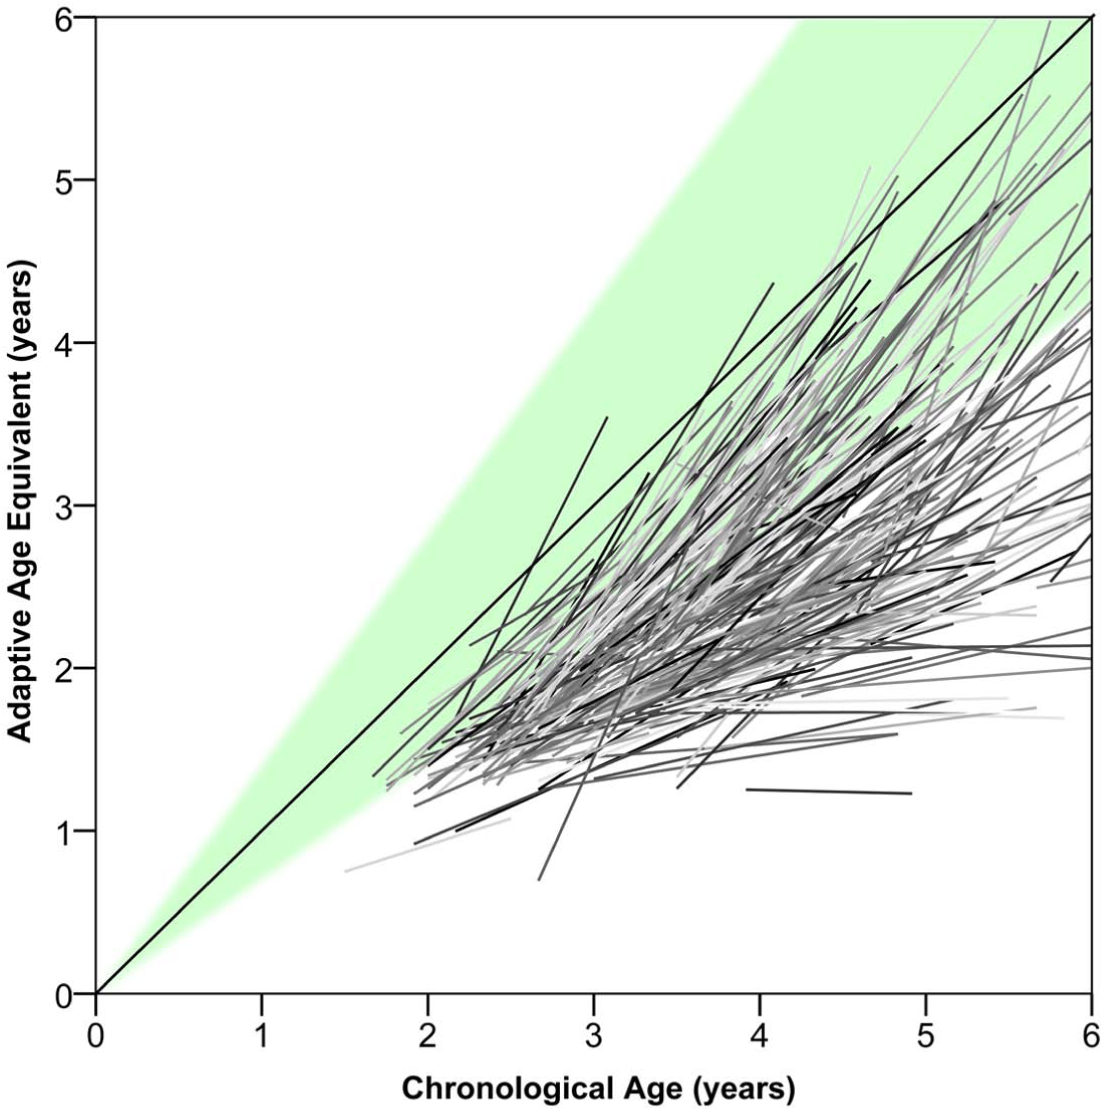
Developmental trajectories for children in EIBI and control conditions are presented in Figures 1 (IQ) and 2 (adaptive behavior). Note that vertical lines in these figures denote one SD, not confidence intervals. The group start positions for the trajectories are mean intake age-equivalents and mean intake age, and the slope constitutes the mean learn rates for the two groups. To illustrate the variability of the developmental trajectories for children receiving EIBI, individual trajectories for IQ and adaptive behavior are presented in Figures 3 and 4, respectively.
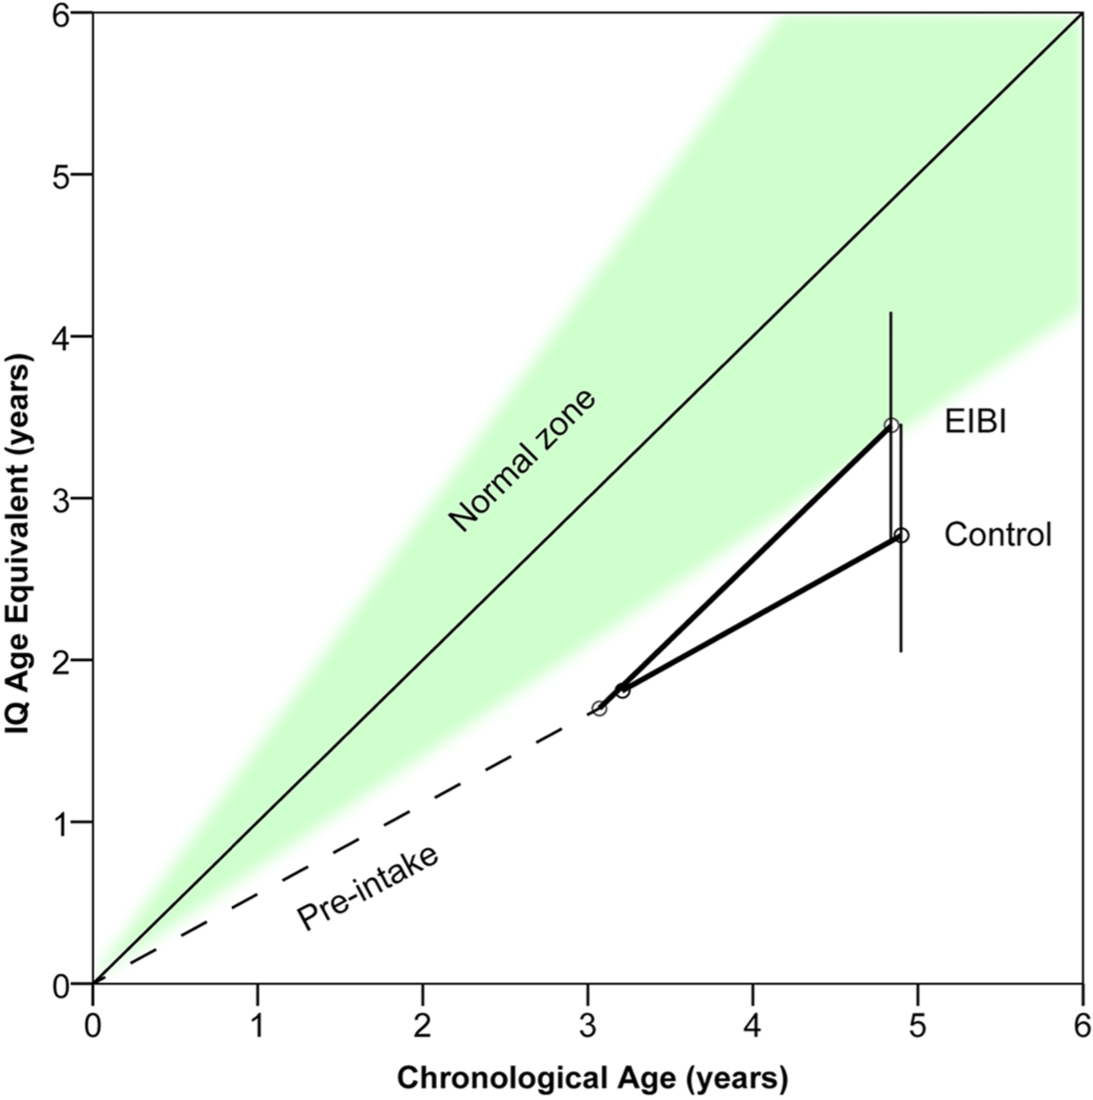
Developmental trajectories in IQ for children with autism who receive EIBI (N = 295) or control treatments (N = 135). Shaded area denotes normal functioning (i.e. standard scores: 70–130). Vertical lines denote one SD around group means.
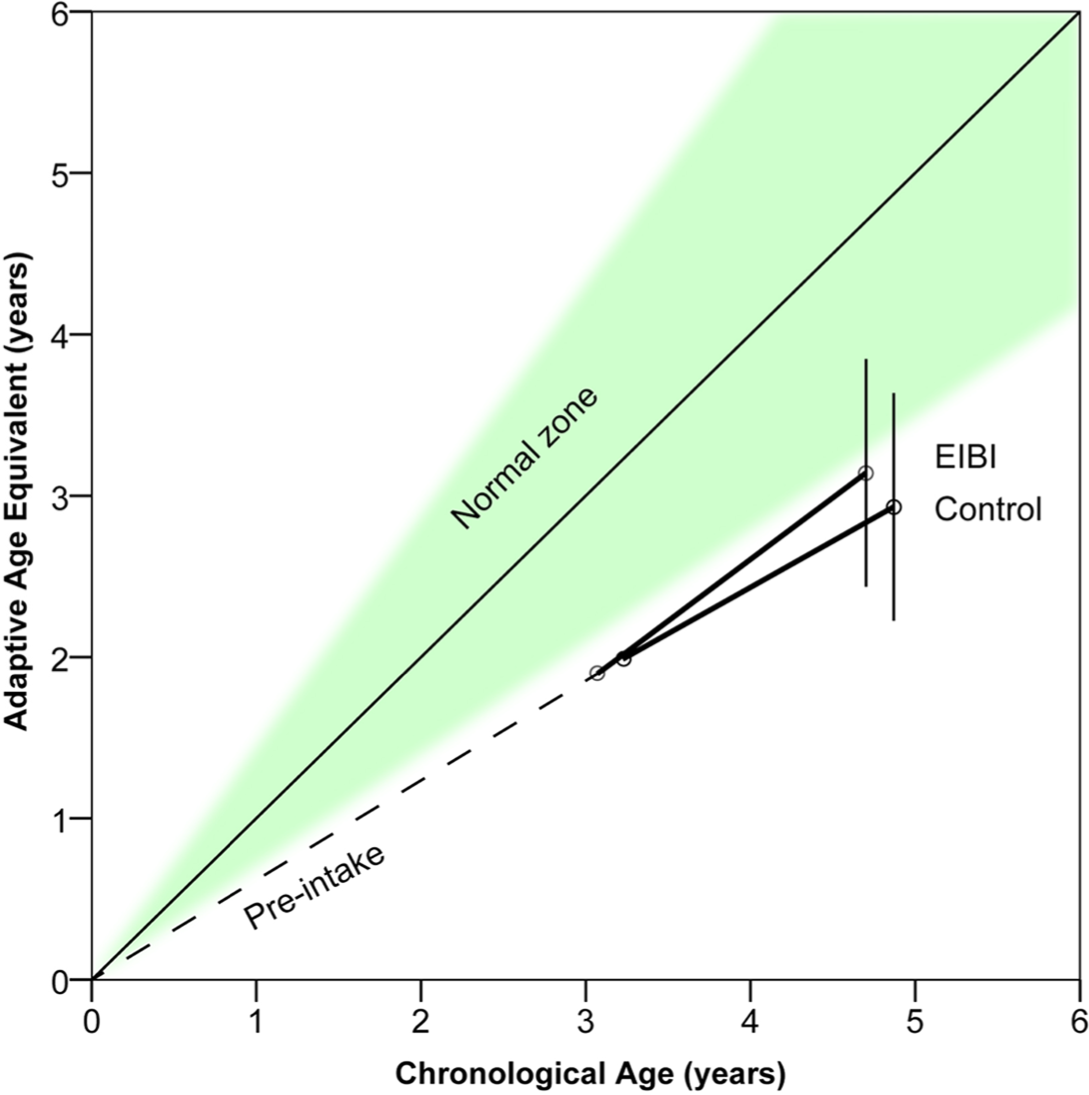
Developmental trajectories in adaptive behavior for children with autism who receive EIBI (N = 284) or control treatments (N = 112). Shaded area denotes normal functioning (standard scores: 70–130). Vertical lines denote one SD around group means.
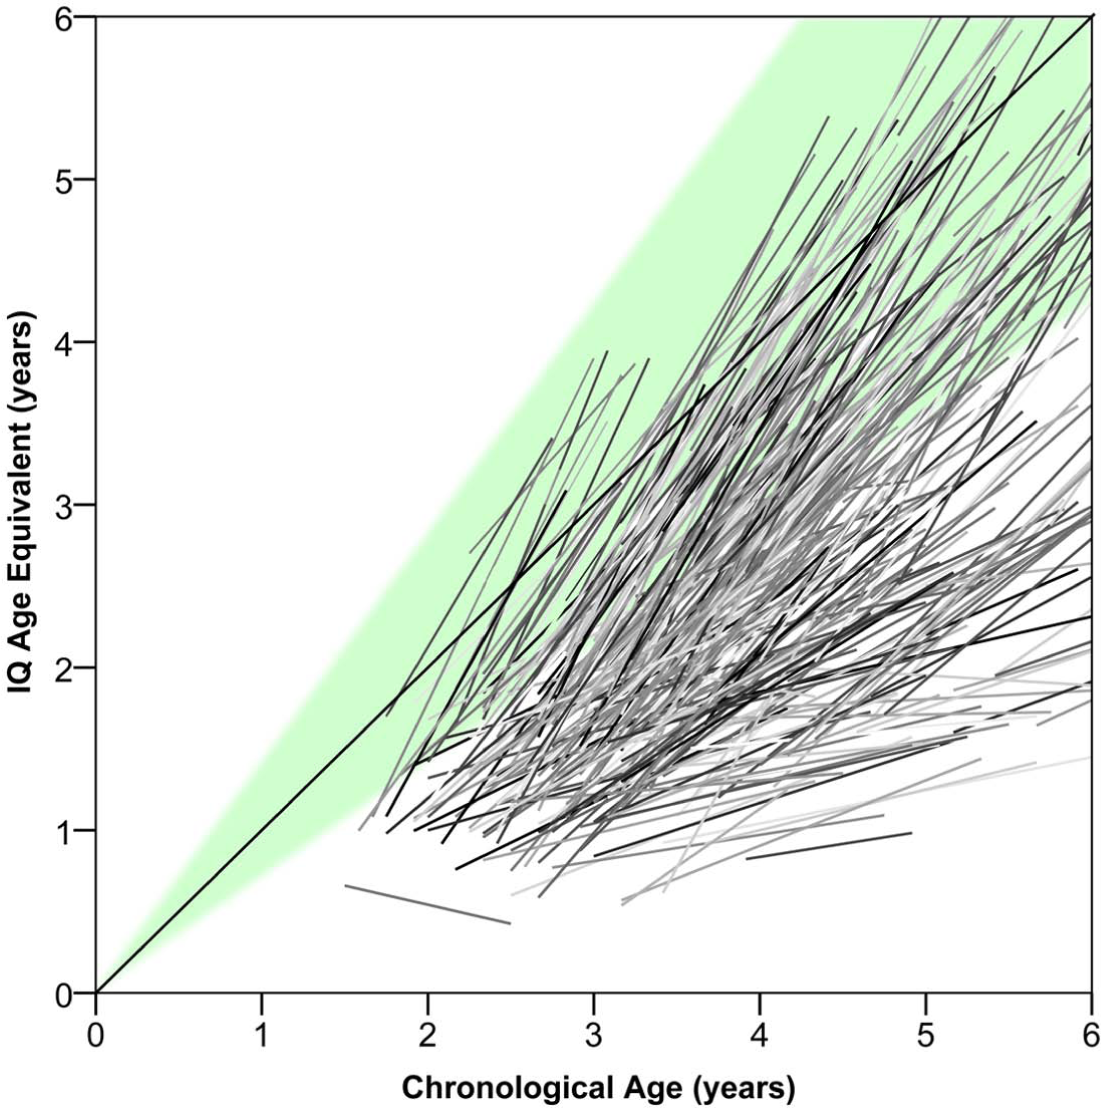
Individual developmental trajectories in IQ for all children with autism who receive EIBI (N = 295). Shaded area denotes normal functioning (standard scores: 70–130). Note the considerable variation in learn rates.
Individual developmental trajectories in adaptive behavior for all children with autism who receive EIBI (N = 284). Shaded area denotes normal functioning (standard scores: 70–130). Note the considerable variation in learn rates.
Predictors of learn rate
The combined learn rate (a mean of learn rates in IQ and adaptive behavior) was predicted by intake age-equivalents in IQ (b = 0.027: p < 0.001) and intensity of treatment (b = 0.014; p < 0.001). The model explained a significant proportion of the variability in treatment outcome (r2 = 0.204). Combined learn rate was predicted neither by age-equivalent in adaptive behavior nor by CA at intake. The results of the model are presented in Table 2.
Prediction of combined (adaptive behavior and IQ) learn rate for children in EIBI.
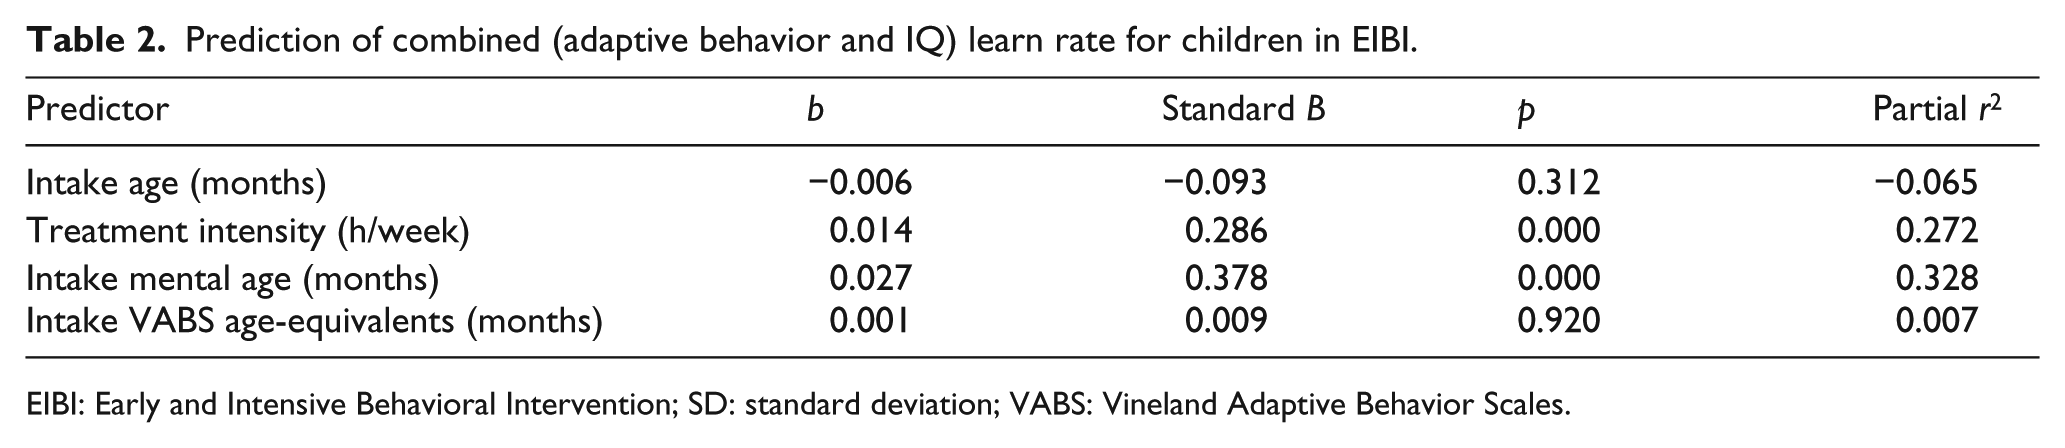
EIBI: Early and Intensive Behavioral Intervention; SD: standard deviation; VABS: Vineland Adaptive Behavior Scales.
As a post hoc analysis, developmental trajectories were graphed with participants split in three groups based on CA: intake age at 2 years (range: 1.5–2.5 years), 3 years (range: 2.5–3.5), and 4 years (range: 3.5–4.5 years; note that this excludes a few participants older than 4.5 years). These trajectories are shown in Figures 5 (for IQ) and 6 (for VABS). An analysis of variance (ANOVA) confirmed that these three groups did not differ significantly in their learn rates, neither in IQ nor in adaptive behavior.
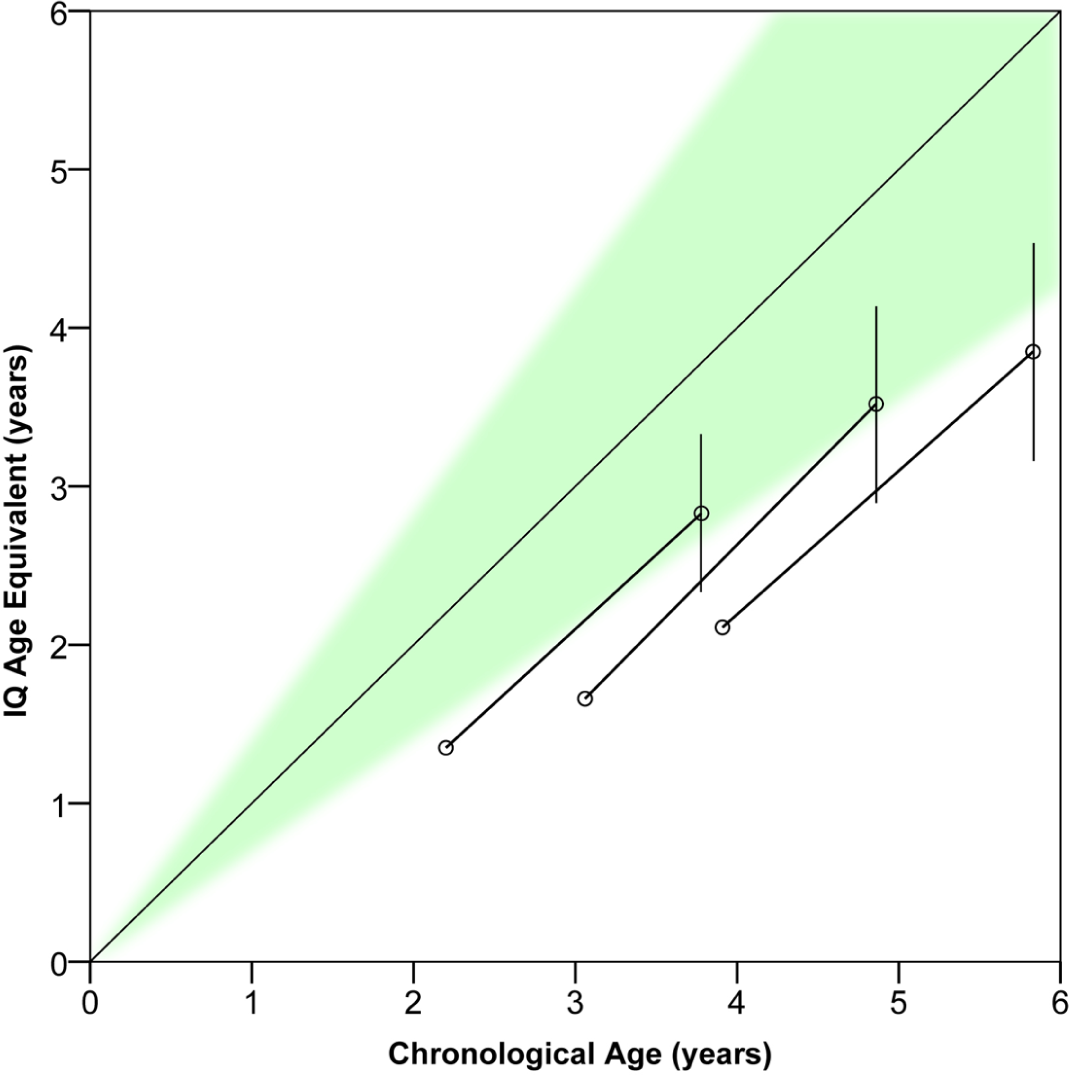
Developmental trajectories in IQ learn rate for children with autism, with the EIBI group split into three intake age groups: start of treatment at 2, 3, or 4 years. Vertical lines denote one standard deviation from group mean. Note that the learning rates are similar in all three groups.
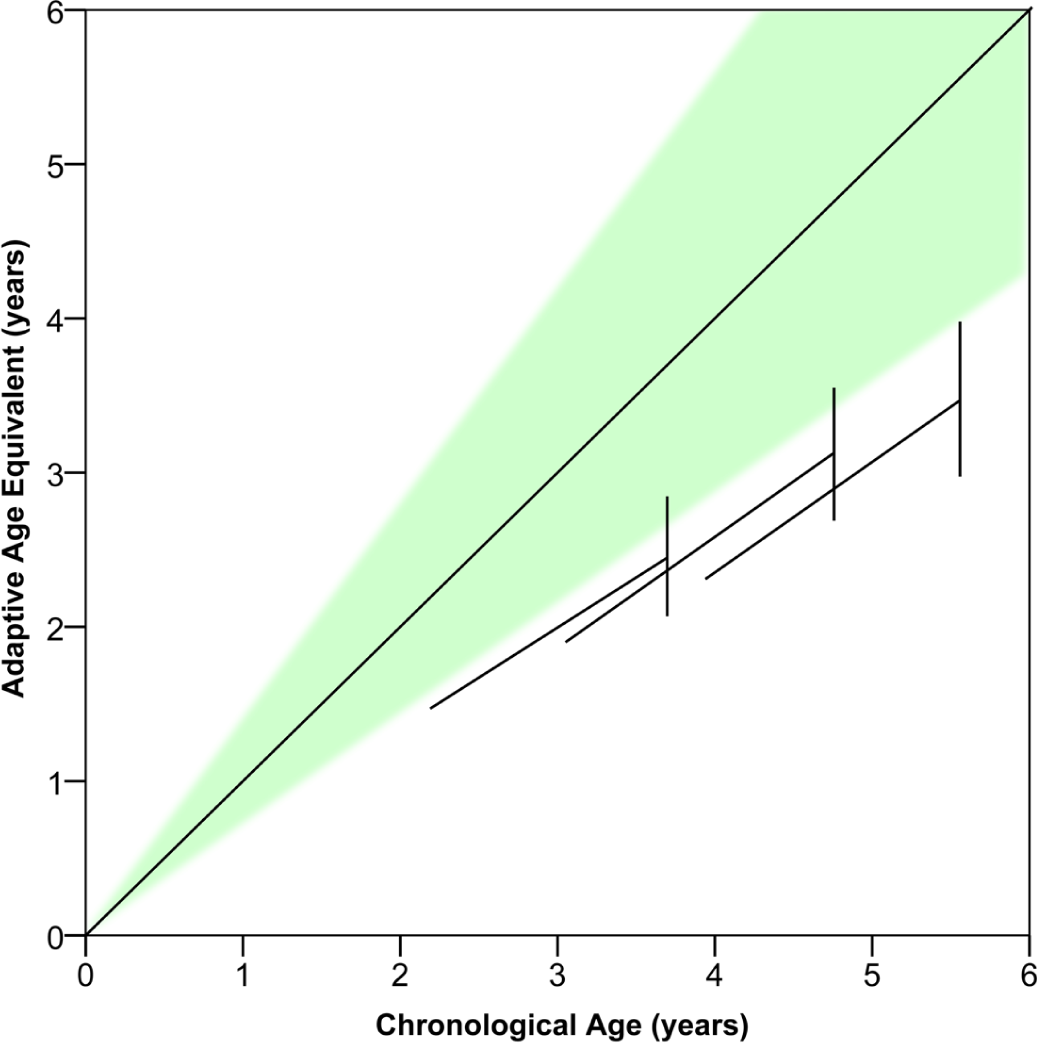
Developmental trajectories in adaptive behavior learn rate for children with autism, with the EIBI group split into three intake age groups: start of treatment at 2, 3, or 4 years. Vertical lines denote one standard deviation from group mean. Note that the learning rates are similar in all three groups.
Discussion
Our analysis shows that EIBI helps children acquire skills faster, thus moving their level of functioning closer to their typically developing peers, narrowing the gap between them. Children in EIBI exhibited significantly faster learn rates, both in IQ (75% faster) and in adaptive behaviors (38% faster), compared to children in a control group. This finding is consistent with previous research using standard scores as the dependent variable (e.g. Eldevik et al., 2010). Note that although the EIBI group acquired new skills at a faster rate, the control group also exhibited progress.
Also in line with previous research is the finding that intervention intensity predicted outcome. For every hour of treatment per week, learn rate increased by 0.014. This has been shown previously with change in standard scores (Eldevik et al., 2010), but this analysis shows that it also holds true for learn rates. A recent study examined developmental trajectories following eclectic treatment and found no relationship between intensity of eclectic treatment and developmental trajectories (Darrou et al., 2010). Similar findings were reported in another recent study, investigating ABA of differing intensities and unspecified quality (Fernell et al., 2011). However, as shown in this study, EIBI appears to yield larger effects (steeper developmental trajectories) the more intensely it is delivered. This can be interpreted as a dose–response relationship between weekly hours of intervention and outcome. In medical research, such relationship is often considered a validation of the intervention, as it indicates a causal relationship in that the type of intervention is important, not only intensity.
The finding that intensity is a predictor should be interpreted with caution. It is a curious fact that treatment intensity has been reported as a predictor for outcome only in aggregated data from several studies, such as in this analysis, but not in individual studies. Possibly, the reason for this is the small variation in intervention intensity in the individual studies combined with relatively small sample sizes. However, there may be other reasons. The studies applying the highest intensities of intervention may systematically differ in quality factors (more supervisor or therapist training, different choice of treatment focus, and so on) or participant characteristics. Indeed, earlier published studies tend to have had higher treatment intensities, which might co-vary with a different selection of children and quality of the intervention. For an expanded and insightful discussion on this phenomenon, called the Simpson’s paradox, see Hsu (1989).
Our analysis also shows that intake IQ age-equivalents predicted individual learn rates, meaning that children with higher intellectual functioning at intake exhibited higher learn rates. For every month of MA the child exhibited at intake, learn rate increased by 0.027. Interestingly, this finding is in contrast to that of Eldevik et al. (2010), who found that intake IQ did not predict change in IQ and adaptive behavior.
Similar to findings in other reviews, CA at intake was not correlated to learn rate. In other words, older children benefited from intervention just as much as younger children, in terms of increasing their level of functioning (illustrated in Figures 5 and 6). However, start of treatment at an earlier age means that the child has not yet had time to lag behind peers as much, thus increasing the chances that intervention might lift the child back into the normal zone of development. Indeed, this raises the possibility that if intervention starts extremely early and with high intensity, this may keep high-risk infants on a typical development trajectory (Dawson, 2008; Steiner et al., 2012). It is not yet known whether early intervention actually can ameliorate the core deficits of autism (such as an innate deficit in social motivation; Dawson, 2008), but as shown in this study, it seems that EIBI helps children with autism acquire key social, communicative, and adaptive behaviors.
The developmental trajectories of children who receive EIBI were variable, both in IQ and in adaptive behaviors. Although some of this variability is likely due to measurement errors, the majority is likely reflective of true variability in the development of the children. This study tested four possible predictors of individual outcome: intake age, age-equivalents in IQ and adaptive behavior, and treatment intensity. However, it would be interesting to assess other putative predictors as well. Those might be either factors in treatment such as the frequency of supervision (Eikeseth et al., 2009) or fidelity of intervention and therapist allegiance to the intervention model (Klintwall et al., 2012). Other child characteristics could also be investigated, such as comorbid somatic disorders, level of social skills, and autism symptoms (Sallows and Graupner, 2005). Also, data from this study were collected from a wide range of studies, likely with variations in what behaviors are targeted for intervention. Some of these target behaviors may be more important than others. Finally, if we had more than two data points for each child it would be possible to detect possible mediators of treatment effects. One such mediator could be the successful establishment of key social stimuli (praise and smiles) as conditioned reinforcers (Dawson et al., 2012a). More fine-grained developmental trajectories, with more than one data point per child, have been investigated and indicated potential subgroups of children (Lord et al., 2012; Ortega et al., 2013).
The results from this study depend on the quality and integrity of the data, obtained from the previously published outcome studies. There has indeed been some indications of publication bias in the outcome studies of EIBI, that is, smaller published studies tend to have greater effect sizes than larger studies (Reichow, 2011). Another problem is biases in data collection, such as when assessments are not blinded (Reichow et al., 2012). This introduces the risk that researchers (and parents) with high allegiance to the treatment influence the results.
Both of the outcome measures used in the present analysis, IQ and Vineland, were originally designed to measure stable traits. The same would be true of other commonly used measures of autism severity, such as the Autism Diagnostic Observation Schedule (ADOS; Lord et al., 2000). These measures are not necessarily sensitive or valid measures of treatment effects. Although changes in these measures indicate robust changes in child behaviors, they may not be ideal for outcome research. Future outcome studies could employ measures designed to assess response to treatment, such as the newly developed autism impact measure (AIM; Kanne et al., 2013) or neurological measurements such as electroencephalography (EEG; Dawson et al., 2012b).
Our results replicate previous findings demonstrating the positive effects of EIBI and the need to provide this intervention with high intensity. Graphical presentation of age-equivalents as treatment outcomes, as exemplified in this study, is potentially easier to understand for parents and researchers outside the field (Roos, 2002). However, whether this is actually the case needs to be investigated. Emphasizing development by the use of developmental trajectories may help put the potential effects of EIBI in a developmental framework. As has been suggested by other authors (McGovern and Sigman, 2004; Seltzer et al., 2004; Szatmari et al., 2000), developmental trajectories might be the key to a more fruitful conceptualization of disorders such as autism, in terms of a better understanding of etiology, prevention, and treatment.
Footnotes
Acknowledgements
Thanks are due to Johanna Ellström and Rolf Sandell for independently and unknowingly suggesting the analysis presented herein.
Funding
This research received no specific grant from any funding agency in the public, commercial, or not-for-profit sectors.