
Abstract
The purpose of this study was to investigate whether the individuals in the general population with high scores on the Autism Spectrum Quotient constituted a single homogeneous group or not. A cohort of university students (n = 4901) was investigated by cluster analysis based on the original five subscales of the Autism Spectrum Quotient. Based on the results of the analysis, the students could be divided into six clusters: the first with low scores on all the five subscales, the second with high scores on only the ‘attention to detail’ subscale, the third and fourth with intermediate scores on all the subscales, the fifth with high scores on four of the five subscales but low scores on the ‘attention to detail’ subscale and the sixth with high scores on all the five subscales. The students with high total Autism Spectrum Quotient scores (n = 166) were divided into two groups: one with high scores on four subscales but low scores on the ‘attention to detail’ subscale and the other with high scores on all the five subscales. The results of this study suggested that individuals from the general population with high Autism Spectrum Quotient scores may consist of two qualitatively different groups.
Introduction
In regard to the symptoms of autism spectrum disorder (ASD), the three domain criteria for pervasive developmental disorders in the Diagnostic and Statistical Manual of Mental Disorders (4th ed.; DSM-IV; American Psychiatric Association (APA), 1994), that is, (1) qualitative impairment in social interaction, (2) qualitative impairments in communication and (3) restricted repetitive and stereotyped patterns of behaviour, interests and activities, have been reorganized into two criteria in Diagnostic and Statistical Manual of Mental Disorders (5th ed.; DSM-5; APA, 2013): (1) deficits in social communication and social interaction and (2) restricted repetitive behaviours (RRBs), interests and activities. However, it has not yet been clarified whether ASD can be explained by a ‘unitary spectrum’ or by a ‘fractionable autism triad’ model (Happé and Ronald, 2008). Based on the results of behavioural genetic studies of monozygotic twins (Ronald et al., 2006a), Happé and Ronald (2008) suggested that the degree of social difficulty, communication impairment and rigid/repetitive behaviours are only modestly related, and Happé and Ronald (2008) suggested that no single unitary account can explain both the social and non-social features of autism.
Autistic disorder, as characterized in DSM-IV, represents the upper extreme of a constellation of deficits in social and communicative behaviour that may be continuously distributed in nature (Constantino et al., 2000; Constantino and Todds, 2003). Kamio et al. (2013a) evaluated the general child population using the Social Responsiveness Scale and pointed out a continuous distribution with no clear differences between cases meeting the diagnostic criteria for ASD and subthreshold cases. Children who were diagnosed as having subthreshold ASD, but had reduced daily life functions, were not rare (Kamio, 2013b). It has also been reported that the same genes are associated with both autistic traits in the general population and cases diagnosed with ASD (Chakrabarti et al., 2009). In recent years, there has been a shift in the conceptualization of the autism spectrum from a categorical model to a dimensional model (Allison et al., 2012). DSM-5 (APA, 2013) includes a description of the severity, which has not been included in previous versions of the DSM.
Palmer et al. (2015) pointed out that, in the cognitive and neuroscientific fields, many of the studies comparing the degree of autistic traits in the general adult population with the aim of elucidating the mechanisms underlying ASD and ASD-like traits have used the Autism Spectrum Quotient (AQ; Baron-Cohen et al., 2001). The AQ is a self-administered questionnaire used to measure autistic traits in young people and adults with normal intelligence. The questionnaire consists of 50 items organized into five subscales. At the cut-off point of 32, the scale has a sensitivity of 79.3% and specificity of 97.7% for the diagnosis of autistic traits, and its test–retest reliability has been confirmed (Baron-Cohen et al., 2001; Hoekstra et al., 2008; Wakabayashi et al., 2006). The AQ has been also reported to be a valid screening test for Asperger’s syndrome (AS) in clinical practice (Woodbury-Smith et al., 2005). Although Cronbach’s alpha values for the AQ are generally high (e.g. 0.734 for our data), some subscale items have low reliability coefficients (Austin, 2005; Kurita and Koyama, 2006; Wakabayashi et al., 2006). In addition, several studies on the factor structure of the AQ have been reported (Austin, 2005; Hoekstra et al., 2008; Hurst et al., 2007a; Kloosterman et al., 2011; Stewart and Austin, 2009), although the reported results are inconsistent. In the review of previous behavioural, genetic, cognitive and neural research, Happé and Ronald (2008) proposed the ‘fractionable autism triad’ hypothesis and pointed out the inconsistent results of previous studies on the factor structure of the AQ.
Ring et al. (2008) performed a cluster analysis of the scores on the AQ obtained from 333 individuals with ASD aged 16–78 years to investigate whether the phenotypic variations observed in ASD can be accounted for by severity or a subgroup model. The results showed that the cases could be divided into two to four clusters based on the severity. They argued that the results supported a ‘unitary spectrum model’.
On the other hand, Palmer et al. (2015) reported the cluster analysis of the scores on the AQ in general adult population (n = 2343). The result showed that the subjects could be divided into two groups: greater social difficulties and lower detail orientation, and lesser social difficulties and greater detail orientation. They also confirmed by a Gaussian mixture (GM) model analysis that the subjects could be divided into two clusters. They argued that the social and detail-orientation characteristics related to ASD do not occur simultaneously in the general adult population and discussed that the results support the fractionable autism triad model rather than the unitary spectrum model. They also discussed that the differences from the results of Ring et al. (2008) could be due to differences between the clinical and non-clinical groups. However, if it were assumed that autistic traits represent a continuous spectrum between the clinical and non-clinical groups, the reasons for the differences between the two studies remain to be clarified.
Therefore, we investigated the cluster analysis method employed by both Palmer et al. (2015) and Ring et al. (2008). Both research groups performed a direct cluster analysis of the responses to the 50 items on the AQ questionnaire. They employed this method because of the inconsistent results obtained from the AQ factor analysis, as described above.
We proceeded with the analysis while comparing the following two methods: (1) cluster analysis was directly applied to the students to the 50 AQ items and (2) cluster analysis was performed of the students to Baron-Cohen’s original five subscales. At first, with the aim of testing, the results of cluster analysis obtained by Palmer et al. (2015) can be reproduced. Therefore, in the general population, (1) we applied GM model clustering to the students to the 50 AQ items and (2) we tested whether the results could also be reproduced by the k-means method using the number of clusters obtained from GM model. Next, we investigated whether the results of Ring et al. (2008) could be reproduced in the group with high AQ scores. In addition, we investigated whether the results of Ring et al. (2008) could be reproduced in the group with high AQ scores. The participants of this study were general population, but on the other hand, the participants of the study of Ring et al. (2008) were clinical cases. Though we may not be able to make a comparison in the strict sense of the word because of the different types of participants between the study of Ring et al. (2008) and this study, the above analyses (1) and (2) were conducted in the group with high AQ scores.
The participants of this study were university students, not clinical cohorts. However, a large number of participants, about 5000, with a very narrow age range, were included in the analysis. Analysis of a large number of data sets provided information on the distribution of the total AQ scores and subscale scores. It was possible to obtain a large number of data for the following reasons. The environment in Japanese universities is very different from the environment in Japanese senior high schools (Kobayashi, 2003), and some students with ASD begin to have problems soon after entering university due to difficulties in class registration, adjustment to the lecture styles and maintenance of the rhythm of life (Sasaki, 2010). Since most students with ASD in Japan today enter universities before being diagnosed as having autism (Nishimura, 2006), we administer the AQ in addition to the physical examination performed at the time of admission to our university in order to make contact with students having autistic traits before any significant problem becomes apparent. Thus, we do not use the AQ as a diagnostic tool, but as a means to establish contact with students having autistic traits and determine whether they are having any problems with adjusting to student life because of having such traits.
Methods
Participants
The study was conducted on 5815 students enrolled in the Faculties of Humanities and Economics, Education, Agriculture, and Science of our University between fiscal years (FY) 2006 and 2011. The participants were the same as the participants of our previous studies (Kitazoe et al., 2014, 2015).
Measures
AQ
The AQ is a self-administered questionnaire that is used to identify autism spectrum–related traits in the absence of intellectual disability in young people and adults (Baron-Cohen et al., 2001). It consists of 50 items organized into five subscales: social skill, attention switching, attention to detail, communication and imagination. Each of the items could draw one of four possible responses: definitely agree, slightly agree, slightly disagree and definitely disagree. In this study, the response to each item was assigned a score of ‘1’ if it was characteristic of ASD, and the score of ‘0’, if it was not characteristic of ASD, just as in the previous studies (Baron-Cohen et al., 2001; Wakabayashi et al., 2004). We used the Japanese version of the AQ translated by Wakabayashi et al. (2004), the validity and reliability of which have been previously confirmed. Wakabayashi et al. (2004) reported that a cut-off score of 33 was useful for discriminating between Japanese individuals with or without ASD, and we used the same cut-off point (Wakabayashi et al., 2004). However, when comparing the results with those of Ring et al. (2008) or Palmer et al. (2015), we used the scoring method employed by them.
Procedures
A written explanation of the purpose and methods of the study and handling of the data obtained was distributed to the students during the student orientation at the time of admission to the university, and responses were obtained from students who agreed to cooperate for the study at the health check-up site.
Approval for the study conducted from 2009 was obtained from the Ethics Committee of Kochi Medical School Hospital (approval numbers: 20-70, 20-89).
The demographic characteristics of the students, including the age, sex and field of study, were recorded during the study. Other questionnaires, namely, the University Personality Inventory (UPI; Matsubara, 1995) and the Japanese version of the Liebowitz Social Anxiety Scale (Asakura et al., 2002; Liebowitz, 1987), were also distributed at the same time.
Statistical analysis
The GM model cluster analysis and the k-means cluster analysis were performed using the R-package mclust and the function k-means in the R-package stats, respectively. The number of clusters was determined using GM model, and k-means clustering was applied with the number of clusters obtained. The theoretical premise of the GM model is different from that of the k-means method, but the GM model has the advantage that Schwarz’s Bayesian Information Criterion (BIC) can be used to determine the number of clusters. On the other hand, the Hartigan rule (Hartigan, 1995) can be used in the k-means method to determine the number of clusters, although these are not yet established, and it has been pointed out that the analysis results are unstable and depend on how the initial values are set and so on (MacQueen, 1967). Therefore, first, the number of clusters was obtained based on the GM model, and the k-means method was applied with the number of clusters obtained by the GM model. Then, we examined whether the cluster structure obtained by the GM model was consistent with the structure obtained by the k-means method. Furthermore, to address the instability of the results of analysis by the k-means method, we used two groups: one in which each group was divided into male and female subgroups, and the other in which each group was randomly divided into two subgroups, for analysis. If the results of these analyses were almost the same, the validity of the analyses can be expected to be higher.
The analytical procedures were as follows. (1) Cluster analysis was directly applied to the students to the 50 AQ items on a 4-point Likert scale by GM model, with the aim of testing whether the results of cluster analysis obtained by Ring et al. (2008) and Palmer et al. (2015) can be reproduced. (2) The responses of all the students were converted into scores according to the original method (Baron-Cohen et al., 2001) (five domains, binary representation). The data were analysed using the GM model, and k-means analysis was performed in gender-specific subgroups and in two randomly divided subgroups using the number of clusters obtained by the GM model. (3) To check whether the results obtained in (2) above were consistent with the results of the factor analysis reported by Palmer et al. (2015), a confirmatory factor analysis was conducted. (4) Students with high AQ scores were analysed using the GM model and the responses to the questionnaire items on a 4-point Likert scale, as in (1). (5) The students with high AQ scores were converted into scores (five domains, binary representation), and k-means analysis was performed, as in (2).
Results
A total of 4901 (84.3%; 2505 males/2396 females) responses were obtained. The mean and ranges for age of the responder students were 18.3 ± 0.93 years (males: 18.3 ± 0.97, females: 18.2 ± 0.88) and 18–45 years, respectively. The mean and ranges for total AQ score were 20.9 ± 6.26 (males: 21.6 ± 6.28; females: 20.2 ± 6.16) and 4–46 years, respectively. The mean total AQ score of the male students was significantly higher than that of the female students (t = 7.47, df = 4900, p < 0.001, Cohen’s d = 0.21). There were 166 students (3.4%; 98 males, 68 females) with total AQ scores of ⩾33, who comprised the high AQ score group.
Results of the GM model analysis of all the data sets (all students to the 50 AQ items)
The GM model analysis of all students to the 50 AQ items provided on a 4-point Likert scale revealed that the optimal number of clusters was 3 (equal volume, shape and orientation (EEE) model) (Figure 1). Figure 2 shows the z scores for the 50 AQ items in the three clusters based on this analysis. Clusters 1 and 3 were almost clearly separated. Cluster 2 was located between Clusters 1 and 3; however, the score on the ‘attention to detail’ subscale (item numbers: 21–30) were higher in Cluster 2 than in Cluster 1.
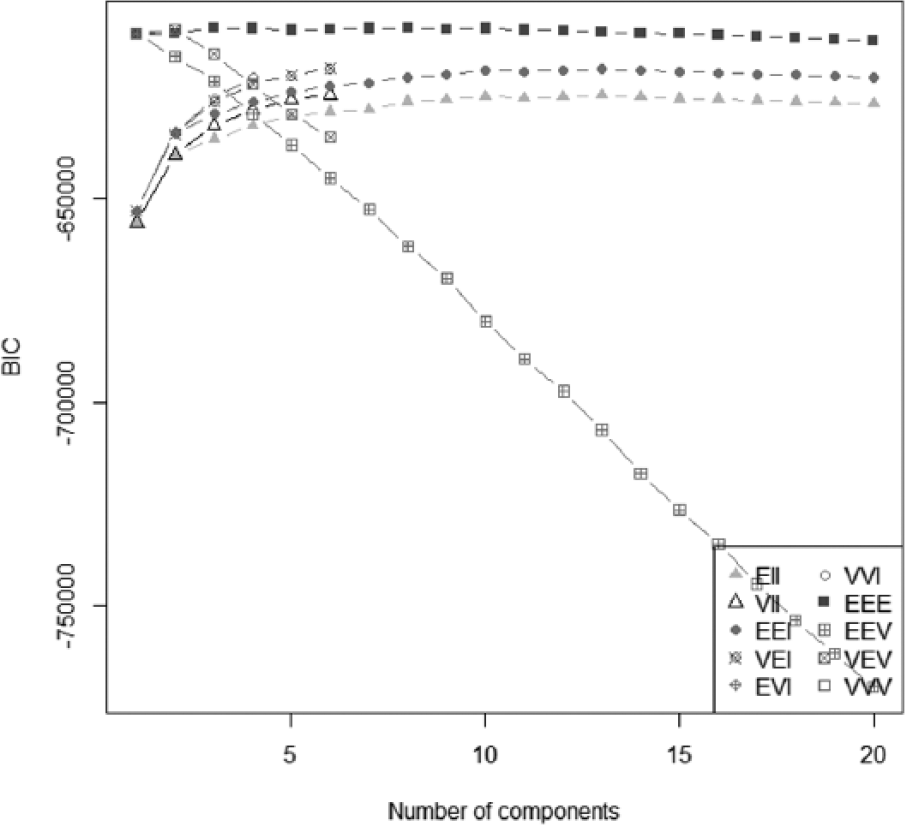
The results of a Gaussian mixture model of all the students.
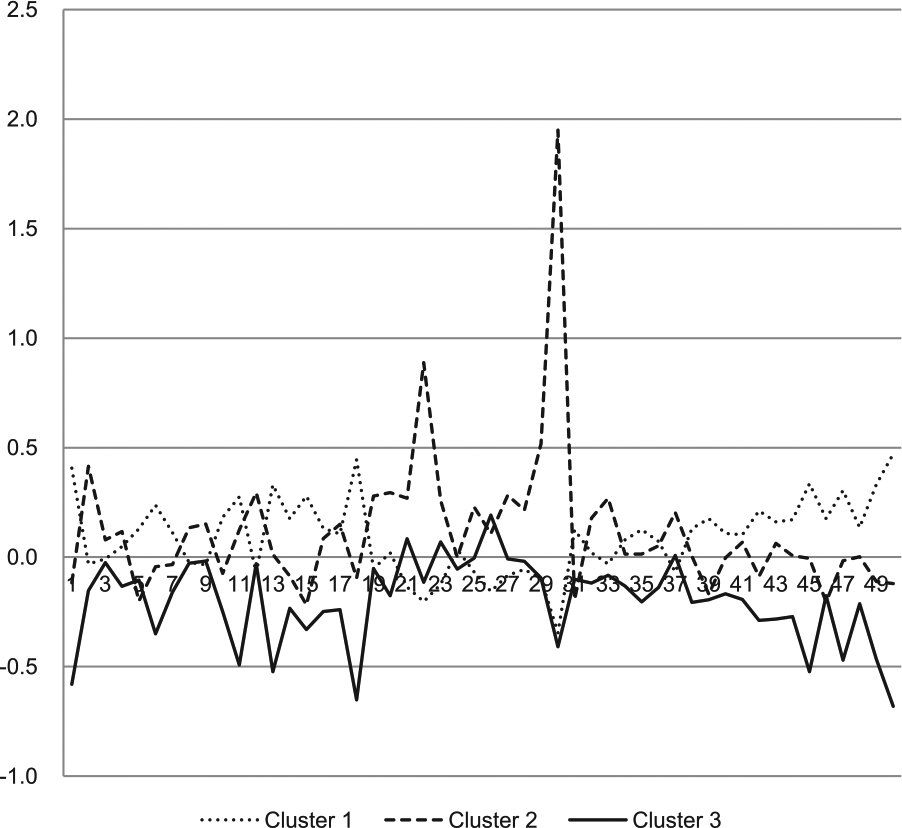
The subscale scores of all the students by Gaussian mixture model. The vertical axis shows the scores on each subscale (z scores). The point from 1 to 10, 11 to 20, 21 to 30, 31 to 40 and 41 to 50 in the horizontal axis shows the score for ‘social skill’, ‘attention switching’, ‘attention to detail’, ‘communication’ and ‘imagination’, respectively.
Results of the GM model and the k-means analyses of all the data (scoring, five subscales)
It was pointed out that problems ‘in data analysis that results from a large number of variables’ because most cluster analyses depend on ‘the measure of distance or similarity’ (Steinbach et al., 2004). It was suggested that the above GM model analysis of the 50 AQ items, due to the large number of items, led to insufficient separation of clusters. Therefore, scores for the original five subscales (Baron-Cohen et al., 2001) were analysed because when performing cluster analysis, the large variables might not produce robust results.
Application of the data to the GM model revealed that the optimal number of clusters was 6 according to the BIC (with varying volume and shape (VVI) model) (Figure 3).
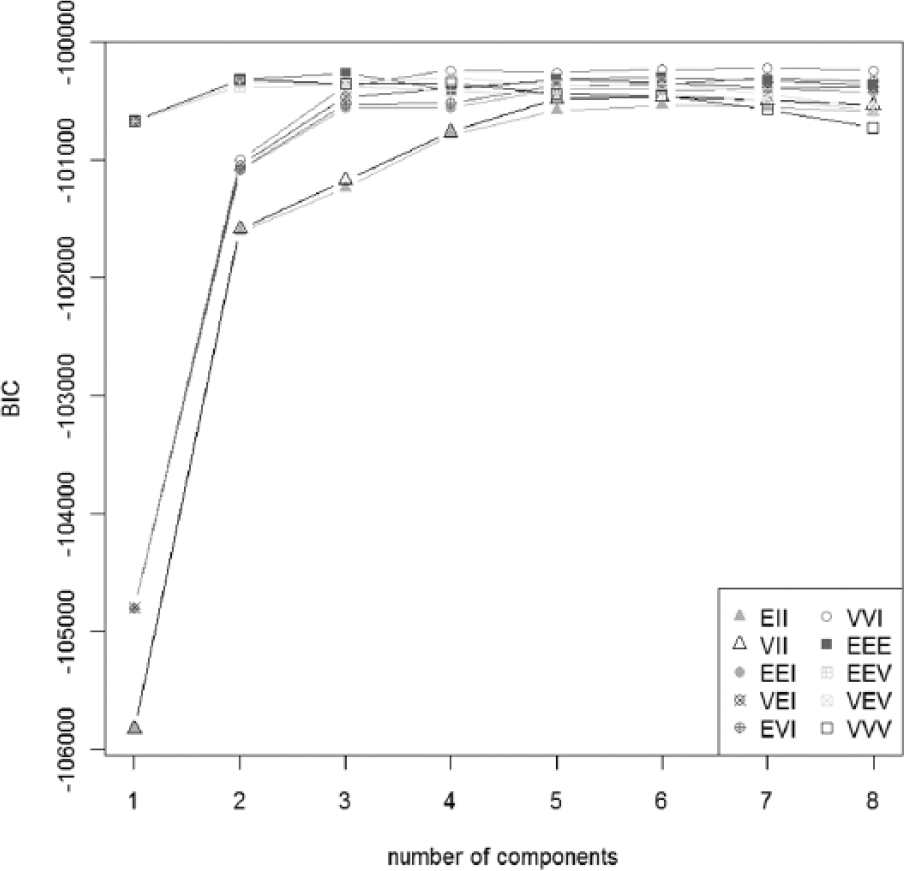
The result of Gaussian mixture model using five subscales (all the students).
Based on this result, the number of clusters was set to 6, and k-means analysis was conducted. All students were divided into gender-specific groups and randomly divided into two groups, and the data were analysed in the six clusters. Also, the GM model can not only determine the number of clusters using BIC but also analyse the pattern of clusters in the same way as k-means. Therefore, a cluster pattern (all students) analysis by the GM model was performed, with the results that the pattern of clusters was almost the same as that of k-means. Figure 4 shows the results of the GM model and k-means analyses.
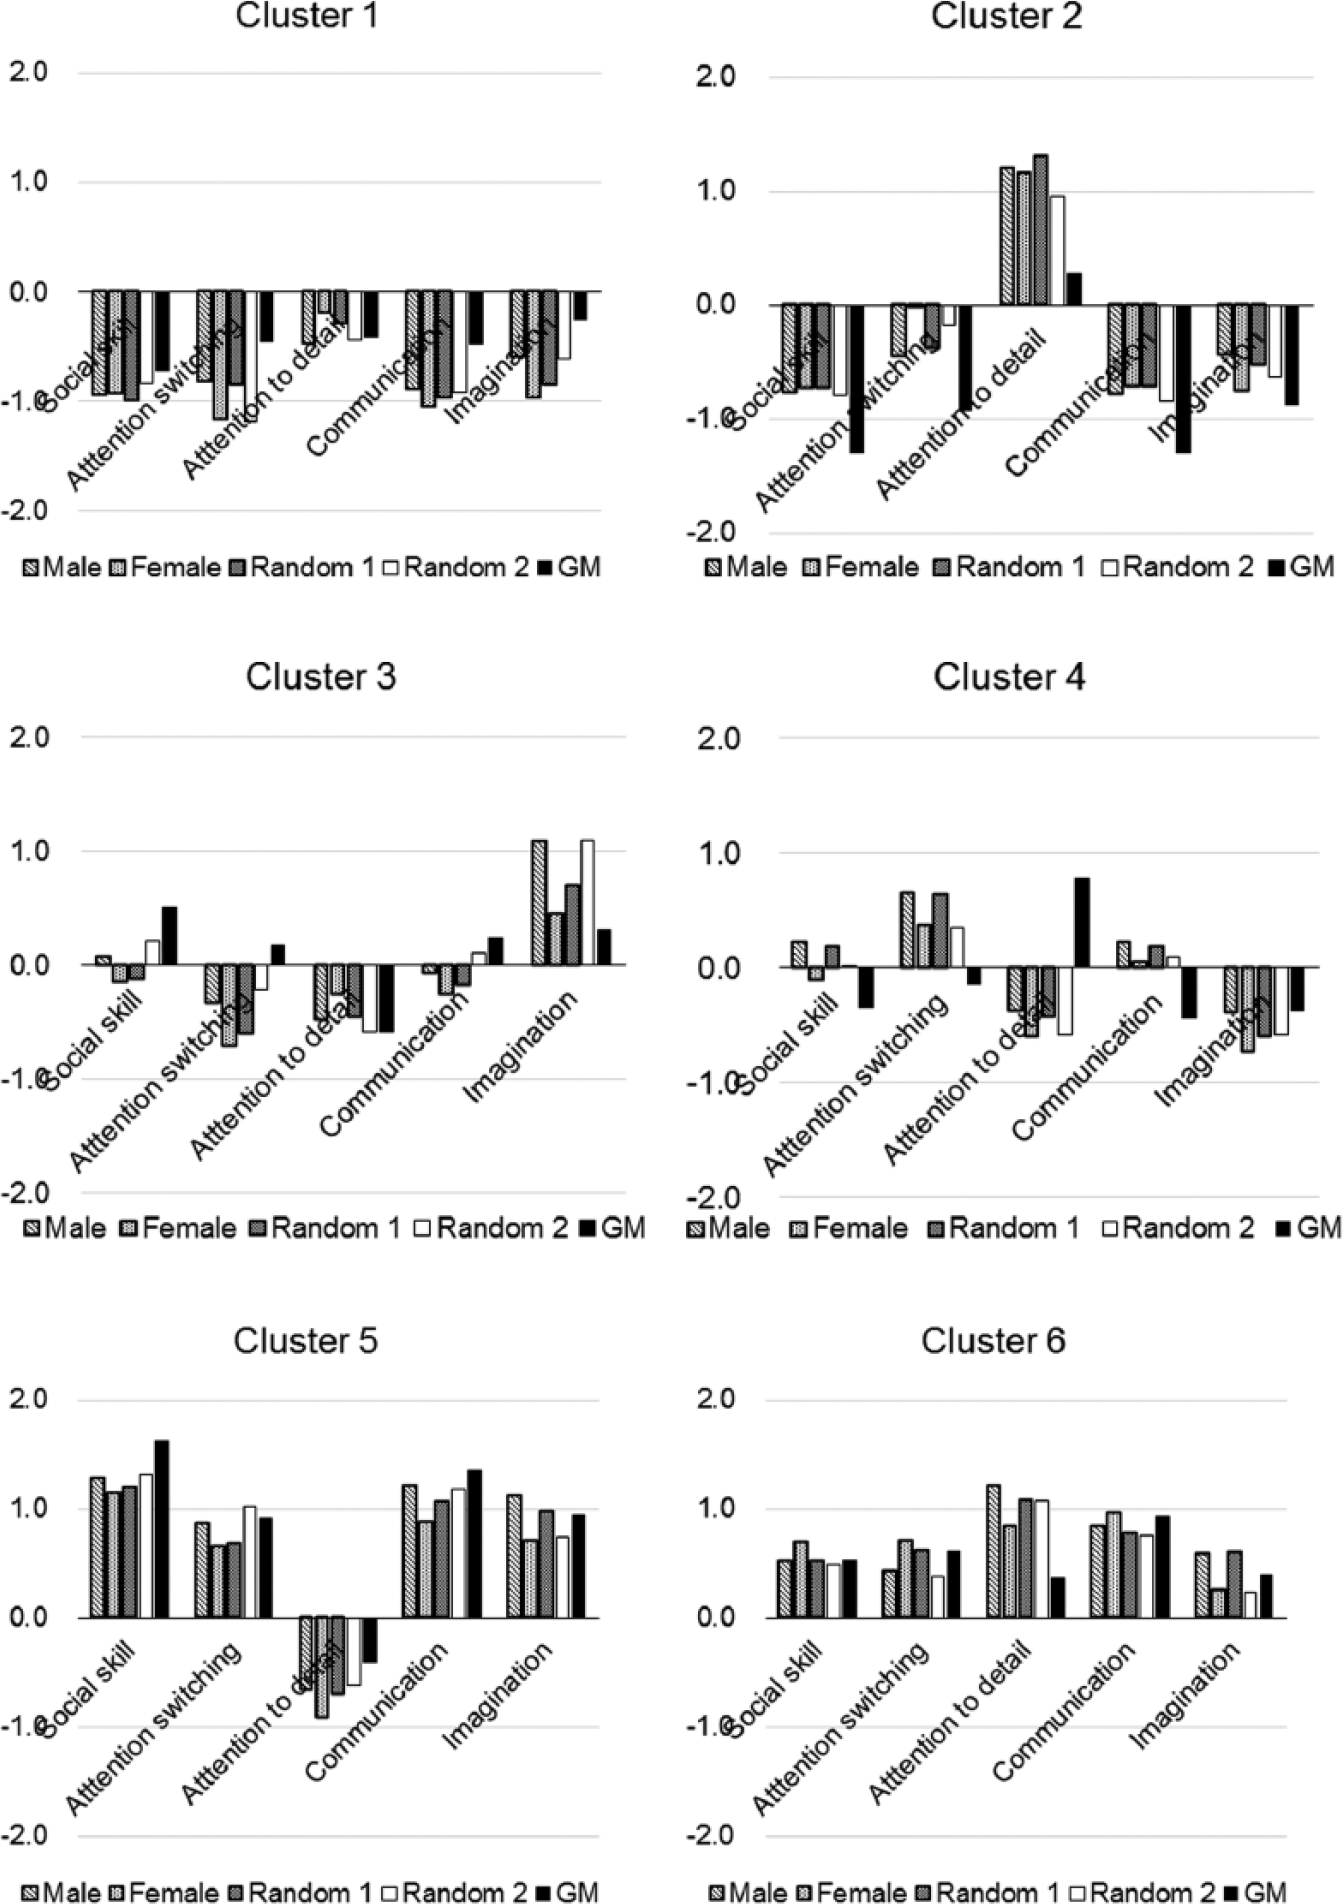
The k-means by sex and by random groups and the Gaussian mixture model. The vertical axis shows the scores on each subscale (z scores).
The results of the GM model and k-means analyses were similar to one another, as described below. Cluster 1 had negative z scores for all the subscales in all groups, indicating that this group of students had none of the traits assessed by any of the subscales. Cluster 2 had high z scores for the ‘attention to detail’ subscale, but negative z scores for the remaining four subscales, indicating that this group had only the ‘attention to detail’ trait. Cluster 3 had rather high z scores for ‘imagination’ alone, and z scores for the other subscales that were close to zero or negative for the other subscales. The z score of Cluster 4 was positive for the ‘attention switching’ subscale and near zero or negative for the remaining subscales. Cluster 5 had a negative z score for the ‘attention to detail’ subscale, but the z scores for the other four subscales were above 0.6. The z scores of Cluster 6 were positive for the traits assessed by all the subscales.
The distribution of the scores on the ‘attention to detail’ subscale is shown for each cluster (Figure 5). Clusters 5 and 6 included students with high AQ subscale scores, but exhibited very different trends with respect to the scores on the ‘attention to detail’ subscale. The distributions of the scores on the ‘attention to detail’ subscale in Clusters 5 and 6 were almost clearly separated. Cluster 2 had negative z scores for all but the ‘attention to detail’ subscale (Figure 4). Cluster 6 had positive cluster centroid values for all the subscales. In other words, Cluster 2, a group that did not contain any students with high total AQ scores, and Cluster 6, a group that contained students with high total AQ scores, showed similar trends in the scores on the ‘attention to detail’ subscale.
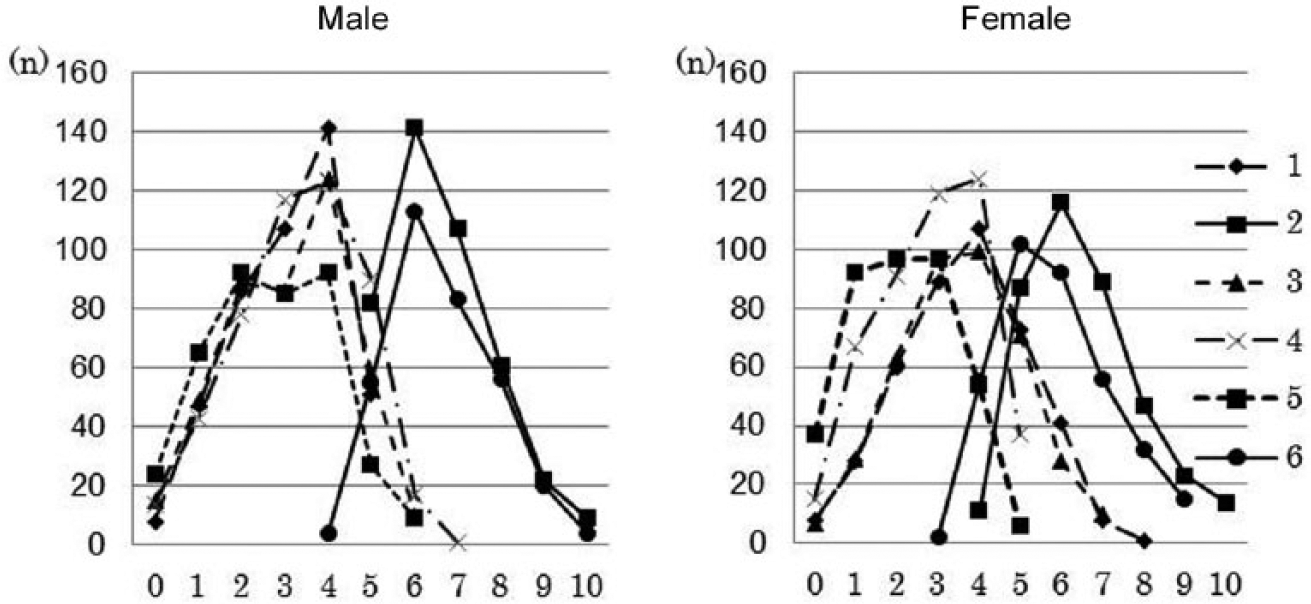
Distribution of the scores for ‘attention to detail’ (all students included in the analysis, n = 4901). The horizontal axis shows the scores on ‘attention to detail’. The vertical axis shows the frequencies. Legends 1–6 correspond to Clusters 1–6.
Confirmatory factor analysis
Palmer et al. (2015) reported that a factor analysis of the 50 AQ items revealed three factors, ‘sociability’, ‘mentalising’ and ‘detail orientation’, and that ‘detail orientation’ was weakly related to the other two factors. To check whether the results obtained in methods (2) in this study were consistent with the results of factor analysis reported by Palmer et al. (2015), we conducted a confirmatory factor analysis of the five subscales. We investigated whether all the five subscales, as a whole, have a single factor structure, and the results showed good goodness-of-fit indicators (GFI) = 0.993, comparative fit index (CFI) = 0.983 and root mean square error of approximation (RMSEA) = 0.056. However, subscales other than the ‘attention to detail’ subscale had a positive factor loading of 0.5 or higher, while the ‘attention to detail’ subscale had a factor loading of −0.16. Therefore, we conducted a factor analysis again after excluding the ‘attention to detail’ subscale (GFI = 0.996, CFI = 0.991 and RMSEA = 0.062). The results showed that the subscales of ‘social skill’, ‘attention switching’, ‘communication’ and ‘imagination’ had factor loadings of 0.75, 0.53, 0.76 and 0.50, respectively, indicating that these four subscales constitute a single factor distinct from the ‘attention to detail’ subscale.
Results of the GM model clustering of the high score group (all 50 AQ items)
GM model clustering of 166 students with AQ scores of 33 or higher was performed using the 50 AQ items. The results showed that the students could not be divided into clusters and that the optimal number of clusters was 1.
Results of the GM model and the k-means analyses of the high score group (scoring, five subscales)
There is a possibility that the lack of distinct clusters within the high AQ group on 50 variables could be due to the small sample size of this subgroup. Therefore, the GM model analysis of the scores on the five subscales was conducted in the high AQ score group. The results showed that the optimal number of clusters was 2. Then, k-means clustering was performed. Based on this result (Figure 6), Cluster 1′ had a negative z score for the ‘attention to detail’ subscale and positive z scores for the other subscales. Cluster 2′ had positive z scores for all the subscales. These results show a similar trend to that observed for Clusters 5 and 6 in the analysis of all students (Figure 4).
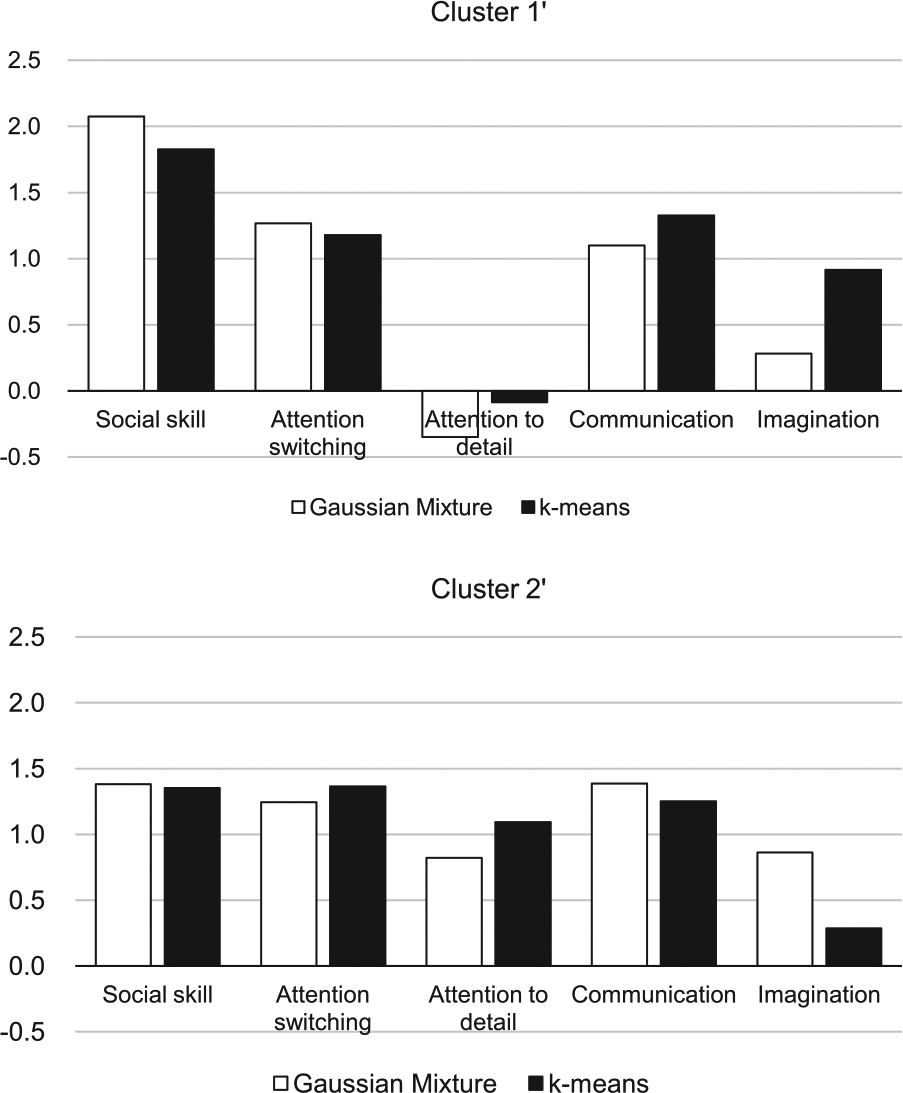
The results of the Gaussian Mixture model and k-means of the students with the high scores on the AQ.
Discussion
Analysis of all students
Based on analysis of all the students to the 50 AQ items according to Ring et al. (2008) and Palmer et al. (2015), the students were divided into three clusters (Figures 1 and 2). The z scores for the three clusters (Figure 2) revealed that the clusters were separated by the severity, supporting the results of Ring et al. (2008). However, in the EEE model, there were only small changes in the BIC values when the number of clusters was changed between 1 and 20 (Figure 1). Although the BIC itself is quite reliable, it was considered difficult to determine the number of clusters in the analysis of all the students to the 50 items of AQ in the general population.
On the other hand, based on analysis of the students by the AQ original subscales, the students were divided into six groups. The characteristics of one of the five subscales, ‘attention to detail’, differed from those of the other four subscales. Namely, all the students as a whole could be divided into a group in which the ‘attention to detail’ trait was strong (comprising Clusters 2 and 6) and a group in which the ‘attention to detail’ trait was weak (comprising Clusters 1, 3, 4 and 5) (Figures 4 and 5). We think that based on the results of this study, the students were divided not into severity groups, but into subtypes, consistent with the results of Palmer et al. (2015). However, the subtypes were somewhat different between the two studies. Palmer et al. (2015) divided the entire general population into two groups by cluster analysis; while in our study, we divided all the students into six groups. We think that this difference can be explained as follows. Palmer et al. (2015) suggested that the population can be divided into two groups, that is, social and non-social (detail orientation) groups. This study confirmed that the AQ has two components: the first consisting of the four traits other than ‘attention to detail’ (‘social skill’, ‘attention switching’, ‘communication’ and ‘imagination’) and ‘attention to detail’ (see section ‘Confirmatory factor analysis’). We think that the AQ consists of two factors, social and non-social (detail orientation) factors, as described by Palmer et al. (2015). Categorization of the students in this study into six groups can be explained by combinations of these two factors, social and non-social (detail orientation): high scores on both social and non-social factors (Cluster 6), high score on social factor and low score on non-social factor (Cluster 5), low score on social factor and high score on non-social factor (Cluster 2) and low scores on both social and non-social factors (Cluster 1), while two groups which the combination pattern of the two factors remains unclear (Clusters 3 and 4).
Analysis of the high AQ score group
Students with high total AQ scores could be divided into two groups: a group with low scores for ‘attention to detail’ and high scores on all of the other four subscales, and other group with high scores on all the subscales (Figure 6), suggesting that the high AQ score group consisted of two qualitatively different subgroups. As discussed in relation to the analysis of all students, we think that the aforementioned combinations of two factors, namely, social and non-social (detail orientation) factors, could also be confirmed in the high AQ score group (Cluster 2′ had high scores on both social and non-social factors, while Cluster 1′ had high score on social factors and low score on non-social factors). There should not be a subgroup with a combination of low score on social factor and high score on non-social factor, combination of low scores on both social and non-social factors or with an unclear combination pattern in the high score group.
Because the high AQ score group was not a clinical group, it would not be easy to simply compare the results with those reported by Ring et al. (2008). However, we think that the students in the high score group could also be divided into two groups by the combination (high or low) of two factors (social and non-social), and not by the severity. Therefore, our results were contrary to the conclusions of Ring et al. (2008).
Comprehensive discussion of the analysis of all students and the high score group
Two groups, that is, a group with low scores for ‘attention to detail’ and a group with high scores for ‘attention to detail’, were recognized in both the groups in which the total AQ score was equal to or higher than the cut-off value (Figure 6) and in the group with a high total AQ score (comprising Clusters 5 and 6) among the students of the analysis as a whole (Figures 4 and 5). Both the entire student population and the high AQ score group could be divided into subgroups by the combination of two factors, social (four of the five subscales of AQ, except the ‘attention to detail’ subscale) and non-social (detail orientation; attention to detail) factors. Two different subgroups, namely, a subgroup with high scores on both social and non-social (detail orientation) factors and a subgroup with high score only on social factors, were confirmed in both the high AQ score group among all the students (Clusters 5 and 6) and the group with AQ scores equal to or higher than the cut-off point (Clusters 1′ and 2′). Our results consist with Palmer et al. (2015). The results of two studies might indicate that non-clinical individuals do not just differ from one another in their severity of autistic traits but also in their profile of traits across social and non-social domains.
Are autistic traits measured by the AQ unitary traits?
Ronald et al. (2006a) pointed out that social impairments, communication impairments and restricted, repetitive behaviours and interests were highly heritable, but exhibited little covariation. Happé and Ronald (2008) presented evidence from their studies (Ronald et al., 2005, 2006a, 2006b) to suggest that no single unitary account can explain both the social and non-social features of autism. The results of this study suggest that the ‘attention to detail’ subscale differs in nature from the other four subscales, and the results may support the report of Happé and Ronald (2008).
Hoekstra et al. (2008) compared the original five-factor model and their own two-factor hierarchical model in a study of 961 university students and 302 adults. The two-factor hierarchical model consists of a single higher order factor that encompasses the four lower order domains of ‘social skill’, ‘communication’, ‘attention switching’ and ‘imagination’, and a second factor, namely, ‘attention to detail’, and the results of the comparison revealed a better goodness-of-fit for the two-factor hierarchical model. They pointed out that the correlation between the two factors was weak (r = 0.19). The results of this study seem to support the two-factor hierarchical model proposed by Hoekstra et al. (2008).
In addition, associations with the ‘attention to detail’ subscale that are different from those of the other four subscales of the AQ have been pointed out in studies of associations between the AQ and questionnaires that measure other mental symptoms. Hurst et al. (2007b) investigated the associations between the scores on the Schizotypal Personality Questionnaire (SPQ) and AQ. The SPQ interpersonal factor consists of social anxiety, affect and paranoid ideation. Hurst et al. (2007b) found positive associations between the SPQ interpersonal factor and four of the five subscales of the AQ other than the ‘attention to detail’ subscale, and a positive association between the SPQ cognitive-perceptual factor and the ‘attention to detail’ subscale. The results of our previous study (Kitazoe et al., 2014) showed that the scores on the ‘attention to detail’ subscale were not related to the scores on the Liebowitz Social Anxiety Scale. Consider these studies the common approach of treating non-clinical variation in autistic traits as a singular may be simplistic.
Limitations
A limitation of this study was that it did not include any clinical groups. The AQ measures autistic traits that may not necessarily fulfil the diagnostic criteria for ASD. In the future, it will be necessary to also conduct cluster analysis of clinical groups using the AQ.
Conclusion
A cohort of university students (n = 4091) was investigated in this study by cluster analysis based on the original five subscales of the AQ. Based on the results of the analysis, the students could be divided into six clusters; the first with low scores on all the five subscales, the second with high scores on only the ‘attention to detail’ subscale, the third and fourth with intermediate scores on all the subscales, the fifth with high scores on four of the five subscales but low scores on the ‘attention to detail’ subscale and the sixth with high scores on all the five subscales.
The students with high total AQ scores (AQ ⩾33, n = 166) could be classified into two groups by cluster analysis: one with high scores on four of the five subscales but low scores on the ‘attention to detail’ subscale and the other with high scores on all the five subscales. The above findings suggested that individuals with high total AQ scores may comprise two qualitatively different groups. Our results consist with Palmer et al. (2015). These two studies might indicate as follows: non-clinical individuals do not just differ from one another in their severity of autistic traits but also in their profile of traits across social and non-social domains. So the common approach of treating non-clinical variation in autistic traits as a singular may be simplistic.
Footnotes
Acknowledgements
The authors would like to thank Professor Christopher Gillberg for his support in the conduct of this study. Also, they would like to thank Emeritus Professor, Kochi University Shimpei Inoue and Professor Masaki Taniguchi for their support to perform this study and to revise their English.
Funding
This study was supported by Japan Society for the Promotion of Science (JSPS) Grant-in Aid for Scientific Research (c) (KAKENHI) (Grant Number 1853757).