
Abstract
Children with autism spectrum disorders show higher food selectivity, which restricts consumption of some foods and may cause nutritional deficiencies. The aims of this meta-analysis are to determine the overall differences in nutritional intake and food consumption between children with autism spectrum disorder and control (typical development) children, as well as determine the extent to which the nutritional intake and food consumption of autistic children comply with the dietary recommendations. Children with autism spectrum disorder consume less protein (standardized mean difference = −0.27, 95% confidence interval (−0.45, −0.08)), calcium (−0.56 (−0.95, −0.16)), phosphorus (−0.23 (−0.41, −0.04)), selenium (−0.29 (−0.44, −0.13)), vitamin D (−0.34 (−0.57, −0.11)), thiamine (−0.17 (−0.29, −0.05)), riboflavin (−0.25 (−0.45, −0.05)) and vitamin B12 (−0.52 (−0.95, −0.09)) and more polyunsaturated fat acid (0.27 (0.11, 0.44)) and vitamin E (0.28 (0.03, 0.54)) than controls. Autistic children also consume less omega-3 (−0.83 (−1.53, −0.16)) and more fruit (0.35 (0.12, 0.59)) and vegetables (0.35 (0.09, 0.61)) than control children; however, these results must be considered with care due to the low number of studies included in the analysis and the high heterogeneity. The results also suggest a lower intake of calcium, vitamin D and dairy and a higher intake of fruit, vegetables, protein, phosphorus, selenium, thiamine, riboflavin and vitamin B12 than recommended.
Keywords
Introduction
Food selectivity, characterized by food refusal, eating a limited food repertoire and the intake of a single food frequently, is commonly observed in childhood (Bandini et al., 2010; Beaudry, 2014). Some authors have described the important association between food selectivity and diet quality and how it can affect children’s weight, so they become overweight or obese in many cases (Barnhill et al., 2017; Matheson and Douglas, 2017). Although this food selectivity affects around 17% of children, it has been found to affect above 45% of children with autism spectrum disorder (ASD) (Schmitt et al., 2008). Children with ASD are characterized by social and communication impairment and repetitive and restrictive behaviour patterns that are unusual in terms of their intensity and focus (American Psychiatric Association (APA), 2013). These behaviour patterns, together with other features such as unwillingness to change and sensory hypersensitivities, could explain this idiosyncratic food behaviour (Raiten and Massaro, 1986; Ritvo and Freeman, 1977; Schreck et al., 2004). Therefore, these children have a higher risk of suffering an Avoidant/Restrictive Food Intake Disorder (APA, 2013; Zimmerman and Fisher, 2017), resulting in higher levels of food selectivity and monotony in eating, refusing foods from certain groups and showing an aversion to certain food colours, smells, temperatures and particularly textures (69% of cases) (Cermak et al., 2010; Schreck et al., 2004; Schreck and Williams, 2006; Williams et al., 2005).
These children consume less vegetables and fruit and instead eat more unhealthy products such as snacks or beverages (nutrient-poor food) (Evans et al., 2012; Perry et al., 2015; Sharp et al., 2013; Schreck and Williams, 2006). These unusual feeding habits may affect the children’s growth and weight, and optimal child development in general (Hines et al., 2010; Hyman et al., 2012; Matheson and Douglas, 2017). Some researchers have conducted studies to compare the nutrient intake of children with ASD and typical development (TD) children (Hyman et al., 2012; Marí-Bauset et al., 2016a; Raiten and Massaro, 1986). The most complete study is the review and meta-analysis conducted by Sharp et al. (2013), in which the authors compared intake by nutrient subgroups (energy, carbohydrates, protein, total fat, fibre, calcium, iron, zinc, vitamin A, C, D and E) in relation to the growth and health of children with ASD and TD children. They also looked at the feeding behaviour problems of the two groups. They reported a significantly lower intake of calcium and protein in autistic children among all the nutrients studied. In addition, they reported that children with ASD are five times more likely to have feeding problems than TD children. In line with Sharp’s work, we conducted a meta-analysis to update the information on the overall differences in nutritional intake between children with ASD and their respective controls (TD). Moreover, our objective is to study the food consumption of the two groups, and the intake and consumption in relation to international recommendations. We hypothesized that children with ASD would have a lower intake of nutrients like protein and calcium and a lower consumption of food groups like dairy products or vegetables and fruits in comparison to TD children. We also postulated that children with ASD may be at a higher risk of nutritional inadequacy based on international recommendations.
Methods
Search strategy and selection criteria
An exhaustive bibliographical search was conducted in the PubMed/Medline and the Cochrane Library databases in accordance with the MOOSE guideline for Meta-Analyses and Systematic Reviews of Observational Studies (Stroup et al., 2000) and the PRISMA guideline for Preferred Reporting Items for Systematic Reviews and Meta-Analyses (Moher et al., 2009). Following PRISMA guidelines, this study has been recorded in the PROSPERO (2016: CRD42016037979) international database of prospectively registered systematic reviews in health and social care: http://www.crd.york.ac.uk/PROSPERO/display_record.asp?ID=CRD42016037979.
All the analysed studies were published on or before 1 November 2017. The search strategy included the following terms: ‘Autism spectrum disorder’ OR ‘Autistic Disorder’ OR ‘Autistic traits’ OR ‘Autistic syndrome’ OR ‘Autistic spectrum’ OR ‘Child Development Disorders, Pervasive’ (Mesh) OR ‘ASD’ OR ‘Asperger disorder’ OR ‘Asperger syndrome’ OR ‘autism spectrum’ OR ‘PDD’ OR ‘pervasive developmental disorder’ AND ‘diet’ OR ‘Diet’ (Mesh) OR ‘food’ OR ‘Food’ (Mesh) OR ‘eat’ OR ‘eating’ OR ‘nutrition’. Additional articles were identified after citation tracking and manual searching. Studies that met the following criteria were included:
Observational studies (case-control, cohort or cross-sectional studies).
Studies of a population up to 18 years old.
Studies comparing children diagnosed with ASD and with TD children of the same age.
Dietary intake evaluated using methods such as the Food Frequency Questionnaire (FFQ), 3-day food diary, 2-day food diary, 24-h food diet recall or 24-h weighed food record; and by assessing mean and standard deviation data regarding food consumption and dietary intake.
The selection included standardized assessments for both ASD and dietary information. For ASD, we included studies that assessed the ASD diagnosis considering standard assessment procedures (Autism Diagnostic Interview-Revised (ADI-R), Autism Diagnostic Observation Schedule (ADOS) and Childhood Autism Scale (CARS)) and international diagnosis criteria (International Classification of Diseases (ICD) and Diagnostic and Statistical Manual of Mental Disorders (DSM)) (Risi et al., 2006; Tarbox et al., 2016). For dietary information, validated methods like the 3-day food diary or FFQ were chosen. Murine model studies, studies including children with non-ASD neurodevelopmental pathologies and studies involving participants who were on a diet, were excluded. Due to the wide range of results related to ASD and nutrition, two of our researchers (P.E.-F. and J.C.F.-C.) independently analysed the search to determine which articles should be included according to the inclusion criteria and which ones should be chosen for a later more complete evaluation. If an interesting article was found but we could not obtain it, we contacted the main author. We also made a manual search based on the articles’ references. We then reviewed the full articles to confirm their inclusion and extract their data. We contacted the studies’ authors via email to obtain data that had not been published in their studies and included it as well. From a standardized checklist of items (Cochrane Consumers and Communication Review Group’s Data Extraction Template for Included Studies), we created a table (Table 1) that shows the variables concerning study design, demographic and population features, ASD diagnosis procedure, food consumption assessment method and data on dietary information. The inter-rater agreement for continuous variables (year of publication and number of subjects) was calculated by Pearson correlations and for categorical variables (country, population, ASD diagnosis, nutrients and food assessment methods) by the percent agreement method (number of agreement/(number of agreements + number of disagreements) × 100) (Campbell, 2003). The inter-rater agreement was excellent for continuous variables (Pearson’s r = 1) and good for categorical variables (96%, range 91%–100%).
Characteristics of the studies included in the meta-analysis.
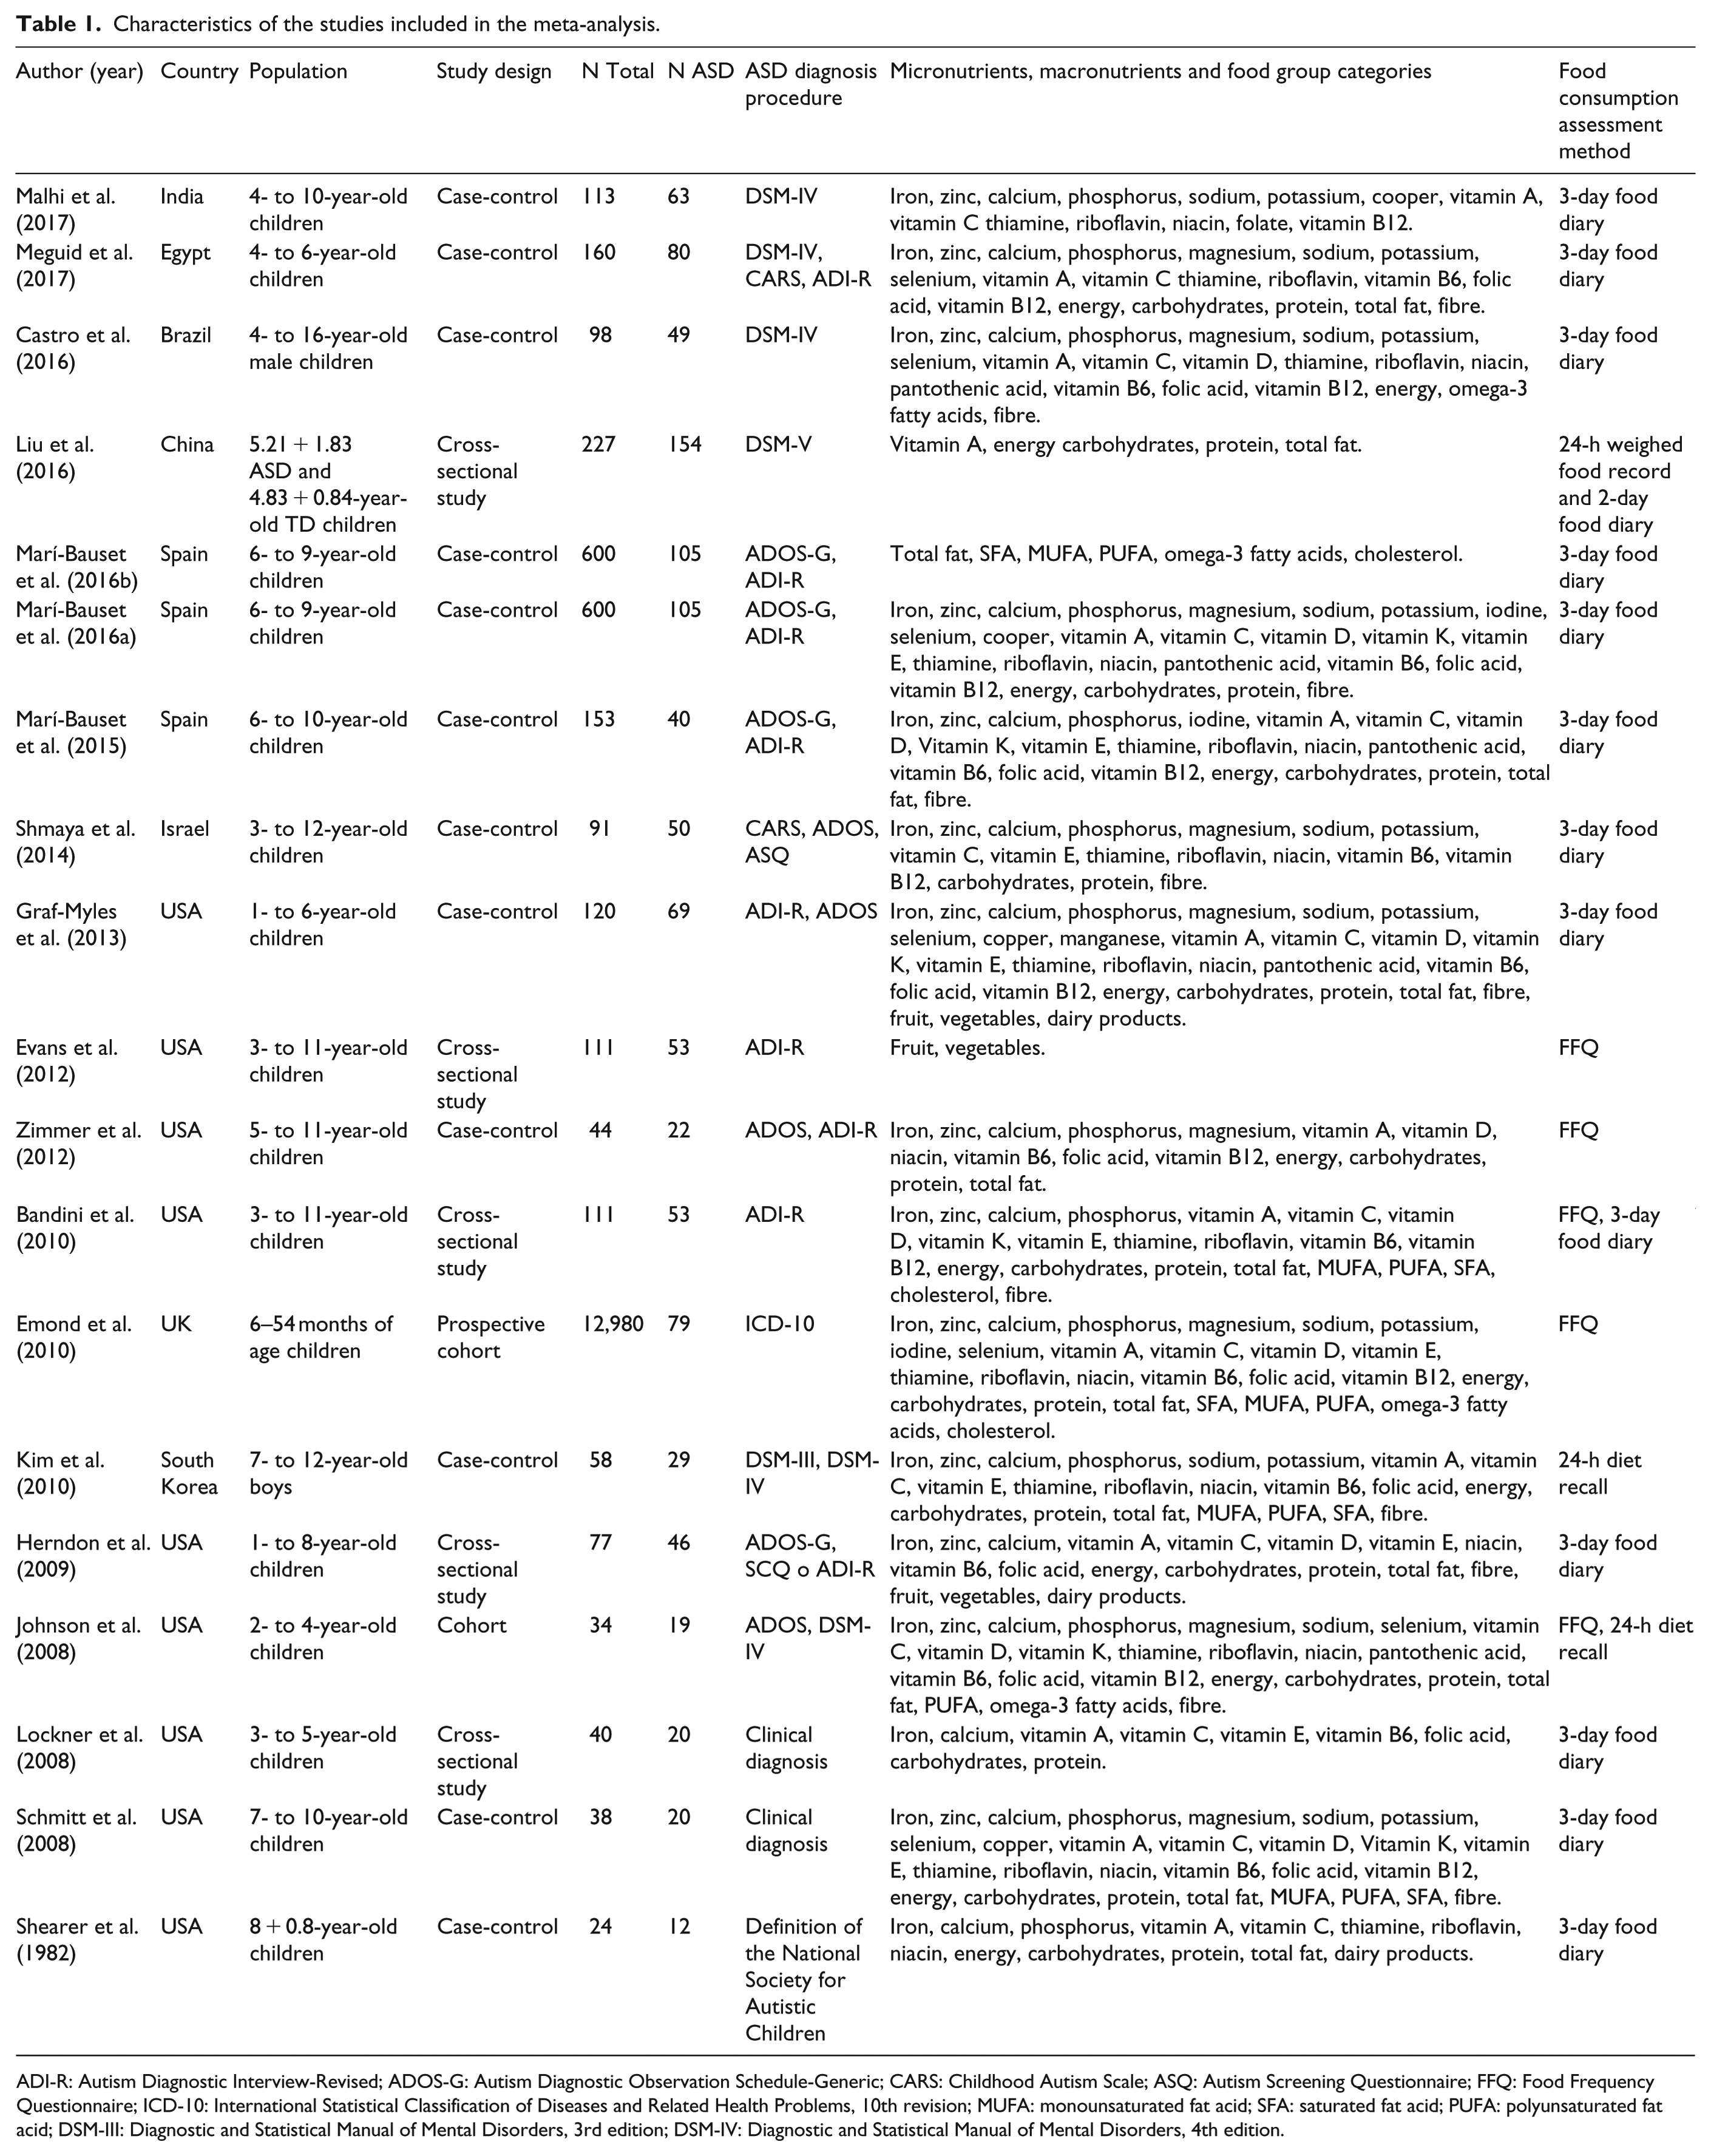
ADI-R: Autism Diagnostic Interview-Revised; ADOS-G: Autism Diagnostic Observation Schedule-Generic; CARS: Childhood Autism Scale; ASQ: Autism Screening Questionnaire; FFQ: Food Frequency Questionnaire; ICD-10: International Statistical Classification of Diseases and Related Health Problems, 10th revision; MUFA: monounsaturated fat acid; SFA: saturated fat acid; PUFA: polyunsaturated fat acid; DSM-III: Diagnostic and Statistical Manual of Mental Disorders, 3rd edition; DSM-IV: Diagnostic and Statistical Manual of Mental Disorders, 4th edition.
Estimating food and nutrient adequacy
For each study, we compared the nutrient intake of children with ASD to the dietary reference intakes (DRI) given by the Institute of Medicine ([IOM], 2000), and their food consumption to the Dietary Guidelines given by the United States Department of Agriculture ([USDA], 2016).
Statistical analysis and analysis of bias
All data were represented in an Excel spreadsheet and managed using The Review manager Software (RevMan 5.3; 2014) developed by Cochrane Collaboration. To determine the quality of each study, we used the STROBE Statement Checklist (Von Elm et al., 2014) and expressed the total mean value. The studies were considered of ‘high quality’ if they fulfilled 80%–100% of the checklist items, ‘moderate’ for 50%–79% and ‘low’ for less than 50%. Three members of our team (P.E.-F., J.C. and V.A.V.) carried out the STROBE Statement independently. The inter-rater agreement for study quality was 97% (range 92%–100%). A random effect model was used to estimate the overall standardized mean difference (SMD; ASD-TD = SMD) as well as the 95% confidence interval (CI); SMD values used to evaluate the magnitude difference between groups were 0.2 = small, 0.5 = medium and 0.9 = large (Cohen, 1988). The potential publication bias was assessed using Egger’s test and visualized using Begg’s funnel plot (Egger et al., 1997). Knowing that a non-significant result in Egger’s test does not necessarily mean asymmetry, we completed the analysis with a visual funnel plot study distribution, as recommended by Sedgwick (2013). The studies were also subjected to a sensitivity analysis. For some food or nutrient groups, the effect size was recalculated omitting the studies that caused asymmetry in the funnel plot. Statistical significance was set at p-value < 0.05, and the heterogeneity between studies was measured by I2 (percentage of variation attributable to heterogeneity). An I2 > 50% (p < 0.1) was considered as a measure of high heterogeneity (Higgins et al., 2011) and low robustness in our results.
Results
Figure 1 shows a flow diagram of the inclusion process. The search resulted in 1884 published studies from databases and two more relevant publications from manual screening. In total, 29 studies were selected in accordance with the inclusion/exclusion criteria. Some articles mentioned the use of a food intake assessment method but did not present data; therefore, we attempted to contact the corresponding author via email. Of the 29 remaining articles, 10 were excluded because the authors either did not answer, did not have relevant data to send or had still not published their data. Finally, 19 publications were included in the meta-analysis.
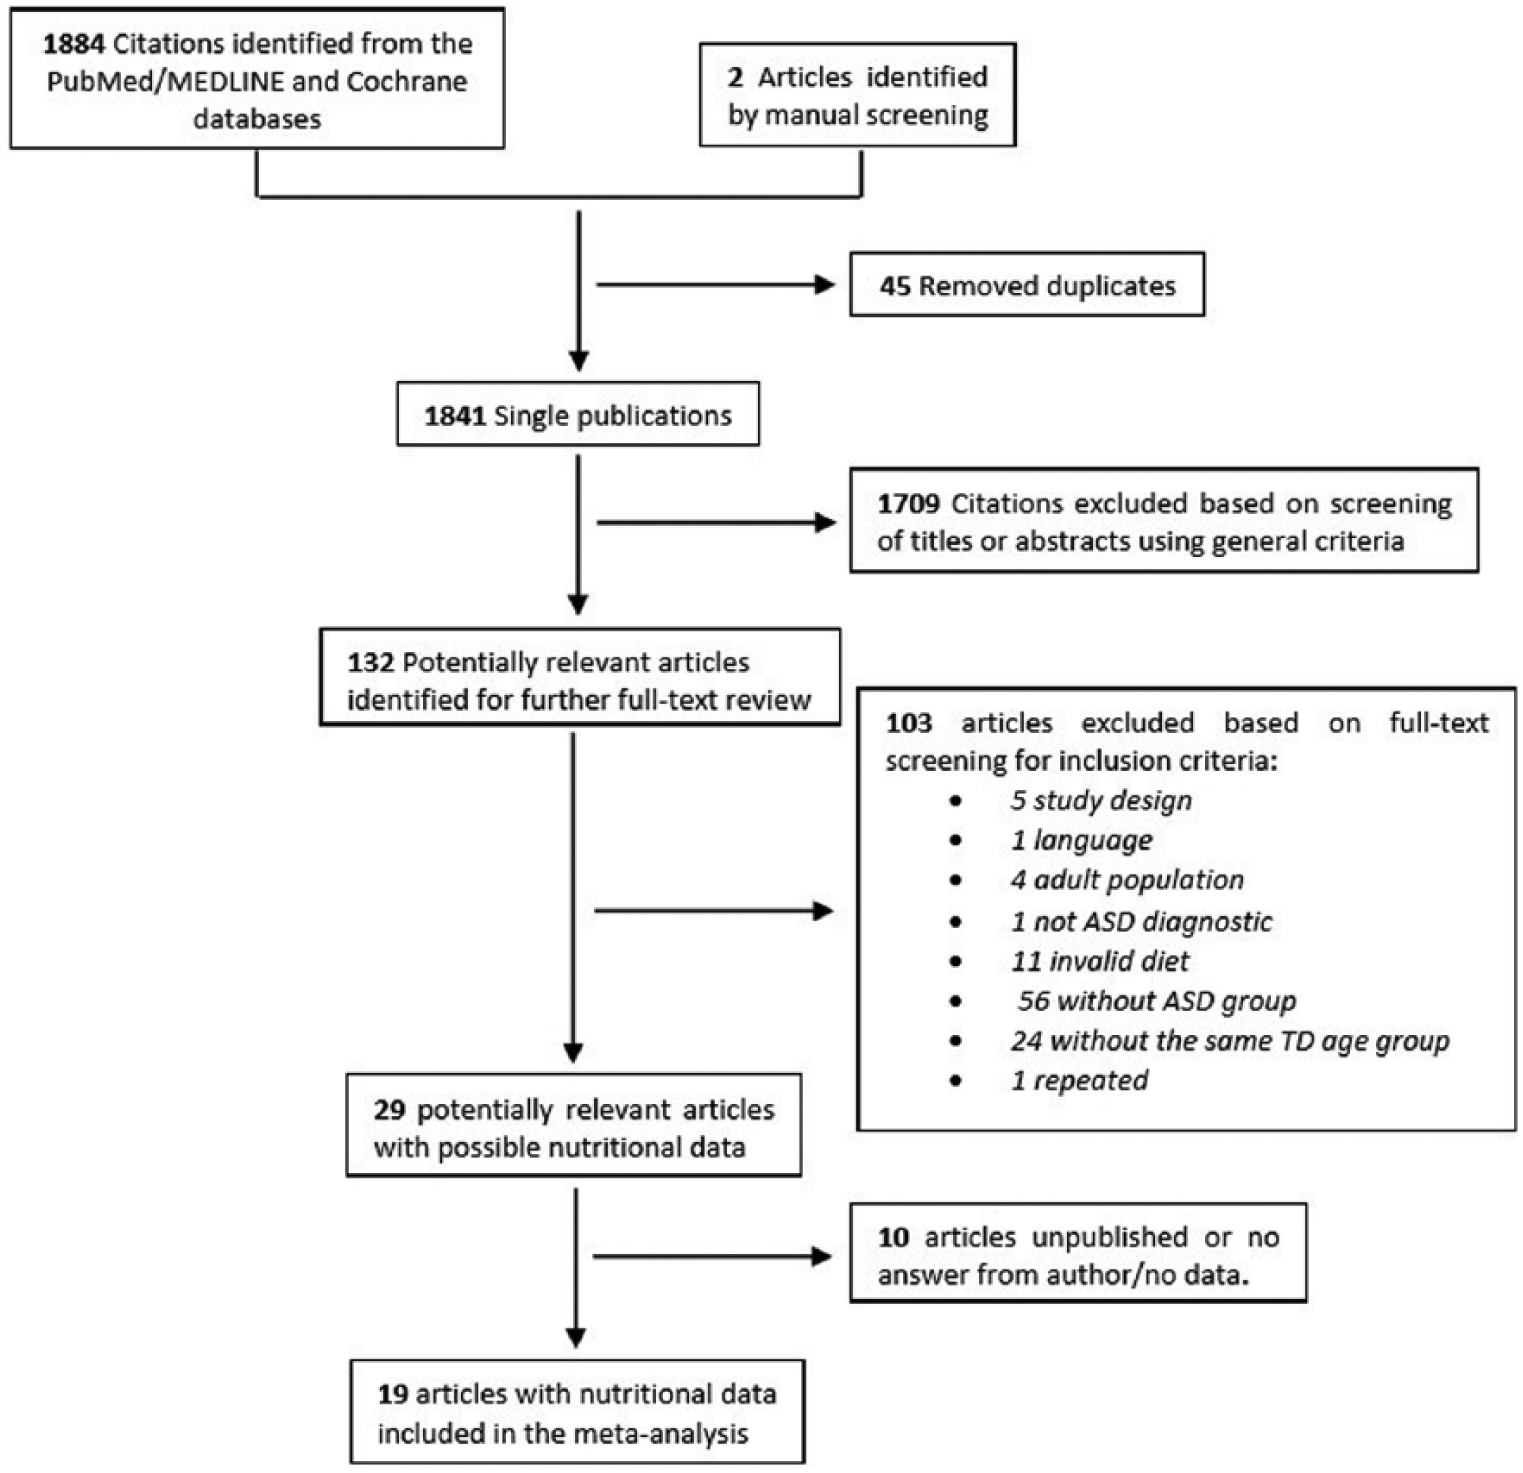
Flow diagram of included and excluded studies.
Most of the studies selected were conducted in the United States (9), and others were carried out in Spain, the United Kingdom, Egypt, Israel, India, South Korea and China. The studies were published between 2004 and 2017 except for one article published in 1982. Five studies were cross-sectional, twelve were case-control and two were cohort studies. The total number of participants was 15,079; 963 children with ASD and 14,116 TD children, aged between 6 months and 16 years. The studies included in the meta-analysis complied with between 63.6% and 87.5% of the items in the STROBE Statement (Von Elm et al., 2014), thus obtaining a moderate- to high-quality score.
The authors of the studies evaluated food and nutritional intake with: FFQ (Bandini et al., 2010; Emond et al., 2010; Evans et al., 2012; Johnson et al., 2008; Lockner et al., 2008; Zimmer et al., 2012); a 2-day food diary (Liu et al., 2016); a 3-day food diary (Bandini et al., 2010; Castro et al., 2016; Graf-Myles et al., 2013; Herndon et al., 2009; Lockner et al., 2008; Malhi et al., 2017; Marí-Bauset et al., 2015; Marí-Bauset et al., 2016a, 2016b; Meguid et al., 2017; Schmitt et al., 2008; Shearer et al., 1982; Shmaya et al., 2014); and/or a 24-h diet diary (Johnson et al., 2008; Kim et al., 2010); or a 24-h weighed food record (Liu et al., 2016). Three of the studies also conducted parent interviews (Bandini et al., 2010; Evans et al., 2012; Marí-Bauset et al., 2015) (see Table 1).
Table 2 shows the number of contributing studies, the SMD, the standard error (SE), the 95% CI and the heterogeneity for nutrient and food groups.
Mean differences in the food and nutritional data of ASD and TD as found in the studies included in the meta-analysis.
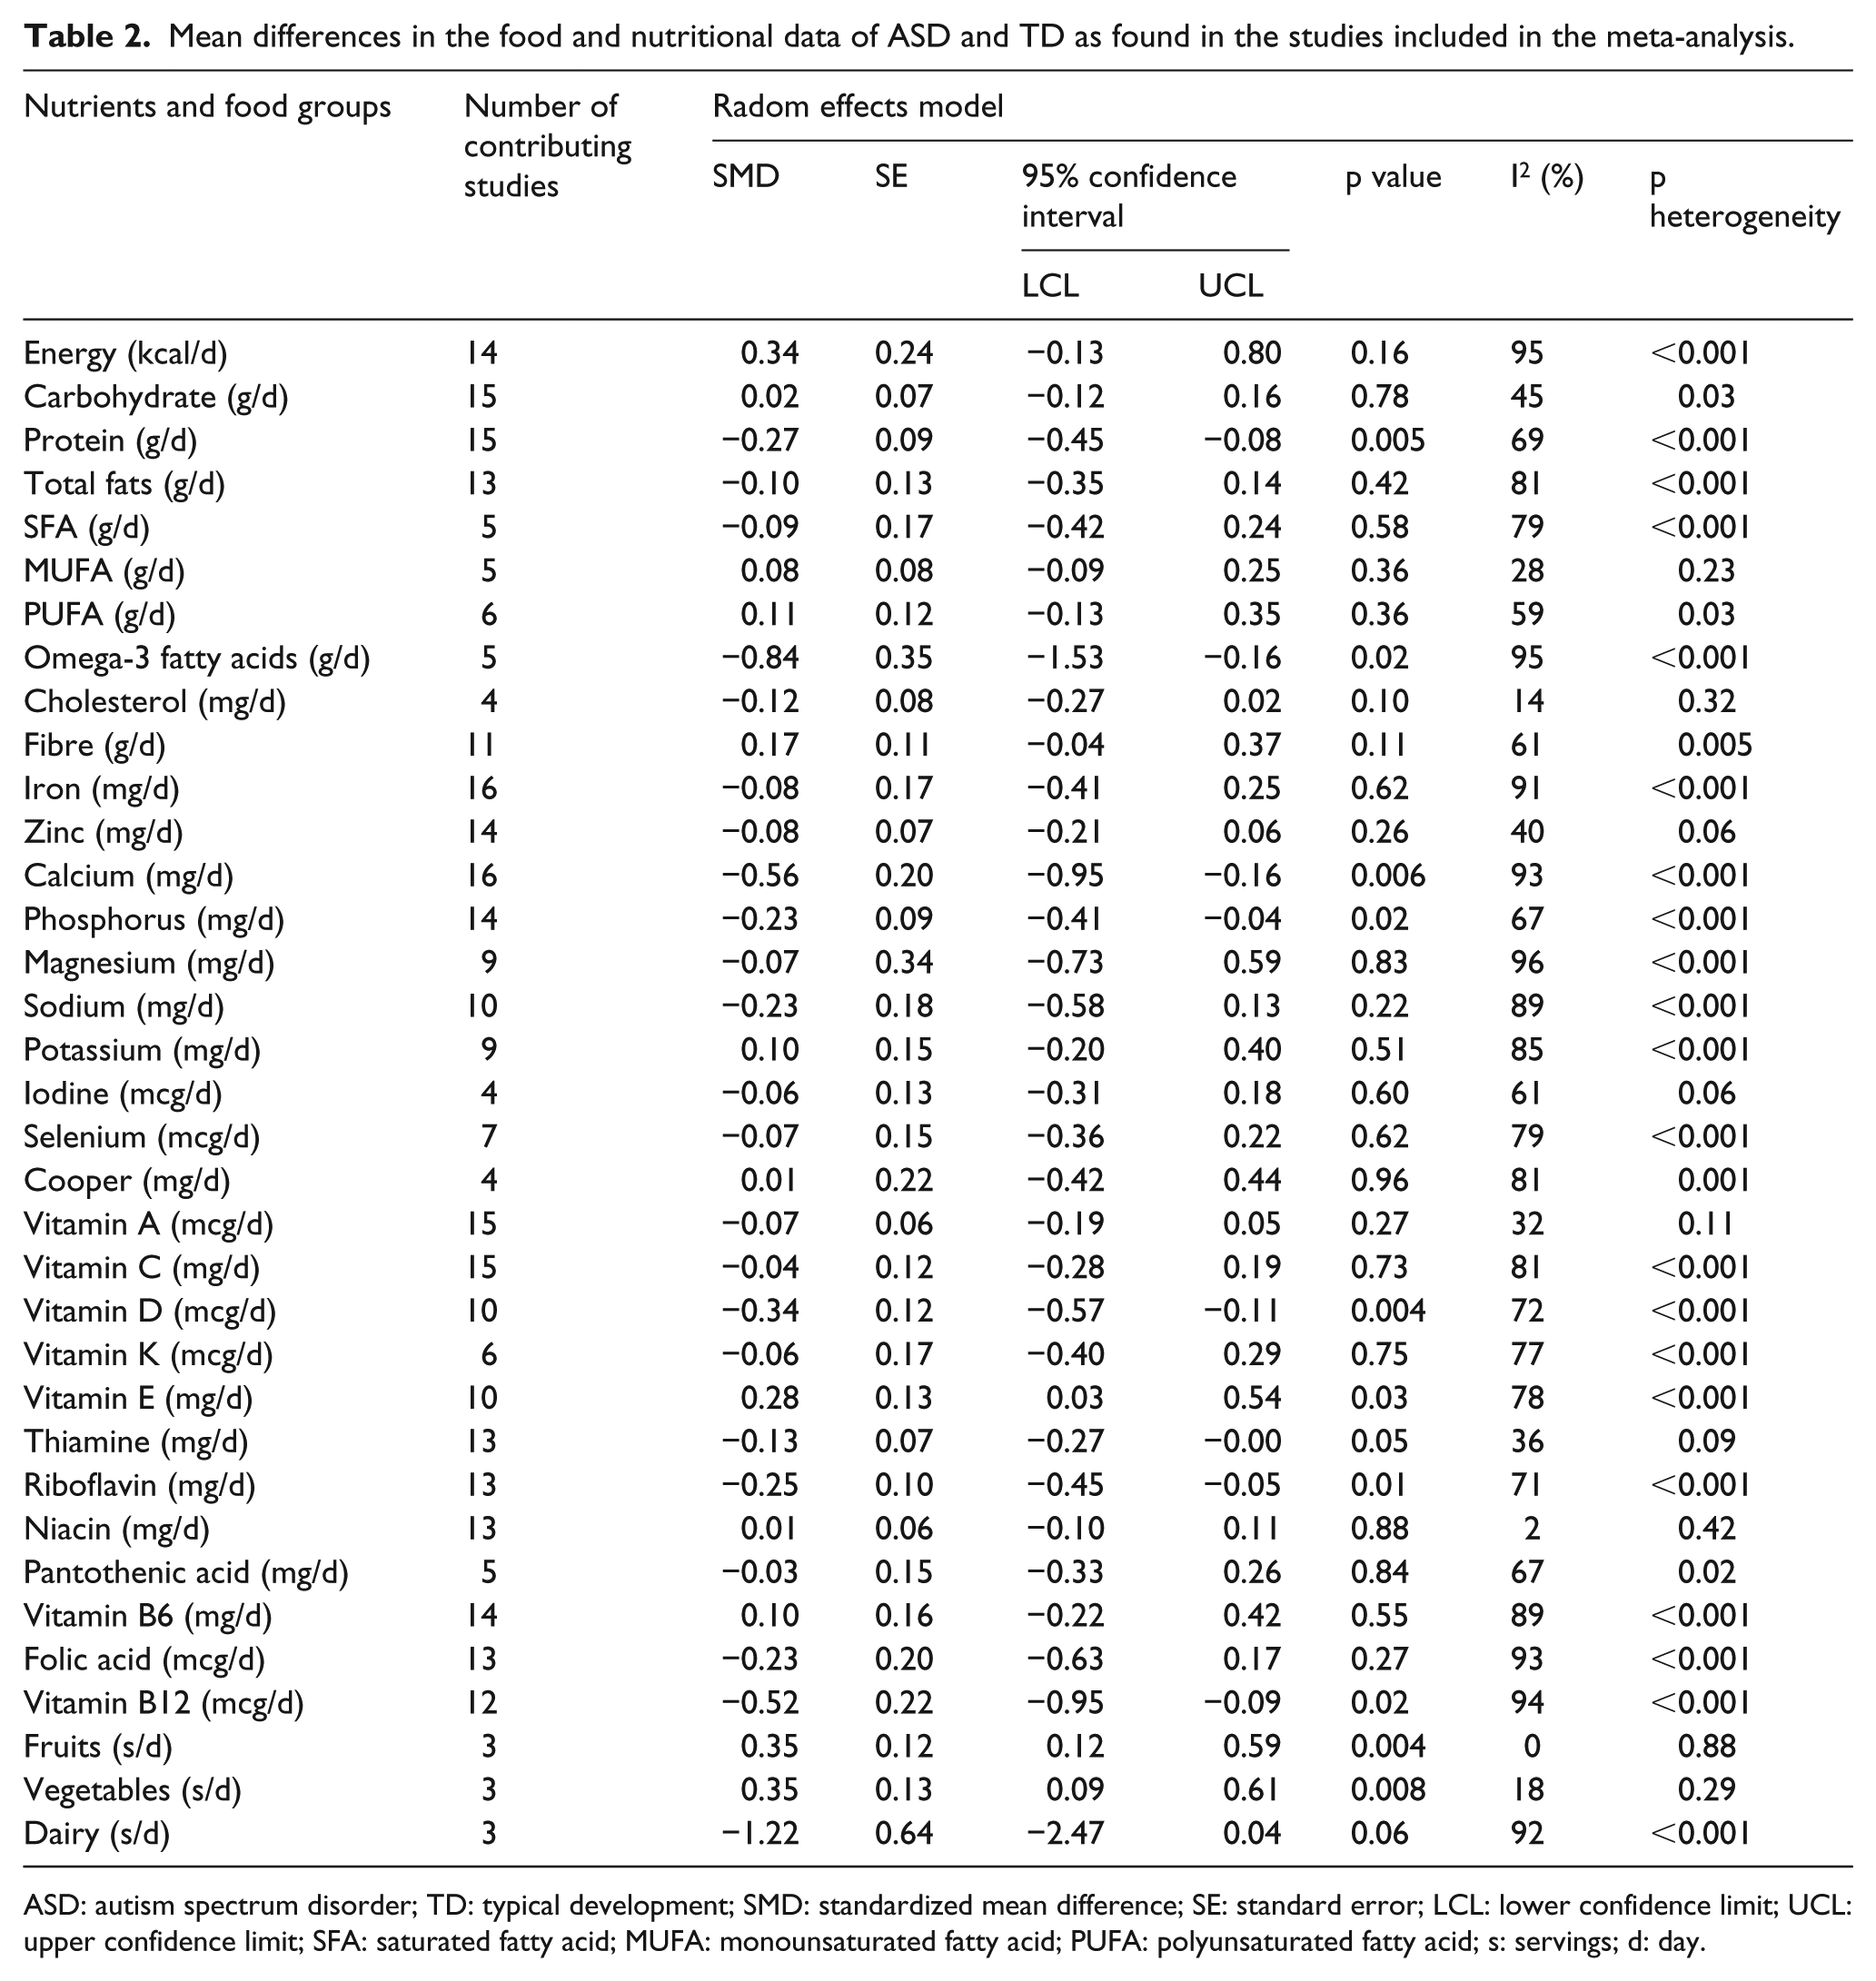
ASD: autism spectrum disorder; TD: typical development; SMD: standardized mean difference; SE: standard error; LCL: lower confidence limit; UCL: upper confidence limit; SFA: saturated fatty acid; MUFA: monounsaturated fatty acid; PUFA: polyunsaturated fatty acid; s: servings; d: day.
In terms of the different types of nutrient intake, 16 studies analysed iron and calcium; 15 analysed carbohydrates, proteins, vitamin A and vitamin C; 14 analysed energy, zinc, phosphorus and vitamin B6; 13 analysed total fats, thiamine, riboflavin, niacin and folic acid; 12 analysed vitamin B12; 11 analysed fibre; 10 analysed sodium, vitamin D and vitamin E; 9 analysed magnesium and potassium; 7 analysed selenium; 6 analysed polyunsaturated fatty acids (PUFA) and vitamin K; 5 analysed saturated fatty acids (SFA), monounsaturated fatty acids (MUFA), omega-3 fatty acids and pantothenic acid; and 4 analysed cholesterol, iodine and copper. Moreover, some studies looked at the following food groups: fruit, 3 studies; vegetables, 3 studies; and dairy, 3 studies.
The main objective of the meta-analysis was to determine the overall difference in food consumption and nutritional intake between children with ASD and their respective controls (TD children). The analysis of the nutritional data suggests that autistic children have a significantly lower intake of protein (−0.27 (−0.45, −0.08)), omega-3 (−0.84 (−1.53, −0.16)), calcium (−0.56 (−0.95, −0.16)), phosphorus (−0.23 (−0.41, −0.04)), vitamin D (−0.34 (−0.57, −0.11)), riboflavin (−0.25 (−0.45, −0.05)), vitamin B12 (−0.52 (−0.95, −0.09)) and a significantly higher intake of vitamin E (0.28 (0.03, 0.54)) compared to TD children (see Table 2 and Figures 2 to 9). The analysis also suggests that children with ASD consume significantly more fruit (0.35 (0.12, 0.59)) and vegetables (0.35 (0.09, 0.61)) than TD children (see Table 2, figures not shown).
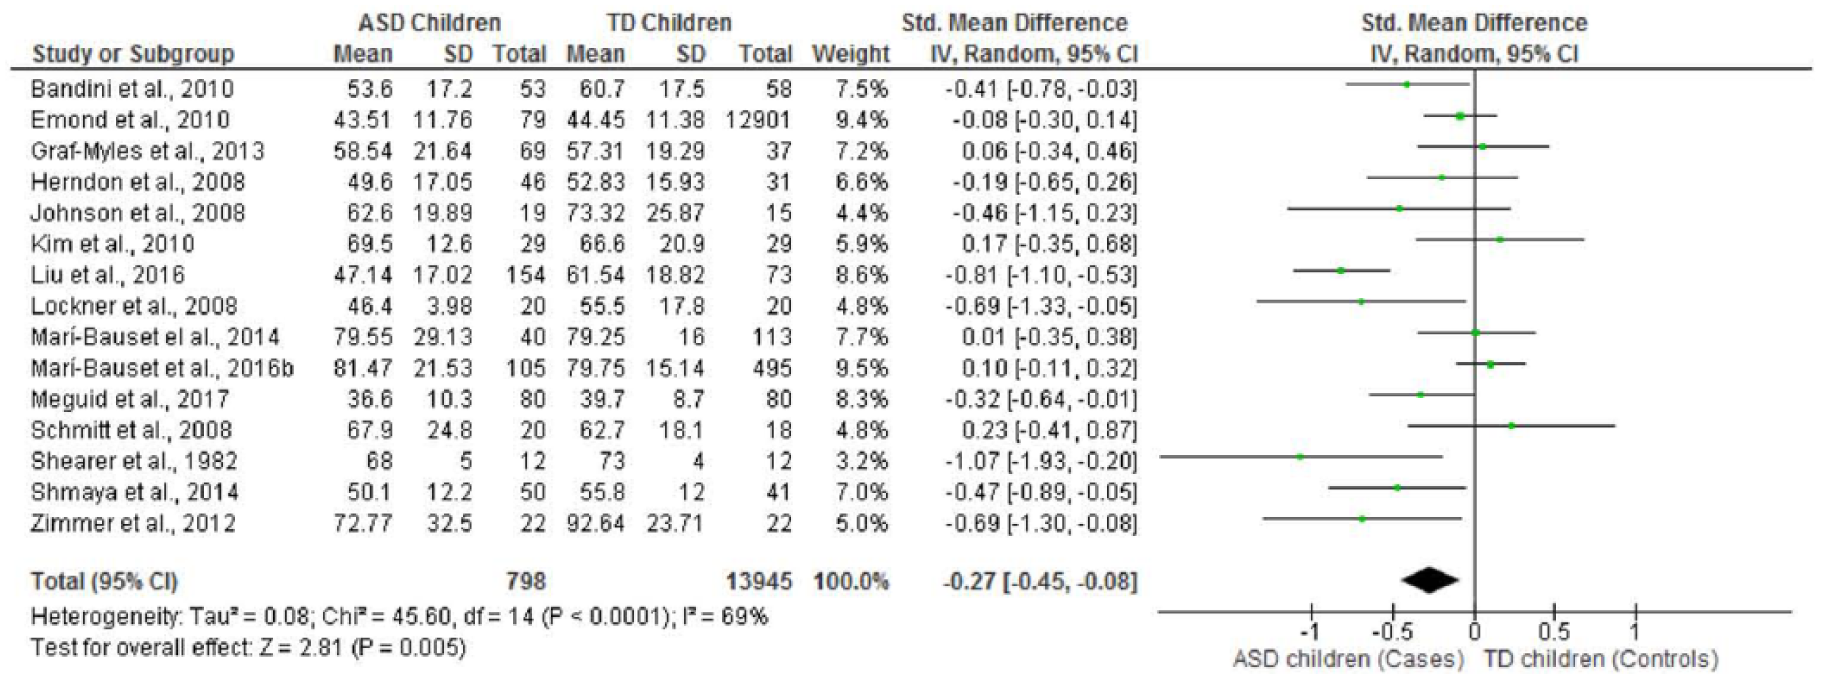
Forest plot of overall standardized mean difference in protein intake between TD and ASD children.
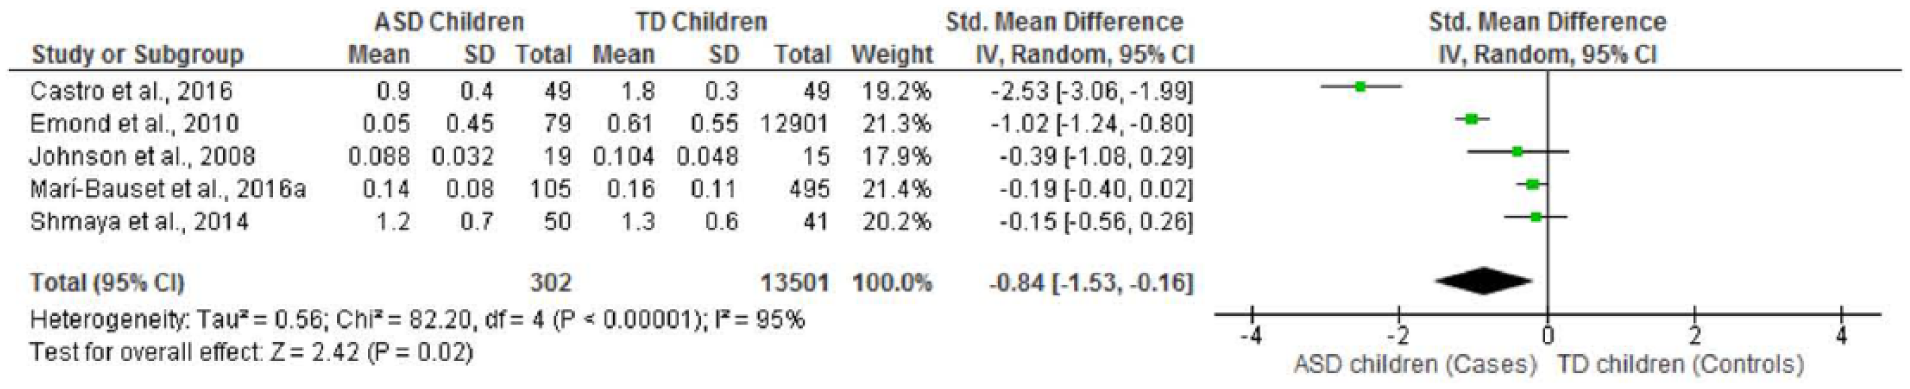
Forest plot of overall standardized mean difference in omenga-3 fatty acids intake between TD and ASD children.
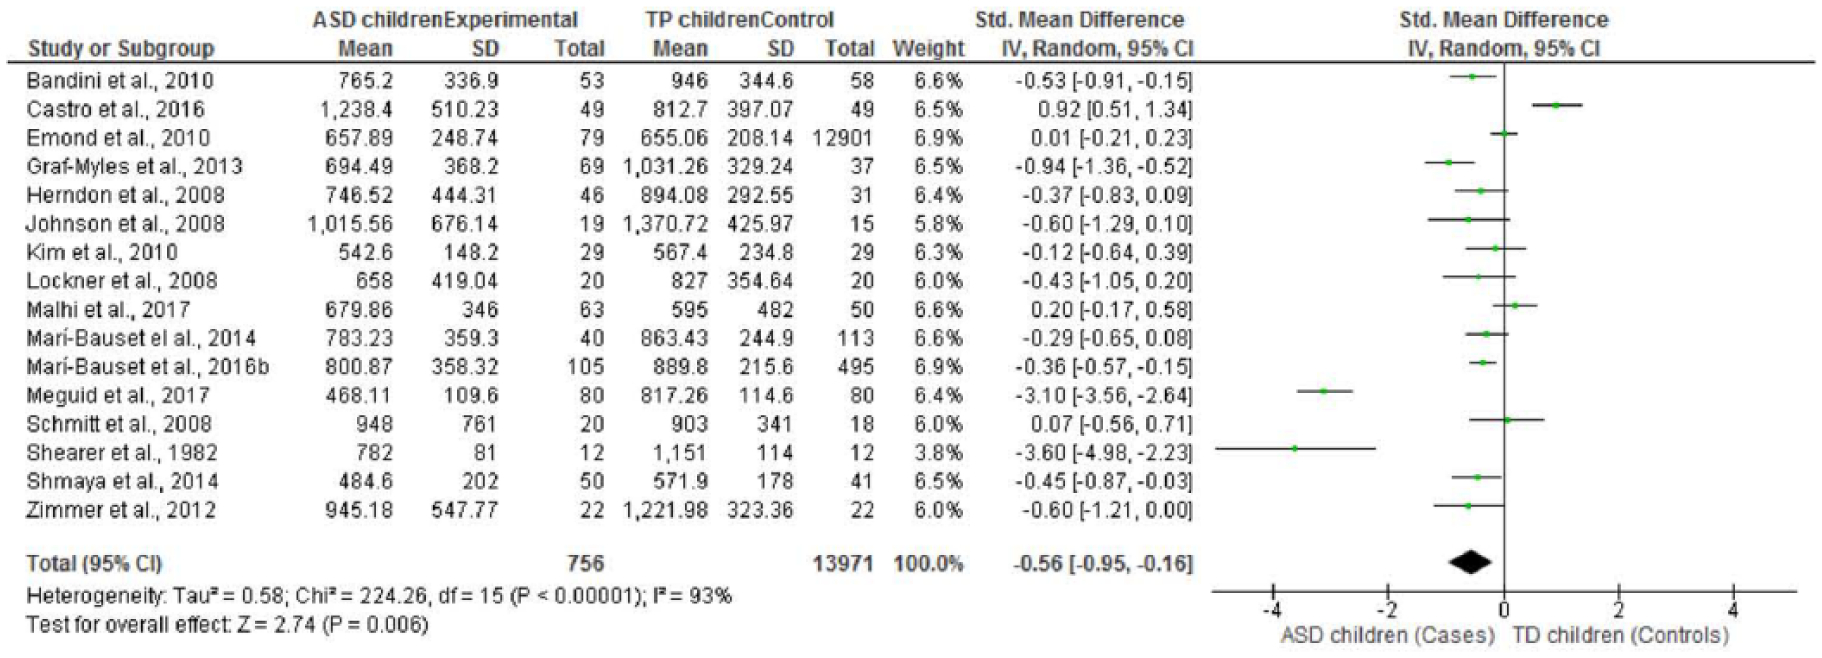
Forest plot of overall standardized mean difference in calcium intake between TD and ASD children.
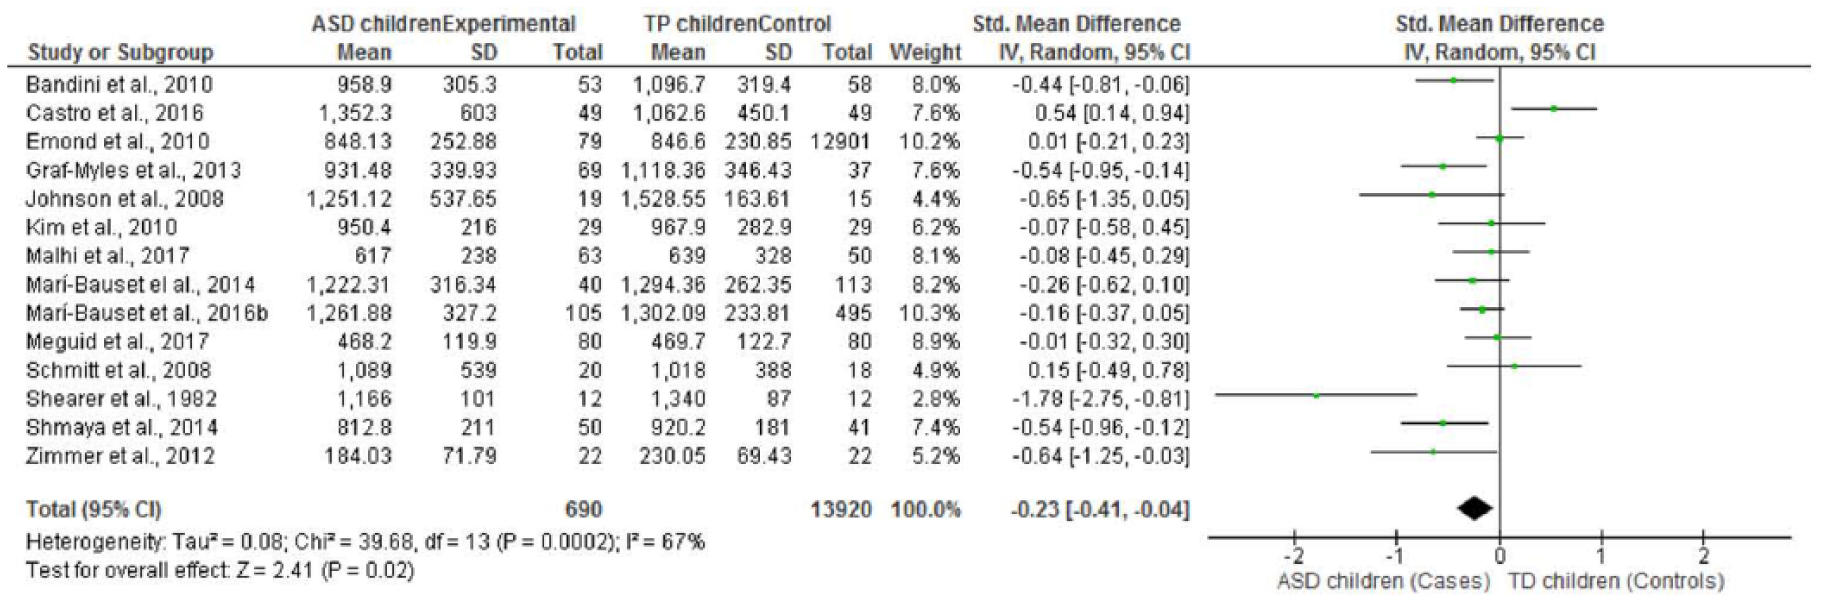
Forest plot of overall standardized mean difference in phosphorus intake between TD and ASD children.
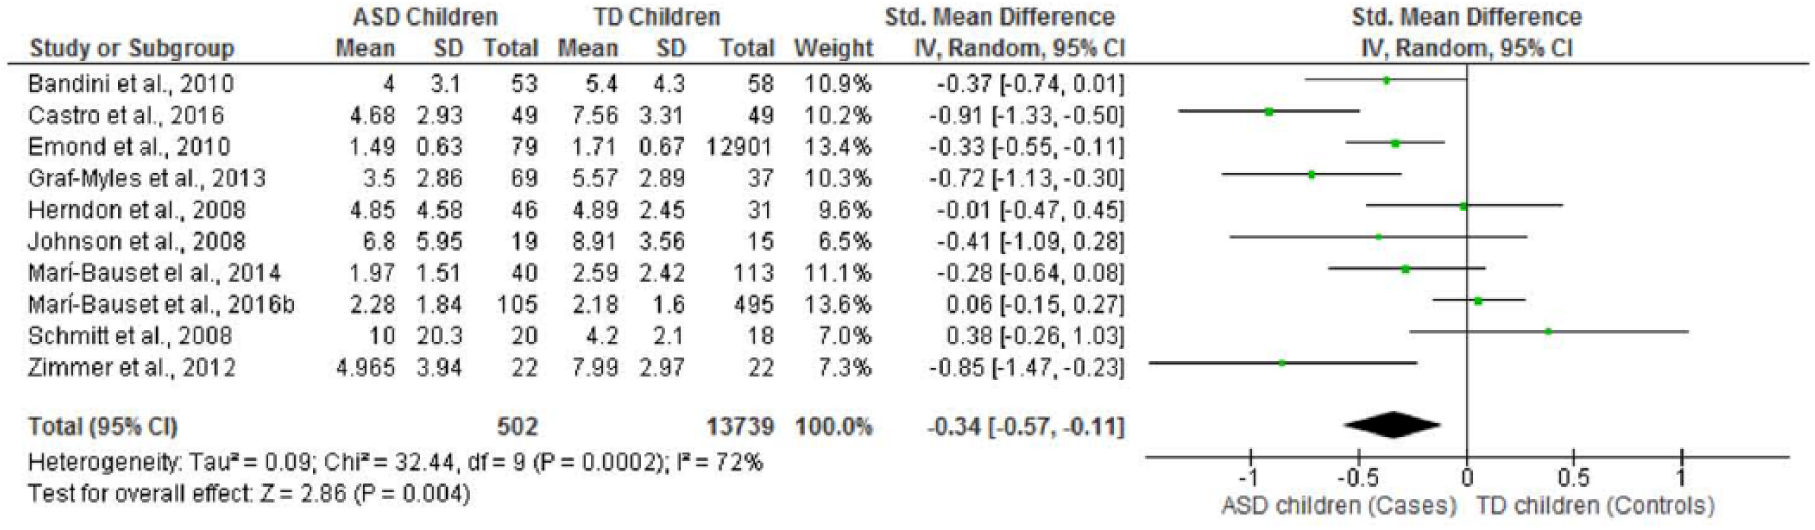
Forest plot of overall standardized mean difference in vitamin D intake between TD and ASD children.
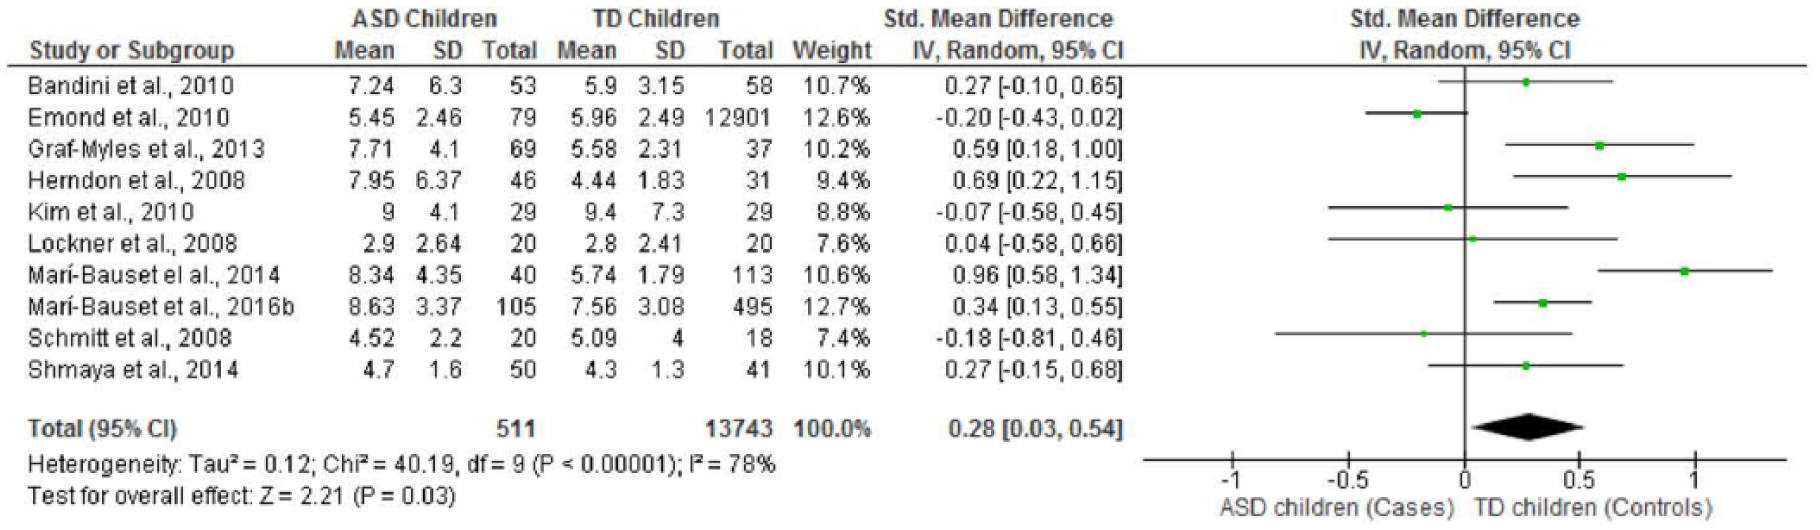
Forest plot of overall standardized mean difference in vitamin E intake between TD and ASD children.
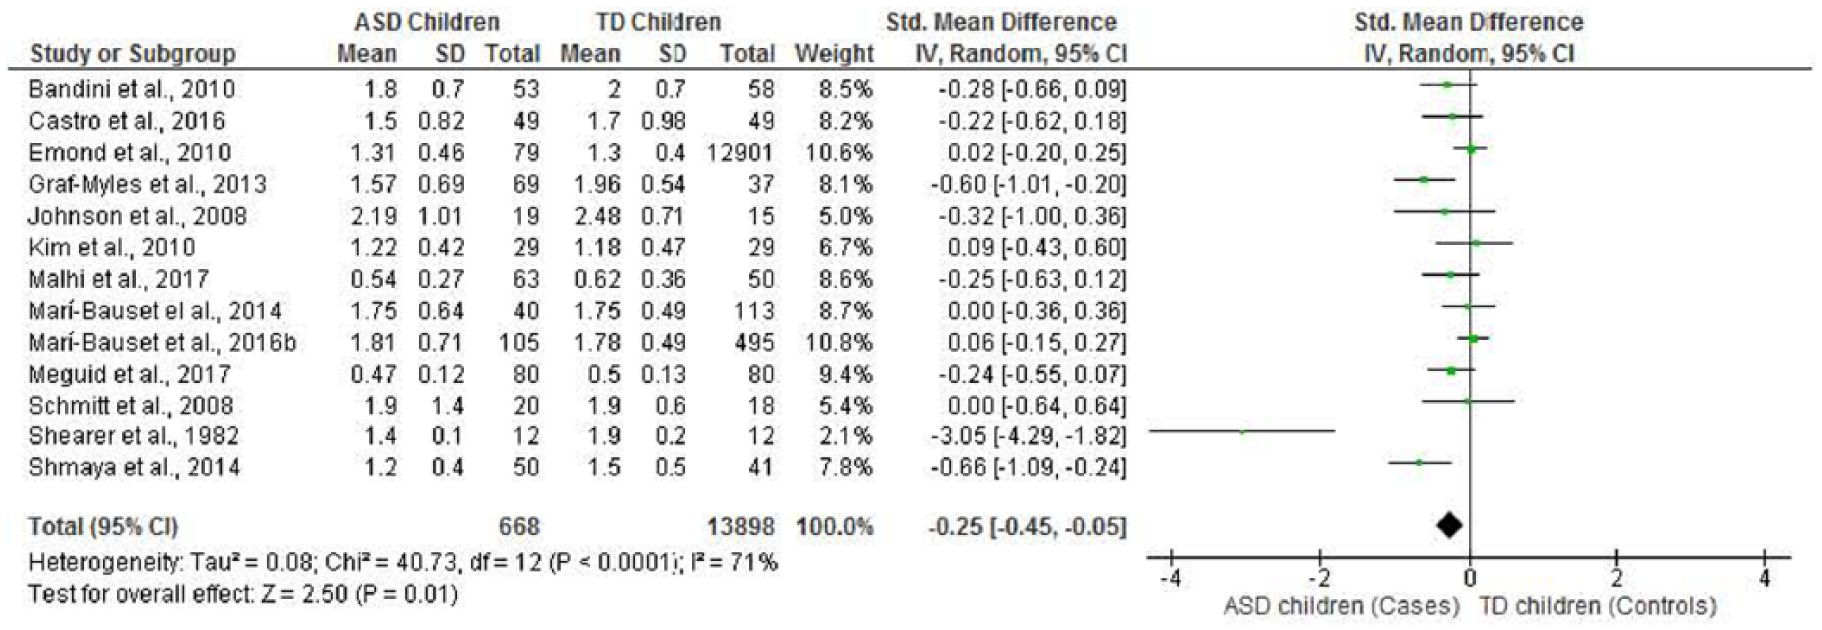
Forest plot of overall standardized mean difference in riboflavin intake between TD and ASD children.
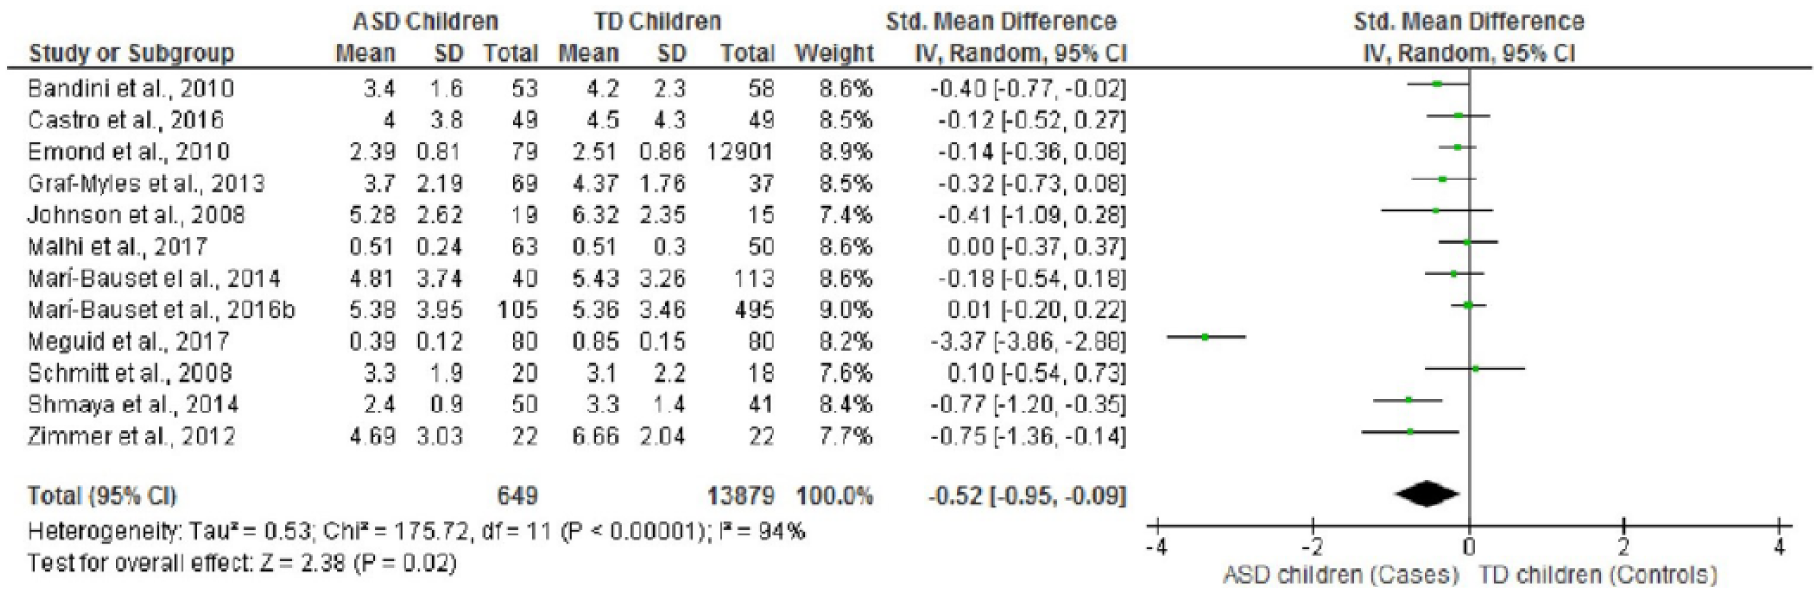
Forest plot of overall standardized mean difference in vitamin B12 intake between TD and ASD children.
Egger’s test for publication bias did not show any significant differences for any of the nutrients, with a value of p < 0.05 in all cases. A funnel plot was used to detect the studies that caused asymmetry. These studies were removed and new results were obtained. For nutrients with significant data, we observed a moderate or low heterogeneity between children with ASD and TD children for protein when we removed Liu et al. (2016) (−0.20 (−0.35, −0.04), I2 = 51%); for omega-3 (−0.20 (−0.38, −0.02), I2 = 0%) when we removed Castro et al. (2016) and Emond et al. (2010); for calcium (−0.26 (−0.41, −0.10), I2 = 43%) when we removed Meguid et al. (2017), Castro et al. (2016), Shearer et al. (1982) and Graf-Myles et al. (2013); for phosphorus (−0.26 (−0.41, −0.10), I2 = 43%) when we removed Castro et al. (2016) and Shearer et al. (1982); for vitamin D (−0.33 (−0.54, −0.13), I2 = 46%) when we removed Marí-Bauset et al. (2016a) and Castro et al. (2016); for vitamin E (0.30 (0.13, 0.47), I2 = 26%) when we removed Emond et al. (2010) and Marí-Bauset et al. (2015); for riboflavin (−0.18 (−0.32, −0.04), I2 = 44%) when we removed Shearer et al. (1982); and for vitamin B12 (−0.23 (−0.35, −0.08), I2 = 44%) when we removed Meguid et al. (2017). Some non-significant nutrients became significant after a sensitivity analysis: PUFA when Emond et al. (2010) was removed (0.27 (0.11, 0.44) I2 = 0%); selenium when Castro et al. (2016) and Emond et al. (2010) were removed (−0.29 (−0.44, −0.13), I2 = 0%); and for thiamine when Marí-Bauset et al. (2016a) was removed (−0.17 (−0.29, −0.05), I2 = 7%.).
No significant differences were found for energy, carbohydrates, total fats, SFA, MUFA, cholesterol, fibre, iron, zinc, magnesium, sodium, potassium, iodine, copper, vitamin A, vitamin C, vitamin K, niacin, pantothenic acid, vitamin B6 or folic acid (see Table 2, figures not shown).
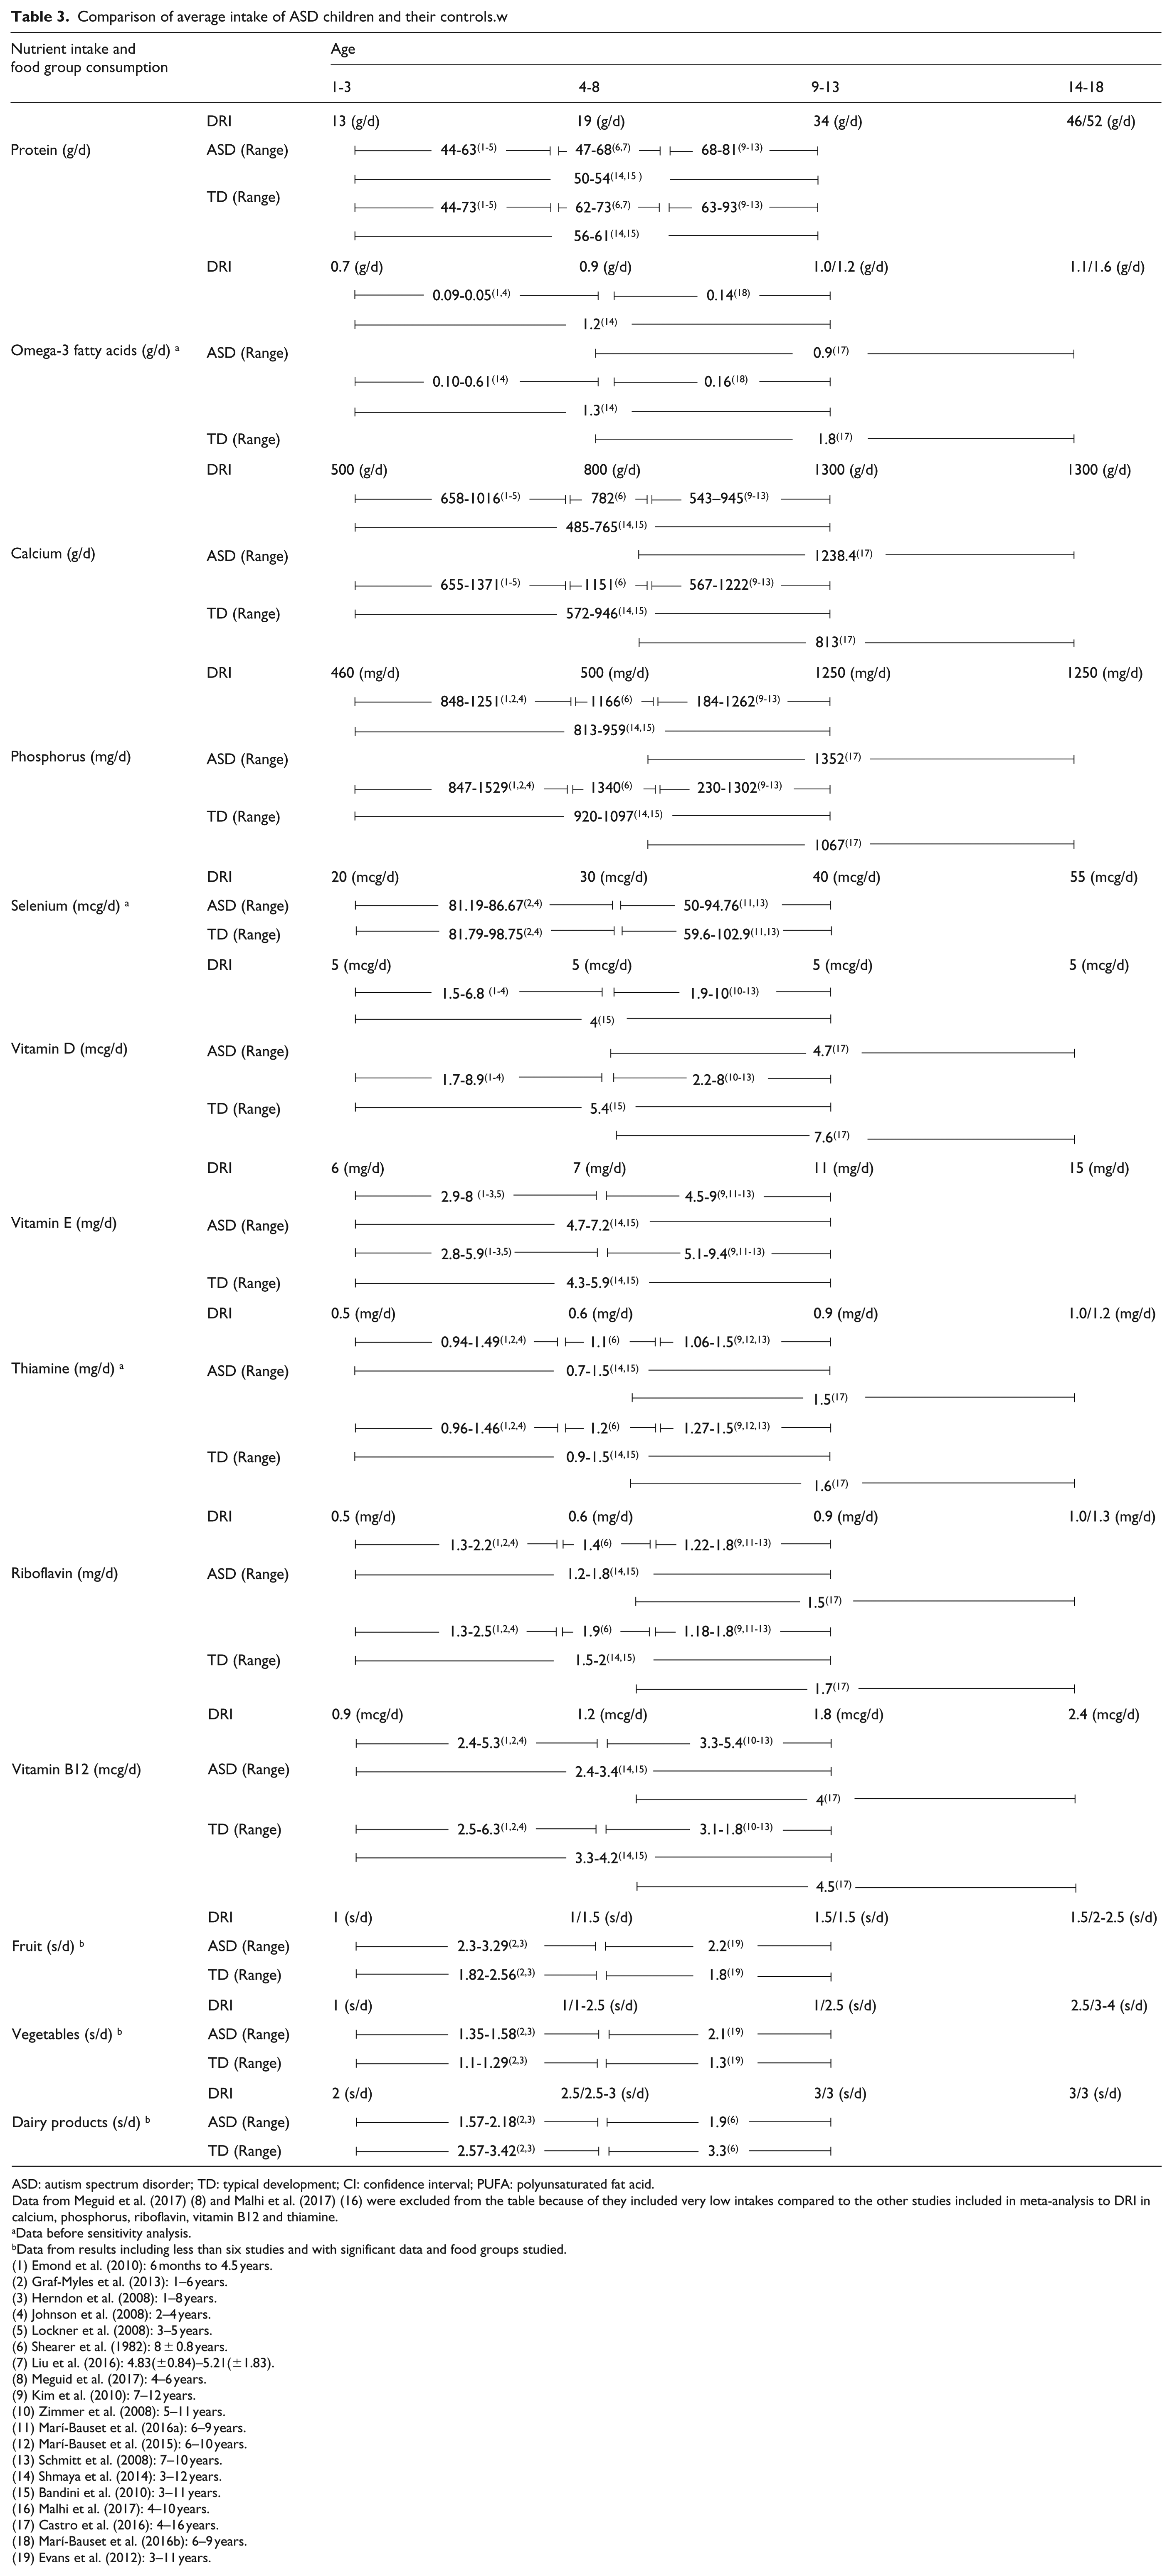
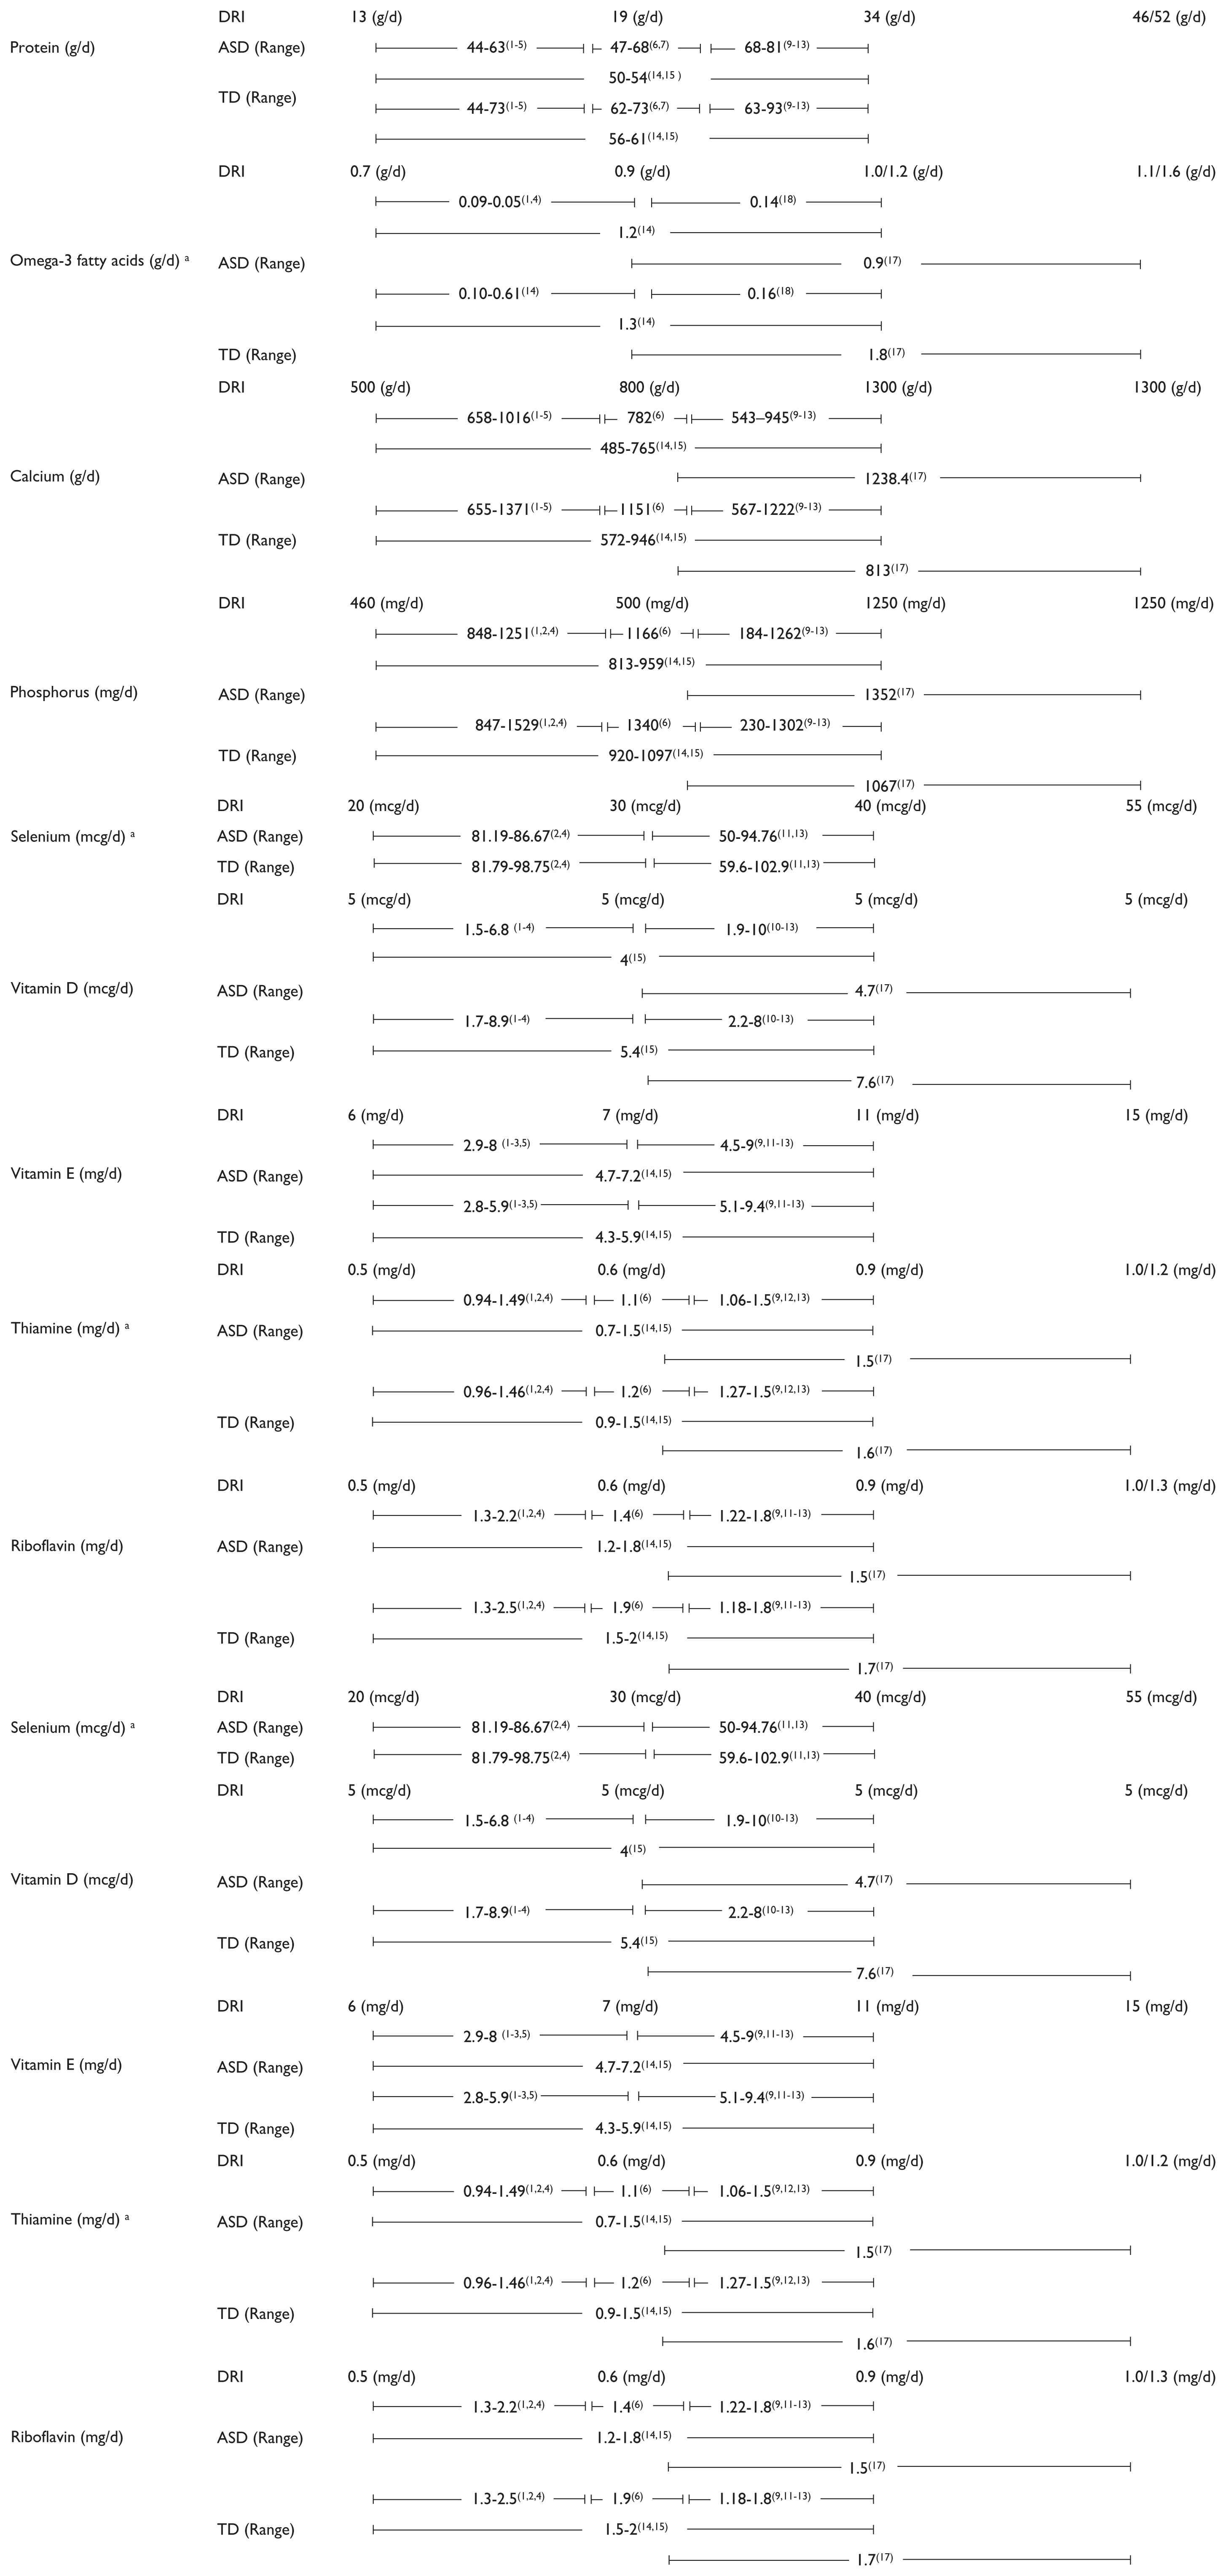
Table 3 shows the DRI by nutrient and age group, and the ranges of intake found in the different studies for children with ASD and TD children. In general, most autistic children of school age (4–13 years) showed a lower calcium and vitamin D intake with respect to recommendations. Omega-3 and vitamin E intake were, for some studies, also lower than recommended; however, TD children also showed a tendency towards a lower intake of these nutrients. However, most of the studies found that children with ASD had an adequate intake of protein, phosphorus, vitamin E, riboflavin, vitamin B12, selenium and thiamine. Protein intake was two to three times higher than recommended. In relation to food groups, autistic children had an adequate fruit and vegetable consumption, which in fact was higher than TD children. Nevertheless, the consumption of dairy products was lower than recommendations for children with ASD, but adequate for TD children.
Comparison of average intake of ASD children and their controls.w
ASD: autism spectrum disorder; TD: typical development; CI: confidence interval; PUFA: polyunsaturated fat acid.
Data from Meguid et al. (2017) (8) and Malhi et al. (2017) (16) were excluded from the table because of they included very low intakes compared to the other studies included in meta-analysis to DRI in calcium, phosphorus, riboflavin, vitamin B12 and thiamine.
Data before sensitivity analysis.
Data from results including less than six studies and with significant data and food groups studied.
(1) Emond et al. (2010): 6 months to 4.5 years.
(2) Graf-Myles et al. (2013): 1–6 years.
(3) Herndon et al. (2008): 1–8 years.
(4) Johnson et al. (2008): 2–4 years.
(5) Lockner et al. (2008): 3–5 years.
(6) Shearer et al. (1982): 8 ± 0.8 years.
(7) Liu et al. (2016): 4.83(±0.84)–5.21(±1.83).
(8) Meguid et al. (2017): 4–6 years.
(9) Kim et al. (2010): 7–12 years.
(10) Zimmer et al. (2008): 5–11 years.
(11) Marí-Bauset et al. (2016a): 6–9 years.
(12) Marí-Bauset et al. (2015): 6–10 years.
(13) Schmitt et al. (2008): 7–10 years.
(14) Shmaya et al. (2014): 3–12 years.
(15) Bandini et al. (2010): 3–11 years.
(16) Malhi et al. (2017): 4–10 years.
(17) Castro et al. (2016): 4–16 years.
(18) Marí-Bauset et al. (2016b): 6–9 years.
(19) Evans et al. (2012): 3–11 years.
Discussion
This meta-analysis describes a dietary pattern in children with ASD characterized by a lower intake of proteins, minerals such as calcium, phosphorus and selenium, and important groups of vitamins, such as vitamins D and B, and omega-3 fatty acids, in comparison to TD children. However, intake of vitamin E and PUFA was found to be higher than in TD children. Autistic children in this study showed a higher consumption of fruit and vegetables than TD children.
The meta-analysis followed the MOOSE (Stroup et al., 2000) and PRISMA (Moher et al., 2009) guidelines at the beginning of the publication search, which was then completed by complementary manual screening, including all data published up to November 2017. Evidence of an apparent increase in new ASD cases in recent years has also led to increased scientific interest in this topic, and thus, the current published articles about dietary intake and ASD show a greater homogenization in study methodologies. The studies included in the present analysis made up a large sample size (15,079 participants), and included studies carried out in the United States, Europe, Africa, South America, Asia and the Middle East, which gives robustness to the results of our analysis. A comparison of our study with the most recently published meta-analysis (Sharp et al., 2013) shows that the present analysis includes a higher number of publications (10 publications more), covers previously excluded geographical areas (Southern Europe, Asia and the Middle East) and includes a greater number of nutrients and several food groups. These new inclusions have not only confirmed the lower protein and calcium intake in children with ASD found by Sharp et al. (2013) but also identified significant differences between autistic children and non-autistic children groups regarding eight nutrients (phosphorus, selenium, vitamin D, E, thiamine, riboflavin, vitamin B12 and omega-3 fatty acids) and other food groups (fruits and vegetables) (see Table 2).
Protein intake was lower in the group of autistic children than in the TD group; however, both groups had a much higher intake than recommended (IOM, 2000). In addition, some authors who were not included in the meta-analysis because they did not fulfil our study selection criteria found similar results in children with ASD (Bicer and Alsaffar, 2013; Bowers, 2002; Cornish, 1998; Hyman et al., 2012; Levy et al., 2007; Xia et al., 2010). The high protein intake in the children with ASD is related to the consumption of animal products as Sadowska and Cierebij (2011) reported. Although we were unable to obtain data on the protein food group in the present meta-analysis, we believe that it comes from the meat, since children with ASD usually consume lower amounts of fish than TD children (Hertz-Picciotto et al., 2010; Marí-Bauset et al., 2015). The low fish consumption is related to the low intake of omega-3 fatty acids. When we compared the omega-3 intake of the two groups, the group of autistic children had a significantly lower intake of omega-3 fatty acids than TD children. However, we should be cautious about interpreting this, because in this meta-analysis, a higher heterogeneity (I2 = 75%) was found and only 5 studies could be included, while at least 6 are required for a correct interpretation (Fu et al., 2011; Higgins et al., 2011). Omega-3 and omega-6 deficiencies affect brain function and cell neuroinflammation from early neurologic development phases (Gumpricht and Rockway, 2014; Marí-Bauset et al., 2016b). An omega-3 fatty acid supplementation has been mentioned by some authors as helping to improve the ASD symptomatology (Gumpricht and Rockway, 2014; James et al., 2011). A recent meta-analysis of randomized controlled trials (Cheng et al., 2017) found an improvement in social withdrawal, stereotyped patterns of behaviour and hyperactivity in children with ASD who were supplemented with omega-3.
Comparing the micronutrient intake between groups showed that children with ASD had a lower intake of minerals, such as phosphorus and selenium and vitamins such as thiamine, riboflavin and B12, than TD children. However, in all cases, intake was higher than recommended (IOM, 2000), and therefore, there is no risk of deficiency of these micronutrients in this population. We did not find the intake of phosphorus to be lower than recommendations, in contrast to data referenced by other authors (Cornish et al., 1998; Sadowska and Cierebij, 2011). For selenium, riboflavin, thiamine and vitamin B12 intake, the meta-analysis data do not support the findings of Cornish et al. (1998), Vogelaar (2000), Andrew and Sullivan (2010), Hyman et al. (2012) or Al-Farsi et al. (2013), which suggested a possible deficiency of these nutrients in children with ASD. However, other authors have reported an adequate intake of riboflavin and thiamine (Hyman et al., 2012; Xia et al., 2010).
The meta-analysis data also showed a lower intake in calcium and vitamin D in children with ASD in comparison to TD children and compared to the DRI. Other studies have also reported an inadequate intake in calcium (Bicer et al., 2013; Hyman et al., 2012; Xia et al., 2010 and Sadowska and Cierebij, 2011) as well as in vitamin D (Hyman et al., 2012; Saad et al., 2015; Sadowska and Cierebij, 2011 and Cornish et al., 1998) in subjects with ASD. However, in the present meta-analysis, the lower intake of vitamin D and calcium was mainly shown in school aged children (4–13 years), and the younger children had an adequate intake. A persistently low intake could lead to certain health disorders related to bone and dental tissue development, immune function, muscle receptors, arterial pressure, nerve functioning or basal insulin secretion (Hines et al., 2010). The lower intake of these two micronutrients might be related to a lower consumption of dairy products. In our study, we also found that children with ASD have a tendency to consume less dairy products than TD children (p = 0.06), which is supported by other studies (Graf-Myles et al., 2013; Herndon et al., 2009; Marí-Bauset et al., 2016a and Shearer et al., 1982). In addition, in this meta-analysis children with ASD, in contrast to TD children, consumed less dairy products than recommended in food guidelines (USDA, 2016). Low consumption of dairy products among autistic children might be due to the widely known hypothesis that milk can aggravate symptoms of autism because of the casein protein, which turns into opioid β-casomorphin-7 (BMC-7, an opioid peptide) in the gut. Although the BMC-7 biological function is not clear, it might have an influence on the gastrointestinal, immunological and nervous systems. Children with ASD might have higher intestinal permeability (De Magistris et al., 2010) and an alteration in the dipeptidyl peptidase IV enzyme (DPPIV), which is involved in β-casomorphin-7 metabolism (Reichelt et al., 1991). The peptide could cross the blood–brain barrier and reach the central nervous system, causing changes in the child’s behaviour and worsening symptoms of autism (Cieślińska et al., 2015). Although this hypothesis has not been sufficiently corroborated, we could speculate that some parents might not offer their children with ASD a sufficient dairy intake due to professional advice and the popularity of gluten-free and casein-free diets (GFCF) (Bicer and Alsaffar, 2013).
We also analysed fruit and vegetable consumption, which was reported in only three studies. We found a significantly higher consumption in children with ASD in comparison to TD children. Marí-Bauset et al. (2016a) also found that autistic children had a higher consumption of vegetables than TD children. Children with ASD in our meta-analysis showed a higher than average fruit consumption and an adequate vegetable consumption in relation to the food guidelines (USDA, 2016). Some authors added details about vegetable consumption in autistic children, finding that children with ASD prefer simple carbohydrates more than complex ones like vegetables and fruit (Cornish, 1998; Ho and Eaves, 1997; Williams et al., 2005). Although more studies are needed to clearly determine the consumption level of these food groups in this population, it should be remembered that a diet rich in fruit and vegetables in children with ASD is a healthy eating pattern due to the vitamins and fibre content of these foods.
Finally, children with ASD showed a higher intake of vitamin E compared to TD children; however, their intake was inappropriately low in our study and in some studies for both autistic and TD children according to DRI. This finding was also reported by Hyman et al. (2010) who found a low intake in both groups and most of the TD children didn’t achieve the recommendations. However, Xia et al. (2010) reported an adequate intake in both groups. Deficiency in vitamin E is usually related to a low intake of other macronutrients (especially fatty acids) and has been reported in cases of severe malnutrition, malabsorption syndromes and genetic disorders, such as mutation in proteins like the α-tocopherol transfer protein, which transports α-tocopherol (vitamin E) through the hepatocyte, or in apolipoprotein B, which carries lipoproteins to all body cells (Traber, 2014). This vitamin is essential for the integrity and good functioning of the muscular, reproductive, circulatory, nervous and immune systems (Bielsalski, 2009; Traber, 2014).
Our meta-analysis has some limitations. First, when we compared the intake and consumption to the recommendations, we used American references. We have to take into account that every country has and uses their own recommendations because of the variety of food available and also differences in population demographics.
Another difficulty might be the fact that the nutritional data were collected exclusively by the parents and were not verified by the children themselves, so they might not have been recorded accurately. Not having direct information from the children might cause a small bias in the results. Another limitation was that the various studies grouped the foods according to different criteria and described consumption in terms of either servings or grammes, which causes problems during the data analysis process and prevents, for example, evaluating the meat and fish or cereals groups. However, in the vast majority of cases, it was possible to assess the fruit, vegetable and dairy product food groups. Only a few authors studied the relationship between children with ASD and TD children regarding food groups and the consumption of essential fatty acids. Some authors have reported that the data from at least six studies are required for a meta-regression (Fu et al., 2011; Higgins et al., 2011); therefore, analyses with a lower number of studies might only provide weak evidence.
Finally, even though some studies found that children with ASD improve their feeding habits with age (Bandini et al., 2010; Mascola et al., 2010), we could not study how age impacted on our results because studies used different population samples.
Conclusion
Children with ASD in this meta-analysis showed a significantly lower intake of protein, calcium, phosphorus, selenium, vitamin D, thiamine, riboflavin and vitamin B12 and a significantly higher intake of PUFA and vitamin E in comparison to TD children. In contrast to the hypothesis, we found a higher fruit and vegetable consumption in the group of autistic children from among the food groups, although these results should be viewed with caution because they are based on a very limited number of studies. Likewise, the data on lower omega-3 intake must also be considered with care due to high data heterogeneity and the low number of studies analysed. According to the DRI recommendations, children with ASD might be at risk of a deficient intake of calcium, vitamin D and dairy; however, in general, they showed an adequate intake of protein, phosphorous, riboflavin, B12, thiamine, selenium, fruit and vegetables.
Future studies with larger samples are needed to determine whether there are differences in the intake of other nutrients and to identify possible deficiencies. Future research could include the study of food group consumption and differences in dietary variety and food selectivity between ages, which could give us a more overall view of the food consumption of these children.
Supplemental Material
AUT794179_Lay_Abstract – Supplemental material for Differences in food consumption and nutritional intake between children with autism spectrum disorders and typically developing children: A meta-analysis
Supplemental material, AUT794179_Lay_Abstract for Differences in food consumption and nutritional intake between children with autism spectrum disorders and typically developing children: A meta-analysis by Patricia Esteban-Figuerola, Josefa Canals, José Cándido Fernández-Cao and Victoria Arija Val in Autism
Footnotes
Acknowledgements
The authors thank all research groups and authors that provided the data from their studies. The authors also thank Ana Lorente and Sara Siles for their help in this manuscript and all our co-workers for their general support.
Declaration of conflicting interests
The author(s) declared no potential conflicts of interest with respect to the research, authorship and/or publication of this article.
Funding
The author(s) received no financial support for the research, authorship and/or publication of this article.
References
Supplementary Material
Please find the following supplemental material available below.
For Open Access articles published under a Creative Commons License, all supplemental material carries the same license as the article it is associated with.
For non-Open Access articles published, all supplemental material carries a non-exclusive license, and permission requests for re-use of supplemental material or any part of supplemental material shall be sent directly to the copyright owner as specified in the copyright notice associated with the article.