






Abstract
Stakeholders within autism spectrum disorder communities use Twitter for specific purposes. The goal of this study was to characterize patterns and themes of tweet content and sentiment and intercommunications between users sending and retweeting content to their respective user networks. The study used cross-sectional analysis of data generated from Twitter. Twitter content, sentiment, users, and community networks were examined from a sample of tweets with the highest Twitter reach and the lowest Twitter reach. Results indicate that Twitter content from both samples was primarily related to empowerment and support. Differences between the number of tweets originating from an individual in the lowest reach sample (i.e. 41%) as compared to the individuals in the highest reach sample (i.e. 18%) were noted. The number of users belonging to an advocacy subcommunity was substantially larger than a clinical and research subcommunity. Results provide insight into the presuppositions of individuals with autism spectrum disorder, their families and significant others, and other stakeholders.
Introduction
In the United States, 1 in 59 children had a diagnosis of autism spectrum disorder (ASD) by the age of 8 years in 2014, which is a 15% increase over 2012 (Baio et al., 2018). The rise in the diagnoses rate in ASD has led to more investment in research funding and dissemination of information. To maximize the impact of research and provide patient/family-centered outcomes, it is important to match the values and perspectives of the ASD community with researchers and professionals (Pellicano & Stears, 2011; Pellicano et al., 2014). One strategy to understand the values and beliefs of stakeholders engaged in ASD is to examine how they use social media to share ideas. Significant increases in the amount of online information devoted to ASD is reported, and approximately 80% of adults with ASD use popular social media platforms (Mazurek, 2013; Reichow et al., 2012). Examinations of Twitter references to ASD may provide direction on how to use social media as a tool to understand stakeholder perceptions, correct misinformation, provide management, and share resources.
Twitter (https://twitter.com/) is an interactive microblogging and social media platform established in 2006. Twitter allows users to create and distribute a small message (i.e. tweets) with or without multimedia. Tweets were originally restricted to 140 characters but were doubled to 280 characters. This limitation in terms of characters sets Twitter apart from other social media platforms such as Facebook or Instagram. Moreover, Twitter users tend to be younger with particular political orientation, although the Twitter userbase is much smaller when compared to Facebook or Instagram. Registered users can post, like, and retweet tweets which are accessible by only registered users. Twitter users can also interact with other users by mentioning other users in their post and/or by sending private messages to them. Many tweets are marked with hashtags which represents the tweet’s meaning, mainly including its topics or ideas (Efron, 2010). Twitter data can be used to understand unique populations through analysis of content of tweets, volume of tweets about specific topics, engagement of Twitter users with tweets, and network analyses of tweets. Public health researchers have begun to use Twitter for research purposes, both to interact with targeted populations and to mine the platform for data (Sinnenberg et al., 2017; Pershad et al., 2018).
Emerging work regarding the use of Twitter as related to ASD indicates that information can be uncovered through data-mining of tweets. Beykikhoshk et al. (2015) compared ASD-related tweets with non-ASD-related tweets and identified differences in the types of words used. Of interest, the words “son” and “boy” occurred with higher frequency than “female” and “girl.” Hswen et al. (2019) examined the feasibility of using Twitter as a platform to enhance the diagnosis of ASD. The authors extracted Twitter data from individuals who self-identified with ASD and analyzed text content and timing of tweets. Results indicated emotional patterns consistent with the diagnosis of ASD in the set of tweets from individuals who self-identify as compared to a control set. The authors concluded that social media, such as Twitter, may capture unique information that may augment diagnostic processes. Saha and Agarwal (2016) examined social support on online ASD communities. Data were extracted from popular ASD bloggers active in blogs and Twitter. The content of tweets was analyzed using the Linguistic Inquiry and Word Count (LIWC) program (Pennebaker et al., 2001) to identify emotional writing. Results indicated that the ASD community provides significant social support to its members both in Twitter and blogs.
Clearly, individuals with ASD reveal information on Twitter about their values and perceptions through their use of words and emotional stance. This study extends previous work because it examines patterns and themes of ASD-related tweet content as well as intercommunications between users sending tweets and retweeting (i.e. forwarding) the content to their respective user networks. As such, a broad scope of topics and users were included. Specifically, research questions included: (a) What type of content related to ASD is shared via Twitter? (b) What is the sentiment of content related to ASD shared via Twitter? (c) What type of users employ Twitter to share ASD-related content? and (d) In what types of communities are users clustered?
This study belongs to an emerging area of research on health informatics (Eysenbach, 2000, 2002). One aim of this research is to evaluate the information that is shared and consumed from varying points of view. Examining information on social media, specifically Twitter, may help us understand knowledge, attitudes, and behaviors of stakeholders within ASD communities (Eysenbach, 2009, 2011). In turn, this may help in developing and distributing appropriate and evidence-based ASD-related information.
Method
The study used a cross-sectional analysis of data generated from Twitter. The study design was inspired by a recent study on hearing loss (Crowson et al., 2018). The study was deemed exempt from review by the Lamar University IRB since all information was publicly available.
Data extraction
In this study, we used Twitter Archiving Google Sheet (TAGS version 6.1; available at: https://tags.hawksey.info) to obtain the Twitter tweets of interest. TAGS samples Twitter tweet data in real time using user-defined hashtag search terms over a defined period and logs them in a Google spreadsheet for data analysis. We sampled Twitter tweets using the hashtags: #autism and #autismspectrumdisorder. These tags were chosen to include a broad scope of topics related to a specific area of interest. Prior to selecting these hashtags several key words of tweet collections were predefined (e.g. person with autism, person with ASD, student with autism, adult with autism, autism, autismspectrumdisorder). Tweets containing those key words were collected over the study period. Of those keywords, ones other than “autism” and “autismspectrumdisorder” were excluded due to a low number of tweets (less than 50,000) in 3 months. Also, batch tests were conducted over a 2-week collection process and tweets that included “ASD” were found to be a subset of tweets using #autism.
We sampled Twitter tweets from 15 May 2018 to 15 August 2018. During this time, we archived 1,455,723 tweets, and approximately 24.78% of them were original tweets (i.e. 360,606). After identifying and sampling the tweets, TAGS extracted the following information about each tweet: user-provided geographic identifier, tweet text and associated hashtags, tweet time, user language, and user follower count.
Data analysis
The data analyses were guided by recent Twitter studies (Crowson et al., 2018; Murthy & Eldredge, 2016). The data analyses were focused on tweet content and sentiment, tweet reach, temporal trends, user activity, and social network trends. Tableau (Tableau Software Inc., Seattle, WA, USA) and Gephi (Gephi version 0.9.1; available at: https://gephi.org/) software were used to visualize and aggregate Twitter data.
Twitter content and sentiment
To answer the first question related to type of content, we utilized qualitative content analysis to examine samples of tweets (Hsieh & Shannon, 2005). Since there are no clear methodologies for sampling tweets, we modified the process used by Chew and Eysenbach (2010). We chose our sample size based on feasibility and determined that 10 tweets with the highest reach per day (i.e. 91 days = 910 tweets) and 10 tweets with lowest reach per day (i.e. 91 days = 910 tweets) would be sufficient to capture data to have a “snapshot” of information shared among users. Tweet reach (i.e. size of the user population that a given user can reach) was calculated by the number of followers, assuming 10% of followers were simultaneously online when the tweet was sent.
To identify any events that may have influenced content on a particular date or time period, tweet volumes were tabulated and mapped to examine longitudinal trends over the study period. Two notable decreases and increases were identified. First, there was a significant decrease during the period from 3 to 4 July. We hypothesized this may be because a large number of tweets relative to Independence Day in the United States were posted. Second, on 8 August, there was an online petition proposed with the content “Petition to make #ARMYISBEAUTY.” This twitter account is related to Korean pop music (Kpop) and has over 1 million members expressing their love for this music genre. The account had an ASD tag, so the Kpop twitter community wanted to change the tag so that they “don’t mess with the ppl {people}looking for tweets related with Autism Spectrum Disorder.” It was passionately supported by Twitter users to retweet it. Consequently, tweets from 8 August were not included in the analyses since we determined they were outliers, and not a part of a representative sample.
Once the samples were comprised, preliminary coding of 100 tweets from each sample with the highest reach and lowest reach provided the initial codes. Upon review and discussion by two coders, including the first author, codes were developed. Codes for tweets from the highest reach and lowest reach samples included the following:
Empowerment/Support: This refers to content describing issues or events related to empowerment of individuals with ASD or community support.
Treatment: This refers to information about treatment and management associated with ASD.
Complimentary treatment: This refers to information about treatments that are undertaken instead of usual or proven treatments or in addition to usual or proven treatments (e.g. pet therapy).
Vaccine misinformation: This refers to misinformation about vaccines, specifically that vaccinations cause ASD.
Vaccines: This refers to current, credible information about vaccines.
Media: This refers to information shared related to books, movies, and celebrities associated with ASD.
Civil issues: This refers to civil issues related to ASD, specifically missing person reports or criminal activity.
Gender: This refers to references about gender in relation to ASD.
Causes misinformation: This refers to misinformation about causes not related to vaccination.
Causes: This refers to current, credible information about causes of ASD.
Symptoms: This refers to symptoms of ASD.
Fundraising: This refers to organizational and personal fundraising.
Race: This refers to references about race in relation to ASD.
Research: This refers to recruitment for research studies or calls for research.
Diagnosis: This refers to references related to identification of ASD.
Personal impact: This refers to statements of the personal impact of ASD on self and family.
Following development of the codes, the two coders continued to code the subsequent tweets (k = 910) from each sample (i.e. highest and lowest reach) and discuss tweets that needed deliberation and consensus. Per Chew and Eysenbach (2010) where multiple qualifiers were present within a tweet, all applicable qualifiers were used. Neutral or ambiguous statements were not coded. Tweets were categorized as misinformation if the tweet was not categorized as a joke and was unsubstantiated by U.S. reference standards (i.e. Centers for Disease Control (CDC), American Academy of Child and Adolescent Psychiatry (AACAP), National Institutes of Health). Tweets were excluded if the tweet was not in English, unrelated to ASD, or illegible.
Manually coded video content was converted into multiple binary variables (i.e. coded as 0 if video did not include information about a specific category and coded as 1 if the video did present information about a specific category). Interclass correlation coefficient (ICC) was performed to examine the inter-rater reliability for coding of content categories. A random sample of 20% of the tweets from each sample were analyzed. A significance level of 0.05 was used for interpretation of results. ICC for content analysis of tweets with lowest reach ranged between 0.77 and 1 and for tweets with highest reach ranged between 0.72 and 1, suggesting high degree of reliability between the raters.
Next, a sentiment analysis and language style analysis of the sample was conducted using the LIWC (2015; Pennebaker et al., 2015; Tausczik & Pennebaker, 2010). With regard to online information in ASD, LIWC has been used primarily to investigate blogs posted by individuals who identify with ASD (Nguyen et al., 2015). LIWC is an automatic text analysis program that counts and calculates the percentage of words in the text that match various emotional, cognitive, structural, and process dimensions. LIWC provides a lexicon-based sentiment analysis by measuring emotions. We measured positive emotion, negative emotion, anxiety, anger, and sadness dimensions. In addition, language style analysis was completed through the calculation of words categorized as analytic (i.e. demonstrates formal thinking), clout (i.e. demonstrates authority, confidence, and leadership), authenticity (i.e. demonstrates intimacy and honesty), and tone (i.e. demonstrates both positive and negative emotion).
Twitter users and communities
The top 100 most active Twitter accounts were identified. The most active Twitter accounts refer to Twitter users who posted the most tweets over the study period, including retweet, original tweet and @mention tweet. After that, twitter user profiles were retrieved and manually categorized. User accounts were first classified as either belonging to an individual or to an organization. User accounts classified as organization were subdivided into commercial/for profit, non-profit, clinical (i.e. belonging to specific provider clinics), academic (i.e. belonging to academic hospitals and/or universities), and other. Individual accounts were classified as individuals with autism, significant others of individuals with ASD, and other. We classified individuals with autism and their significant others when they openly shared this information. Those who did not declare were assigned the “other” category. The virtual ASD community was mapped using the open source network visualization software (i.e. Gephi). The Gephi software maps nodes (i.e. Twitter users) and edges (i.e. followers).
Results
Twitter content and sentiment
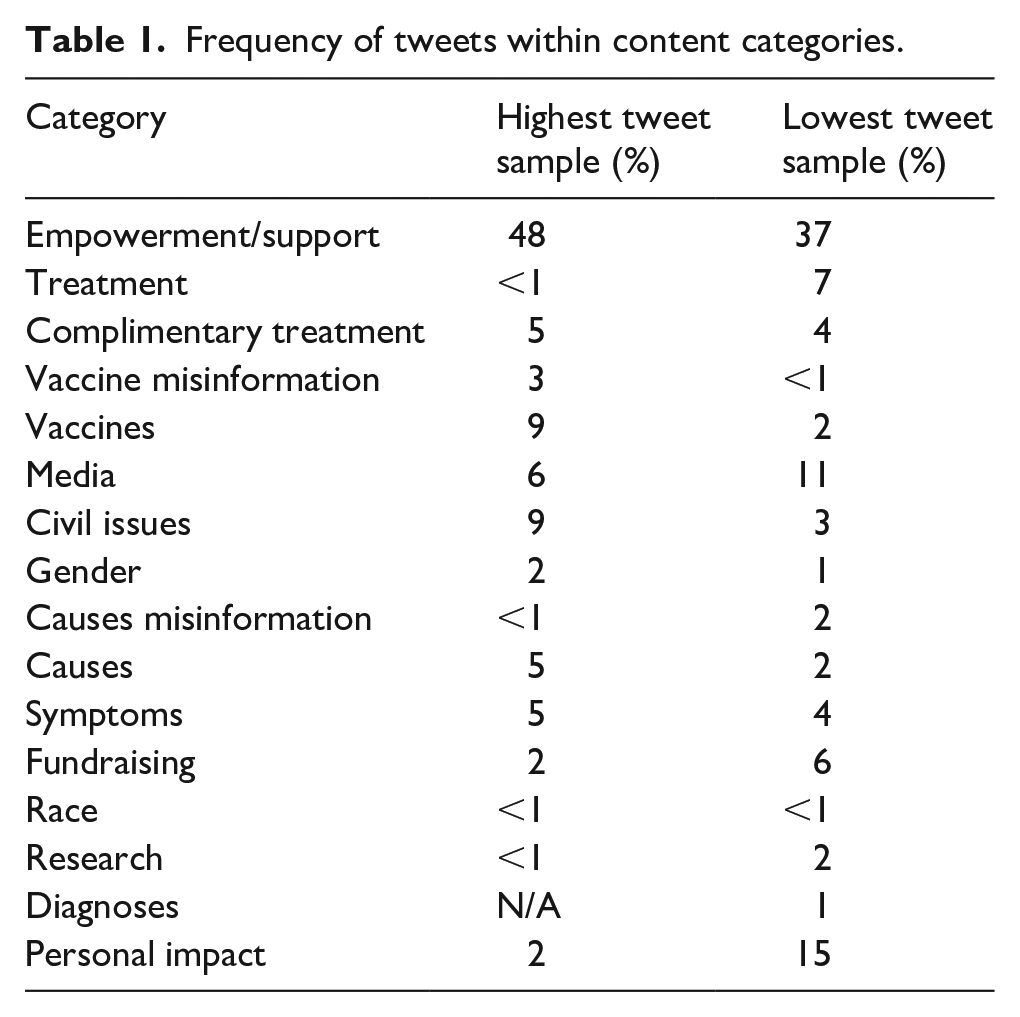
The 10 tweets per day with highest and lowest tweet reach (i.e. size of the user population that a given user can reach) were extracted for content analysis (see Table 1). Tweet reach was calculated by the number of followers, assuming 10% of followers were simultaneously online when the tweet was sent. The language style and sentiment of each sample were analyzed using the LIWC software (see Tables 2 and 3).
Frequency of tweets within content categories.
Descriptive statistics of LIWC analysis for the highest reach sample.
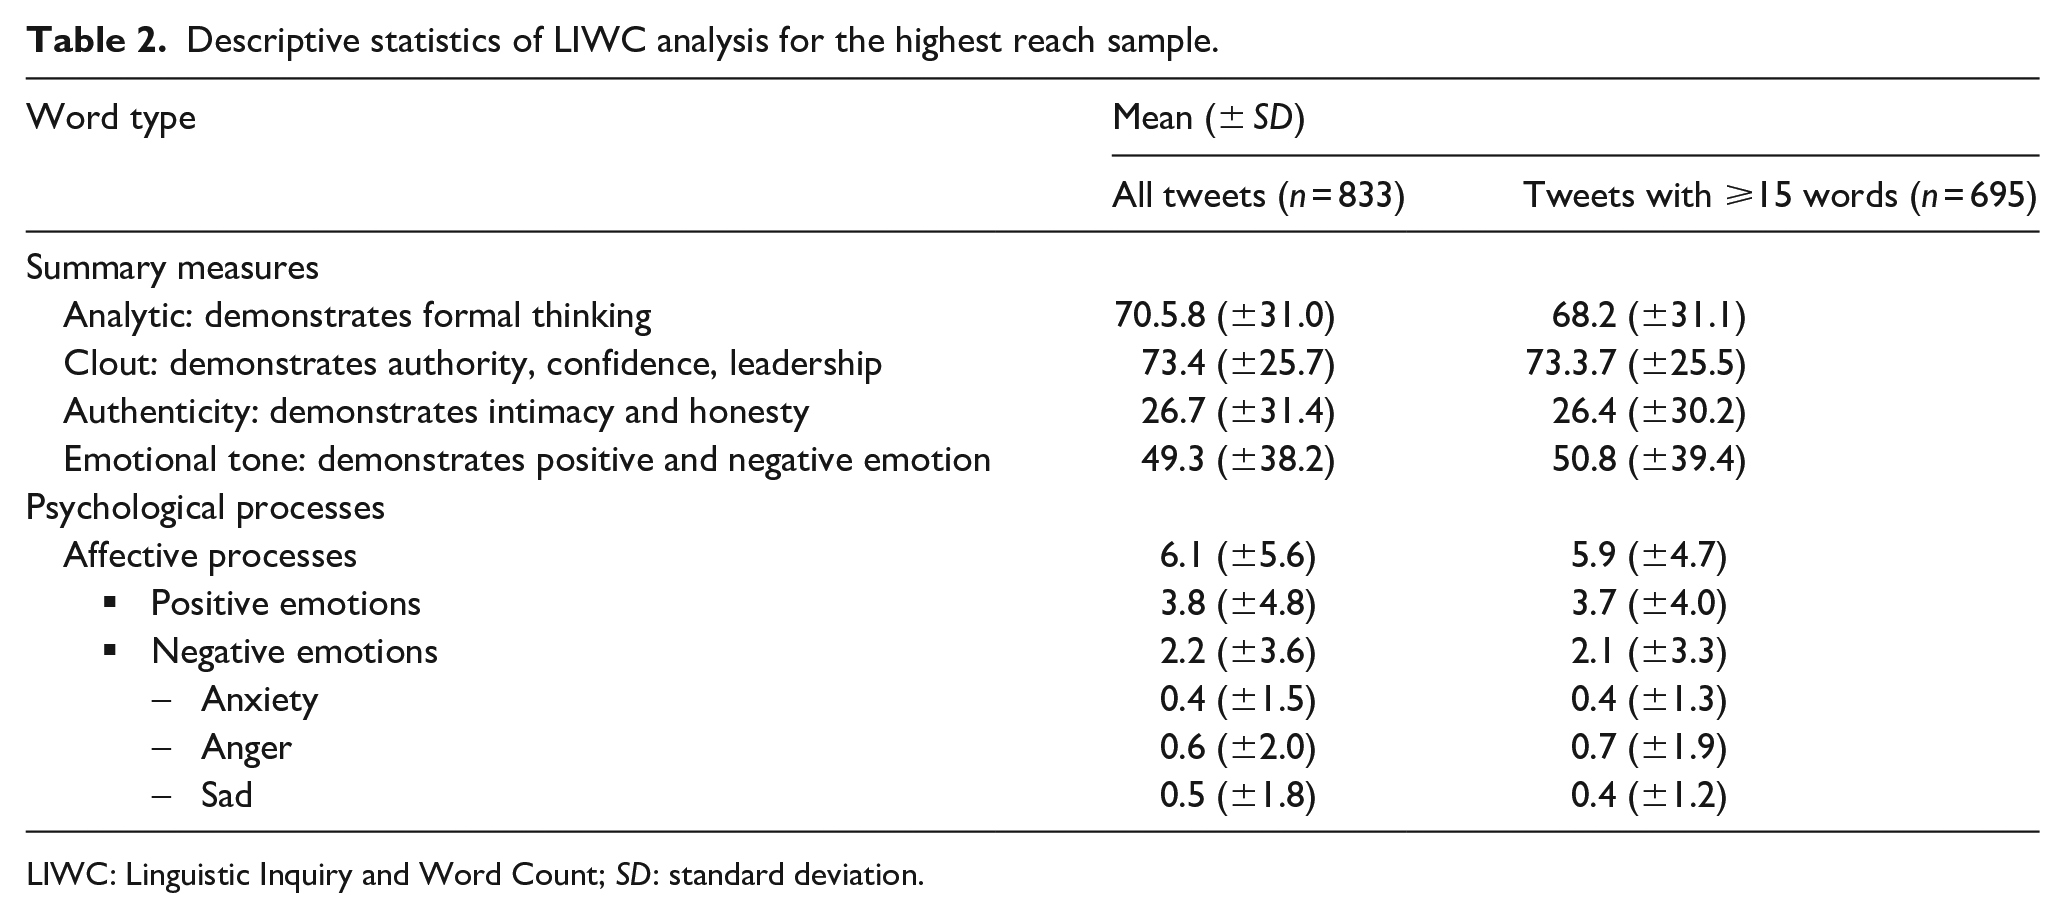
LIWC: Linguistic Inquiry and Word Count; SD: standard deviation.
Descriptive statistics of LIWC analysis for the lowest reach sample.
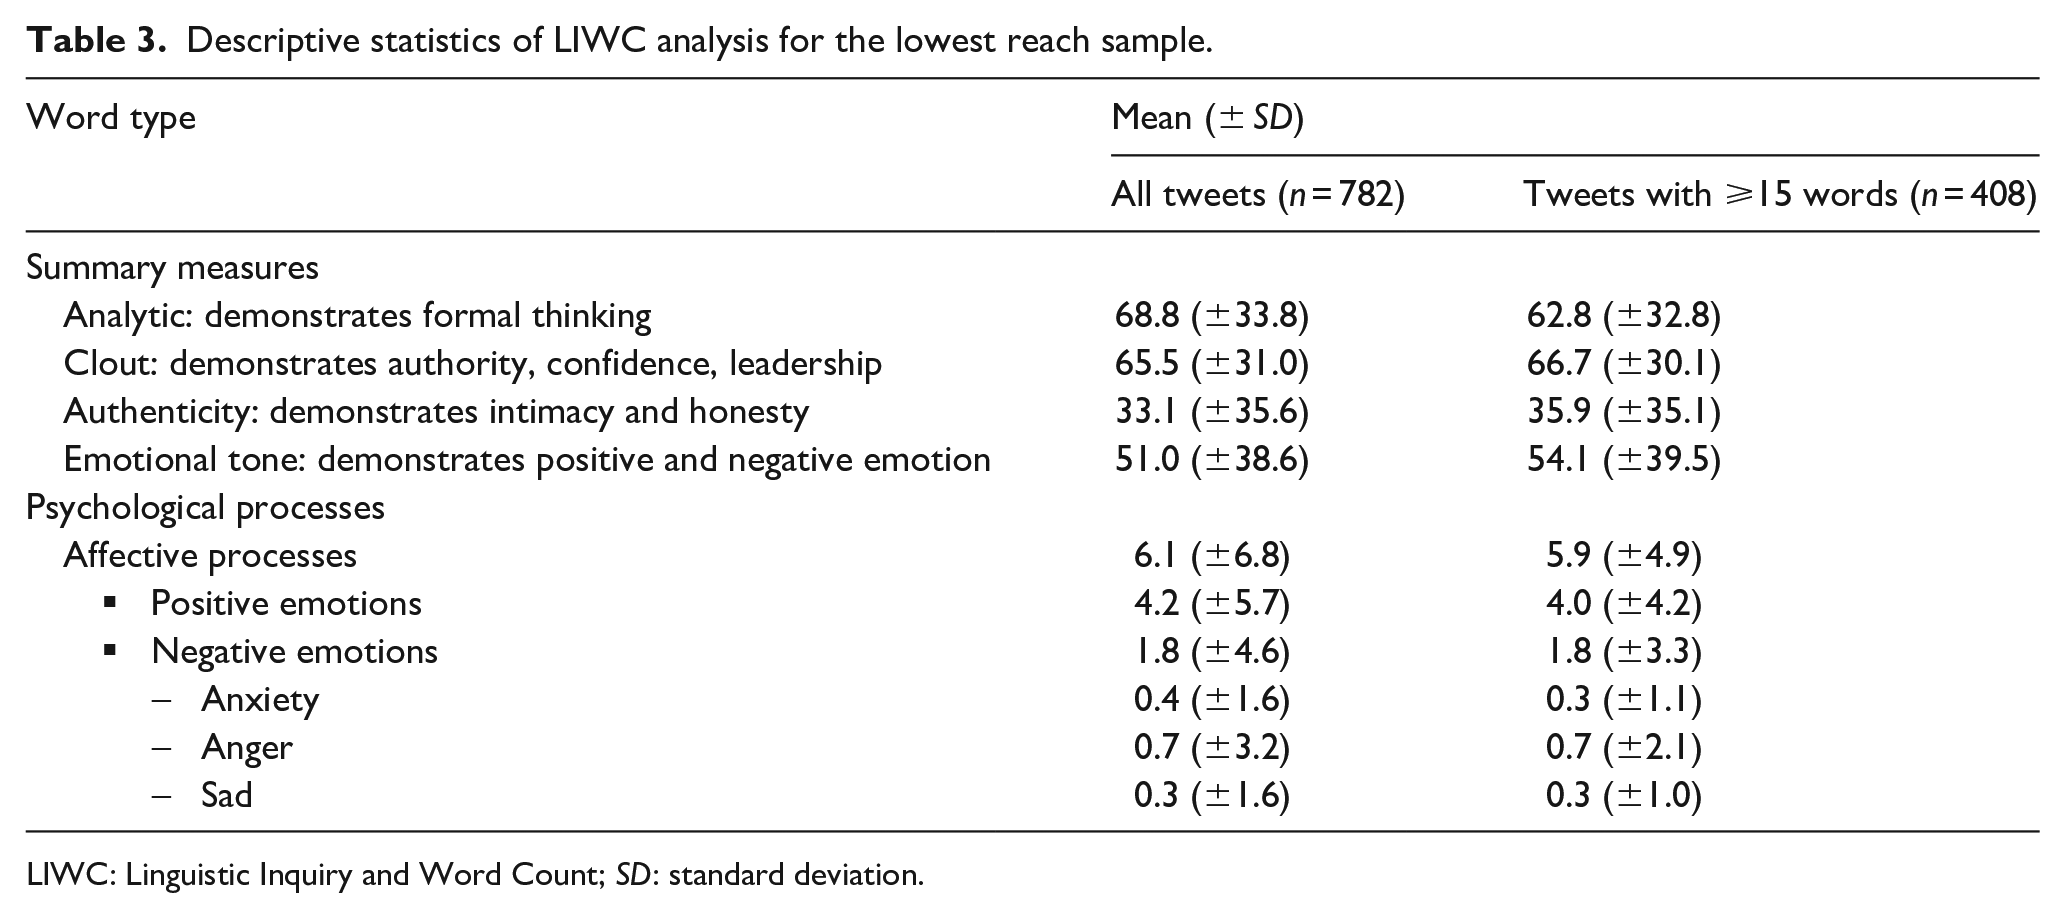
LIWC: Linguistic Inquiry and Word Count; SD: standard deviation.
Highest reach
See Figure 1 for tweet content with the most tweet reach and most retweets and Figure 2 for the most followed accounts. About 8% of the tweets were excluded (k = 77) because they were not written in English or were promoting an event not related to autism. The final sample of tweets included 833 tweets. The majority of the remaining tweets were related to empowerment of individuals with ASD or community support (i.e. 48%). This category included positive statements about neurodiversity and community support (e.g. “It makes me feel like one of the most special people on earth”; “Hundreds of bikers attend boy with autism’s 10th birthday party after only a few people RSVP”).
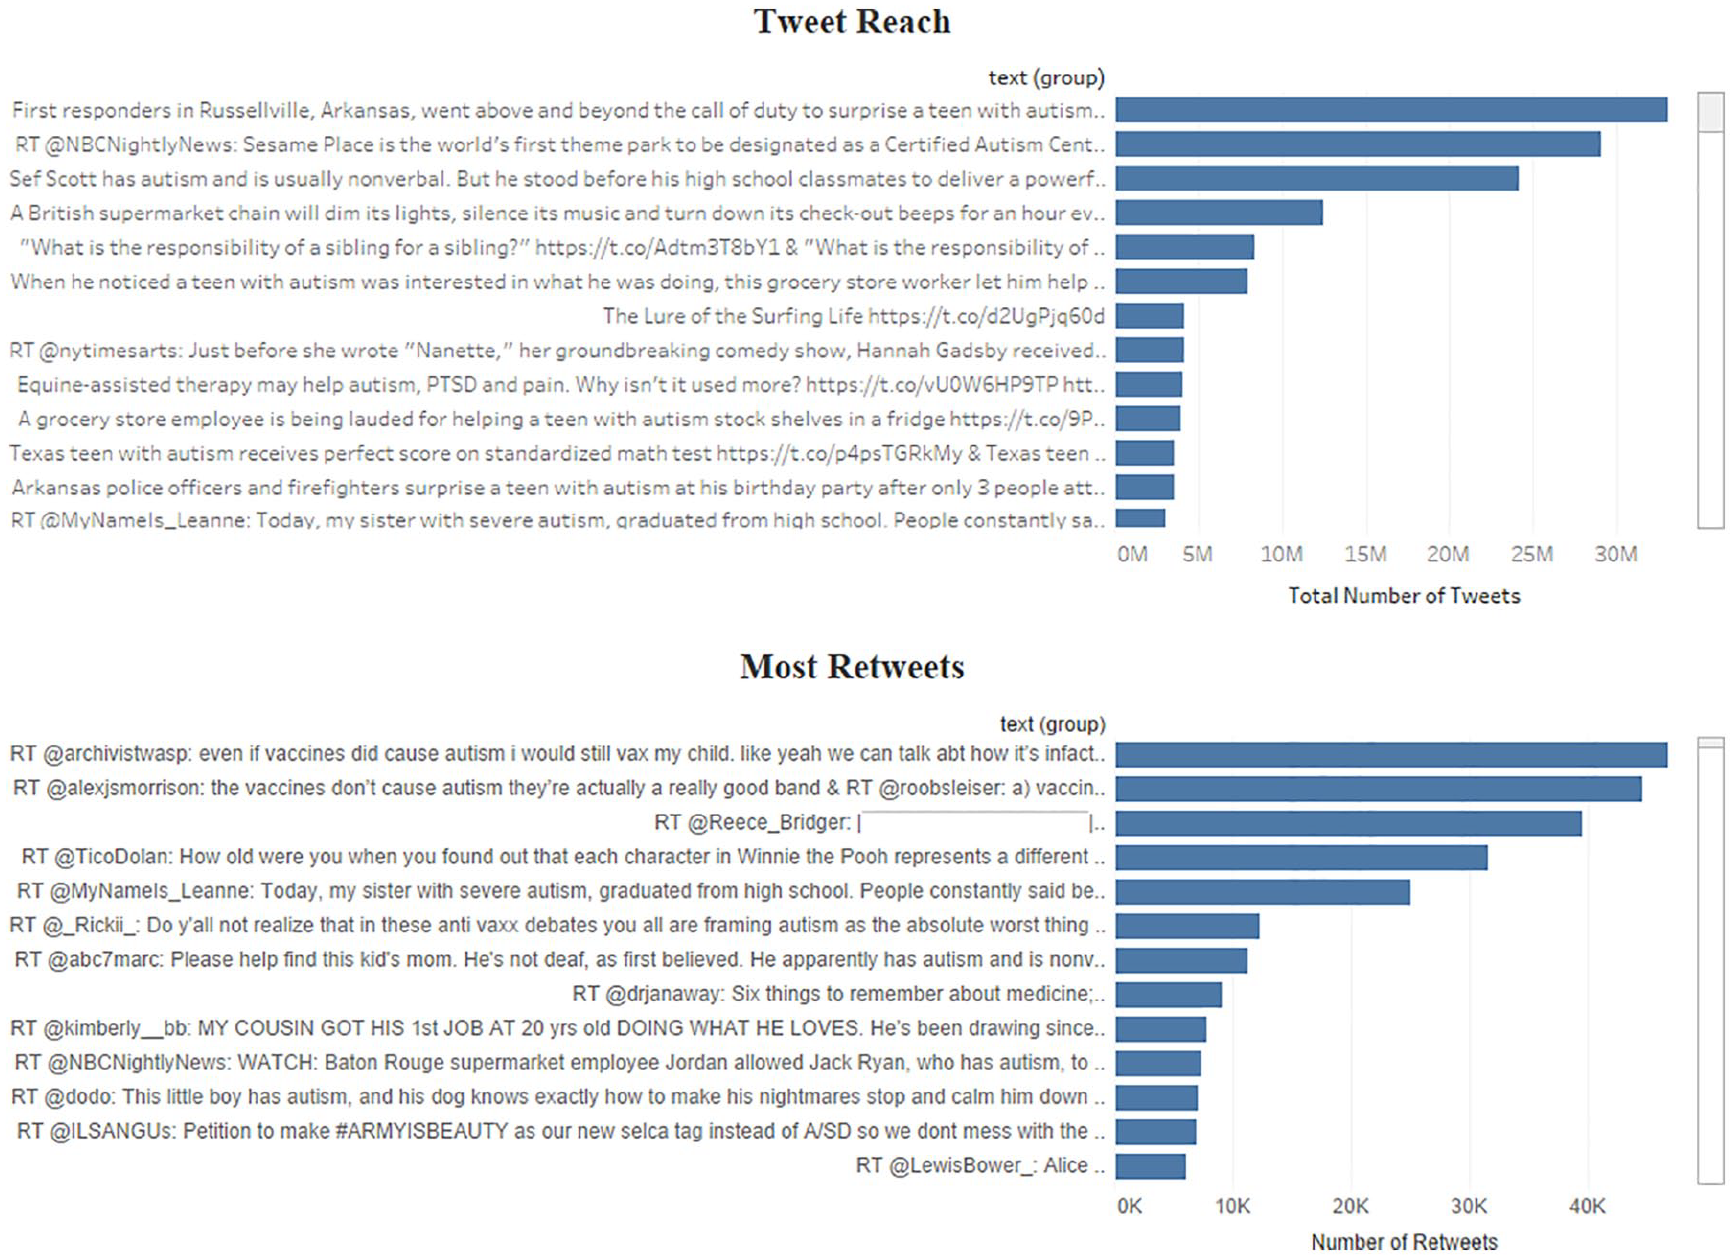
Tweet content with the most tweet reach and most retweeted tweet (i.e. number of followers reached). Tweet reach was calculated by the number of followers, assuming 10% of followers being simultaneously online when the tweet was sent.
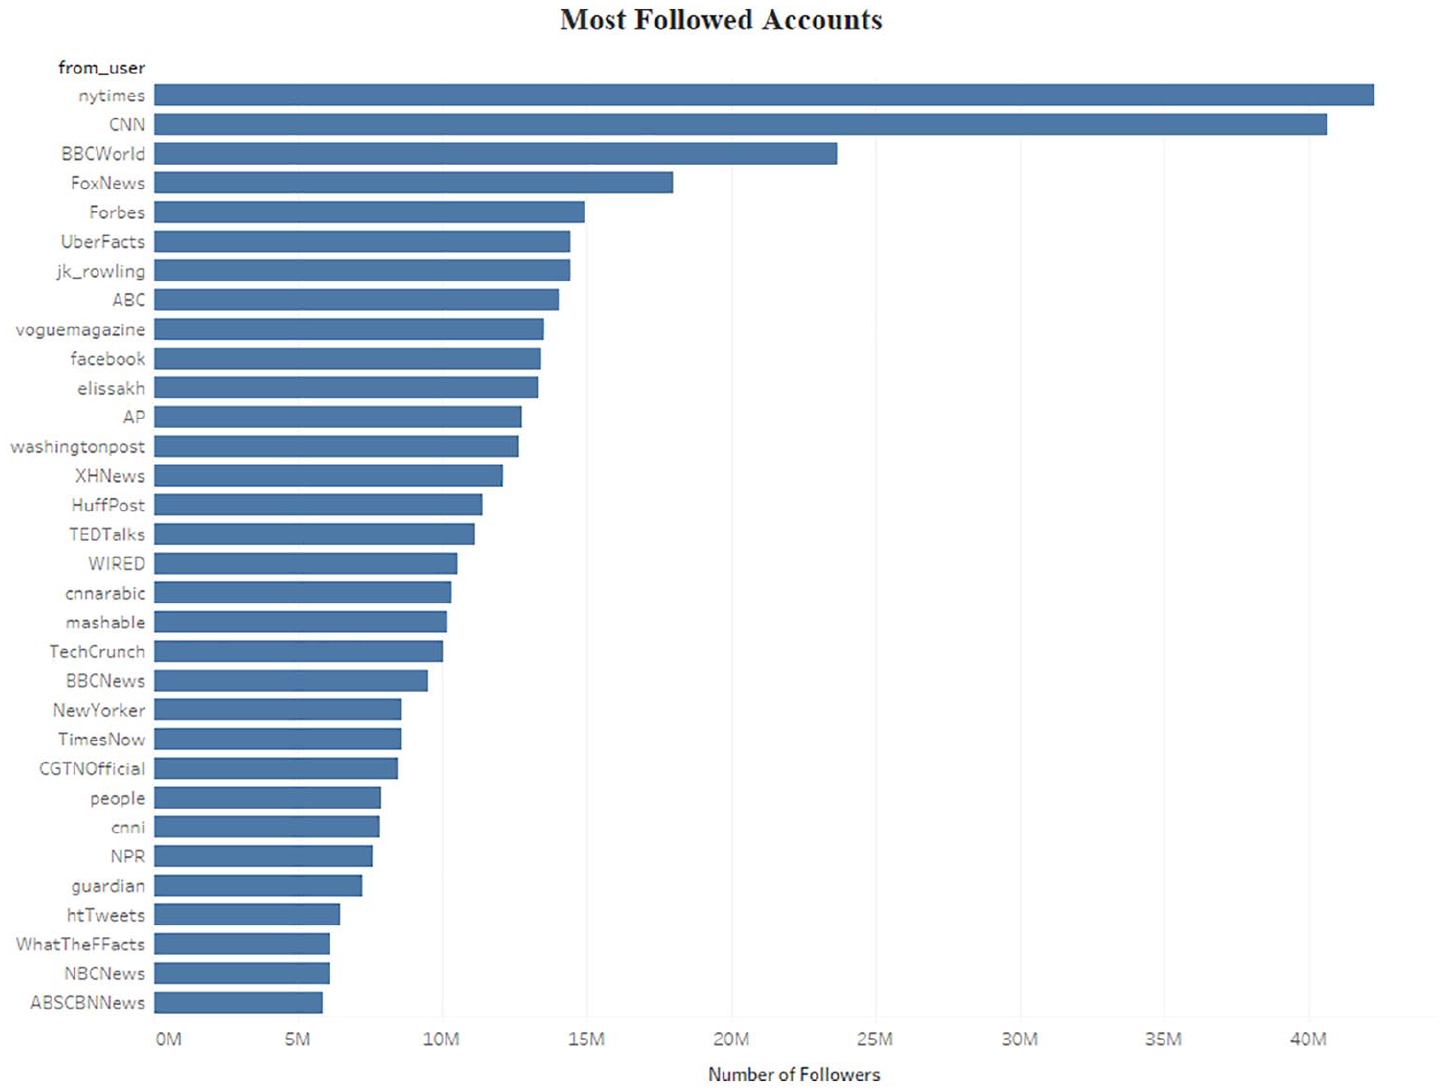
Most followed Twitter users from the sample of tweets with the highest reach.
Tweets related to current, credible information about vaccines and civil issues related to ASD comprised 9% of the tweets each. Of note, two-retweet outliers (>5000 and >3000 retweets per hour) were focused on the message that vaccines did not cause ASD on 9 June and 29 June, respectively. Most of the tweets about civil issues were related to negative police activity toward people with ASD, the need for ASD-related training, and missing persons.
Tweets related to media comprised 6% of the tweets, which included information related to books, movies, and celebrities associated with ASD (e.g. Ten Celebrities with Autism . . .). About 5% of the tweets were related to treatments that are undertaken instead of usual or proven treatments or in addition to usual or proven treatments. A total of 32 tweets supported the alternative treatment (e.g. pet therapy, equine-therapy, and use of marijuana and cannabidiol (CBD) oil) and nine tweets debunked the alternative treatment (i.e. “brain balance” therapy). Symptoms of ASD (e.g. “Check out how the world can sound very different to some people with autism”; “We’re not trying to ignore you says Katy”) and causes consisted of 5% of the tweets. Misinformation regarding vaccines consisted of 3% of the tweets each. Content related to gender, fundraising, and personal impact comprised 2% of the tweets each. Race, treatment, and misinformation about causes of ASD (other than vaccines) were coded in less than 1% of the tweets. Tweets within the treatment category included strategies about how to manage autism in the school setting. One tweet within this category advocated against applied behavioral analysis. Of note, four tweets included the word “autism” as a derogatory term and were not included in any category.
The word count may affect the reliability of LIWC analyses, so we analyzed all the tweets (k = 833) and tweets with more than 15 words in a separate group (k = 695). Table 2 presents the LIWC results based on the word types, which suggest no major difference between full sample of 833 tweets with any word count and the 695 tweets with 15 words or more. The LIWC results are presented in 100-point scales where 0 = very low along the dimension and 100 = very high (Pennebaker et al., 2015). With regard to language style, the percentage of total words were weighted the most along the dimension of analytic and clout, followed by emotional tone. The least percentage of words were weighted along the dimension of authenticity. Tweets were low on the dimension of affective processes related to positive or negative emotion. Moreover, tweets were very low on anxiety, anger, or sad dimensions.
Lowest reach
See Figure 3 for tweet content with the lowest tweet reach and Figure 4 for the least followed accounts. About 14% of the tweets were excluded (k = 126) because they were not written in English, were promoting events not related to autism, or were personal comments not related to autism. The final sample of tweets included 784 tweets. The majority of the remaining tweets were related to empowerment of individuals with ASD or community support (i.e. 37%) (e.g. “We are constantly amazed by those of you who break barriers. A student in Texas delivered a powerful graduation speech encouraging his classmates to do the unexpected” and “Child prodigy wants people to know having autism is ‘cool’”).
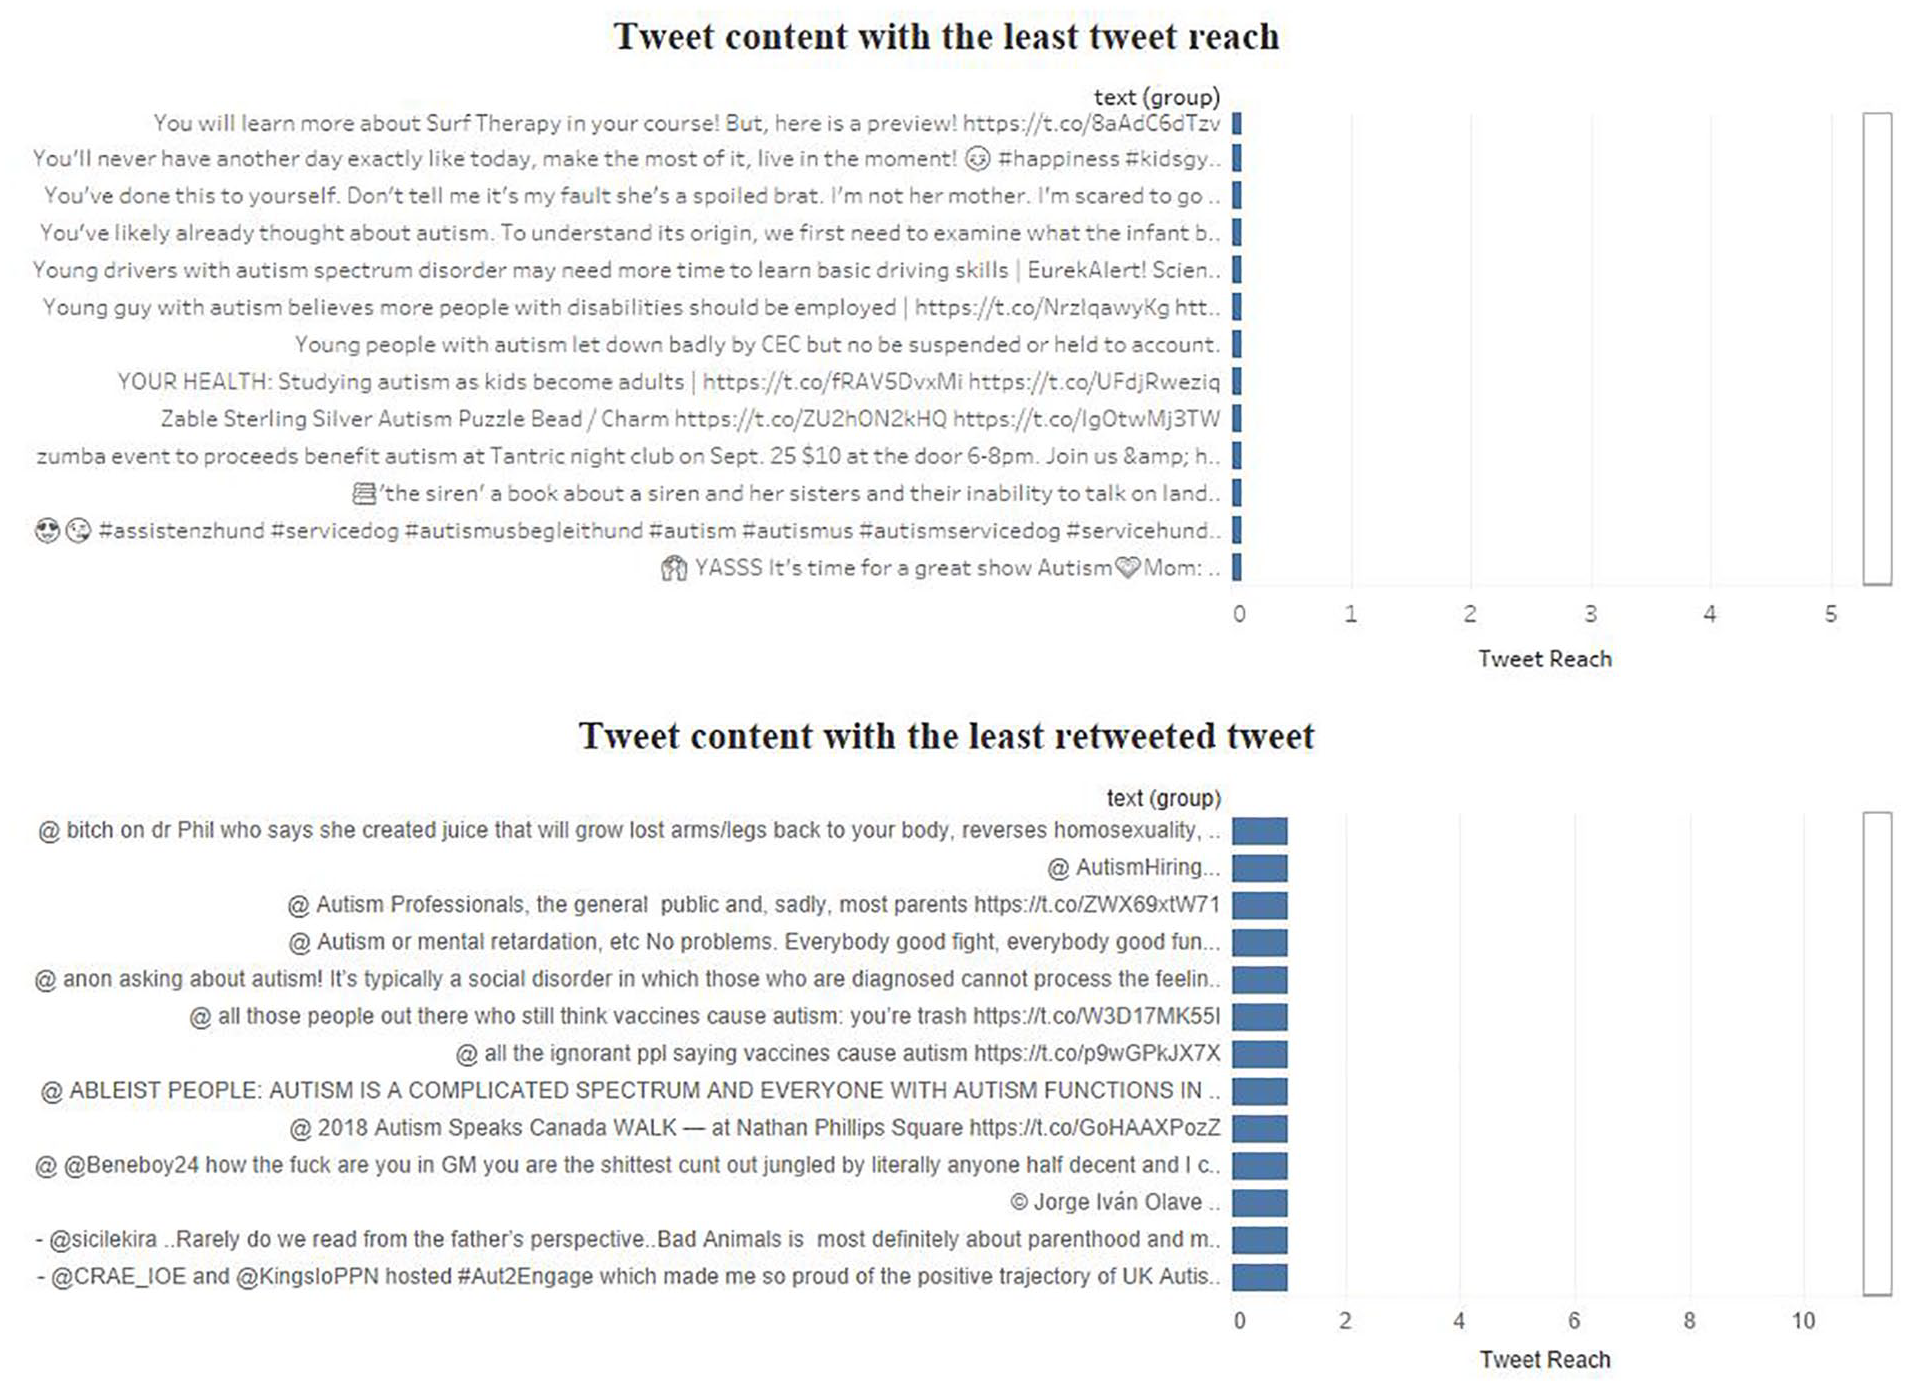
Tweet content with the least tweet reach and least retweeted tweet (i.e. number of followers reached). Tweet reach was calculated by the number of followers, assuming 10% of followers being simultaneously online when the tweet was sent.
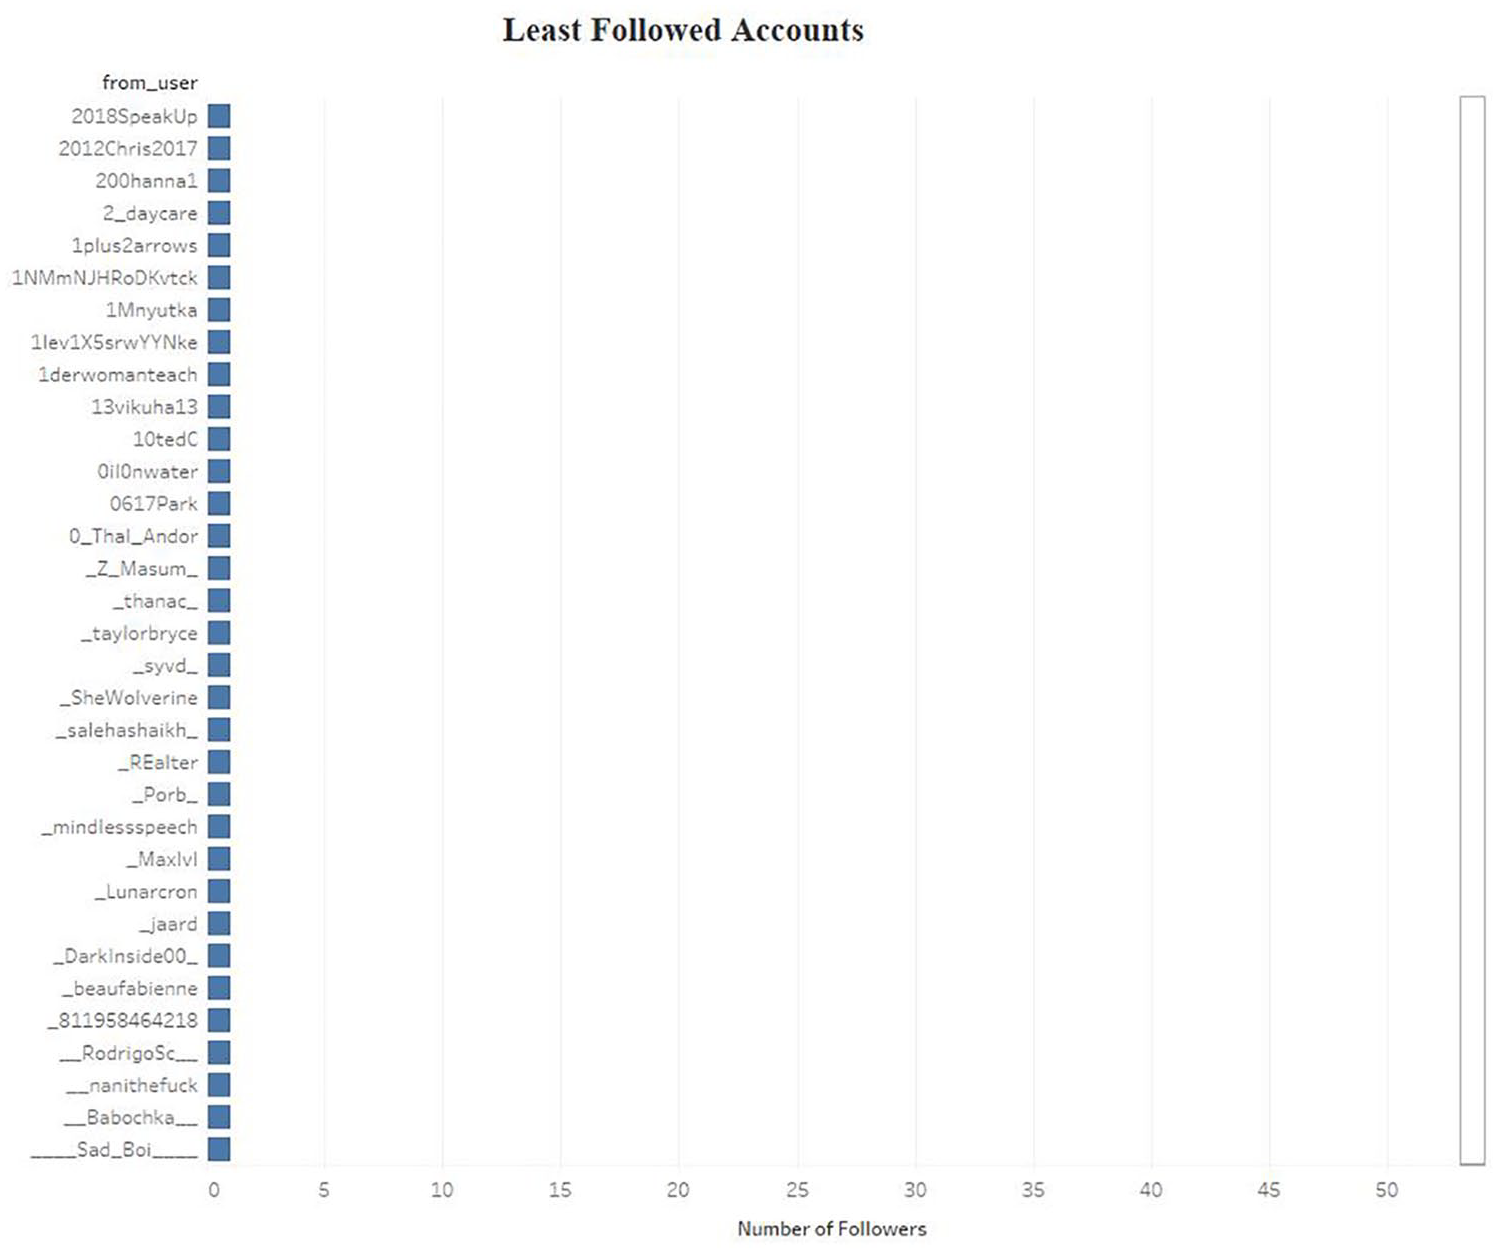
Least followed Twitter users from the sample of tweets with the lowest reach.
About 15% of the tweets comprised the personal impact category. Examples of statements of the personal impact of ASD on self and family included “Having an autistic child does make things different. For example, my son is two and often asks me to read him the periodic table as his bedtime story” and
I’m a mommy of three one of my boys has Autism and my baby Liam has Wolf Hirschhorn syndrome. It’s been a tough journey and not one for all to want to take on. But it’s been a beautiful one because I was chosen to be your mommy.
Tweets related to media comprised 11% of the tweets, which included information related to books, movies, and celebrities associated with ASD (e.g. “I wrote a book called Living Life with Autism, The World Through My Eyes”). Treatment of ASD comprised 7% of the tweets. These included tweets urging families to seek treatment, use of google glasses, use of Applied Behavioral Analysis, and management in schools. About 4% of the tweets were related to treatments that are undertaken instead of usual or proven treatments or in addition to usual or proven treatments (e.g. equine-therapy and use of marijuana and CBD oil). Tweets related to fundraising comprised 6% of the tweets.
Symptoms of ASD consisted of 4% of the tweets. Civil issues related to ASD comprised 3% of the tweets. Tweets related to current, credible information about vaccines, credible information about causes, and misinformation about causes comprised 2% of the tweets. About 2% of the tweets included information related to research. Content related to gender and diagnosis comprised 1% of the tweets each. Misinformation regarding vaccines and race were coded in less than 1% of the tweets. Of note, 25 tweets included the word “autism” as a derogatory term and were not included in any category.
As noted, the word count may affect the reliability of LIWC analysis, so we analyzed all the tweets (k = 782) and tweets with more than 15 words in a separate group (k = 408). Table 3 presents the LWIC results based on the word types, which suggest no major difference between full sample of 782 tweets with any word count and the 408 tweets with 15 words or more. The LIWC results are presented in 100-point scales where 0 = very low along the dimension and 100 = very high (Pennebaker et al., 2015). With regard to language style, the percentage of total words were weighted the most along the dimension of analytic and clout, followed by emotional tone. The least percentage of words were weighted along the dimension of authenticity. Tweets were low on the dimension of affective processes related to positive or negative emotion. Moreover, tweets were very low on anxiety, anger, or sad dimensions.
Twitter users and communities
In our dataset, geographic identifiers were used and were obtained as user-report locations (city or country). Of the harvested tweets, 69.40% tweets contained user-reported locations.
Within the sample of tweets with the highest reach (k = 833), 18.13% originated from an individual, while the rest (81.87%) originated from organizations. Within the sample of tweets with the lowest reach (k = 784), 41.45% were posted by individuals and the rest (58.55%) originated from organizations.
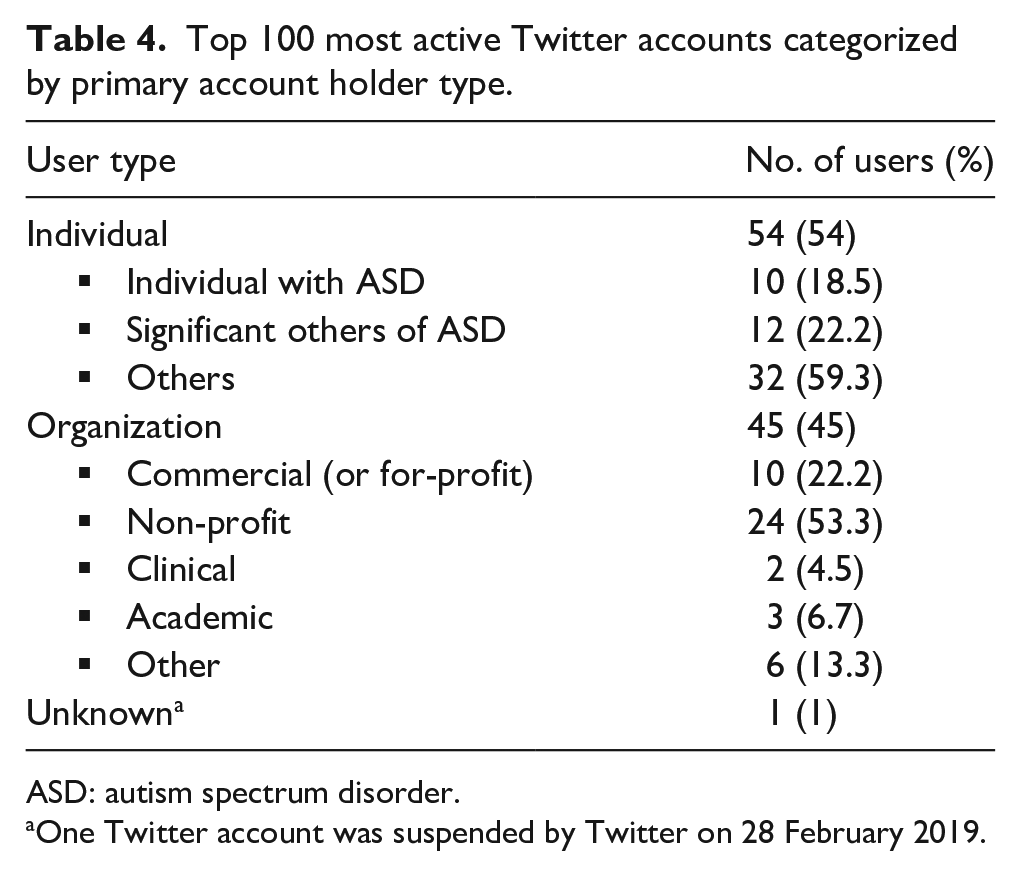
Of the 100 most active Twitter accounts, individuals owned 54% compared to 45% owned by organizations (see Table 4). Twitter suspended one of the accounts during February 2019. Hence, we were unable to categorize this user. Commercial and non-profit organizations were the most common organization account owners with 22.2% and 53.3% of the accounts respectively. Individual accounts belonging to individuals with ASD, significant others of individuals with ASD, and others accounted for 18.5%, 22.2%, and 59.3% respectively. An examination of the virtual ASD community network was also conducted to reveal subcommunities (see Figure 5). Two distinct subcommunities appeared: (a) a subcommunity with a focus on advocacy (primarily social media and non-profit organization accounts) and (b) a subcommunity with a focus on clinical and research issues (primarily individuals with ASD and their significant others’ accounts). The number of users belonging to the advocacy subcommunity was substantially larger than the clinical and research subcommunity.
Top 100 most active Twitter accounts categorized by primary account holder type.
ASD: autism spectrum disorder.
One Twitter account was suspended by Twitter on 28 February 2019.
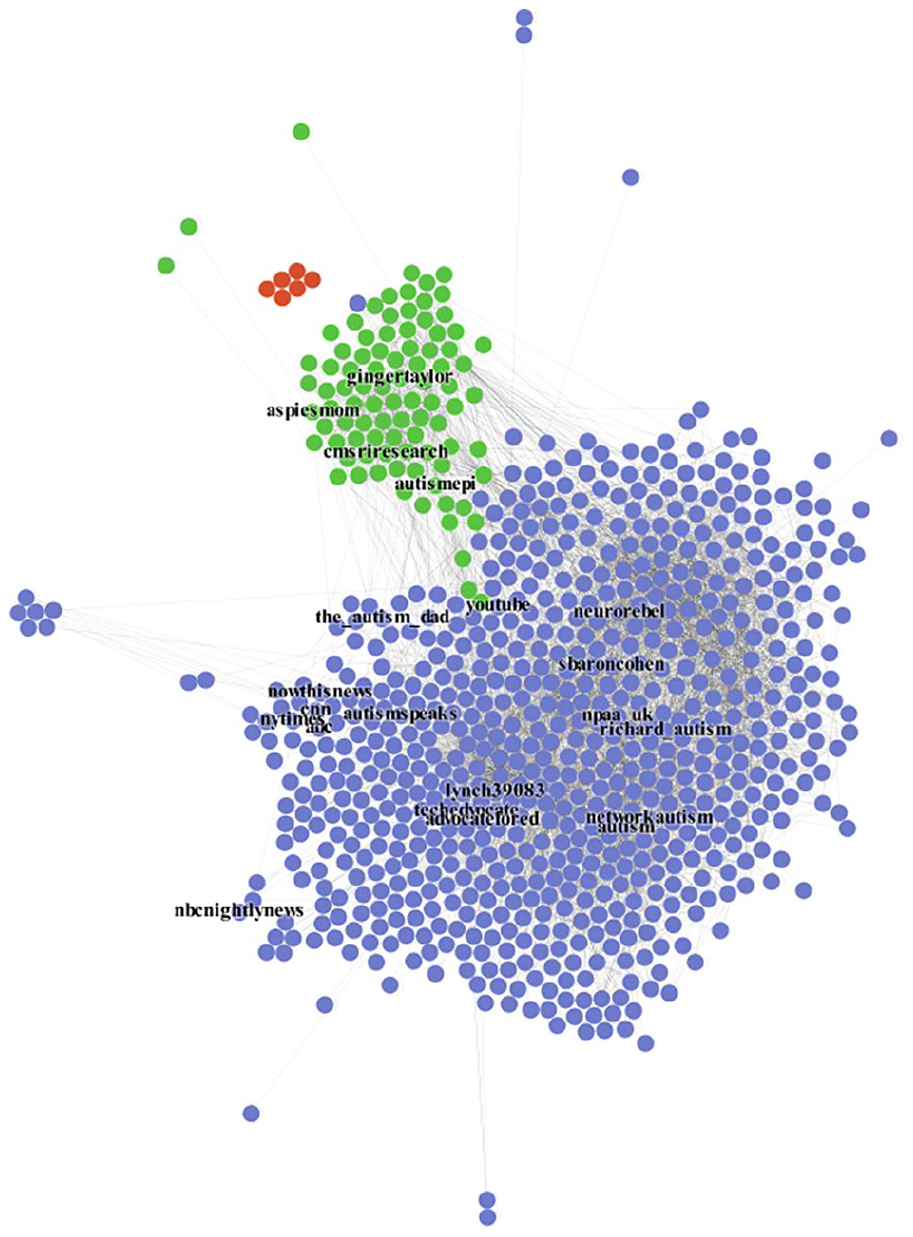
Twitter virtual ASD community network map. Dots represent user accounts and edges indicate any of the interactions among these connected accounts (e.g. likes, replies, retweets, mentions, etc.). Colors represent the algorithm-derived clusters of similarity. Purple represents an advocacy subcommunity (primarily social media and nonprofit organization account). Green represents a clinical and research subcommunity (primarily individuals with ASD and their significant others). Nodes on the periphery of a cluster have less edges than the ones in the middle of a cluster.
Discussion
This study examined patterns and themes of ASD-related tweet content as well as intercommunications between users sending tweets and retweeting (i.e. forwarding) the content to their respective user networks. The first question (i.e. What type of content related to ASD is shared via Twitter?) was addressed by examining tweets per day with the highest reach and with the lowest reach. Twitter content from both samples was primarily related to empowerment and support. A larger percentage of tweets from the highest reach sample were categorized as empowerment and support as compared to tweets from the lowest reach. That said, it may be that a chief concern within the autism community is related to empowerment and support. All other content categories were represented less frequently within both samples.
Frequency of tweets across content categories varied. This may be due to the difference between the number of tweets originating from an individual in the lowest reach sample (i.e. 41%) as compared to the individuals in the highest reach sample (i.e. 18%). In particular, percentage of tweets related to personal impact within the lowest reach sample were greater than in the highest reach sample. The highest reach sample primarily originated from organizations with many followers. Consequently, these types of tweets had higher reach. Tweets from the lowest reach category originated from individuals with fewer followers.
The second most frequently identified category from the highest reach sample emphasized the fact that vaccines do not cause autism. This content comprised the most tweets in a given hour on a given day. Please note that the >5000 and >3000 retweets were not excluded and could influence these results. Fewer tweets included misinformation about vaccines. Tweets about civil issues in the highest reach sample, also the second most frequent content category, were related to negative police activity toward people with ASD, the need for ASD-related training, and missing persons. On the contrary, in the lowest reach sample, tweets related to vaccines and civil issues were minimal. Instead, the second most frequently identified category from the lowest reach sample emphasized the personal impact of ASD on self and family, which suggests Twitter was used to build social, personal relationships.
The third most frequent category from the lowest reach sample included information related to books, movies, and celebrities (i.e. media). It is interesting that tweets related to treatment occurred with greater frequency in the lowest tweet sample (i.e. 7%) than the highest (i.e. <1%). In addition, notably more fundraising tweets occurred in the lowest reach sample than the highest reach sample. Finally, tweets about diagnosis occurred in the lowest reach sample, but did not occur in the highest reach sample.
These results are consistent with Saha and Agarwal (2016) who reported that advocates of ASD awareness provide information about ASD on social media, specifically blogs, Twitter, and Facebook. This is noted with greater frequency in the highest reach sample. Saha and Agarwal (2016) also reported that Twitter includes social support, which was more characteristic of the lowest reach sample (i.e. personal impact statements). It may be that Twitter holds a two-fold purpose (i.e. sharing tweets of empowerment and support and describing the personal impact of ASD), which are related to the originating source of the tweet.
With regard to the second research question, (i.e. What is the sentiment of content related to ASD is shared via Twitter?), the lowest number within both samples was related to authenticity which relates to an awareness of one’s own feelings as well as engagement in unbiased sharing of one’s own positive and negative aspects and open relationship (Kernis & Goldman, 2006). Although a majority of the tweet content was related to empowerment and support, the language appeared to be associated with a more guarded, distanced form of discourse rather than a personal form of discourse (Pennebaker et al., 2015). Furthermore, a number around 50 in “emotional tone” in both samples suggests either a lack of emotionality or different levels of ambivalence. This is consistent with the analysis of psychological processes in which the very low numbers related to affective processes were indicative of neutrality. It may be that the length of the tweet does not allow room for more personal forms of discourse, which may require more space to articulate depth of thought. Consequently, the language is less personal and emotional. Interestingly, personal blogs have higher numbers in the areas of emotion than found in this study (Nguyen et al., 2015).
A higher number in “clout” indicates that the author is speaking from the perspective of high expertise and is confident. A higher number in “analytic” reflects formal, logical, and hierarchical thinking. These results are not consistent with Hswen et al. (2019) who found the emotional patterns consistent with the diagnosis of ASD in tweets of self-identified individuals. This difference could be attributed to the samples in each study. This study sampled tweets from any user using the hashtags: #autism and #autismspectrumdisorder.
With regard to the type of users who employ Twitter to share ASD-related content and the manner with which communities are clustered, about half of the tweets originated from organizations and the other half originated from individuals. However, there appears to be a distinction between originating source and tweet reach, which may vary the impact of the message.
The number of users belonging to the advocacy subcommunity was substantially larger than the clinical and research subcommunity. The advocacy subcommunity was primarily comprised of social media and non-profit organization accounts as compared to the clinical and research subcommunity, which was comprised of individuals with ASD and their significant others. This may be because individuals with ASD and their significant others do not disclose diagnostic status as a part of their social media profile. The greatest user activity appeared to be individuals or organizations with an advocacy purpose. As noted, the top two viral news tweets in Twitter were about vaccinations, specifically, the message that the vaccine did not cause ASD. These patterns reinforce that Twitter may serve as a platform to unify the ASD community in advocacy and outreach efforts.
Limitations and future directions
This study has several limitations. First, the study duration was limited to 3 months in the summer. A longer duration of data extraction including other times of the year may have helped better understand the temporal trends. For example, there may be a difference in tweets in Summer months as compared to Fall months due to summer break. Second, we only conducted user classification and content analysis of 910 tweets with highest and lowest reach. It would be useful to examine the content of all or most of the messages using big-data analysis techniques. However, such an undertaking may have challenges in data formatting appropriate for the chosen data analysis software. Third, the current study broadly examined Twitter usage related to ASD. Future studies can focus on examining how Twitter may be used for specific messages (e.g. diagnosis of ASD, information about vaccines). Moreover, it would also be useful to do clinical studies to examine how people with ASD and their family members are influenced by engaging in these messages. Fourth, it would be of interest to examine other social media platforms and compare content and use. Fifth, the hashtags used in this study may have limited the dataset and results. For example, other hashtags (e.g. #neurodiversity) may have conveyed different types of content and sentiment. Furthermore, this study included English only tweets. Non-English tweets may have conveyed different content and sentiment. Sixth, we did not conduct any methods to exclude accounts for bots and this should be completed in future work to examine the effects of how bots lead to misinformation. Finally, due to rapid changes in the social media landscape, results obtained in this study may have changed since the time this data were extracted.
Conclusion
The current study is the first to comprehensively examine Twitter usage about ASD. Stakeholders within ASD communities should be aware of differential engagement on social media platforms related to ASD. Examining information on social media that is shared and consumed will help us understand knowledge, attitudes, behaviors related to ASD. In turn, this may help in developing and distributing appropriate and evidence-based ASD-related information. For example, understanding the type of content in lowest reach sample could guide organizations in the type of content they share (e.g. more shared resources related to treatment and diagnosis).
Footnotes
Declaration of Conflicting Interests
The author(s) declared no potential conflicts of interest with respect to the research, authorship, and/or publication of this article.
Funding
The author(s) disclosed receipt of the following financial support for the research, authorship, and/or publication of this article: This study was funded in part by the Lamar University Presidential Visionary Initiative. M.L.B.-H. (PI) and V.M. (Co-PI) received the research grant from Lamar University.
