
Abstract
This study describes the development and validation of Chinese, Malay and Tamil translations of the Positive Mental Health Instrument (PMHI) in a general population sample in Singapore. Translations were performed using two independent forward translations followed by expert panel discussions and tested for content, construct and language appropriateness using focus group discussions. The final translated tools were field-tested among 220 residents per language using self-administered questionnaires comprising the translated PMHI and other validity measures. Missing data, floor and ceiling effects, confirmatory factor analysis (CFA), internal consistency, item response theory differential item functioning (IRT-DIF) and criterion validity were assessed. A total of 10 PMHI-Chinese items, 26 PMHI-Malay items and six response categories and six PMHI-Tamil items were modified based on expert panel and focus group discussions. PMHI had low missing data and showed negative but acceptable skewness (<2) and kurtosis (<7) for all translations, except for the PMHI-Malay “spirituality” subscale (skewness: -2.8; kurtosis: 12.5). CFA showed that all three PMHI translations fulfilled the original six-factor-higher-order structure (RMSEA = 0.05, CFI = 0.962, TLI = 0.96). Cronbach’s alpha coefficients for total PMHI were 0.958, 0.954, 0.945 and 0.949 in the overall sample and the Chinese, Malay and Tamil translations, respectively. The three translations of the PMHI showed expected and significant positive (r = 0.116 to 0.663) and negative correlations (r = −0.137 to −0.574) with established measures. The findings show that the Chinese, Malay and Tamil translations of the PMHI have high internal consistency and validity in this multi-ethnic population.
Introduction
Mental health is more than just absence of illness and relates to a state “of well-being in which the individual realizes his or her abilities, can cope with the normal stresses of life, can work productively and fruitfully, and is able to make a contribution to their community” (World Health Organization, 2004). Positive mental health, a term first proposed by Jahoda (1958), includes aspects related to positive attitude, self-actualization, resilience, autonomy, perception of reality and environmental mastery. Positive mental health (PMH) and mental well-being are associated with less psychopathology including suicidality, lower rates of mortality, and greater quality of life as well as psychosocial and occupational functioning (Huppert, 2009; LaMontagne et al., 2016; Diener, 2013). Given its significance in individuals’ overall well-being and productivity, there has been a tremendous increase in the interest and research on mental well-being worldwide (Linton et al., 2016). Consequently, national-level surveys for assessing the level of mental health utilize a number of tools such as the Affectometer (Kammann & Flett, 1983), Psychological Well-being Scales (Ryff & Singer, 1996), Satisfaction With Life Scale (Diener et al., 1985), WHO-Five Well-being Scale (Topp et al., 2015), Warwick-Edinburgh Mental Well-being Scale (WEMWBS) (Tennant et al., 2007), Positive Mental Health Instrument (PMHI) (Vaingankar et al., 2011) and the Positive Mental Health Questionnaire (PMHQ) (Roldán-Merino et al., 2017); these are some of the measures used globally in the assessment of mental well-being at present.
Mental well-being is also an area of interest and importance in public health policy and research in Singapore, particularly since the launch of the first National Mental Health Policy and Blueprint (NMHBP) in 2007 that stressed the importance of promoting mental well-being and building resilience among the different population groups (Institute of Mental Health, 2007). Singapore is a multi-ethnic country in Southeast Asia, with a population of 3.9 million citizens and permanent residents, comprising 74.3% of Chinese ethnicity, 13.3% Malays, 9.1% Indians and the rest belonging to other ethnicities (Statistics Singapore, 2015). Singapore has a high literacy rate (96.8%), with 83.1% of the population aged over 15 years being literate in English. However, Chinese (34.9%), Malay (10.7%) and Tamil (3%) still serve as common languages of communication across households and are the three predominant and official non-English languages in Singapore spoken by the three main ethnic groups. Moreover, Singapore is a rapidly ageing society with over two thirds of the population being age 60 and over, further resulting in a sizeable proportion of the population using these languages at home. About 16% of the general population is literate solely in Chinese (14.4%), Malay (1.2%) or Tamil (0.3%) (Statistics Singapore, 2015). There is, therefore, a need to identify strategies and actions to deliver culturally responsive services that are best suited to meet the needs of people from these culturally unique and linguistically diverse backgrounds. Moreover, with population-level assessment of mental health needs and interventions, it is necessary to have valid, reliable and translated cross-linguistic tools that can be applied across diverse groups. Indeed, two of these languages—Mandarin Chinese and Tamil, are also spoken widely in Asia and globally (Kiprop, 2018; Lewis & Simons, 2015), and such measures may have far-reaching uses outside of Singapore.
The Positive Mental Health Instrument (PMHI), the initial English language version, was developed and validated as part of a national epidemiological study conducted in 2010 in Singapore (Vaingankar et al., 2011; Vaingankar et al., 2012). Since its first development, the instrument has been extensively used and studied in different populations such as community-based general population samples (Vaingankar et al., 2011; Vaingankar et al., 2018), working adults (Picco et al., 2017), patients with mental illnesses (Vaingankar et al., 2016) and caregivers of older adults (Ong et al., 2018). It has consistently shown high reliability and demonstrated strong construct and criterion validity in English-literate samples. Given its potential for evaluating multiple components of PMH and their associated factors, it is timely and necessary to expand the reach of the measure to non-English speaking populations for effective evaluation of PMH across all subgroups in the population.
The present work describes the translation and validation of the Chinese, Malay and Tamil language versions of the PMHI. Based on estimates in 2015 among the Chinese population, about 47% spoke Mandarin and 37% spoke English, while 16% spoke dialects at home. The dialects spoken at home vary widely, with major groups being Hokkien, Teochew, Cantonese, Hakka, and Hainanese. The proportion of people speaking dialects at home in Singapore decreased by almost 9% from 2010 to 2015 (Statistics Singapore, 2015) and smaller segments of the population use only dialects. Hence, it was deemed adequate for the scope of this study to limit the translation to Singapore Mandarin (referred to as “Chinese” in the subsequent sections).
The study aimed to (i) translate the English PMHI into Chinese, Malay and Tamil using independent forward translations and expert panel discussions; (ii) pre-test the translated tools and explore their appropriateness and acceptability through focus group discussions (FGDs) before finalizing the translations; and (iii) estimate the validity, internal consistency and item functioning of the translated versions of the instrument in a community-based sample.
Methods
The study was approved by the National Healthcare Group’s Domain Specific Review Board (2015/00800). Written informed consent was obtained from all participants. Participants were community-based Singapore residents aged 21–65 years who were capable of providing informed consent, literate in Chinese, Malay or Tamil, and able to self-administer the study questionnaire in one of these languages. The study comprised a total of 717 participants, of which 57 were involved in finalizing the translated PMHI versions through expert panel and focus group discussions, and 660 were enrolled during the field survey for validation of the instrument.
Translation and expert panel discussion
The aim of this exercise was to produce Chinese, Malay and Tamil language translations that had conceptual and linguistic equivalence with the original PMHI. Adapted from the guidelines recommended by the Scientific Advisory Committee of the Medical Outcomes Trust (1997), emphasis was also placed on cross-cultural and conceptual similarity, rather than on literal equivalence. Two independent forward translations of the PMHI were conducted for each language by local professional translators who were instructed to avoid long sentences and jargon and adopt conceptual rather than literal translations using lay and locally acceptable language for the broadest set of end-users. They were also required to remark on any item/term they struggled with and provide other translated options as necessary. Back translations were not used at this stage in the study due to the inherent variations in the three languages that may generate slightly different back translation to English language. Moreover, it is believed that the back-translation procedure can promote literal rather than conceptual equivalence (Rogler, 1999) or introduce more inaccuracies (Ponce et al., 2004). For each language, expert panel discussions were convened separately and comprised one translator, one study team member with content knowledge and a lay person. All panelists were bilingual—having English literacy and proficiency in the target language. The original English language PMHI and its respective translations were provided to the panel members for independent review three days prior to the discussion. The half-day panel discussions were geared to identify and resolve inappropriate expressions/concepts in the translation and resolve discrepancies in relation to the English PMHI. A study team member facilitated and recorded the decisions taken during the panel discussion which were continued until a consensus was reached on the translated PMHI versions among the experts. A single back translation was conducted by a language expert after this stage to ensure conceptual similarity with the original tool.
Pre-testing and focus group discussion
This step aimed to test the translations formulated in the earlier phase and produce the final translated PMHI versions in the three languages using focus group discussions (FGDs) (Vogt et al., 2004). Two to three FGDs were conducted per language, comprising 7–10 participants belonging to different age, gender and socioeconomic groups and proficiency in the language of the translation. Before each FGD, participants self-administered the translated PMHI. The FGD sessions were facilitated by a study team member who was proficient in the specific language and experienced in qualitative methods. These served as a systematic debrief wherein participants were required to express their thoughts on each item and specific phrases and paraphrase the statements. Their decision-making process while choosing responses and feedback on statements/words/phrases/response categories that they found to be vague, difficult, inappropriate and/or locally irrelevant was also obtained. Finally, in instances where alternative translations of statements/words were suggested, participants were asked to choose the best alternative term or phrasing. Specific emphasis was given to items that had missing responses in the pre-test or required most deliberations during the expert panel sessions.
Field survey
A cross-sectional survey was conducted on a convenience sample of 660 community-dwelling adult residents. Study participants were sampled from households across different geographic regions in Singapore, using a quota sampling plan based on equivalent proportions of genders (50% each), and higher representation of older residents (70%) and those with lower education (60%), in consideration of the likely end-users for the translated versions.
Survey instruments
Data was collected using two separate pen and paper interview (PAPI) questionnaires which were available in Chinese, Malay and Tamil languages. The first questionnaire was interviewer-administered upon enrolment to obtain information on participants’ sociodemographic characteristics, including their age, gender, education, ethnicity, marital and employment status. It also included measures needed for the assessment of criterion validity of the translated PMHI versions. These were Euro-Quality of Life Scale 3 levels (EQ5D 3L) (Brooks & EuroQoL Group, 1996), Generalized Anxiety Disorder (GAD)-7 Scale (Kroenke et al., 2007), Patient Health Questionnaire (PHQ)-8 (Kroenke & Spitzer, 2002), General Health Questionnaire (GHQ)-12 (Goldberg, 1972), Satisfaction with Life Scale (SWLS) (Diener et al., 1985) and the Multidimensional Scale of Perceived Social Support (MSPSS) (Zimet et al., 1988) (Table 1).
Measures of criterion validity and a priori set criteria.
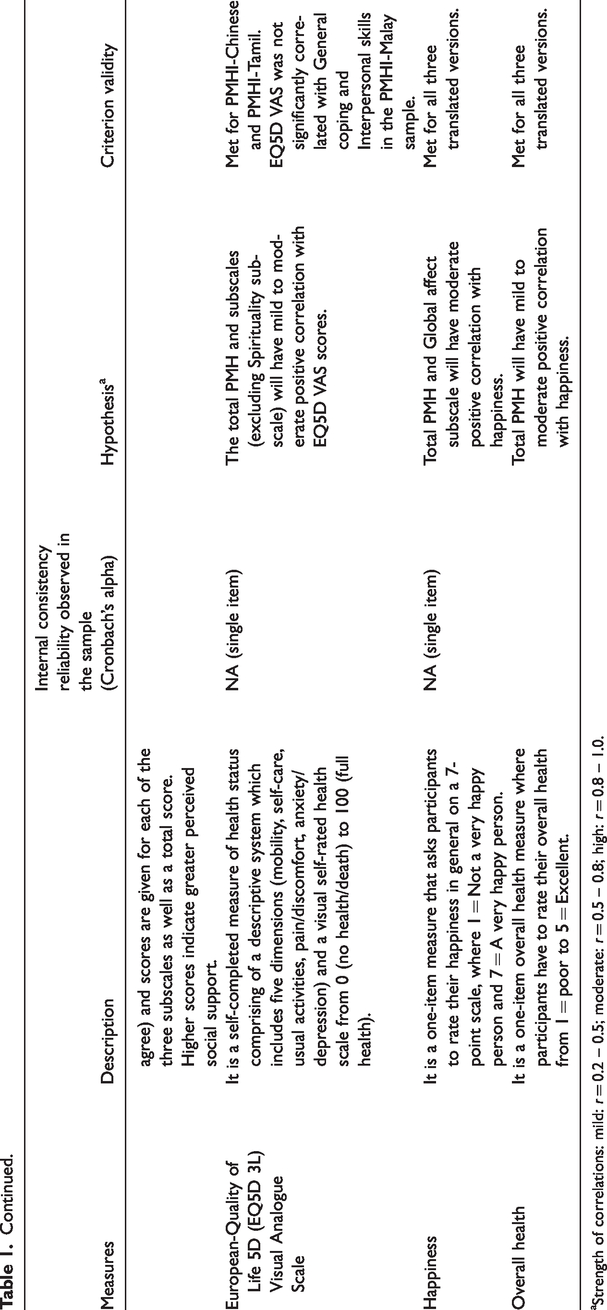
Strength of correlations: mild: r = 0.2 – 0.5; moderate: r = 0.5 – 0.8; high: r = 0.8 – 1.0.
The second questionnaire included the translated PMHI along with 1-item happiness and 1-item overall health measures (Table 1). The PMHI comprises 47-items representing six subscales: general coping (GC: 9 items), emotional support (ES: 7 items), spirituality (S: 7 items), interpersonal skills (IS: 9 items), personal growth and autonomy (PGA: 10 items), and global affect (GA: 5 items). All items are positively-worded items; for example, “I tell myself that things would get better”, and “I try to be patient with others”. Participants are required to indicate how much each item describes them in general, from 1 (not at all like me) to 6 (exactly like me) for the first five subscales. For the “Global affect” subscale, a list of five affect items is presented and participants indicate “how often over the past four weeks they felt—calm, peaceful, etc.” using a 5-point response scale. Before scoring, the Global affect response scale is rescaled to obtain 1 to 6 score range (1, 2, 3, 4, 5 rescaled as 1, 2.25, 3.5, 4.75 and 6, respectively). Total PMH and subscale scores are obtained by dividing the sum of scores of all the items in the full scale or subscales by the number of items in each, giving scores ranging from 1 to 6, where higher scores indicate higher PMH.
Participants were instructed to self-administer the second questionnaire on their own without seeking assistance from anyone within 3 days from the date of enrolment, to allow them adequate time to respond to the items. The questionnaire was provided in a sealable envelope which was collected in person by a study team member, who reimbursed participants with an inconvenience fee.
Statistical analysis
Statistical analyses were performed using the SPSS and MPLUS software. Two-sided significance was set at a p-value of < .5. Confirmatory factor analysis (CFA) was used to confirm the six-factor-higher-order structure of the original PMHI, where items were treated as categorical variables. The CFA was conducted with the MPLUS software using a polychoric item correlations matrix with weighted least squares, with a mean-adjusted chi-square statistic (WLSM) estimator that provides estimates of item loadings and thresholds. Overall model fit was measured using a number of goodness-of-fit (GOF) indices: the comparative fit index (CFI), the Tucker-Lewis index (TLI) and the Root Mean Square Error of Approximation (RMSEA). Cut-off values suggested by Hu and Bentler (1999) were used: above 0.95 for TLI and CFI, below 0.06 for RMSEA. Psychometric properties of the translated measures were further tested using the Item Response Theory Graded Response Model (IRT-GRM) to assess item difficulty and discrimination. Test information function (TIF) curve (Samejima, 1969) and differential item functioning (DIF) were investigated by age group (<40, 40 and above), gender and ethnicity. Internal consistency was estimated using Cronbach’s alpha coefficient. Normality of the PMHI and subscales was investigated with an acceptable range of skewness set at < 2 and kurtosis of < 7. Floor and ceiling effects were assessed by identifying the proportion of participants who had the lowest (1) and highest (6) possible scores respectively for the translated PMHI total and subscale scores. Acceptable level of floor and ceiling effects was set at <15% (Lim et al., 2015). Criterion validity was assessed with the Spearman’s rank correlation test to examine the relationships between the translated PMHIs and concurrent validity measures for the a priori hypothesis (Table 1). Strength of the correlations was classified as mild: r = 0.2–0.5; moderate: r = 0.5–0.8; high: r = 0.8–1.0 (Glanz et al., 2002). The study did not include a gold standard measure for spirituality. Earlier results had indicated none to weak correlation between the spirituality and affect scales such as PHQ-8 (Vaingankar et al., 2011; Vaingankar et al., 2016). For this reason, the spirituality subscale could not be included in the hypothesized associations in this study.
Results
Expert panel and focus group discussions
Following independent translations, three separate half-day expert panel discussions were conducted with three panel members each: a translator, a content expert and a lay person, who were all well-versed in the language of translation. Minor modifications were made to 92 items in all in the Chinese (12 items), Malay (41 items) and Tamil (39 items) translations of the tool during the expert panels. These translated versions were pre-tested and deliberated in six FGDs with a total of 48 participants for the Chinese (n = 19), Malay (n = 16) and Tamil (n = 13) language versions of the PMHI. The mean (SD) age of the participants was 50.8 (10.4) years with 20 (41.7%) men and 28 (58.3%) women. The final translated PMHI versions were obtained by modifying 10 items in the Chinese, 26 items and six response categories in the Malay and 6 items in the Tamil instruments based on the feedback. Table 2 presents the results of back translation performed at the end of this exercise and highlights items that differed in content but were deemed conceptually similar to the original.
Back translation of final items following expert panel discussions and FGDs for the three language versions of PMHI.
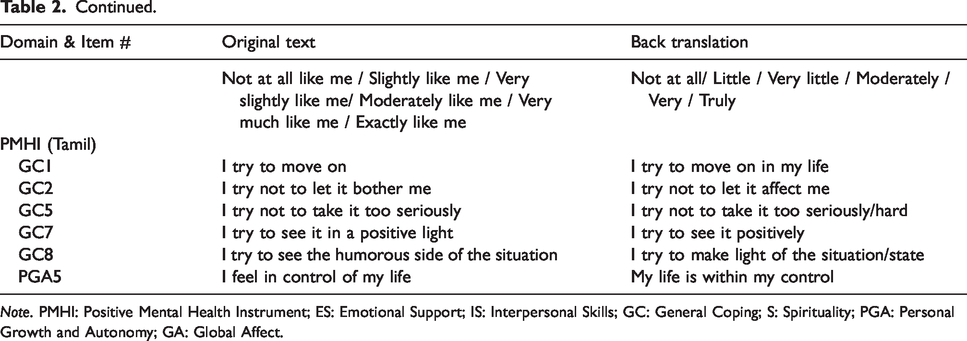
Note. PMHI: Positive Mental Health Instrument; ES: Emotional Support; IS: Interpersonal Skills; GC: General Coping; S: Spirituality; PGA: Personal Growth and Autonomy; GA: Global Affect.
Field survey
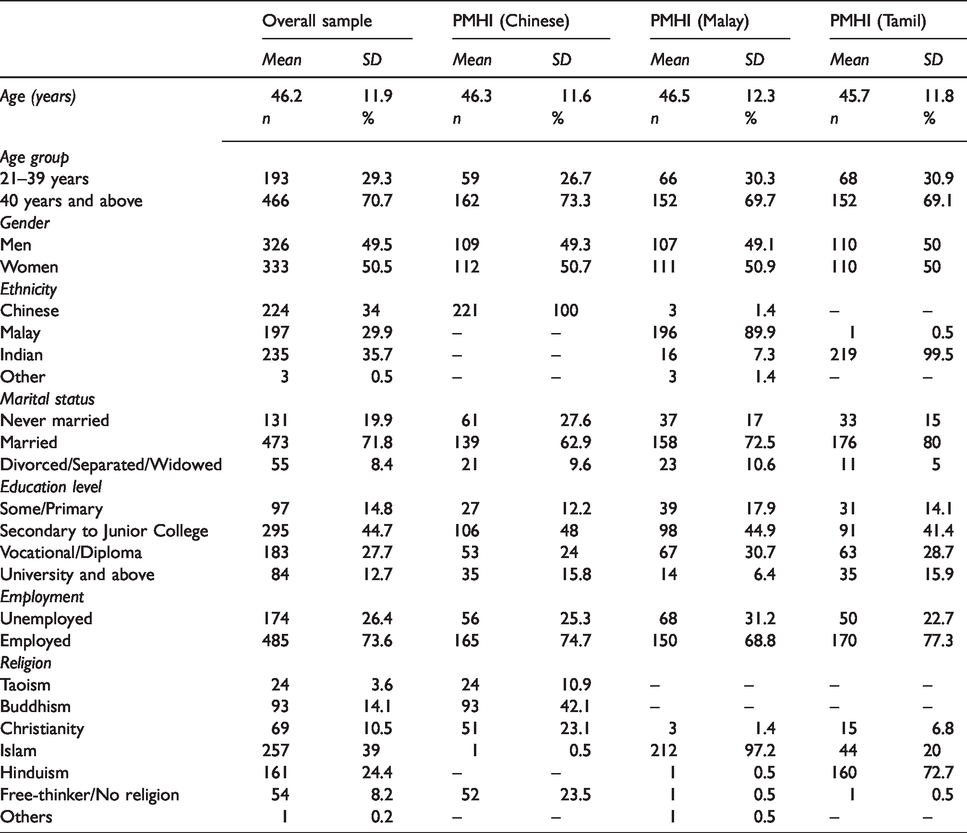
The mean (SD) age of the participants was 46.2 (11.9), with a near-equivalent proportion of men (49.5%) and women (50.5%) in the sample. Participants belonged to Chinese (34%), Malay (29.9%), Indian (35.7%) and other (0.5%) ethnicities. The majority were married (71.8%) and educated up to secondary to Junior College level (44.7%). Sociodemographic characteristics of participants in the overall sample and for the three language versions of the PMHI are presented in Table 3. Except for ethnicity and religion, all other characteristics were similar across the three samples. Given that Chinese, Malay and Tamil are spoken predominantly by the Chinese, Malay and Indian residents respectively in Singapore, these ethnicities and their associated religious affiliations had higher representation in the three samples.
Sociodemographic characteristics of the study sample.
CFA.
The GOF indices in the overall sample fulfilled the set criteria (RMSEA = 0.05, CFI = 0.962, TLI = 0.96) for the original six-factor-higher-order structure of the PMHI. The standardized loadings of all items within their factors (and the six-factors to the higher order factor) were high and ranged from 0.54 to 0.95 (Table 4a). Similar results were obtained across the three language versions of the PMHI. Table 4b presents the factor correlations observed for the scales.
Factor loadings of the second higher order of the PMHI subscales across three languages.
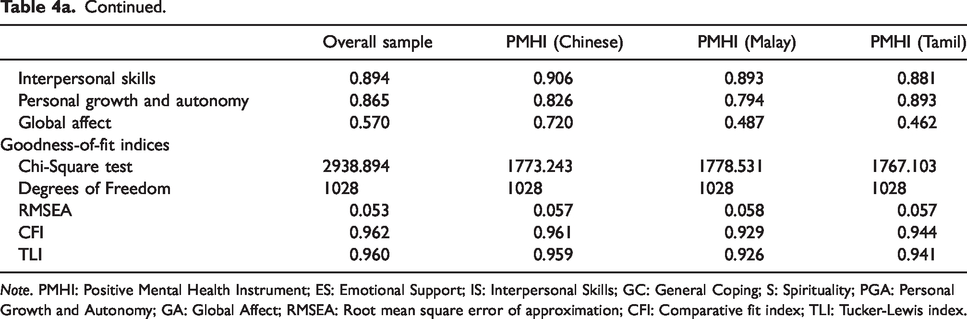
Note. PMHI: Positive Mental Health Instrument; ES: Emotional Support; IS: Interpersonal Skills; GC: General Coping; S: Spirituality; PGA: Personal Growth and Autonomy; GA: Global Affect; RMSEA: Root mean square error of approximation; CFI: Comparative fit index; TLI: Tucker-Lewis index.
Factor correlations for PMHI subscales across three languages.
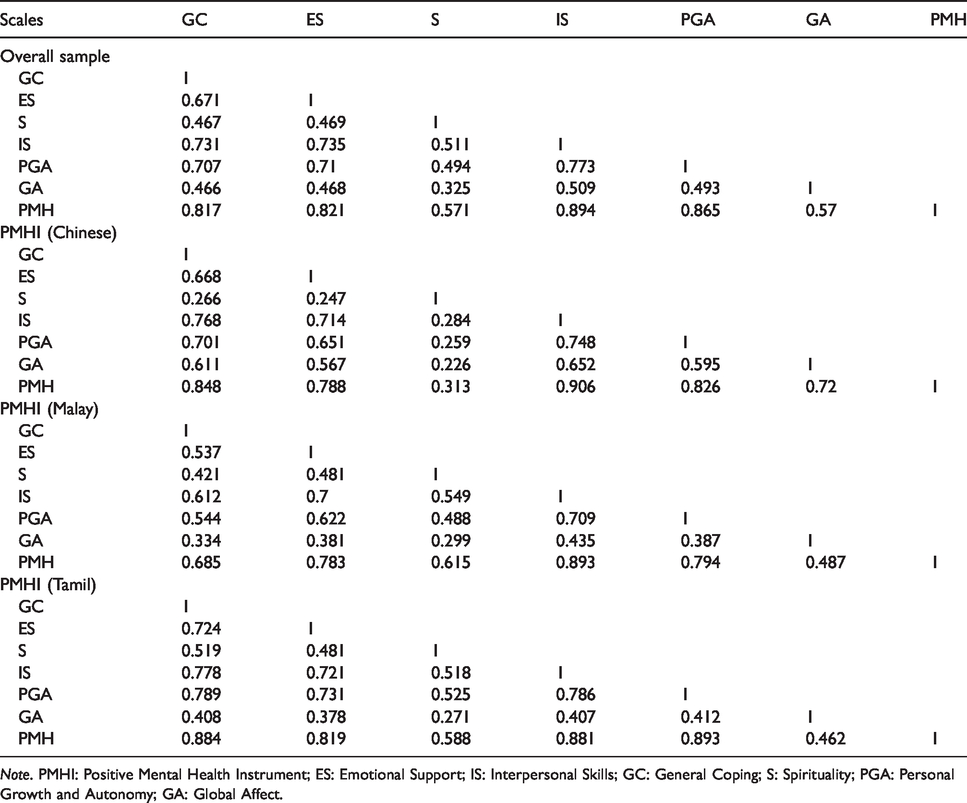
Note. PMHI: Positive Mental Health Instrument; ES: Emotional Support; IS: Interpersonal Skills; GC: General Coping; S: Spirituality; PGA: Personal Growth and Autonomy; GA: Global Affect.
IRT-DIF analyses.
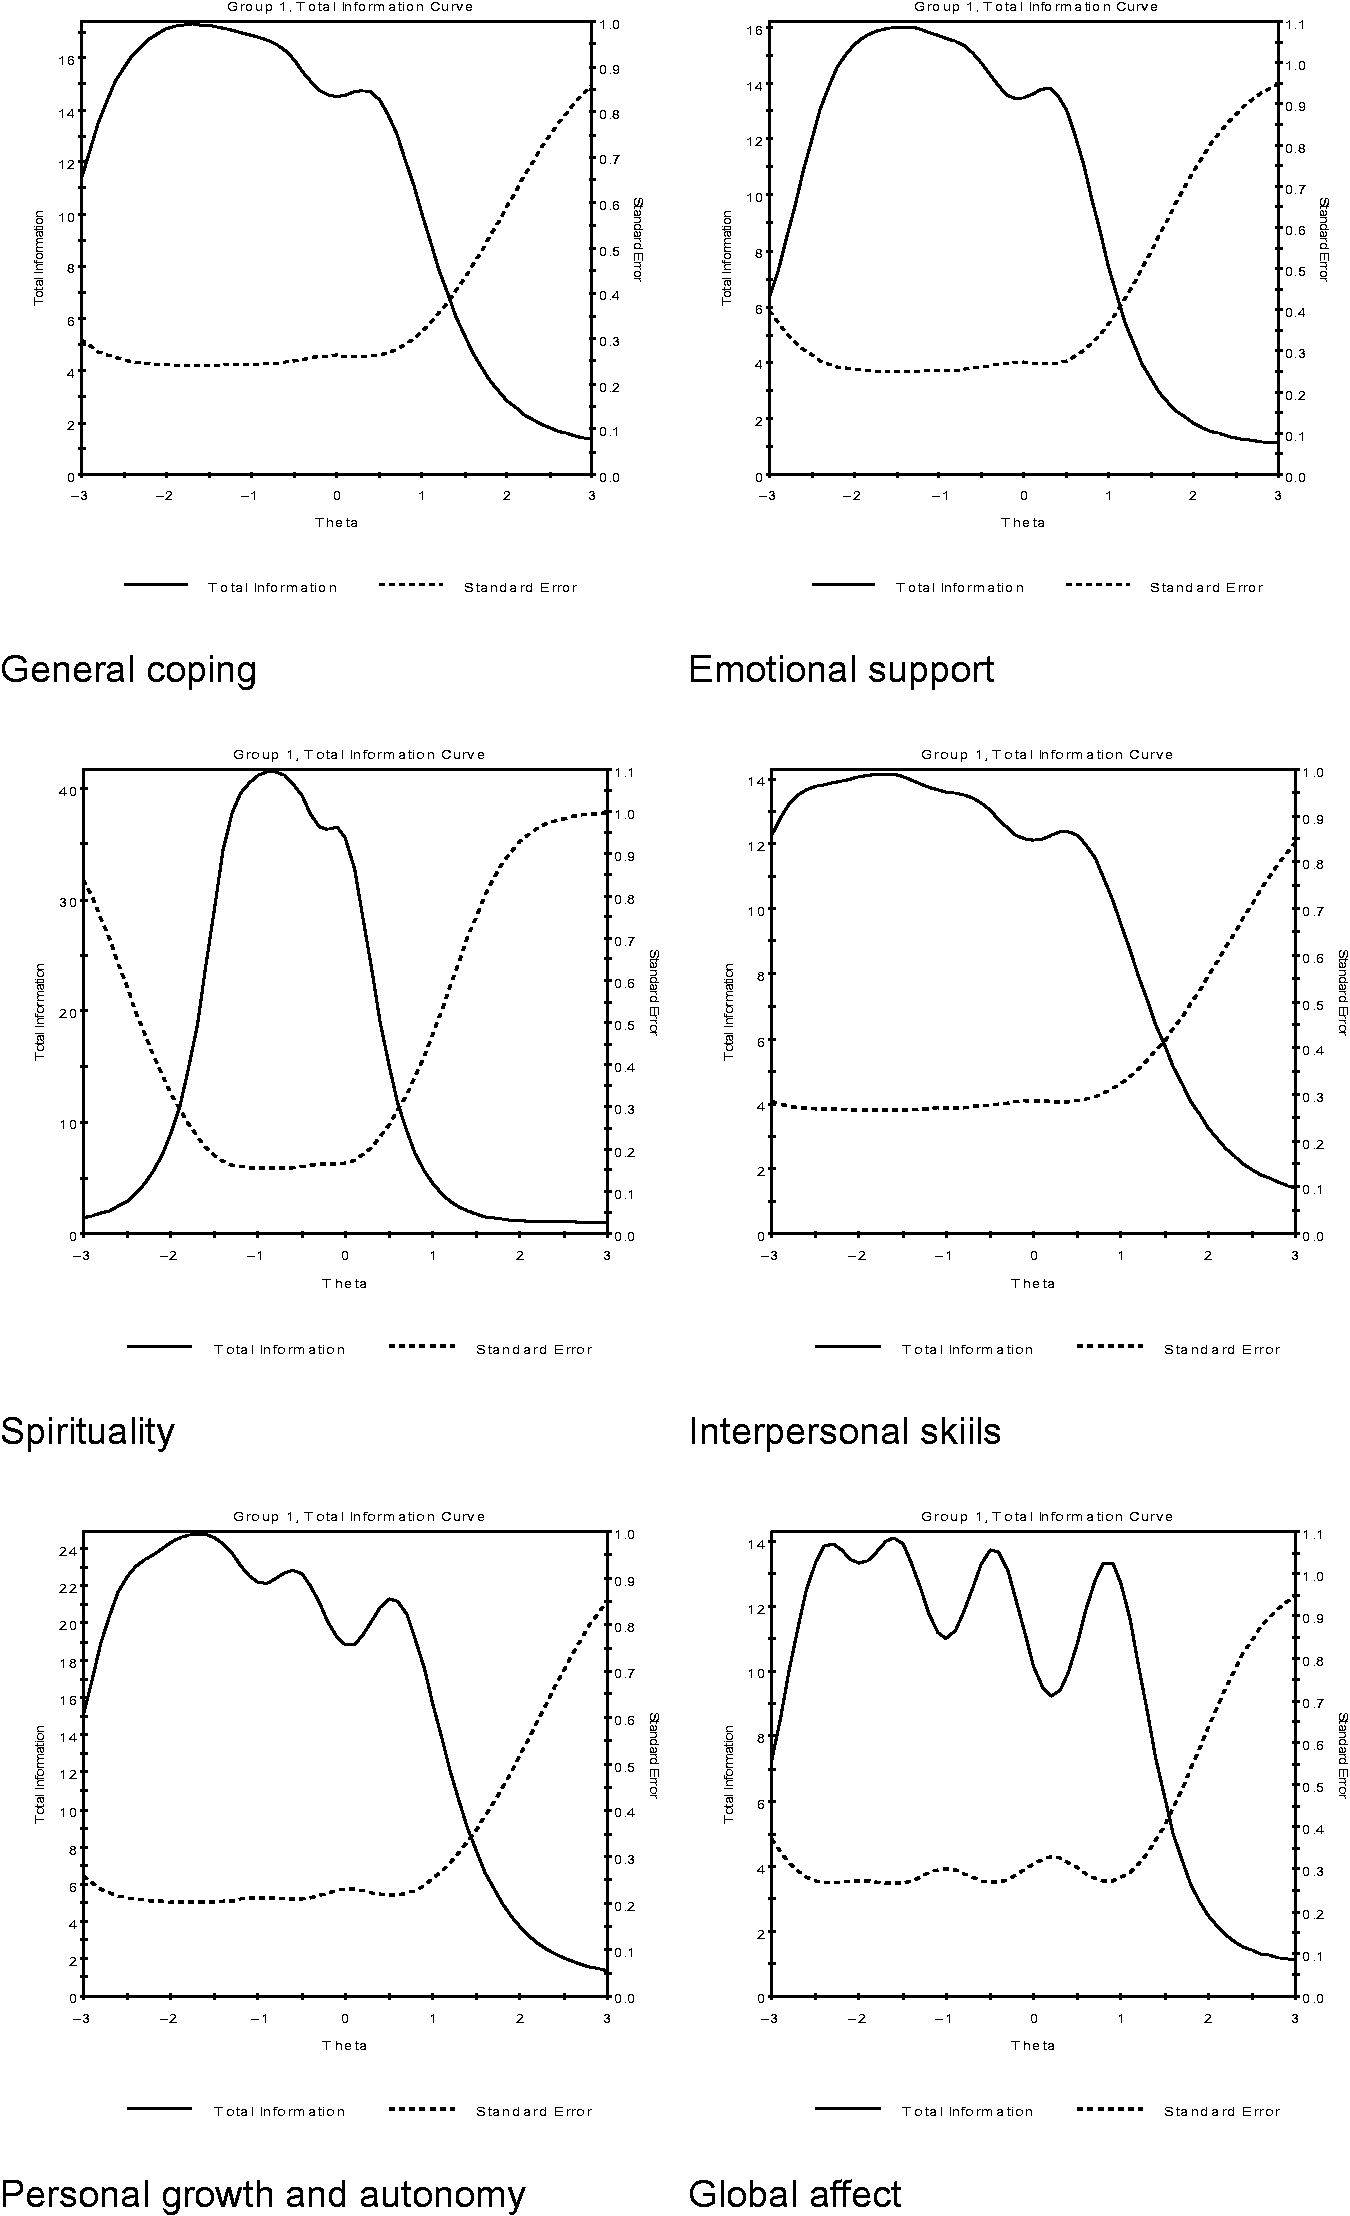
Results from IRT calibrations for all items in the overall sample are shown in Table 5. The item discrimination ranged from 1.24 to 3.07 for GC, 1.76 to 3.31 for ES, 3 to 6.24 for S, 1.63 to 2.75 for IS, 1.93 to 3.77 for PGA, and 2.32 to 4.03 for GA. The item difficulty estimates for the instrument ranged from -2.59 to 1.75. Figure 1 displays the TIF curves for the six subscales, which peaked between -2 to -1.5 on their underlying construct axis. This suggests that the subscales provide higher precision at the lower end of the continuum (theta < 1). Table 6 shows items with significant DIF. With the exception of the GA subscale, 11 items from five of the six subscales exhibited significant DIF across age and gender groups. For example, within the ES subscale in the Chinese PMHI, the item “When I have a problem there is someone I can go to for advice” had higher discrimination by women than men (Table 6).
Item parameter estimates (discriminant and difficulty) for the overall sample.
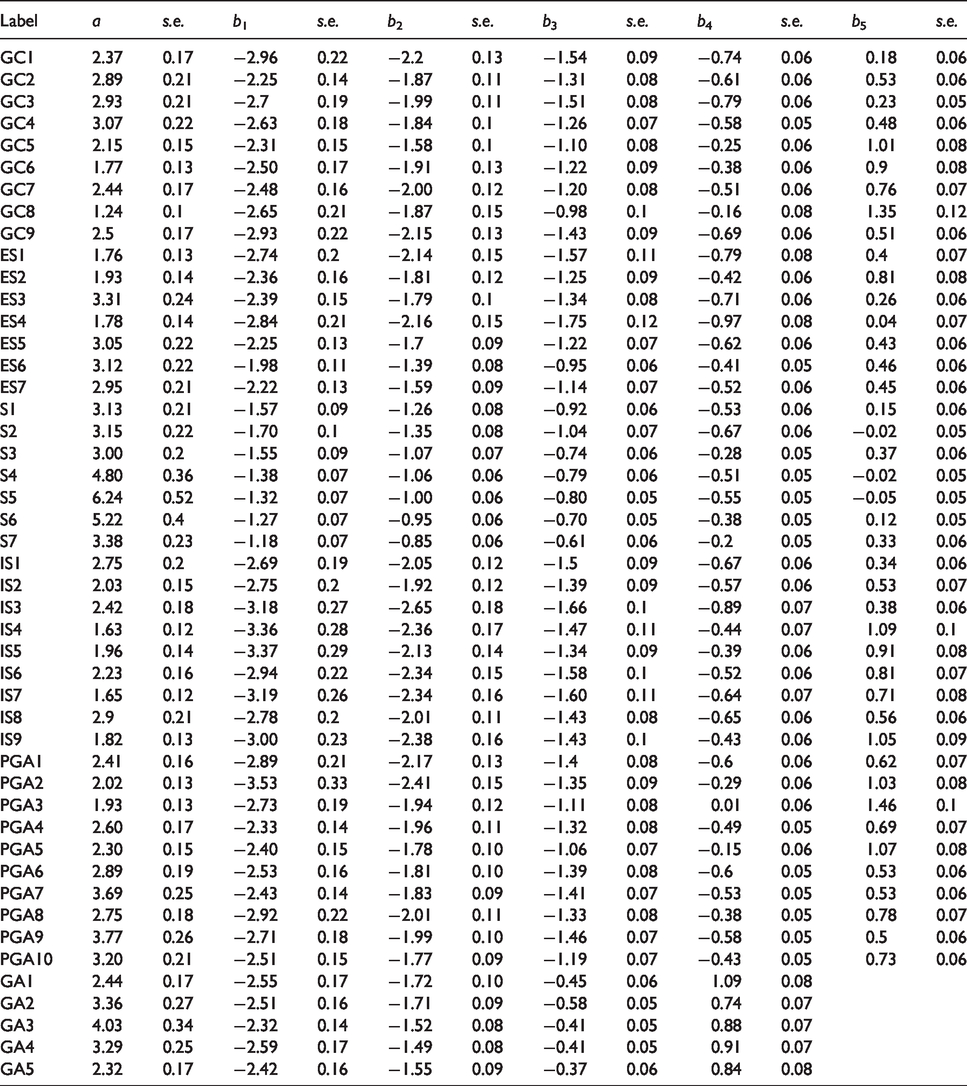
Item parameter estimates (discriminant and difficulty) using Item Response Theory Graded Response Model (IRT-GRM; Samejima, 1969) for the overall sample.
Significant DIF in each PMH item across age and gender for three language versions.
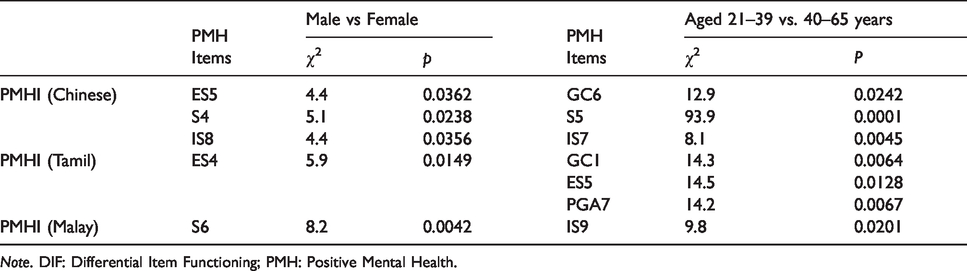
Note. DIF: Differential Item Functioning; PMH: Positive Mental Health.
Scale properties and PMH score distribution.
The PMH score distribution for the overall sample and the three language versions is illustrated in Figure 2. Missing data were very low for the 47 items in all the three PMHI language versions and ranged from 0.05% to 0.1%. PMH score distributions showed low to moderate negative skewness for most subscales; however scores were within the set limits, except for the “spirituality” subscale in the PMHI-Malay version, which exhibited high skew (-2.819) and kurtosis (12.538). Floor and ceiling effects ranged from 0% to 2.1% and 0.8% to 21.6% respectively for the total PMH and subscales in the overall sample. Floor effect was highest (4.5%) but within acceptable limits for the “spirituality” subscale of the PMHI-Chinese. The “spirituality” subscales of the PMHI-Malay (41.9%) and PMHI-Tamil (15.7%) and “emotional support” subscale of the PMHI-Tamil (17.9%) exhibited high ceiling effects. Mean total PMH in the overall sample was 4.68 (SD = 0.74), while those for the Chinese, Malay and Tamil versions were 4.18 (SD = 0.73), 4.96 (SD = 0.55) and 4.92 (SD = 0.64), respectively. The correlation between the item subscales is presented in Table 7. The pattern of correlations was similar across the three language versions.
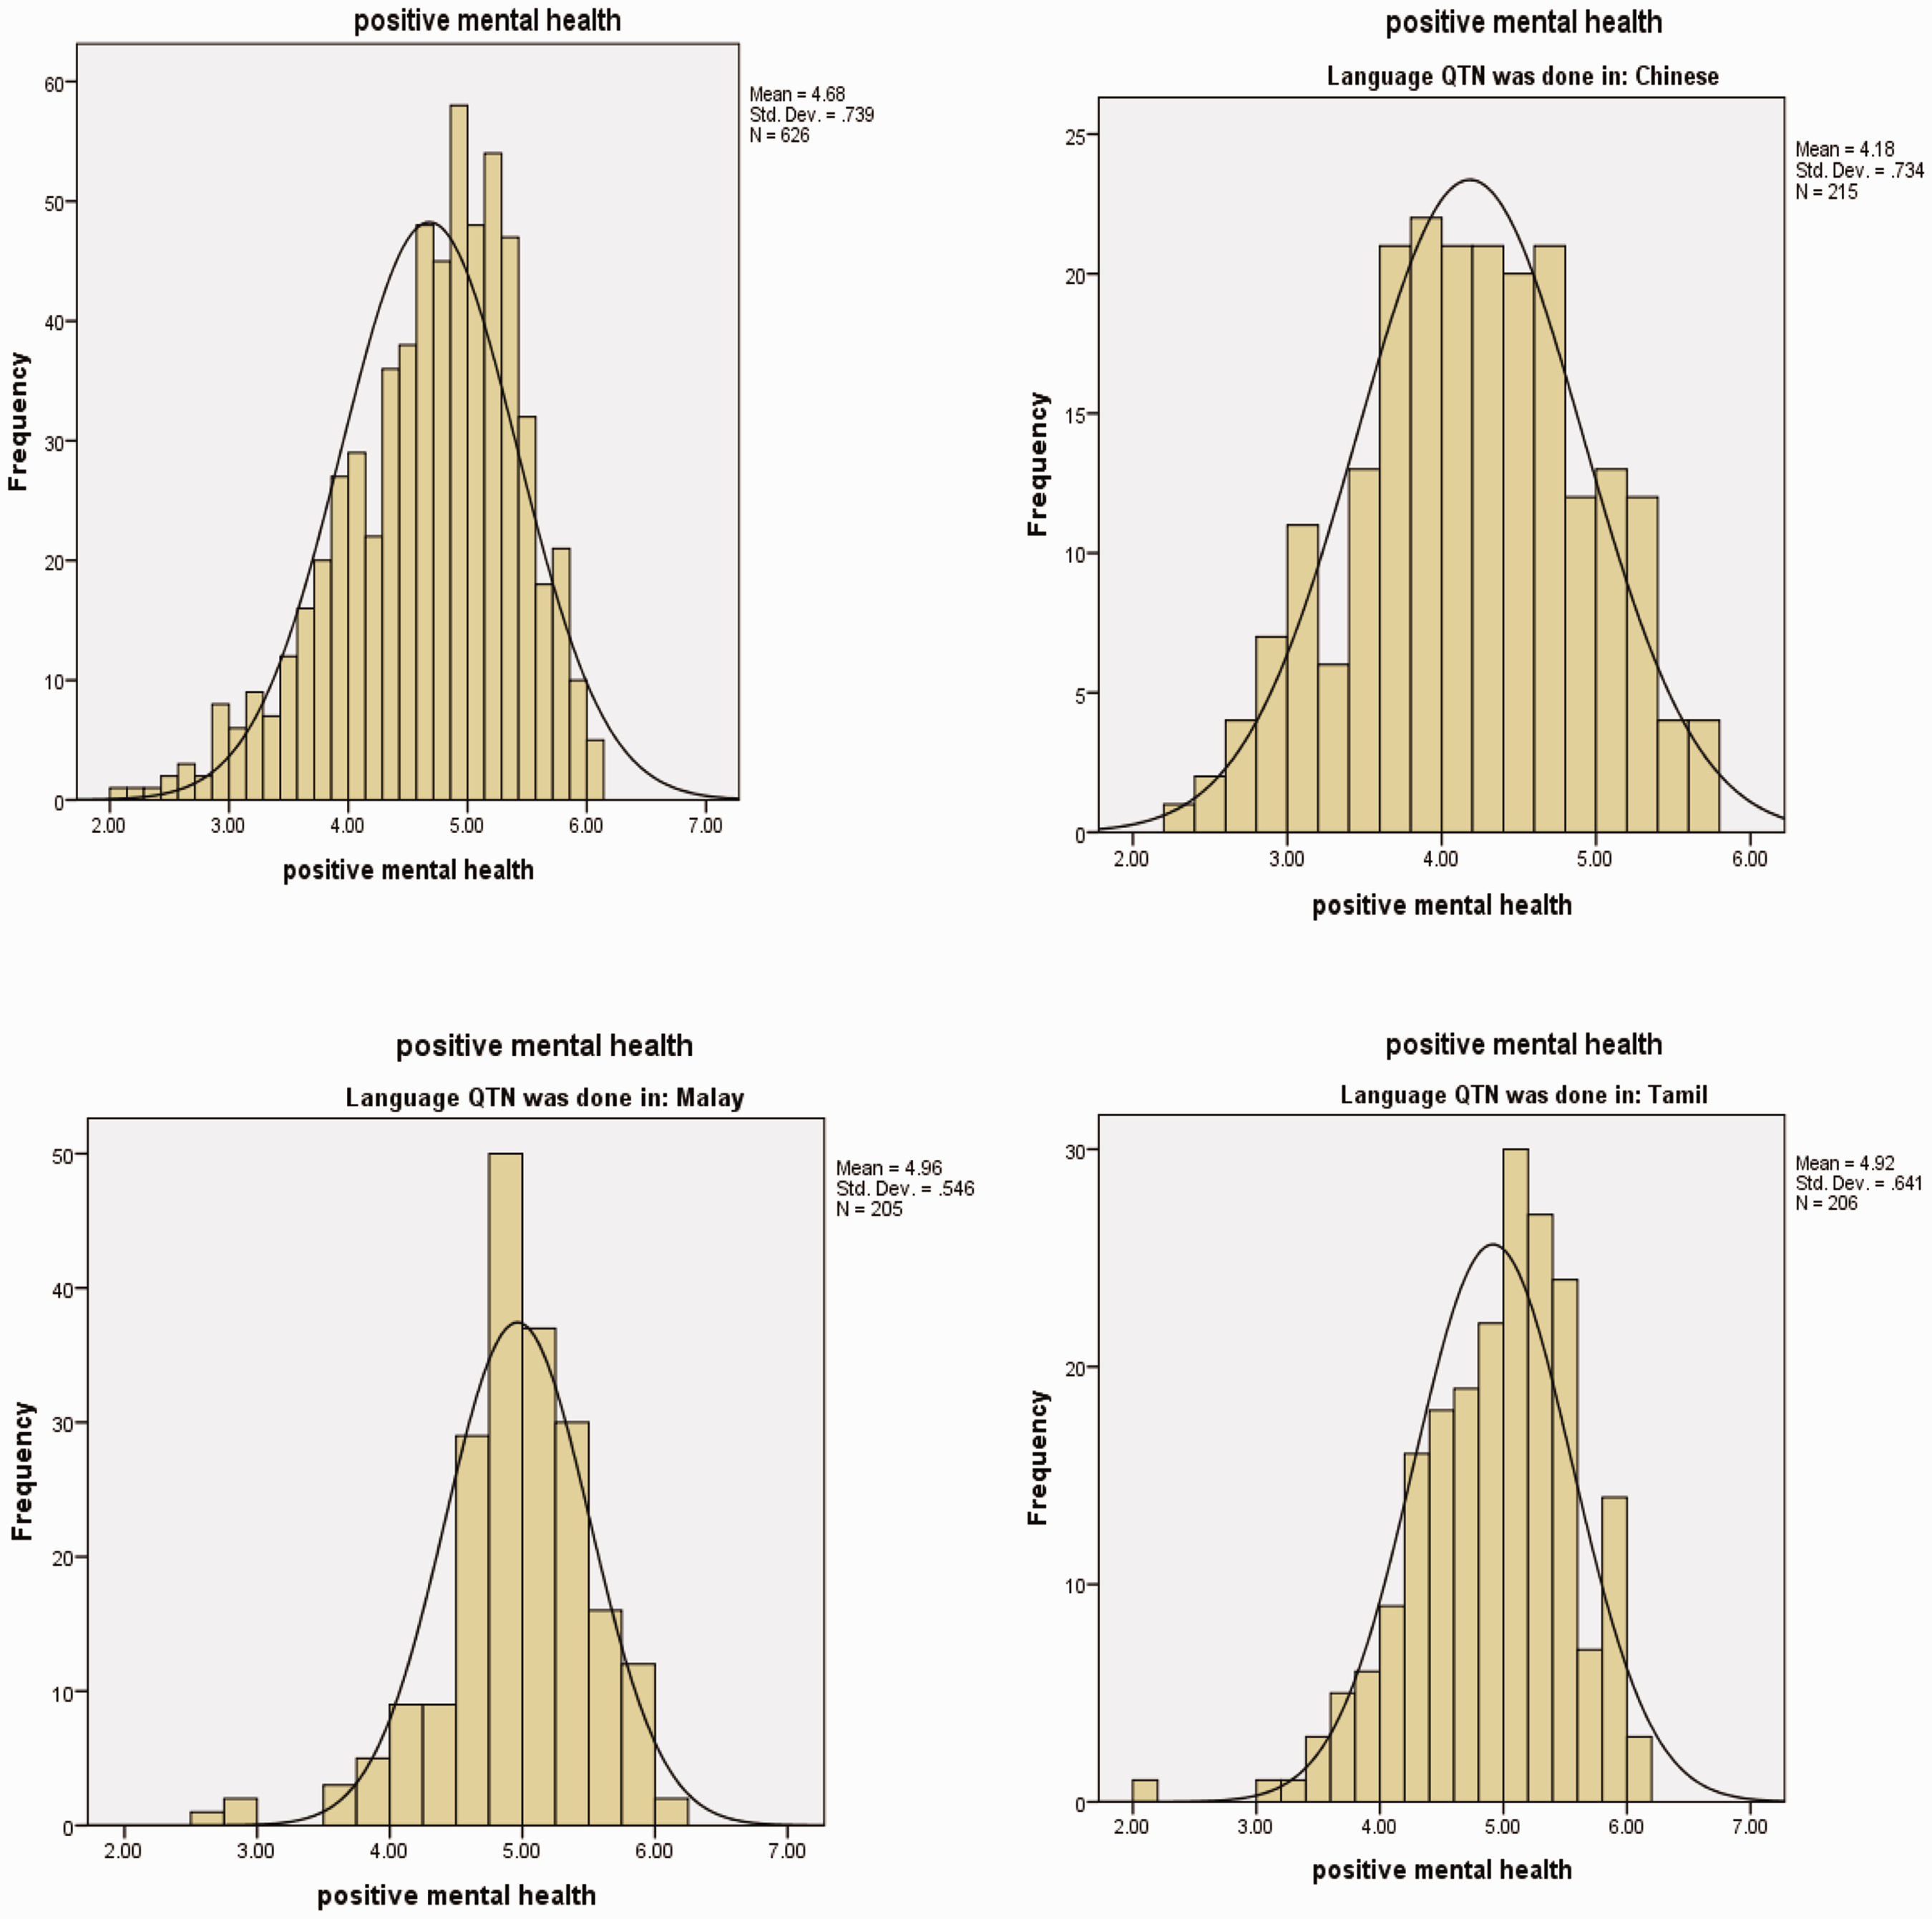
Score distribution for total PMH in the overall sample and for language versions.
Spearman’s coefficients for correlations between the translated PMHI versions and criterion validity measures.
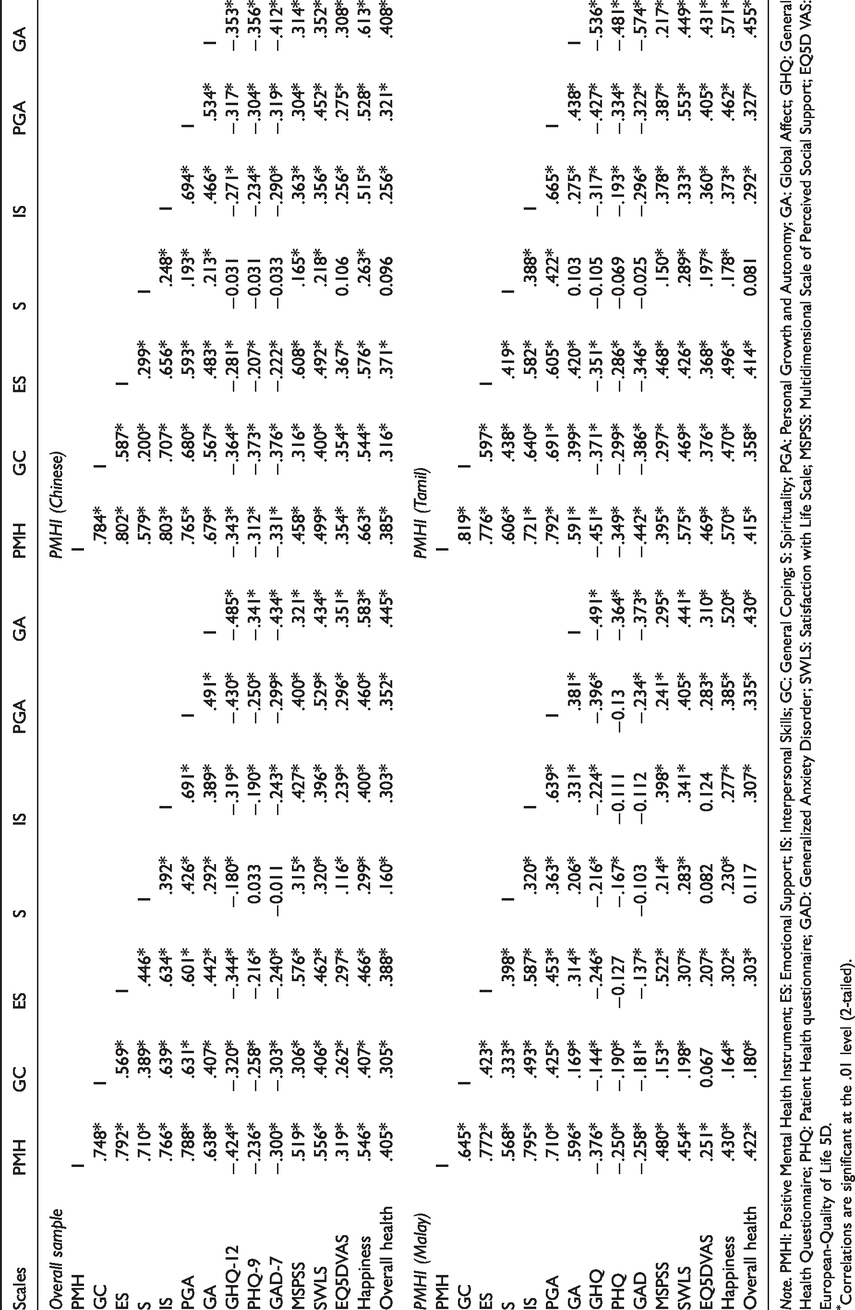
Note. PMHI: Positive Mental Health Instrument; ES: Emotional Support; IS: Interpersonal Skills; GC: General Coping; S: Spirituality; PGA: Personal Growth and Autonomy; GA: Global Affect; GHQ: General Health Questionnaire; PHQ: Patient Health questionnaire; GAD: Generalized Anxiety Disorder; SWLS: Satisfaction with Life Scale; MSPSS: Multidimensional Scale of Perceived Social Support; EQ5D VAS: European-Quality of Life 5D.
Correlations are significant at the .01 level (2-tailed).
Internal consistency.
The Cronbach’s alpha coefficients for total PMHI were 0.958, 0.954, 0.945 and 0.949 in the overall sample and the Chinese, Malay and Tamil translations respectively. The PMHI subscales showed equally high internal consistency for all the translated versions, with alpha coefficients ranging from 0.794 to 0.958.
Criterion validity.
Translated PMHI subscale scores were found to correlate, as hypothesized with other measures (see Table 1). Correlations between the three language versions and other measures based on observed scores are presented in Table 7.
Discussion
There are no standardized or validated measurement tools available in Asian languages to assess multiple PMH components at the same time. This study sought to develop psychometrically sound Chinese, Malay and Tamil translations of the PMHI for assessing PMH in Singapore, a multi-ethnic country in which these three languages are widely spoken. Results showed that these translations were appropriate, reliable and valid in their local contexts, and showed expected correlations with other measures suggesting good criterion validity. To the best of our knowledge, the PMHI is the only multi-dimensional tool available and validated in three Asian languages. Given the growing interest in measuring well-being across populations, the translations of the PMHI provide valid and reliable resources to be used in both community and clinical settings. This study also makes significant contribution to the well-being assessment literature pertaining to non-English-speaking populations.
The original PMHI was translated simultaneously into three languages using a combination of methods in this study. It is recommended that cross-cultural translations of measures aim towards cultural equivalence (Cha et al., 2007). In this study, the use of forward translations followed by an expert panel and FGDs with local populations and end-users provided a good test of the appropriateness and acceptability of the translations. Nevertheless, translations may not match the exact meaning and cultural loading of the original item. Expressing words or feelings from one language to another poses certain challenges, such as limited vocabulary or wordy alternatives (Behling & Law, 2000). In our study, this seems particularly true for the Malay language (Nurkhalisah, 2013), where a number of PMHI-Malay items needed to be rephrased before the back translation as compared with their original statements. Although having statements with sufficient similarity to convey the construct is known to reduce bias in self-report measures, it is crucial to verify conceptual similarity carefully through psychometric testing (Guyatt, 1993). This study sought to conduct such tests. Having items uniformly worded across the original and the translated versions ensured that respondents would not require varying instructions to administer the different versions. Uniform wording across different language versions can thus improve the consistency and reliability of the measure, thereby allowing direct comparisons to be drawn across different populations and regions.
In our study, we also applied IRT to develop items that offer uniform test scoring and accuracy across different population groups to enable direct comparisons of the scores. The impact of age and ethnicity-related response abilities (traits) that might influence how people responded to the translated items was obtained through differential item functioning test information curves.
Based on the results, all subscales offered more useful information below the mean (θ scale peaked in the negative zones) in the overall sample, suggesting they will be more informative and useful in assessing latent factors, where the expected average levels are not at the extreme end. The negative thetas also denote items being relatively easy to respond even among those with lower than average response ability, hence, application in clinical samples would result in a low respondent burden. On the other hand, the relative simplicity and ease of responding to scale items may produce higher floor or ceiling effects. In addition, the performance of the scale in more severe latent factors or conditions needs to be carefully assessed. Similar results were obtained in earlier studies using the English version of the PMHI in the general population (Vaingankar et al., 2011) and in people with mental disorders (Vaingankar et al., 2016). It is noteworthy that the GA subscale assessed the latent trait over a wider range of levels compared to the other scales, rendering the former particularly useful for assessing individuals with elevated GA levels. The items also demonstrated acceptable levels of difficulty and high discrimination, suggesting the scales will be less prone to bias and will discriminate well between people with high and low levels of PMH. The study findings, thus, contribute to the hitherto limited literature on the discriminant property of PMH and well-being measures.
Results from the IRT analysis also suggested that some items have stronger discriminant properties than others. For instance, the item “S5: I feel God’s presence in my life” (slope, a = 6.24). In earlier studies using the original PMHI, the item has demonstrated an equally high slope (a = 5.69) in the general population (Vaingankar et al., 2011) and among people with mental illness (a = 4.36) (Vaingankar et al., 2016). Therefore, the current results do not necessarily indicate an influence of the translation. On the contrary, this item relating to religious beliefs may reflect cultural influence, such as internalized values that are deeply-rooted in people’s mindset, thus making it comparatively sensitive and highly discriminating in differentiating response styles in varied societies. Further studies will be necessary to understand the influence of religion on the construct of PMH.
The DIF analysis showed that the items generally apply equally well across age and gender groups. However, a total of 11 items of the translated PMHIs were found to exhibit DIF—four items had DIF by gender, six differed across age, while one showed both. The item level DIF may have impacted the scale scores, in that the effects of items that had DIF may have been responsible for the higher or lower scores than their true levels (Kleinman & Teresi, 2016). However, given the low proportion of items with DIF and their relatively uniform distribution across subscales in each language version, the impact of these items on final scores is likely to be minimal. Compared with DIF assessed in an earlier study in the general population, in which the original PMHI had showed DIF by age, gender and ethnicity in 15 items (Vaingankar et al., 2011), the current study identified a different set of items except for one—“IS7: I am willing to give up something if it makes my family or friends happy” which showed DIF by age in both the samples. While it is plausible that age and gender groups perform differently in the translated PMHI items due to changes to their format and content, the observed DIF may also be due to differences in the socioeconomic characteristics of the two study samples. Our primary interest in this study concerned differences by age and gender. Other differences between the groups, such as ethnicity, religion, marital status or educational level, were not controlled for in this analysis. To avoid ambiguity on the source of DIF, researchers have at times administered both measures to bilingual participants and assessed DIF by language (Cha et al., 2007). We did not follow such a procedure in this study. Further investigation is thus warranted on estimating item difficulty and discrimination by important population groups, and understanding the influence of population differences on DIF.
The total PMH values observed in the overall study sample (4.68), and for the Chinese (4.18), Malay (4.96) and Tamil (4.92) versions, are higher than the original PMHI estimates generated in the general population (4.53) (Vaingankar et al., 2011), people with mental disorders (3.94) (Sambasivam et al., 2016) and working adults (4.54) (Picco et al., 2017). Low levels of PMH and well-being are expected in patient populations (Markowitz, 1998; Nicoletti et al., 2017; Ritsner et al., 2000) and can explain the difference in PMH from the current sample. In terms of the other samples, age has consistently been associated with total PMH, with older cohorts showing higher scores (Vaingankar et al., 2013; Sambasivam et al., 2016; Vaingankar et al., 2018). In a representative general population sample, the mean total PMH seen among those aged over 40 years was found to be around 4.68, which is very close to the current estimate obtained in a sample with average age of 46.2 years (Vaingankar et al., 2018). Likewise, low PMH scores among the Chinese samples compared with those of Malay and Indian ethnicity has been consistently shown. Given that the PMHI-Chinese sample was entirely ethnic Chinese, this was expected. These findings therefore provide further evidence of validity of the translated PMHIs and their equivalence with the original tool performance.
The PMHI items showed minimal missing data and comparable floor and ceiling effects for all subscales, which were largely similar to those seen in an earlier study (Vaingankar et al., 2018), except for the “spirituality” subscale. Ceiling effect and skewness were particularly high for the “spirituality” subscale of the PMHI-Malay. Scales with high ceiling effect exhibit poor responsiveness to changes. A drawback of poorly responsive scores is that in outcomes research, more subjects are required to show a statistically significant difference between groups. Although the “spirituality” subscale comprises items representing both spirituality and religiosity, findings may have been influenced by the religious affiliations of the participants. There is growing evidence of the impact of religiosity on the mental health of individuals by way of offering some protection against poor mental health—for example, by providing a secure attachment to God and meaning in life (Moreira-Almeida et al., 2006). However, such beliefs are often influenced by traditional, personal and theistic philosophies that may vary across religions in their interpretation and manifestation. Compared to the PMHI-Malay sample where a majority (97.2%) of the sample practiced Islam, the other samples exhibited a comparatively wider and heterogeneous mix of religions, which could partly explain these findings. Moreover, Lucchetti et al. (2015) state that “the concepts of spirituality and religiosity… are distinct constructs, sometimes difficult to distinguish”. Given that end-users of the translated PMHI are more likely to be older adults and the fact that this group tends to have higher rates of involvement in religious and/or spiritual practices (Zimmer et al., 2016), a more refined understanding of these constructs would be necessary to assess their impact on the translated PMHI scores in older samples.
The study has successfully validated the three language versions of the PMHI in the local Singaporean population. It is, however, imperative to take sociocultural backgrounds and differences in the sample into consideration while applying these measures. Ellis and Stam (2015) have proposed that “culture and mind are mutually constituted”, and hence, the assessment of mental parameters need to focus on the diversity within and across different cultures. In Singapore’s context, the three language versions were largely completed by individuals of Chinese, Malay and Indian ethnicities. Of these, the Malay ethnic group has the most homogeneity in terms of religion and languages spoken at home, whereas the Chinese and the Indian ethnic groups have a wider religious affiliation and speak diverse languages at home (Statistics Singapore, 2015). The likely homogeneity of the Malay group could have influenced some of the findings observed in the study. Particularly in line with this, are the findings observed with the Malay spirituality subscale that showed larger kurtosis and skewness, ceiling effect and DIF in the sample. While it would be ideal to study specifically whether the item content, ethnicity or religion influenced these, it may be difficult to separate these out given the highly homogenous Malay sample. An earlier study with the original measure investigating sociodemographic determinants of PMH provides comparisons with the current findings. The study provided largely similar observations, particularly in terms of the associations between age and ethnicity (Vaingankar et al., 2013). Future research could further investigate scale properties in diverse populations, such as younger samples or people with mental disorders or severe health conditions. Moreover, given the impact of other factors such as population ageing and tourism on Singapore’s sociocultural landscape (Teo, 1994), it will also be important to test the properties of the instrument in longitudinal studies.
This article contributes to the literature by extending the knowledge on PMH components to a more diverse and inclusive population sample, with a particular focus on older and less educated populations who may not be able to self-administer measures that were not yet available in Chinese, Malay or Tamil. A popular tool, the WEMWBS is validated and available in Chinese (Dong et al., 2016) along with other European languages (Castellví et al., 2014; Smith et al., 2017). However, it provides only one global mental well-being score and does not include aspects of spirituality or religion. A considerable body of research indicates that more than one component of well-being and religiosity should be considered in the definition of well-being, particularly in older and unwell populations (Dodge et al., 2012; Jimenez-Fonseca et al., 2018; Hackert et al., 2019). Through our work on the PMHI and its translations, we have provided a theory-based, valid tool for assessing positive mental health in three Asian populations—Chinese, Tamil-speaking Indians and Malays, allowing the applications of the tool in these wider populations in Singapore and globally.
This study has some limitations. The participants for the field testing were recruited via convenience sampling with relatively small samples per language, as the focus was on psychometric testing. Studies in large samples from diverse populations are needed to generalize and study the estimates further. Test-retest reliability and responsiveness to change were not assessed in the study due to resource constraints. All the measures were based on self-report while assessing the psychometric properties of the translated PMHIs. Future studies using information from other sources or structured interviews to corroborate self-reports will be helpful. In this study, low to moderate correlation coefficients were accepted as a mark of concurrent validity due to the lack of established gold standards. Given the diversity of the theoretical backgrounds underpinning mental health and well-being, and the lack of specific definitions, these constructs tend to be associated, overlapping and multi-dimensional, resulting in low correlations. There is therefore a need to continue to develop and refine appropriate scales to enable assessing the validity of such measures.
Conclusion
The Chinese, Malay and Tamil translations of the PMHI demonstrate high internal consistency and validity in the multi-ethnic population of Singapore. Future research should assess DIF by language and test the responsiveness and validity of the translated instruments in other populations and settings. Nevertheless, making the translated PMHI available provides several advantages. The translated PMHI versions were found to be equivalent to the original PMHI and therefore the scores can be interpreted in the same way across all the language versions, making it possible to reliably measure PMH among the Chinese-, Malay- and Tamil-speaking populations in Singapore. This study presents opportunities for further research and development, as well as further evaluations of mental health interventions in diverse populations.
Footnotes
Declaration of Conflicting Interests
The author(s) declare that they have no competing interests with respect to the research, authorship and/or publication of this article.
Funding
The author(s) disclosed receipt of the following financial support for the research, authorship, and/or publication of this article: This research was supported by the Singapore Ministry of Health’s National Medical Research Council under the Centre Grant Programme (Grant o:NMRC/CG/004/2013).