
Abstract
Aims and objectives:
In this study, we investigated the neural oscillatory patterns occurring during sentence-level overt bilingual processing tasks on 46 German–English bilinguals with the intention of finding out if there were task-specific oscillations for this language pair.
Methodology:
Four tasks, including Language 2 (L2) listening, Language 1 (L1) speaking, L2 shadowing (i.e., repeating a segment of an utterance), and backward interpreting (i.e., orally translating L2 sentences to L1), were implemented with the technique of electroencephalography (EEG).
Data and analysis:
Data included demographic indices, neural oscillation metrics, and oral production scores from participants. Static spectral analysis, time–frequency analysis, principal components analysis, cross-frequency coupling, and inferential statistics were applied to the data.
Findings:
The sensory task and articulatory tasks differed greatly in the delta–theta band and the beta–gamma band in terms of time–frequency dynamics. Analyses also revealed variations in a frontal/prefrontal theta component and a distinct gamma component across the four tasks. Moreover, we found a right fronto-temporal theta–gamma coupling unique to backward interpreting.
Originality:
The task-wise comparison experiment paradigm has rarely been implemented in neuroimaging research on language, especially so in EEG research on bilingualism.
Significance:
The findings provide novel insights for the understanding of language conversion mechanism and may benefit the training of professional interpreters.
Introduction
Sentence processing is an important topic in the field of language research, as it entails quite complex psychological and neural mechanisms. As the mode for everyday human verbal communication, in numerous aspects sentence processing is drastically different from single word processing and therefore has drawn special attention from cognitive neuroscientists. Thus far, some consensus has been reached regarding the mechanisms particular to sentence processing, including syntax, morpho-syntactic structures, and prosody (cf. Dussias et al., 2015; Hagoort, 2019; Wagner & Watson, 2010). In the broader context of bilingual sentence processing, however, there is still a lack of theories or models that can help explain the whole picture (Frank, 2021), particularly regarding brain dynamics.
The quest to understand a language phenomenon typically starts from word-level investigations. Understanding language processing, however, requires research on sentence processing, as most linguists would agree that the latter is more important than the former. For example, compared with words, sentences embody syntactic structures, which are processed in a way that is drastically different from the processing of words (cf. Altmann, 2001). Such differences are adequately demonstrated in psycholinguistic models for sentence processing (e.g., the activation-based model, Lewis & Vasishth, 2005) and those for word processing (e.g., the multilink model, Dijkstra et al., 2019). Therefore, in contrast to the plethora of literature on word processing, the small body of research necessitates more investigations on sentence processing, which is more complex, more systematic, and arguably more revealing.
Single word processing and sentence processing appear to have different neurobiological bases. For example, the temporal lobe has been repeatedly identified as the brain region responsible for syntactic processing required to comprehend a sentence. Both the left anterior temporal lobe (Friederici et al., 2010; Rogalsky et al., 2011) and the left posterior temporal lobe (Flick & Pylkkänen, 2020; Matar et al., 2021) are involved, and this holds for both listening task (the acoustic modality) and silent reading task (the visual modality) (Bemis & Pylkkänen, 2013; Brennan et al., 2012). In addition, other features peculiar to spoken sentence processing, such as prosody, have been localized at the left anterior inferior frontal gyrus (van der Burght et al., 2023). These together present a relatively clear map for the neuroanatomy of sentence processing but underscore the fact that we understand more about the neurostructural underpinning of sentence processing than about the functional mechanisms of it such as neural oscillation dynamics (typically studied via electroencephalography [EEG] recordings on the human scalp).
Regarding neural oscillations, these are commonly known as brain waves and refer to the rhythmic or repetitive patterns of neural activity within a neuron or between groups of neurons (Fries, 2005; Varela et al., 2001). Oscillations are usually described using frequency bands, including the delta band (0.5–4 Hz), the theta band (4–7 Hz), the alpha band (8–15 Hz), the beta band (20–30 Hz), and the gamma band (30–100 Hz). Berger (1929) was the first to record EEG signals from the human scalp, and the first to define neural oscillations in the alpha and beta bands. Berger (1929) observed that, when participants were in an eyes-closed state, there were brain waves at around 10 Hz in the signal, which were suppressed conspicuously when the eyes opened. Berger named such frequency “alpha band” (also known as Berger’s wave, cf. Karakaş & Barry, 2017), and the alpha reduction occasioned the recognition of beta band at around 20 Hz. It was the discovery of alpha and beta bands that made possible the many associations later between neural oscillations and cognitive activities of various kinds.
Neural oscillations subserve a wide range of bilingual activities, including word retrieval (Bastiaansen et al., 2005, 2008), syllable processing (Leong & Goswami, 2014; Power et al., 2012), encoding of unstructured word lists (Lega et al., 2012), the storage of syntactic phrases (Bonhage et al., 2017; Vassileiou et al., 2018), sentence-level semantic processing (Bastiaansen & Hagoort, 2015; Fedorenko et al., 2016), and sub-syllabic processing (Di Liberto et al., 2015). In terms of the features of sentence processing, two other electrophysiological brain components, called event-related potentials (ERPs), have been recognized as the most common across language studies: N400 and P600. Although it has not been fully reconciled, the evidence tends to link N400 with semantic processing (e.g., An et al., 2022; Daltrozzo et al., 2012; Dudschig et al., 2016; Pijnacker et al., 2017), and P600 with syntactic processing (e.g., Delogu et al., 2019; Ovans et al., 2022; Zhu et al., 2018).
Regarding oscillatory characteristics, semantic processing has been mapped onto γ band oscillations (Penolazzi et al., 2009), while θ band oscillation has been associated with verbal working memory (Bastiaansen et al., 2002), error detection (Hald et al., 2006), and syllable (or phonetic) processing (Mai et al., 2016; Peña & Melloni, 2012). Based on such empirical evidence, two neurocognitive models of sentence processing have been proposed, including the Neurocognitive Model of Auditory Sentence Processing (Friederici, 1995, 1999, 2002, 2009, 2011) and the Memory, Unification, and Control (MUC) Model (Hagoort, 2003, 2005, 2013, 2016), both of which later received support and inconsistent findings from empirical investigations (cf. Bornkessel-Schlesewsky et al., 2016).
Note that the two aforementioned models, and the majority of the existing neurocognitive research on sentence processing, have focused on the “local” aspects of the subject matter, that is, they looked into sentence processing by manipulating the semantic and/or syntactic elements in the sentence such as the critical words (Hald et al., 2006) or the subject–object distance (Meyer et al., 2013), producing findings indicative of the operational functions of the brain in a specific linguistic task. In contrast, very few studies were designed as a “global” protocol, that is, comparing task-related neurocognitive traits without minor lexical or phrasal manipulations. Consequently, there is scant knowledge about how the human brain functions when processing different sentence-level tasks.
Taken together, these prompted this study, which revealed the oscillatory patterns related to different sentence-processing tasks among German–English bilinguals. Our aim was to determine the oscillation characteristics unique to passive listening, overt speech production, and interpreting the second language (L2) to the native language (L1), using EEG. Another important point is that the second language of a bilingual (such as the syntax and structural relationships, for example) can have a large impact on the processing of the native language, and vice versa (cf. Dussias et al., 2015). Here we review sentence-processing EEG studies exclusively on native German speakers, with tasks including listening comprehension, speech production, and interpreting (i.e., re-rendering messages from one language to another).
The first electrophysiological research on German–English sentence processing was reported by Petsche et al. (1993) using the experiment paradigm of interpreting. In their study, they recruited three female professional German–English interpreters for a two-way silent interpreting task and measured participants’ EEG oscillations. The analyses revealed that temporal beta (24–32 Hz) oscillations are most involved in interpreting, and that forward interpreting (L1–L2) incurs extra right hemisphere activation relative to backward interpreting (L2–L1). Similar results were obtained by Kurz (1995) using the same method. Reiterer et al. (2005) investigated the relationship between band-wise cortical coordination and proficient L2 processing using EEG. Reiterer et al. (2005) recruited 38 female German–English bilinguals, and evenly divided the participants into two groups based on their L2 proficiency. They then played some German and English video or audio clips of 2–3 minutes in such a way that formed three conditions, that is, the pure acoustic condition, the pure visual condition, and the bimodal condition. Participants were asked to fill in a questionnaire after being exposed to such stimuli. The EEG results showed that, in the pure visual condition, the high-proficiency group exhibited significantly higher β band activation than the low-proficiency group, which they explained as a manifestation of the different strategies of language processing between these participants. Using the same experiment protocol, Reiterer et al. (2009) reported that the right hemisphere is more involved in L2 processing than the left among low-proficiency bilinguals, indexed by distant γ band synchronization.
Apart from the β-band and γ-band activations, other frequency bands have also been found to subserve German–English sentence processing. Bonhage et al. (2017) tested the chunking strategy during sentence comprehension by recruiting 19 native German speakers and administering a working memory test and a lexical decision task. Participants saw a sequence of words and needed to either memorize them or judge the legitimacy of certain words. The results showed that chunking incurred a δ range (4 Hz) increase, while memory retention generated a synchronized θ (6 Hz) and β/γ range (27–32 Hz) decrease, which the researchers regarded as reflecting the reduced demand for retention and concluded that chunking could “unburden” memory. Part of the findings corroborated those of an earlier word-level interpreting research by Grabner et al. (2007). Grabner et al. recruited 13 female German–English student interpreters and measured their EEG time–frequency (TF) changes during word-to-word backward interpreting. They asked the participants to typewrite their responses on the computer after seeing the L2 words. Their results showed a θ band (4–7 Hz) increase of about 200–600 ms after word presentation, a β band (20–30 Hz) decrease at around 400 ms, and a left frontal α increase for successfully translated words compared to failed ones. As their stimuli were separate individual words, they contended that these frequency bands reflect semantic processing. A comparison of the two studies led to the conclusion that there is potentially a mechanism of the β–γ band (around 25 Hz) responsible for holding items in working memory. In addition, the α-band activation found by Grabner et al. (2007) was not without further support. In a bimodal sentence processing task, Meyer et al. (2013) measured the oscillatory changes elicited by the argument-verb distance in a sentence and found that the longer the distance, the stronger the α-band activation. The authors speculated that the α oscillation may be responsible for the inhibition of the premature release of verbal information that is integrated in the later stages of processing. In brief, α-band oscillation seems to reflect the brain’s involvement in semantics and inhibition. In summary, despite the different experiment paradigms, several bands of oscillation have been consistently identified as being related to a certain cognitive function, including the θ band (around 4 Hz), the α band, and the γ band (above 30 Hz). However, the exact mapping of frequency bands onto language tasks is far from clear and needs further exploration.
The current study aimed to answer the question: “What are the oscillation features underlying such German–English bilingual activities as listening comprehension, speech production, shadowing (i.e., repeating a segment of an utterance), and interpreting?” We also linked the demographic data with the oscillation values to explore potential associations. We expected that at least the α band (for working memory retention), the θ band (for phonetic processing), and the γ band (for semantic processing) should be present. Moreover, we hypothesized that there should be clear patterns of task-specific oscillations, although the specifics were deemed exploratory due to lack of earlier evidence to help inform our predictions.
Method
Participants
Forty-six participants were recruited for this study. All participants have successfully finished the experiment and produced usable data. Participants were German (native)–English (L2) bilinguals with varied degrees of L2 proficiency, slightly gender-biased (female = 32), aged between 19 and 46 years (M = 28.37, SD = 6.42). They began learning English as a second language from a mean age of 8.17 years, SD = 3.74, and have been learning English for 15.08 years on average, SD = 7.15. Their average stay in English-speaking countries was 5.09 years (SD = 5.46). None of the participants had a history of brain injury and all of them had normal hearing and speaking abilities. All participants gave written, informed consent and were compensated with a 20-dollar grocery voucher for their participation. Experiments were approved by The University of Auckland Human Participants Ethics Committee.
Materials
A written form of the Oxford Placement Test (https://www.oxfordenglishtesting.com/) was used to measure participant’s English proficiency before the EEG experiment. The experiment comprised three custom-made English audio clips and four tasks, that is, listening to L2 (L2 L), speaking in L1 (L1 S), shadowing in L2 (L2SH), and backward interpreting (BI). The first clip was a short passage of news, lasted for 2 minutes, and was used for the L2 L condition (162 words per minute). The second clip was another 2-minute news excerpt but was much slower (95 words per minute) and was used for the L2SH condition. The third clip was made up of ten groups of English sentences with varying lengths (11 to 33 words, M = 20.5, SD = 8.18), played at a mean speed of 153 words per minute, and used for the BI condition. All sentences were in the simple declarative form so that syntactic complexity as a confounding variable was ruled out.
Tasks and procedures
Prior to the EEG session, participants needed to complete the Oxford Placement Test within 30 minutes. Then they filled in a demographic questionnaire that mainly covered their language background.
In the experiment session, participants were first asked to comprehend the news in the L2 L task without needing to give other responses. In the L1 S task, participants first heard descriptions of a topic, and then were asked to speak on that topic. There were sound beeps as the start and stop reminders. In the L2SH task, participants were required to listen to a paragraph in English and concurrently repeat aloud every word of it. Each of the first three language tasks was made up of a long single trial of 2 minutes. In the BI condition participants were asked to listen to (a) short English sentence(s), after which they were given several seconds for comprehension. Then they had to interpret the sentence(s) into German upon the sounding of the first beep and stop upon the second. This was repeated ten times for ten different sentence groups.
The experiment was designed and implemented using E-Prime 2.0 software (Psychology Tools, Inc., Pittsburgh, PA, USA) and was conducted in an EEG setting. Participants’ verbal outputs were recorded as part of the behavioral data. To familiarize participants with these tasks, a practice session was administered before the real experiment until the participant expressed their full understanding of the tasks. Meanwhile, to avoid deteriorated performance caused by fatigue, the four tasks appeared in a balanced sequence so that each task was used as the first condition for equal number of times. Between the second and the third task, there was a self-paced break time. The whole experimental session lasted for about 60 minutes.
EEG acquisition
The EEG recordings were conducted in an electrically shielded room (IAC Noise Lock Acoustic—Model 1375, Hampshire, UK) using 128-channel Ag/AgCl electrode nets (Tucker, 1993) from Electrical Geodesics Inc. (Eugene, OR, USA). EEG was recorded continuously (1000 Hz sample rate; 0.1–400 Hz analog bandpass) with Electrical Geodesics Inc. amplifiers (300 MΩ input impedance). Electrode impedances were kept below 40 kΩ, an acceptable level for this system (Ferree et al., 2001). Common vertex (Cz) was used as a reference. During the EEG, participants were comfortably seated in a chair 60 cm away from the screen. As there was no visual information involved, we asked the participants to close their eyes during the experiment, both to reduce eye movement noise and to eliminate visual distractions.
Data analysis
Behavioral results
Demographical and behavioral data were analyzed using IBM SPSS version 26 (SPSS Inc., Chicago, IL, USA).
Participants’ L2 proficiency was measured, and their oral interpreting output was transcribed and marked as the main behavioral index.
EEG preprocessing
Preprocessing of the raw data was conducted using EEGlab (Delorme & Makeig, 2004) v2020.0. The specific preprocessing procedures included the following seven steps in sequential order: (1) downsampling the raw data from 1000 Hz to 250 Hz; (2) high-pass filtering at 1 Hz; (3) using EEGlab plugin Clineline (v1.04) and Clean_rawdata (v2.2) to clean the filtered data; (4) interpolating bad channels via the “spherical” method; (5) re-reference the data to the average of all channels; (6) performing ICA on the data based on the default algorithm of “runica” (the number of principal components was set to be equal to that of channels); and (7) applying MARA (Winkler et al., 2011) to remove artefactual components with default parameters. Brain waves with 5-second (and/or longer) flatlines were removed. Channels with less than 85% self-reconstruction rate (based on the volt values of neighboring channels) were removed. Channels with line noise of four standard deviations higher than the average of all channel populations were interpolated. A maximum of 25% of contamination of all channels in a certain time window was considered tolerable for data repairment, otherwise the whole window was discarded. After several times of preprocessing, the average rate of bad channel interpolation was around 5%, 57 independent components were computed, and about 50 seconds of the raw signal (4%) were removed across data samples.
After these steps of preprocessing, an epoch of 60 seconds (0–60 seconds) was extracted for the L2 L, L1 S, and L2SH conditions, respectively. Since the BI task was made up of ten sentence groups, we concatenated sentences together and then cut into a 60-second epoch in agreement with the other three data segments. The concatenation of BI-induced brain signal was synchronized with the overt interpreting audio segments, that is, EEG data was removed if its corresponding behavioral data segment was blank so that the remaining neural signal all effectively indicated the involvement in the interpreting task and no task-irrelevant portion was included. A 2-second baseline was drawn from the resting-state data for everyone, respectively.
Time–frequency
Neuronal synchronization is the term for the correlated appearance of two or more events associated with neuronal activity in the time dimension (Timofeev et al., 2012).
Information processing in the human brain happens at the basic level of action potentials. Action potentials of individual neurons, however, are not discharged separately following a certain sequence; rather, they correlate with each other through synchronized activity in neuronal assemblies (Axmacher et al., 2006). It is such synchronization that allows cognition on such a universal and complex scale. Two types of synchronization are commonly seen in the relevant literature, that is, local synchronization and long-range synchronization. The former is measured as local field potential (LFP) while the latter using EEG.
The TF power dynamics of all datasets in this study were analyzed using the method of complex Morlet wavelet convolution. The process of TF analysis included: (1) creating a vector of frequencies ranging from 1 to 40 Hz in 30 linearly spaced steps to be used as the convolution frequencies; (2) creating a logarithmically spaced vector of time ranging from 300 to 600 ms in 30 steps to be used as the key parameter of the complex Morlet wavelet, that is, the full width at half maximum (the aim of which was to achieve an ideal trade-off between time and frequency precision); (3) decibel normalizing the epoch data of a certain task by the baseline data to wash out the task-relevant dynamics; (4) repeating step 3 and looping over all 46 participants; (5) averaging all participants’ data to obtain group-level results for that particular condition; (6) downsampling the TF results at a time interval of 200 ms (which had no impact on the TF resolution but saved much computer space).
Next, a group-level condition-wise TF subtraction was performed to see if there were TF dynamics specific to a certain task (cf. Klein et al., 1995; L. Wang et al., 2018). A nonparametric cluster-based permutation test (number of iterations = 1,000) was implemented on the subtraction data for statistical testing (Maris & Oostenveld, 2007), which included the following steps: first, power values of all frequency bands (1–40 Hz) in every single channel were clustered for the whole time window; then the clustering process was repeated 1,000 times through random partitions, during which the labels of the two conditions were reshuffled; next the largest cluster size was recorded for all the 1,000 partitions; after that the distribution of the 1,000 largest cluster sizes was computed and a 95 percentile identified as the significance threshold (i.e., the Monte Carlo p-value) to reject the null hypothesis; finally the permuted threshold was applied to the original subtraction data, and clusters that survived such threshold were kept as the significant differences.
Principal components analysis (PCA)
To illustrate the general locations of oscillations, PCA was conducted. The specific procedures were: (1) narrowband filtering of the data at a certain frequency value, with a full width at half maximum of 2 Hz so that the filtered data fell into a wider band (e.g., in the case of θ band the data was filtered at 5 Hz and the wideband data was 3–7 Hz); (2) extracting the PCs of the filtered data using the method of eigendecomposition; (3) averaging the data across all 46 participants to obtain group-level results; (4) plotting the topography of the lower frequency PC and the higher frequency PC, respectively, for each condition.
Results
The average score of the 46 participants in the Oxford Placement Test was 52.43 (full marks = 60), SD = 6.52. The mean accuracy of their interpreting performance was 64.29%, SD = .09. Correlations were then conducted on the behavioral index and participants’ language background. There was a significant correlation between participants’ accuracy of interpreting and their scores in the Oxford Placement Test, r(44) = .31, p = .03. No other significant correlations were found.
TF results
Figure 1 shows the raw TF power results averaged across brain regions. There were salient condition-wise TF power differences. First, L2 L was dominated by alpha-band (around 10 Hz) activation, coupled with very weak beta-band (around 20 Hz) activation. All three overt tasks, that is, L1 S, L2SH, and BI, were all dominated by gamma-band (above 30 Hz) and delta–theta-band (around 4 Hz) activations, with L1 S having the highest power values. There was also an alpha-band activation in the three overt tasks, but not so strong compared with the other frequency bands, nor very consistent compared with its counterpart in L2 L.
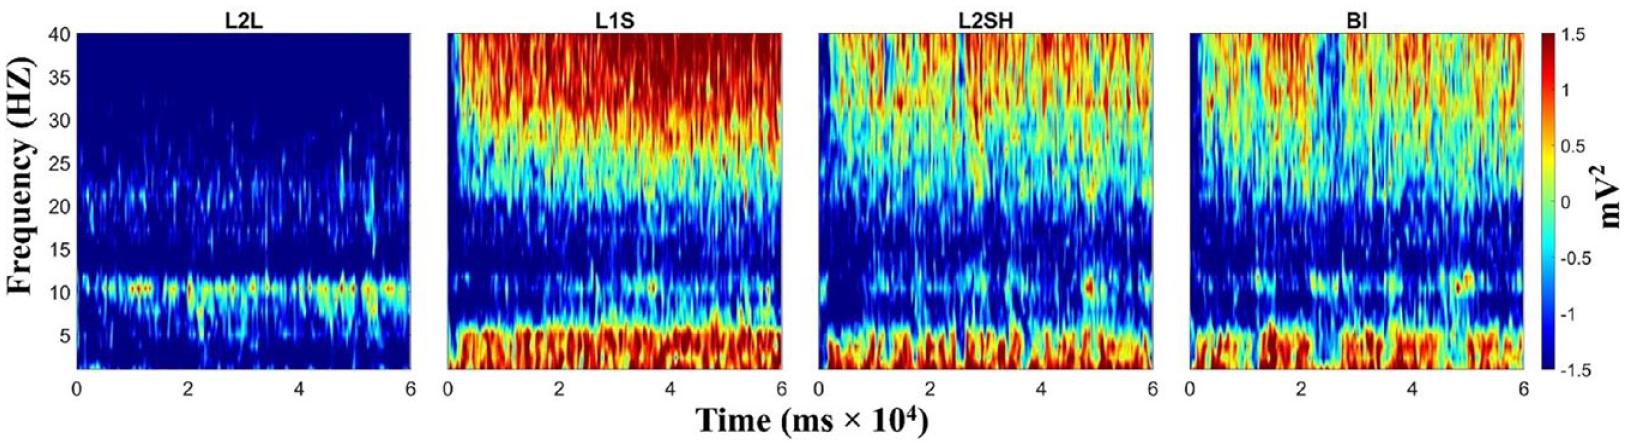
Raw TF power in all conditions. From left to right: L2 listening, L1 speaking, L2 shadowing and backward interpreting. TF power values were gained by task/baseline division.
Figure 2 illustrates the results of condition-wise TF power subtractions. First and foremost, significant TF power increases were observed in the delta–theta band (1–7 Hz) and beta–gamma band (above 20 Hz) for overt tasks (L1S, L2SH, and BI) compared with L2L. There was also a slight alpha band (around 10 Hz) decrease in the three overt tasks when subtracted by L2L, but this was not significant. Then among the overt tasks, significant differences mainly occurred in the gamma band (above 30 Hz) and the theta band (around 5 Hz), that is, both L2SH and BI exhibited significant theta and gamma band power decreases than L1 S, with L2SH–L1S showing more small clusters while BI–L1S showing less but bigger ones. There were virtually no TF power differences between BI and L2SH, except for a tiny sliver of gamma decrease for BI. Last but not least, the TF power differences within the overt tasks (within-mode) showed vastly different patterns in comparison with those between overt tasks and the silent task (between-mode). Within-mode TF differences (the second row of Figure 2) were not as consistent as between-mode TF differences along the time dimension but rather showed up in the shape of a thin, narrow sliver that stretched up and down along the frequency dimension.
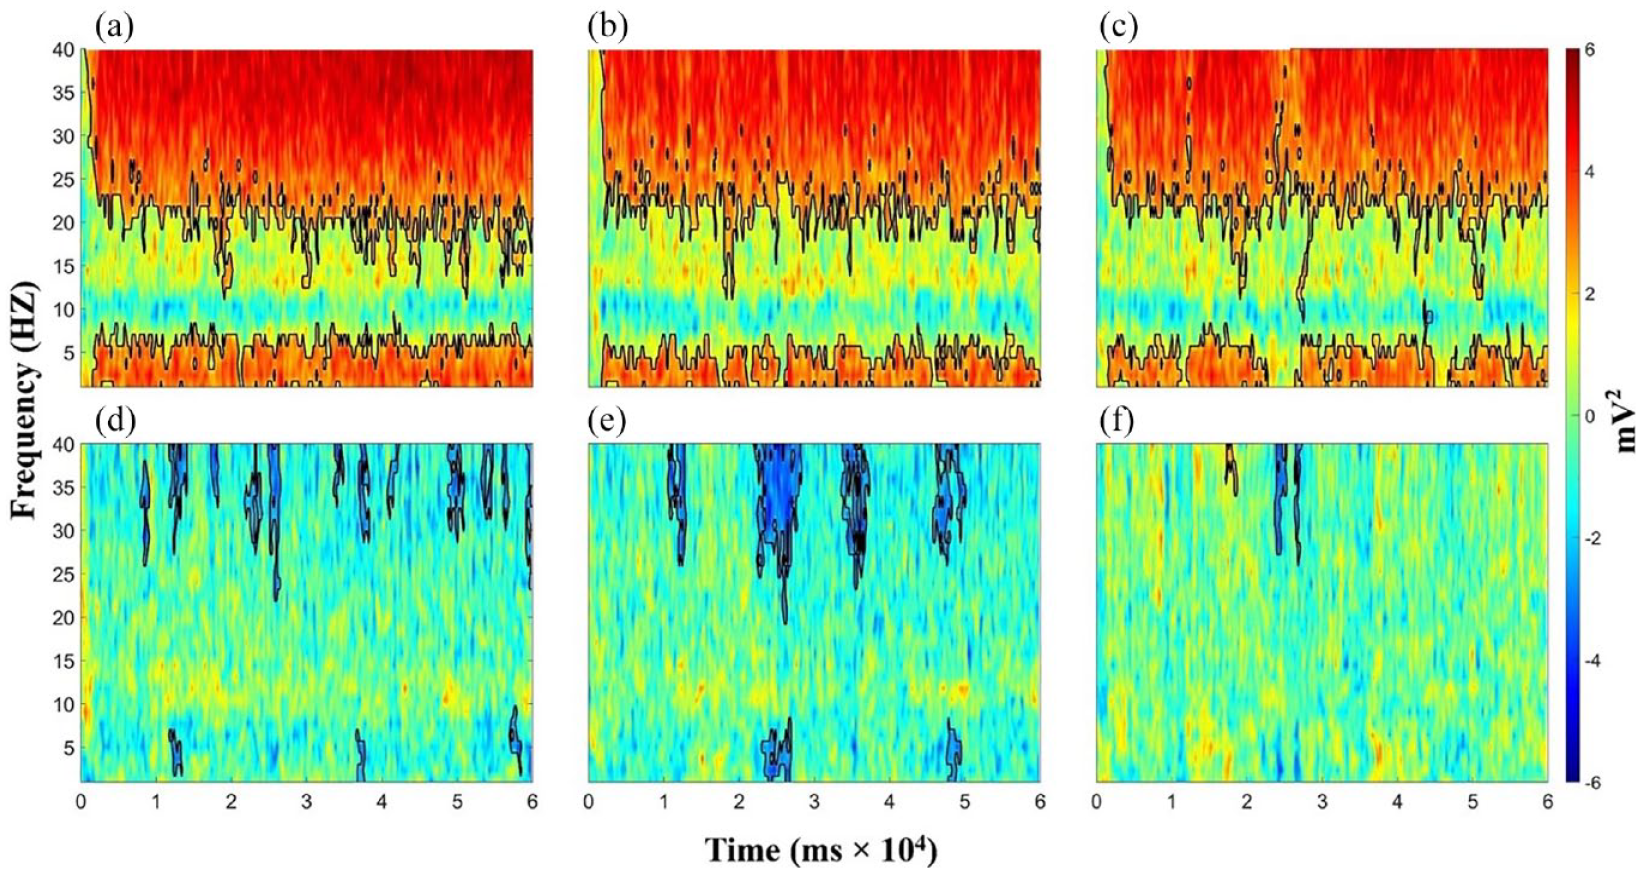
Condition-wise TF power differences: (a) L1 speaking minus L2 listening, (b) L2 shadowing minus L2 listening, (c) Backward interpreting minus L2 listening, (d) L2 shadowing minus L1 speaking, (e) Backward interpreting minus L1 speaking, and (f) Backward interpreting minus L2 shadowing.
PCA results
Figure 3 shows the theta band (5 Hz) PC and the gamma band (30 Hz) PC in each condition. The PCA clearly distinguished different tasks although some similarities were there. Specifically, theta band PCs were concentrated in the frontal and prefrontal regions for all of the four tasks with slight variations in power values. In contrast, gamma band PCs displayed greater differences. L2 L and L1 S had a parietal-occipital gamma band PC while L2SH was characterized by a small and very limited frontal-central gamma PC. BI incurred a strongly right-lateralized temporal gamma PC, which also extended to the anterior and posterior temporal regions.
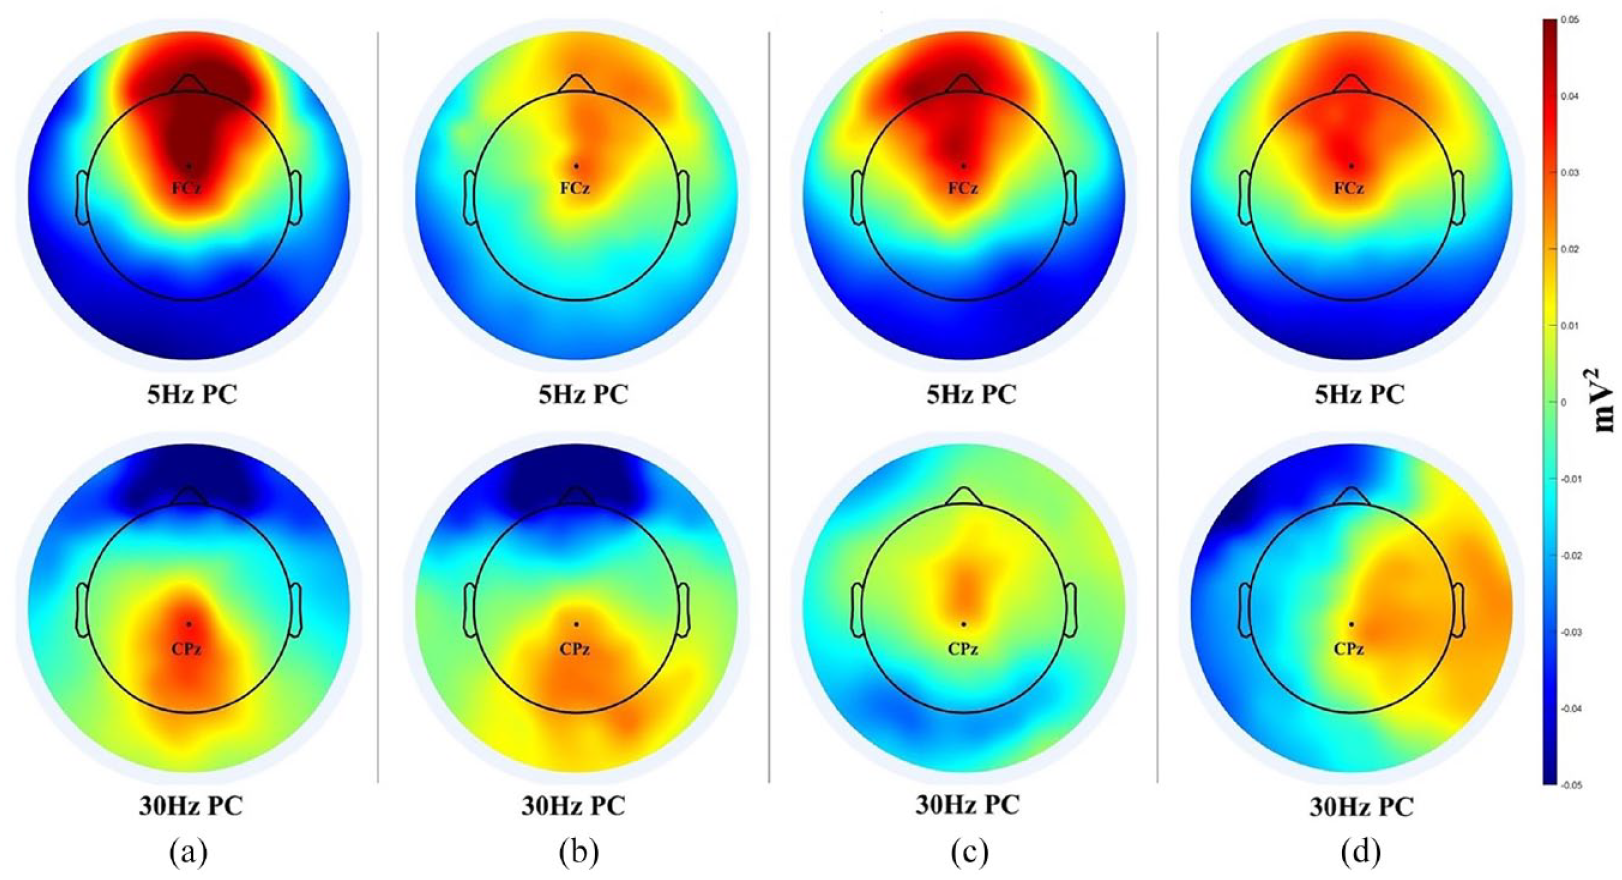
PCA results for all language tasks: (a) PC for 5 & 30 Hz in L2L, (b) PC for 5 & 30 Hz in L1S, (c) PC for 5 & 30 Hz in L2SH, and (d) PC for 5 & 30 Hz in BI.
In addition, since the TF results revealed significant beta band increases for the overt tasks, an extra PCA was implemented for the beta band data, and the result is shown in Figure 4. Figure 4 shows a beta band PC pattern that resembles the integration of theta band and gamma band PCs in their corresponding tasks. For example, in L2 L, the theta band PC was concentrated in the very frontal area while the gamma band PC was in the central and parietal regions (Figure 3, Panel a). In contrast, the beta band PC in L2 L dwelt on somewhere between frontal and parietal areas, as if receding from the frontal lobe and moving toward the parietal lobe. Likewise, in BI the beta band PC, that is, the right fronto-temporal component, was a mixture of frontal theta and right temporal gamma as shown in Figure 3, Panel d. For L1 S and L2SH, the results were similar, that is, the beta band PC was much like averaging the sum of theta PC and gamma PC.
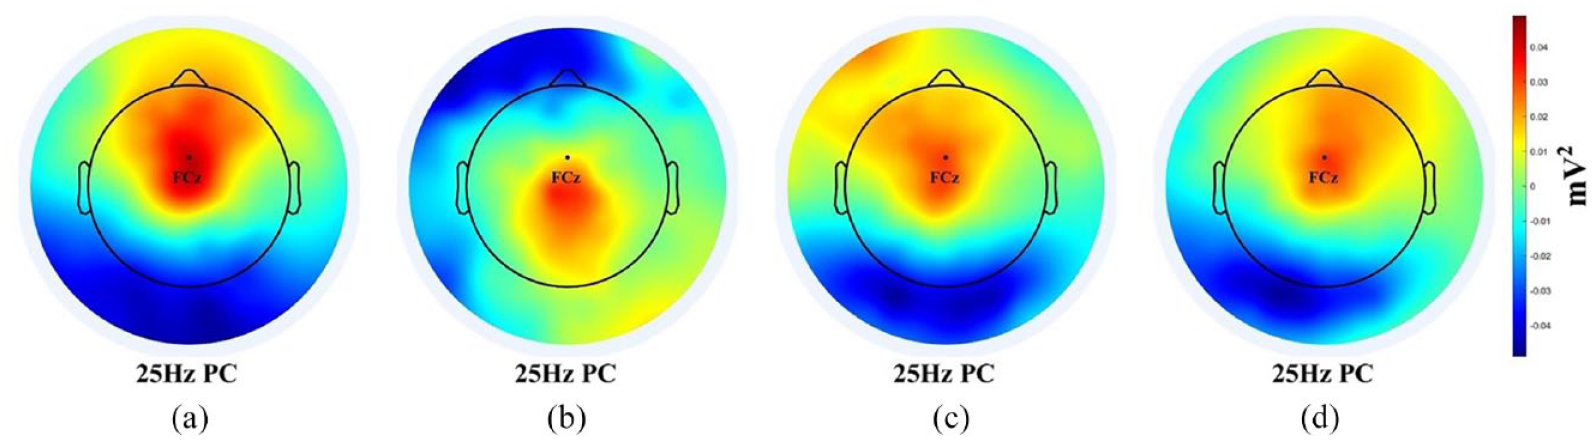
Beta band PCs in four language tasks: (a) L2 listening, (b) L1 speaking, (c) L2 shadowing, and (d) backward interpreting.
Cross-frequency coupling (CLC) and synchronization results
The TF results seemed to contain synchronization between theta and gamma band activities. Therefore, we did an “all-to-all theta-gamma coupling” (TGC) analysis. First, channel one data was bandpass filtered at the theta band (3–7 Hz) and gamma band (30–60 Hz), respectively. Then phase angles of the theta band and the amplitude values of the gamma band were extracted using the method of Hilbert transform. Next, the phase angle was eulerized to the amplitude values, and the absolute value of the result was extracted as the TGC value. After that, a permutation test (number of iterations = 2,000) was conducted on the TGC value for that channel pair. The whole process was then applied to the next channel pair until the loop over all 128 electrodes was completed. The data was then averaged across all participants to create a group-level synchronization map for each condition. For the rationale and mathematical algorithms for TGC, refer to Cohen (2014). Finally, a stringent threshold of two standard deviations above the median was applied to the map, and the data surviving that threshold was projected onto the 128-channel scalp network. The results are shown in Figure 5.
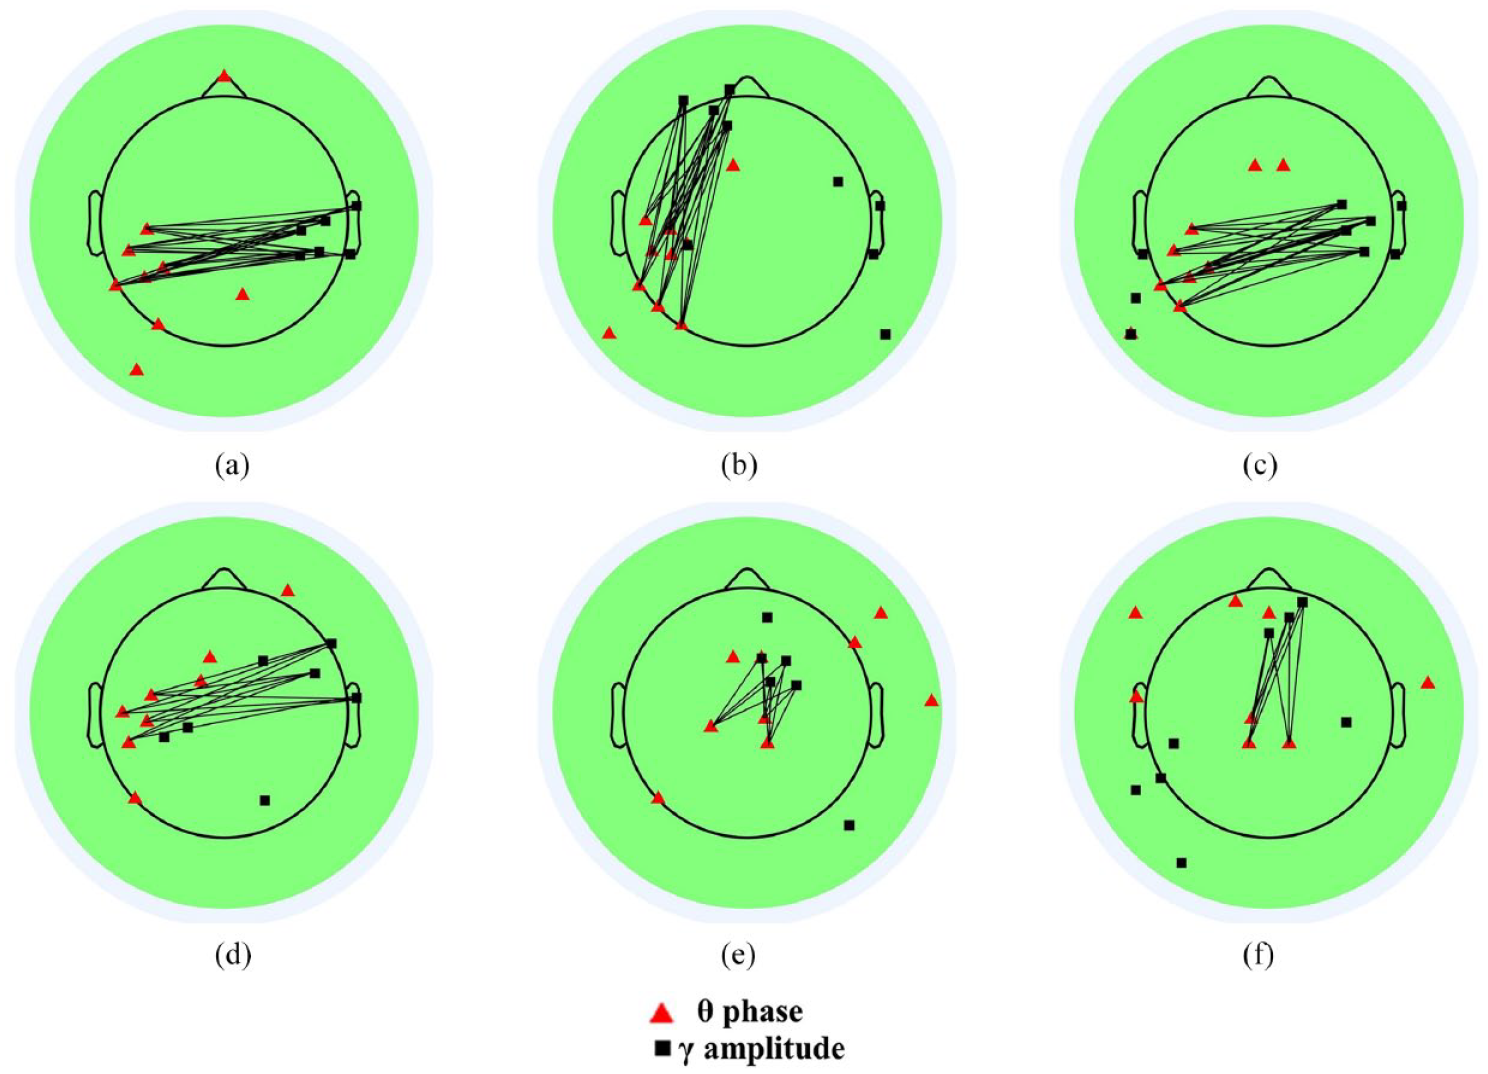
Theta-gamma coupling topographical map: (a) L1 speaking minus L2 listening, (b) L2 shadowing minus L2 listening, (c) Backward interpreting minus L2 listening, (d) L2 shadowing minus L1 speaking, (e) Backward interpreting minus L1 speaking, and (f) Backward interpreting minus L2 shadowing.
Figure 5 shows condition-wise comparative TGC topographies. Two salient features are worth noting here. First, the three panels on the first row displayed a consistent left temporo-parietal theta coactivation, and Panels a and c showed very similar synchronization patterns, as both involved a “left temporo-parietal theta to right temporal gamma” pathway. The other feature is that, compared to L1 S and L2SH, BI consistently incurred an extra synchronization pathway between midline theta and right frontal gamma (shown in Panels e and f), though the exact position varied a little.
Discussion
To examine if task-specific oscillation patterns exist in German–English sentence processing, we conducted an EEG experiment on 46 German–English bilinguals, with tasks including L2 L, L1 S, L2SH, and BI. As noted earlier, sentences embody syntactic structures, which are processed in a way that is drastically different from the processing of words (cf. Altmann, 2001). Though such differences have been adequately explained in psycholinguistic models (e.g., Dijkstra et al., 2019; Lewis & Vasishth, 2005), few studies have investigated the brain processes involved in bilingual sentence processing.
Overall, our analyses revealed different patterns in TF dynamics and CLC depending on the experimental condition. Although neuronal synchronization has been found to manifest varieties of cognitive activities, such as memory formation (Axmacher et al., 2006), language cognition (Liu et al., 2019), visual cognition (Babiloni et al., 2016), and so on, its underpinnings remain unclear. Here we focused on one of the many synchronization mechanisms, that is, CLC (cf. Canolty & Knight, 2010). More specifically, we investigated TGC as it was the most salient feature in our preliminary findings, which are discussed as follows.
Our condition-wise TF power subtractions highlighted the differences between overt tasks and L2 L, showing two distinct features. First, the significant TF power difference between overt tasks and L2 L was manifest in the θ band and the γ band. Second, the motor-sensory subtraction displayed very dense and consistent power activation along the time dimension, showing the continuous engagement of the brain in these cognitively demanding activities. Such synchronized coherence increases between θ and γ bands were in the opposite direction to that reported by Bonhage et al. (2017), where the θ increase was accompanied by a β–γ decrease. They interpreted the β–γ decrease as a sign of memory unburdening. Thus, our results may reflect other dimensions of the task, for if β–γ decrease is due to unloading memory, then subtracting L1 S from L2SH and BI should also exhibit the pattern seen by Bonhage et al., and this did not occur.
We prefer to link β with such functions as motor language process (Penolazzi et al., 2010), maintaining verbal stimuli in auditory memory (Shahin et al., 2009), sentence-level syntactic binding (Bastiaansen et al., 2010), detecting semantic anomaly (Luo et al., 2010), and working memory processing (Leiberg et al., 2006). Yet these are too inconsistent to be framed in one theory. Many cognitive scientists, therefore, have attempted to provide explanations for the huge discrepancy and even contradictory findings of the beta band function. One plausible theory comes from Weiss and Mueller (2012) who, based on existing studies, proposed that there exist different betas for different functions. Beta 1 (13–20 Hz) shows power decreases while beta 2 (20–30 Hz) is increasing in the same task. They also found that, in auditory experiments, beta power tends to increase whereas, in visual studies, beta is usually seen decreasing. Such observations support our findings and the decreased β in Bonhage et al.’s (2017) visual design.
Together, we believe that the role of beta increases in our experiment remains twofold. One is that the beta increases only signal the motor control function related to the overt speaking tasks, while the other is that they reflect the complex language process that covers everything from memorization to semantic processing just like the gamma band. With respect to the dense TF distribution found in this study, one possible reason is that our German–English participants generally have a high level of English proficiency, so they were able to engage attentively in oral tasks.
In terms of PCA, BI incurred a right fronto-temporal gamma, confirming the strong involvement of such mechanisms in sentence-level bilingual processing. In particular, the topography of beta band oscillations also revealed a distinct right fronto-temporal distribution in BI, which corroborates previous findings that the interpreting task is accompanied by a temporal beta activation (Kurz, 1995; Petsche et al., 1993). In the context of this study, beta and gamma band oscillations should be interpreted together as they both share similar topographies and TF activation patterns. Considering the role of gamma band in semantic processing and motor control (cf. Bosman et al., 2014; Meyer, 2018; Nowak et al., 2018), as well as similar functions for beta reviewed earlier, we postulate that beta-gamma interplay indicates a mechanism that is either motor-related or semantics-related.
Finally, the TGC results revealed a unique synchronization pattern for BI, that is, left central theta and right fronto-temporal gamma synchronization. Given the specific traits of BI, it is highly possible that such right fronto-temporal gamma coactivation implies a language conversion mechanism, apart from the working memory function (Park et al., 2013), the verbal long-term memory formation (Lara et al., 2018), and integrating top-down and bottom-up information processing during speech perception (J. Wang et al., 2014) that have been previously reported. This tentative explanation is important because no theories have been proposed about the role of TGC in the bilingual processing activity of interpreting. Our ideas on the synchronization mechanism of language conversion need to be validated further.
In conclusion, the current study showed that overt German–English spoken tasks elicited significantly higher theta band and gamma band activations than passive listening, and that backward interpreting involves an extra right fronto-temporal gamma coactivation compared to L1 speaking and L2 shadowing. Moreover, significant beta-band activation was found, which should be interpreted as part of the gamma-band oscillation relating to motor control or semantic processing. The robust right fronto-temporal gamma synchronization may indicate the language conversion mechanism unique to interpreting. Such results may have practical implications. For example, the training of interpreters can be boosted by the employment of special techniques such as transcranial current stimulation on the trainee in the right fronto-temporal region at gamma band frequency such that neurons related to the interpreting task can be exercised and relevant circuits strengthened.
Footnotes
Declaration of conflicting interests
The author(s) declared no potential conflicts of interest with respect to the research, authorship, and/or publication of this article.
Funding
The author(s) received no financial support for the research, authorship, and/or publication of this article.