
Abstract
Five experiments (N = 854) tested the hypothesis that U.S. adults generate explanations of Black–White differences that position Black Americans as “the effect to be explained” (EBE), and White Americans as the norm for comparison. Participants explained race differences in trust in the police (Experiment 1), success or failure in a drug rehabilitation program (Experiment 2), charitable donation rates (Experiment 3), or the benefits of a new medication (Experiments 4 and 5). Every experiment counterbalanced which group had the numerically higher or lower result and the more expected or unexpected data pattern. Participants’ explanations focused significantly more on Black Americans and on the group with the more unexpected results in four experiments. Explanatory focus was not related to perceptions of the mutability of groups’ behavior or which data pattern was numerically larger. Studies 1–4 used mostly White samples, but Experiment 5 found that Black and White participants both focused explanations on Blacks. The tendency to take Black Americans as the EBE is large when they show the less expected data pattern (Cohen’s d = 0.86), and medium (d = 0.33) even when White Americans show the less expected data pattern. These data show why diversifying samples and research teams are necessary but not sufficient steps to undo the impact of structural inequalities on the representation of diverse people in psychology.
In his classic The Nature of Prejudice, Allport (1954) reports a hypothetical dialogue:
The trouble with the Jews is that they only take care of their own group.
But the record of the Community Chest campaign shows that they give more generously, in proportion to their numbers, to the general charities of the community, than do non-Jews.
That shows they are always trying to buy favor and intrude into Christian affairs. They think of nothing but money; that is why there are so many Jewish bankers.
But a recent study shows that the percentage of Jews in the banking business is negligible, far smaller than the percentage of non-Jews.
That’s just it; they don’t go in for respectable business; they are only in the movie business or run night clubs (Allport, 1954, pp. 13–14).
Mr. Y’s goals mirror those of many psychologists; he hopes to inform another’s prejudice with new empirical data. Yet, regardless of the data Mr. Y brings to bear, Mr. X rebuts it with a new anti-Jewish stereotype to counter-explain it.
Insightful as this still-resonant example is today, there is a telling silence within it. Mr. Y never asked Mr. X why Christian Americans—or any other non-Jewish group—might give as much or as little money to charity as Jewish people do. Neither Allport nor Mr. Y pointed out Mr. X’s assumption that it was specifically Jewish people’s behavior that was the “effect to be explained” (hereafter EBE).
The present research examines a similar assumption in the explanation of differences between Black and White Americans. Before presenting five experiments that demonstrate the habit of taking Black, rather than White, Americans as the EBE, we describe the widespread assumption that people in general and Americans in particular are White by default, and the impact of such defaults on the explanation of group differences. After describing our results, we discuss their implications for efforts to diversify human sciences such as psychology.
Whiteness as Mythical Norm, Whiteness as Category Norm
Whilst many societies are hierarchically ordered, the US is hierarchically ordered by race, with Whites as the dominant group enjoying disproportionate powerful positions and social value (e.g., Sidanius & Pratto, 1999). A long-standing assumption in African American thought is that Whiteness is an unspoken and assumed attribute of Americans (e.g., Leach et al., 2002). This has been expressed by the idea that Black Americans require a double consciousness of themselves as Black and as American to function, which White people can comfortably do without (DuBois, 1903). A related idea is the claim that Whiteness forms part of a “mythical norm” of what an American is by default that inhabits the “edge of consciousness” (Lorde, 1984, p. 115).
Early social cognition research demonstrated that Whiteness is often an assumed property of others in the US. Early categorization research yielded mixed findings as to whether Black or White people are categorized more readily by race (Stroessner, 1996; Zárate & Smith, 1990). Early intersectional stereotypes research found that stereotypes of women and men are more similar to stereotypes of White women and men than to stereotypes of women and men from other American ethnic groups (Ghavami & Peplau, 2013). White Americans associate White targets more quickly than ethnic minority targets with symbols of the US and with the concept “human” (Devos & Banaji, 2005; Morehouse et al., 2023). When asked to select a person to represent humanity to aliens, American students, and particularly men, disproportionately chose a White man rather than a White woman, Black man, or Black woman to represent the species (Bailey & LaFrance, 2017). This last finding demonstrates the intersectional point that the mythical norm of Whiteness impacts specific categories, such that discrimination law designed to protect women “in general” may fail to protect Black women, for example (Crenshaw, 1991).
The mental representations of social categories that Lorde (1984) terms “mythical norms” may sit on the “edge of consciousness” because social categories are mentally represented both by general beliefs and specific category exemplars (Smith & Zárate, 1992). Kahneman and Miller (1986) explained that category norms constitute implicit defaults for categories, which are constructed by exemplars mentally recruited in response to mention of category labels. An implication is that people exposed to the same learned exemplars, or to similar ones, will have similar category norms. Hence, category norms stem from context. This process of forming category norms can be nonconscious and automatic. However, when one is building mental models of events, category norms may lead to the conscious experience of surprise when the assumptions about identity that they encode are violated. Such defaulting explains why people fall for the famous surgeon riddle because the label “surgeon” leads them to assume a surgeon to be a man without noticing that they have made this highly gendered assumption (Belle et al., 2021). Similar processes have been observed when thinking about the race of celebrities implicitly conceptualized as White by default. Such category norms for race can lead to systematic errors in the ways in which people engage in guessing games (Pratto et al., 2007) that are analogous to the process of forming and testing hypotheses about diverse samples (Hegarty, 2017).
Category norms have been most thoroughly examined with regard to their effects on the explanation of group differences. In the first study of this kind, American students either called to mind a typical American voter or explained a gender difference in voter behavior. Participants called men to mind almost exclusively in the first task, but in the second, they explained gender differences by positioning women voters as the EBE 5 times as often as men voters (Miller et al., 1991). Studies of the explanation of sexual orientation differences conceptually replicate this finding. Here, explanations of childhood behavior, health outcomes, and divorce rates all framed sexual minorities as the EBE far more often than straight people (Hegarty & Pratto, 2001, 2004; Hegarty et al., 2020). In published psychological research, when gender differences are observed, women and girls are framed as the EBE by scientific authors more than men and boys are (Hegarty & Buechel, 2006).
These asymmetric explanations of group differences have consequences for the perpetuation of the group hierarchies that produce them. Explanations of group difference that focus on a lower status group imply to readers of those explanations that that group is lower in agency and power (Bruckmüller & Abele, 2010), that its subordinate status is more legitimate and stable (Bruckmüller et al., 2012), and that solutions to inequality should target this lower status group (Bruckmüller & Braun, 2020). When members of lower status groups are demanded to write such explanations, their collective self-esteem is reduced to the extent that their explanations take their own in-group as the EBE (Bruckmüller, 2013). Even young children interpret a statement of similarity that girls are as good at math as boys as evidence of the opposite when it is so framed (Chestnut & Markman, 2018). In sum, singling out the attributes of lower status groups to explain group differences seems to be a critical step on the road to deficit thinking. The present paper extends norm theory research to the explanation of differences between Black and White Americans.
Group status is but one factor that seems to “beg for explanation” more than others. Various aspects of events, such as being unexpected, being negative, comparatively recent, or comparatively larger all seem to “beg for explanation” (for a fuller discussion, see Bruckmüller et al., 2017). The tendency to take lower status groups as the EBE has been reduced when lower status people (e.g., women, gay men) are prototypical members of the overarching group within which the difference was observed, such as gender differences among teachers (Miller et al., 1991) and sexual orientation differences among men living with human immunodeficiency virus (HIV; Hegarty & Pratto, 2001). Miller et al. (1991) argued that groups become the EBE to the extent that their attributes are perceived as more mutable. However, subsequent research has not always confirmed this hypothesis (see Hegarty & Pratto, 2001, 2004).
EBE
In each of the five experiments, participants explained purported empirical differences between Black and White Americans in their own words. Our primary hypothesis was derived from past work on the explanation of group differences (Hegarty & Pratto, 2001; Miller et al., 1991), and from the line of thought that describes Whiteness as a mythical norm in the US (Lorde, 1984):
Hypothesis 1: Adults in the United States explain group differences between Black and White Americans by taking Black people as the EBE, and White people as the norm for comparison.
Kahneman and Miller (1986) described both categories and events as having default norms that set expectations. They predicted that aspects of events that deviate from norms occasion spontaneous explanatory and counterfactual thinking more than aspects of events that conform to norms. When differences between groups are observed, one group may show an outcome that is more expected than the other on the basis of a priori event norms about outcomes in general. This theory informed our second hypothesis:
Hypothesis 2: Adults in the United States explain Black–White differences by taking the group with more unexpected outcome as the EBE, and the group with more expected behavior as the norm for comparison.
Jointly, Hypotheses 1 and 2 imply that the tendency to frame Black Americans as the EBE and White Americans as the norm for comparison will be larger when Black Americans’ data are unexpected, and smaller when White Americans’ data are unexpected.
We asked participants to explain differences in level of trust in the police (Experiment 1), success in drug rehabilitation (Experiment 2), charitable donations (Experiment 3), or the effects of a new blood pressure medication (Experiments 4 and 5). Consequently, participants explained differences in very different domains relevant to U.S. racial stereotypes (Experiments 1 and 2), or irrelevant to those stereotypes (Experiment 3–5). The outcomes of the study were behavioral (Experiments 1–3) or biological (Experiments 4–5). Particular experiments were designed to assess three other factors that can lead data to “beg for explanation”: being a statistical minority within a sample (Experiment 1), doing “more” rather than “less” of a given behavior (Experiment 2), and explaining antisocial rather than pro-social behavior (Experiment 2 vs. 3; see Bruckmüller et al., 2017). We also tested Miller et al.’s (1991) hypothesis that the group selected as the EBE would be perceived as having more mutable behavior in Experiments 1–3. Experiments 1–4 were conducted in 2000–2002, prior to the replication crisis in psychology or the development of online platforms for research participation. Experiment 5 was a preregistered study conducted in 2024 on Prolific. Experiments 1–4 included “mostly White” samples. Experiment 5 included a balanced sample of White and Black American participants. We report data from all the conditions we ran and all the measures of explanatory focus and mutability we collected. Those measures were taken before new pilot or exploratory measures, which are not reported as they were not part of our theorizing.
Experiment 1: Why Trust the Police?
In Experiment 1, participants explained group differences in confidence in local police. We predicted that explanations would focus on Black Americans (Hypothesis 1), especially when White Americans were described as trusting the police more (Hypothesis 2). We also examined if under- and overrepresenting Black and White groups in research samples affect the focus of explanation of group differences, especially since African Americans are often described as “minorities,” and intuitions about large numbers being more reliable might make them seem mutable and unrepresentative. Finally, we assessed the relative mutability of Black and White Americans’ confidence by asking participants to predict the results of a second study in which no difference was observed, following the method used by Hegarty and Pratto (2001, 2004).
Pilot study
White Americans more often report confidence in local police than Black Americans do (Gibson & Nelson, 2018). A pilot study investigated the beliefs about this difference among students at the large public New England U.S. university where Experiment 1 was conducted. Thirty-seven undergraduates estimated the percent of Americans who were “American adults,” “European Americans,” and “African Americans” who have confidence in their local police, along with several other irrelevant items. A one-way analysis of variance (ANOVA) revealed reliable differences by target group, F(2, 72) = 62.48, p < .001, partial η2 = .63, observed power = 1.00. Participants believed that most “American adults” had confidence in their local police (M = 71%, SE = 2.74), informing our assumption that confidence in the police was the expected outcome. Planned contrasts showed that participants believed that an equally high proportion of “European Americans” had confidence in their local police (M = 73%, SE = 2.39, respectively, F < 1), but that significantly fewer “African Americans” had as much confidence in the police than either “American adults” or “European Americans” (M = 47%, SE = 3.15), F(1, 36) = 88.36, p < .001, partial η2 = .71. These data suggest that category norm representations of “American adults” did not differ from those of “White people,” but did differ from representations of “African Americans” who might or might not have confidence in the police.
Method
Participants and procedure
To estimate adequate sample sizes, we noted that Hegarty and Pratto (2001) had about 20 participants per condition, and we followed suit. We did not record the demographics of the 244 undergraduates who received credit toward an introductory psychology course in exchange for participation. This is a weakness of this first study. After receiving briefing information and giving consent, they completed the materials at their own pace and were debriefed. One participant did not write an explanation and was excluded.
Design
All participants read about an opinion poll in which 84% of one group and 44% of another group reported confidence in their local police. Participants were randomly assigned to condition in a 2 × 3 between-participants design. The design manipulated which group was described as the more confident group (Black vs. White Americans) and the sample information (no information vs. majority White sample vs. majority Black sample). The dependent variables were the number of references in participants’ explanations to each of the racial target groups (Black Americans vs. White Americans).
Materials
Explanation task
As in previous norm theory studies (e.g., Hegarty & Pratto, 2001; Miller et al., 1991), participants learned about empirical findings and explained them in their own words. The materials were titled “Explaining Public Opinion.” The brief in the confident Black Americans conditions read in part:
A recent opinion poll conducted by the Gallup Polling Organization found that African Americans and European Americans had different views of their local police. When asked whether they had confidence in their local police, 84% of the African Americans sampled indicated they had confidence in their local police, and 44% of the European Americans sampled indicated confidence in their local police.
In the confident White Americans conditions, this pattern of data was reversed but the materials were otherwise identical.
The sample information was manipulated next. The no-information condition included only a statement that the survey contained 1,000 respondents. In the majority Black and majority White conditions, a table indicated that the sample included 700 of the majority group and 300 of the minority group. Instructions always then continued, “In your own words, explain this difference,” followed by eight blank lines.
Mutability measure
On the next page, the same short paragraph entitled “Predicting Public Opinion” was presented in all conditions. It explained that Harris Polling Associates had conducted a similar telephone poll as that of Gallup on new respondents. In contrast to the original Gallup poll, Harris had found no group difference in confidence in the local police. Participants guessed what percentage of Americans reported confidence in the police in this second, Harris poll.
Perceived reliability
Next, the same short paragraph titled “Assessing the Reliability of Surveys” was presented in all conditions. It reminded participants that the Gallup poll and the Harris Poll had reached different conclusions, and asked them which of the two polls was more likely to reflect Americans’ opinions.
Coding explanations for references to groups
In all experiments, two coders counted how many attributes of White and of Black Americans each participant referenced in their explanation. For example, one participant’s explanation read as follows: “Media exploitation of such incidents I think also causes many Afro-American people who have not had any dealings directly or indirectly with the police to be mistrustful and thus have less confidence in the police.”
We counted four references to attributes of Black Americans, and none of White Americans in this explanation, as follows:
Many Afro-American people have not had any direct dealings with the police.
Many Afro-American people have not had any indirect dealings with the police.
Afro-American people are mistrustful of the police.
Because they are mistrustful, Afro-American people have less confidence in the police.
In all cases, at least one coder was unaware of the hypotheses and conditions, and this coder’s results are reported for each experiment. Second coders became aware of condition in a small minority of cases. Specifically, when participants focused explanations on one group, but did not identify the group explicitly, it was necessary to refer to stimuli to confirm the group’s identity. For example, in Experiment 2, which concerned drug use, one participant wrote, “I’ve noticed that drugs are more prevalent in poverty or lower incomed [sic] areas. Also, peer pressure may be a contributing factor.” These sentences clearly refer to the group who used drugs more. In such cases, coders checked participants’ experimental condition after initial coding to determine whether the participant was referring to Black or White Americans. Kendall’s τβ assessed interrater reliabilities. For Experiments 1–5, the coding was reliable for references to White Americans (τβ = 1.00, .95, .89, .97, and .72, respectively) and Black Americans (τβ = .88, .92, .88 .94, and .85, respectively).
Results
For all experiments, we report 95% confidence intervals around the means, and used simple effects tests to decompose interactions, except where we planned a priori contrasts. The ANOVAs for references included one within-subject factor (race explained) and between-subjects factors corresponding to the independent variables. Although dependent variables were frequency counts, we used ANOVA because we were not interested in the association between Black and White frequencies, and for some studies, distributions did not allow for use of log-linear models.
References in explanations
To test our hypotheses, we conducted a 2 × 2 × 3 mixed ANOVA with more confident group (Black vs. White) and sample information (no information vs. White majority vs. Black majority) as between-participants factors, and racial target group referenced (White vs. Black Americans) as a within-participants factor.
Confirming Hypothesis 1, participants’ explanations included significantly more references to Black Americans (M = 0.78, SE = 0.06), 95% CI [0.67, 0.89], than references to White Americans (M = 0.23, SE = 0.03), 95% CI [0.17, 0.29], F(1, 237) = 83.88, p < .001, partial η2 = .26, observed power = 1.00. This main effect was modified by a two-way interaction with the more confident group factor, F(1, 237) = 19.99, p < .001, partial η2 = .08, observed power = .99. We also observed an unexpected significant three-way interaction, F(2, 237) = 3.32, p = .038, partial η2 = .03, observed power = .625.
To investigate the robustness of Hypotheses 1 (effect of race referenced) and 2 (interaction with confident group), we conducted simple effects tests within each sample condition. When only sample size was provided, there was a main effect for race referenced, simple F(1, 237) = 47.96, p < .001; a main effect for more confident group, simple F(1, 237) = 8.80, p = .003; and an interaction, simple F(1, 237) = 21.76, p < .001. The tendency to make Blacks the EBE (Ms = 1.41, 0.19, SEs = 0.13, 0.08) was more pronounced when Whites had more confidence in the policy than when Blacks did (Ms = 0.61, 0.37, SEs = 0.14, 0.09); results for references to Blacks and Whites, respectively. Further simple effects tests of race referenced showed that this was reliable when Whites were more confident, simple F(1, 237) = 70.69, p < .001, but not when Blacks were more confident, simple F(1, 237) = 2.43, p = .120. These results are consistent with Hypothesis 2.
When Blacks were stated to be a minority of the opinion sample, there was only a simple effect of race referenced, simple F(1, 237) = 27.10, p < .001. More confident group and its interaction with race referenced were not reliable, simple ps > .112. In the Black minority condition, only Hypothesis 1 held. Participants referred to attributes of Blacks more often (M = 0.72, SE = 0.10) than of Whites (M = 0.19, SE = 0.05). Similarly, when Whites were stated to be a minority of the opinion sample, only the race referenced effect was reliable, simple F(1, 237) = 14.04, p < .001, other simple ps > .15. Again, participants referenced attributes of Blacks more often (M = 0.61, SE = 0.09) than of Whites (M = 0.21, SE = 0.05).
In sum, Hypothesis 1 was supported across all sample conditions, but support for Hypothesis 2 was limited to the condition where sample size information was not presented. All means illustrating Hypotheses 1 and 2 are shown in Figure 1.
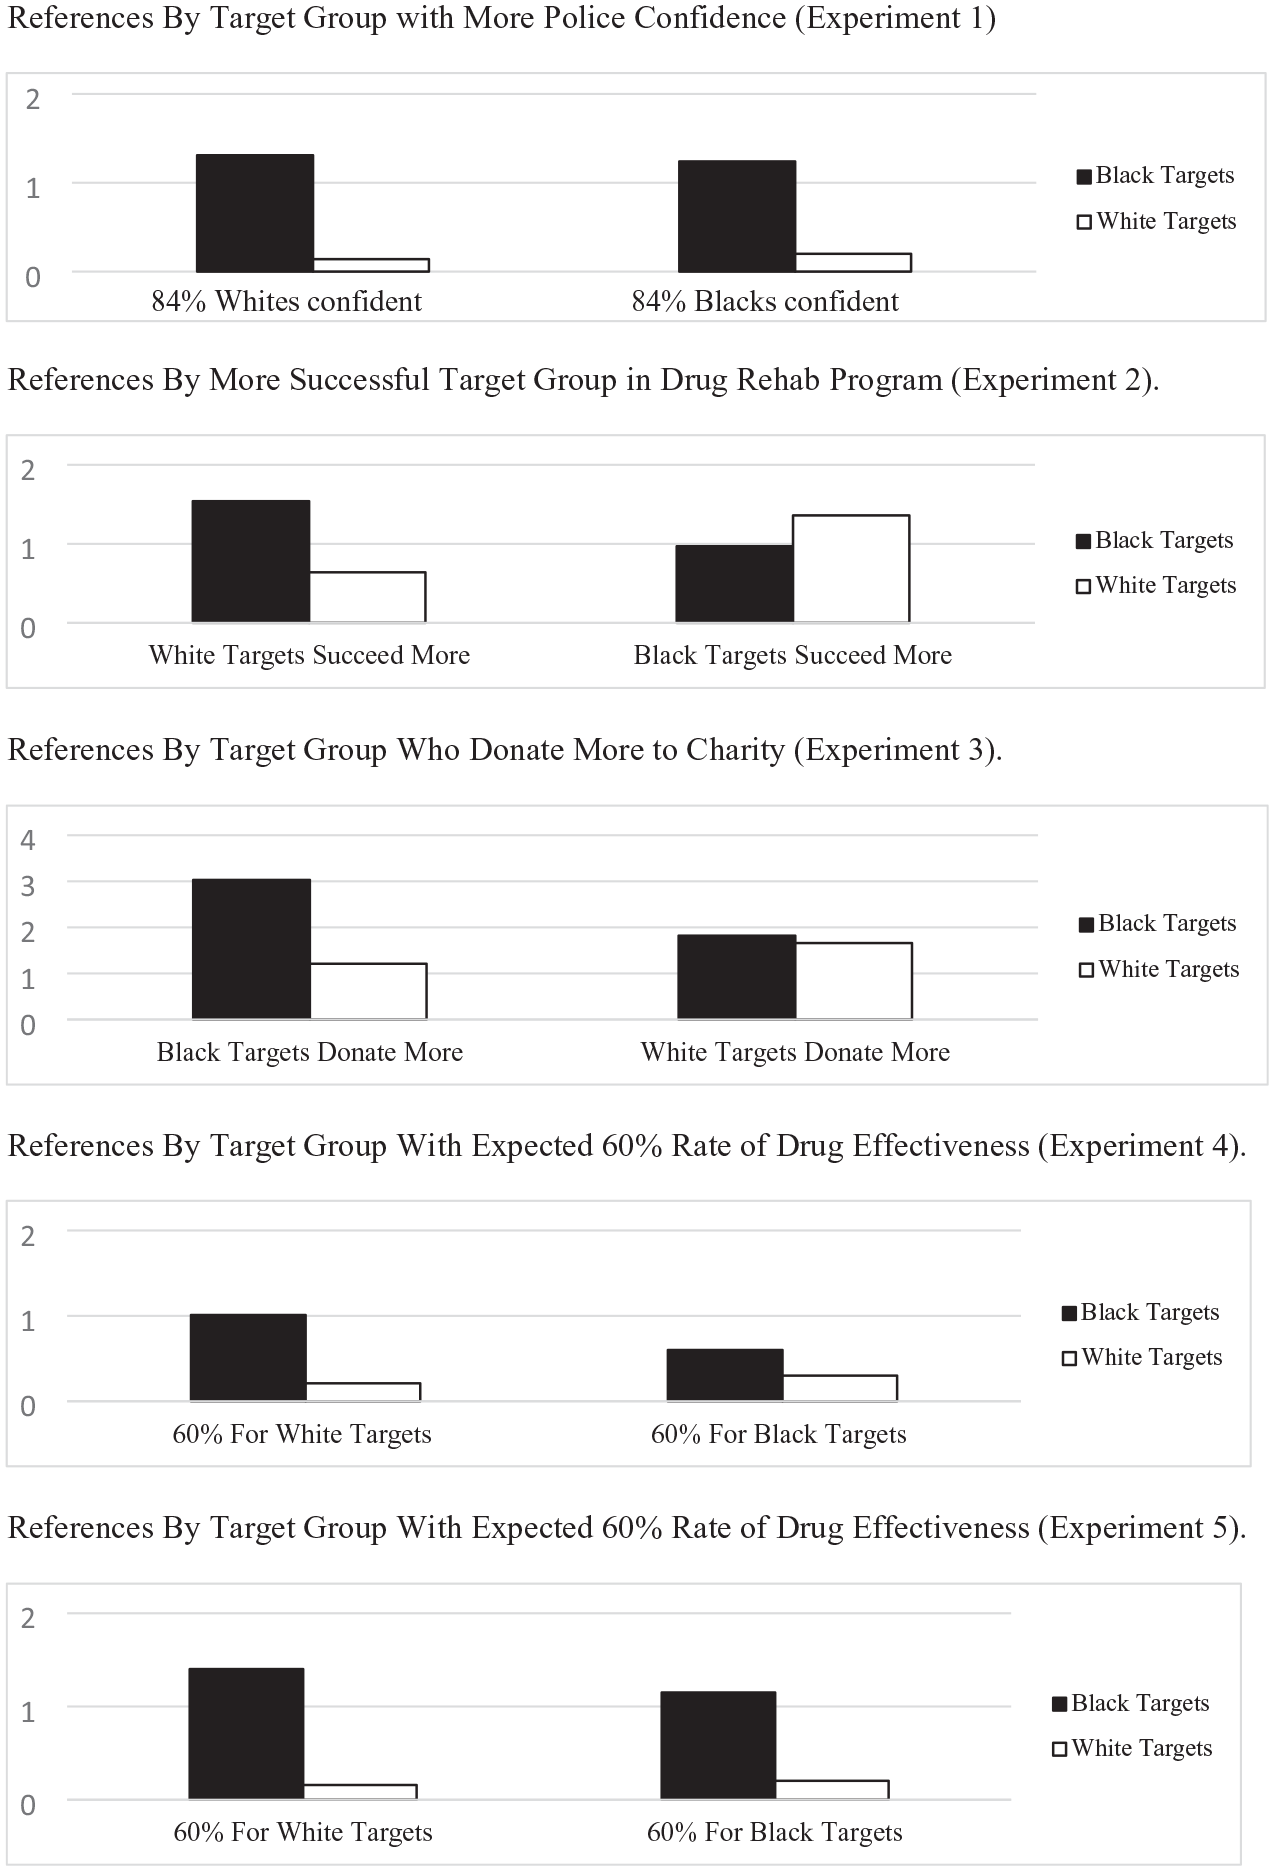
Mean number of references to target groups by condition: Experiment 1–5.
Mutability
We conducted a 2 × 3 ANOVA with more confident group and sample information as between-subjects factors on participants’ predictions of the percent confident in the police (ranging from 0 to 100%) about the “no difference” Harris Poll. Overall, participants predicted that 61% of Americans would report confidence in the police in the Harris poll (SE = 0.80), slightly lower than the midpoint of the two estimates provided in the stimuli (i.e., 44% and 84%). There were no effects of more confident group, sample characteristics, or their interaction on participants’ estimate, Fs < 2.0, ps > .14. This null finding does not support Miller et al.’s (1991) hypothesis that groups framed as the EBE are also perceived to have more mutable attributes.
Perceived reliability
Finally, we examined whether participants considered the first or second poll to be more reliable. Fourteen participants did not complete this item. Using a log-linear model on whether participants believed the “race difference” poll or the “no difference” poll by the two independent variables, we found that including only each independent variable as factors produced an ill-fitting model, L2(7) = 23.09, p = .002. However, including all three main effects and the interaction of poll selected and race with more confidence in the police produced a model that fit, L2(6) = 2.83, p = .700. More participants (76%) considered the poll reporting differences to be more reliable when White Americans reported greater confidence, but only 48% considered it more reliable when Black Americans reported greater confidence. Although not relevant to our two principal hypotheses, this finding is consistent with the pilot study findings.
Discussion
Experiment 1 provided support for both Hypotheses 1 and 2. Overall, participants focused explanations more on Black Americans (Hypothesis 1) consistently, especially if Blacks were the less confident group given only sample size (Hypothesis 2). There was no evidence that groups became the EBE to a greater extent when they were described as under- or oversampled, or more or less confident in the police. In contrast to Hegarty and Pratto (2001, 2004), predictions of the results of a new study did not show that either group was perceived as having more mutable attributes. The pilot study and participants’ judgments about the polls’ reliability suggested that they accurately believed that White Americans trust the police more than Black Americans do.
These results extend norm theory research on the explanation of gender and sexual orientation differences to the explanation of race differences (Hegarty & Pratto, 2001; Miller et al., 1991). In uncoded aspects of explanations, we saw that details on sample information caused some participants to focus on aspects of the survey. The support for Hypothesis 2 in the limited sample information condition of Experiment 1 is open to a wider range of competing interpretations. The focus in the explanations on the group with less confidence may reflect the fact that participants expected adult Americans to have confidence in their local police, consistent with the pilot study findings. However, this finding could also be the result of low confidence being perceived as a specifically moral violation rather than a value-neutral expectancy violation (Bruckmüller et al., 2017). We return to this question in later experiments, but, first, we test whether reframing outcomes as positive or negative impacts who is chosen as the EBE.
Experiment 2: Why Teenagers Succeed or Fail to Abstain From Drugs
Experiment 2 manipulated the framing of the same outcome as positive or negative. Participants explained group differences in the outcomes of a hypothetical drug treatment program described as successful abstinence rates or failing relapse rates. This framing manipulation allowed us to test whether explanations of differences that focus on whichever group does “more” are more available than explanations that focus on whichever group does “less” (Hoorens & Bruckmüller, 2015). Because drug rehabilitation programs have the goal of inducing abstinence rather than relapse, we operationalized the expected outcome as successful abstinence and avoiding relapse. We predicted that explanations would focus more on Black teenagers (Hypothesis 1), particularly when White teenagers’ data evidenced more abstinence or less relapse (Hypothesis 2). We also tested Miller et al.’s (1991) mutability hypothesis again.
Method
Participants and procedure
A convenience sample of 55 New York City public service professionals were approached by a coworker during work breaks (10 women, 40 men, and five who did not report their gender; aged 21–47 years). Forty-six participants reported that they were White; two reported being Hispanic; and one each reported that they were African American, African American/Puerto Rican, Asian, and Native American; three did not report their ethnicity. Participation was voluntary and not compensated.
Design
The experiment had a 2 × 2 between-participants design. The drug rehabilitation program’s results were framed in terms of success rates or failure rates, and White teenagers or Black teenagers were described as the group more likely to succeed or fail.
Materials
Explanation task
The materials described “The Second Chance Program for New York City Teenagers,” a new drug treatment program providing individual counseling and career guidance helping teens stop using drugs for good. The program was described as enrolling African American and European American students, who were all interviewed 1 year after finishing the program. In the success framing conditions, 75% versus 40% of the two groups were successfully abstinent. In the failure framing conditions, 25% versus 60% of teenagers in each group were described as relapsing. Note that these outcomes were equivalent across the success/failure framing conditions. In the successful Black teenagers conditions, the difference was framed as follows in the success frame and failure frame conditions:
Success frame: At the end of that year, 75% of the African American students had stayed off drugs and 40% of the European American students had stayed off drugs. Failure frame: At the end of that year, 25% of the African American students had started to use drugs again and 60% of the European American students had started to use drugs again.
The successful White teenagers conditions differed only in the pattern of percentages presented. All participants were then told that city officials wanted to know why these two groups were doing differently, and were asked to explain the group difference in their own words.
Mutability measure
A scale in 5% increments ranging from 0 to 100% was presented. Participants were asked how many future program participants would either “succeed” or “fail” in the program, using whichever word matched their framing condition.
Results
References in explanations
Hypotheses were tested with a mixed ANOVA with a 2 × 2 × 2 design with the number of references to each group (Black vs. White teenagers) as a within-participants factor, and with framing (abstinence vs. relapse) and more successful group (Black vs. White teenagers) as between-participants factors. Relevant to Hypothesis 1, participants focused more on Black (M = 1.25, SD = 1.33), 95% CI [0.89, 1.61], than on White teenagers (M = 1.00, SD = 1.23), 95% CI [0.68, 1.33]. However, this main effect was not significant, F(1, 51) = 1.29, p = .261, partial η2 = .03, observed power = .200 (see Figure 1).
Supporting Hypothesis 2, we observed a two-way interaction between group referenced and more successful group, F(1, 51) = 8.67, p = .005, partial η2 = .15, observed power = .82. In the successful White teenagers conditions, there was a large effect to reference Black teenagers (M = 1.54, SE = 0.29), 95% CI [0.94, 2.13], more than White teenagers (M = 0.64, SE = 0.19), 95% CI [0.26, 1.03], simple F(1, 51) = 8.49, p = .005, partial η2 = .14. However, in the successful Black teenagers conditions, there was a nonsignificant trend to focus explanations more on White teenagers (M = 1.36, SE = 0.23), 95% CI [0.90, 1.82], than on Black teenagers (M = 0.97, SE = 0.26), 95% CI [0.46, 1.48], simple F(1, 51) = 1.60, p = .212, partial η2 = .03 (see Figure 1). There were no other significant main effects or interactions (all ps > .33).
Mutability
We analyzed predictions about teenagers’ future outcomes using a 2 × 2 ANOVA. Four participants did not answer this question. The remaining 51 participants predicted that an average of 57% of teenagers would continue to abstain, SE = 2.61, 95% CI [52%, 62%], midway between the success rates of 40% and 75% presented in all conditions. Predictions did not differ as a function of which group was described as more successful, the framing manipulation, or their interaction (Fs < 1), refuting Miller et al.’s (1991) mutability hypothesis.
Discussion
Experiment 2 yielded a nonsignificant data trend consistent with Hypothesis 1, and supported Hypothesis 2. Black teenagers were taken as the EBE only when described as failing in the program. When they succeeded more than White teenagers, the nonsignificant trend was to take White teenagers as the EBE. These effects were not due to one group being seen as having more mutable outcomes than the other, or the framing of the outcomes as success or failure. The lack of clear support for Hypothesis 1 could be due to the weakness of the effect itself, or to the lack of power in the small public sample. As in Experiment 1, support for Hypothesis 2 could have been a result of failure being an expectancy violation or its being a violation of moral norms. In other words, low confidence in the police and failure in drug rehabilitation may have attracted attention not because these outcomes are unexpected, but because they are judged to be morally wrong. In addition, both results are relevant to structural racism in the US that works through the long-standing criminalization of African Americans, for example, through the recent “war on drugs” (Rosino & Hughey, 2018). This raises the question of whether Black Americans would be taken as the EBE when race differences are not relevant to stereotypes arising from these structures. Accordingly, Experiment 3 examined explanations of differences in a pro-social behavior, returning us to Allport (1954) and to Mr. X and Mr. Y’s conversation about why groups do or do not make charitable donations.
Experiment 3: Explaining Pro-Social Behavior: Why People Donate to Charity
Experiment 3 elicited participants’ explanations of differences in White and Black Americans’ rates of charitable donations. We also manipulated the overall rate of charitable donation and provided a third test of Miller et al.’s (1991) mutability hypothesis.
Method
Participants and procedure
Eighty-two women, 64 men, and three students who did not report their gender participated in exchange for partial credit in an introductory psychology course at the same university sampled in Experiment 1. We categorized their self-reported race or ethnicity as 129 White Americans, three Asian Americans, six Hispanic Americans, six mixed-race Americans. Five did not report their race or ethnicity. Ages ranged from 17 to 25 years.
Design
The experiment had a 2 × 3 between-participants design. We manipulated both the more generous group (Black vs. White Americans) and the overall charity donation rate (low rate = 20% and 40%; high rate = 60% and 80%; split rate = 20% and 80%). As before, the dependent variable was frequency of target groups referenced in explanations (Black and White Americans).
Materials
Explanation task
The materials were entitled “Predicting the Future.” Part of the instructions read:
Demographers often try to anticipate what society will be like in the future based on statistical observations of the present. In this experiment, we would like you to consider various kinds of behaviors and what they might mean for the future. Many people believe that contributing to charity is a good thing to do because it benefits society in many different ways.
The manipulations were then introduced. Information about what proportion of each race had donated time, money, or goods to charity during the past (20th) century was provided. The factors were manipulated by presenting the percentage of Blacks and Whites who donated to charity as described in the Design section above. Explanation instructions and coding closely followed those of prior experiments.
Mutability measure
On the next page, participants estimated the percentage of Black and White Americans who would perform a number of behaviors in the next century, including donating to charity.
Importance of charitable donation
Finally, participants rated nine statements (1 = strongly disagree, 7 = strongly agree) concerning whether they or others view donating to charity to be important or the moral mark of a person. We selected four because they formed a reliable scale: “It is very important to give to charity,” “It is important to teach my children to give to charity,” “Most other people think that giving to charity is important,” and “Giving to charity is not all that important” (reversed), ICC = .34. The average of these ratings (M = 5.00, SD = 0.07) was reliably above the scale midpoint of 4, t(148) = 14.27, p < .001, and was not affected by either independent variable or their interaction (ps > .22). Participants consistently viewed charitable donation as important and moral.
Results
References in explanations
We conducted a 2 × 2 × 3 ANOVA with group referenced (Black vs. White Americans) as a within-participants factor, and group that donated more (Black vs. White Americans) and donation rates (low vs. split vs. high) as between-participant factors. One participant did not write any explanation. Confirming Hypothesis 1, participants referenced more attributes of Black Americans (M = 2.42, SE = 0.11), 95% CI [2.20, 2.64], than of White Americans overall (M = 1.44, SE = 0.12), 95% CI [1.21, 1.67], F(1, 142) = 33.50, p < .001, partial η2 = .19, observed power = 1.00 (see Figure 1).
It was also the case that both groups were referenced more when Black targets donated at higher rates (M = 2.12, SE = 0.11), 95% CI [1.91, 2.33], than when White targets did (M = 1.74, SE = 0.11), 95% CI [1.53, 1.95], F(2, 142) = 6.48, p = .012, partial η2 = .94, observed power = .725. These two main effects interacted, F(1, 142) = 23.85, p < .001, partial η2 = .14, observed power = .99. When Black Americans donated more, there were more references to Blacks (M = 3.03, SE = 0.16), 95% CI [2.72, 3.33], than to Whites (M = 1.21, SE = 0.16), 95% CI [0.89, 1.54], simple F(1, 142) = 59.95, p < .001. When White Americans were said to donate at higher rates than Blacks, there were approximately the same number of references to Blacks (M = 1.82, SE = 0.16), 95% CI [1.51, 2.12], as to Whites (M = 1.66, SE = 0.16), 95% CI [1.34, 1.99], simple F(1, 142) < 1. No other effects were reliable (ps > .074; see Figure 1).
Mutability
We conducted a 2 × 2 × 3 ANOVA on participants’ estimates about 21st-century donations with the more generous group and the donation rate as between-participants factors, and target group (Black vs. White Americans) as a within-subjects factor. There was a reliable main effect for charity donation rate. Future donation rates were estimated to be lowest in the low donation rate condition (M = 41.3%, SE = 1.63), 95% CI [37.0%, 45.6%]; moderate in the split rate condition (M = 51.2%, SE = 1.60, 95% CI [47.1%, 55.4%]; and highest in the high donation rate condition (M = 66.9%, SE = 1.62), 95% CI [62.6%, 71.1%], F(2, 141) = 62.94, p = .001, partial η2 = .47, observed power = 1.00. Participants’ estimates about future donations were influenced by what they read in the stimuli.
A second main effect showed that future donation rates were estimated to be higher overall when the more generous group were White Americans (M = 55.40%, SE = 1.33), 95% CI [51.94%, 58.86%], rather than Black Americans (M = 50.86%, SE = 1.32), 95% CI [47.42%, 54.29%], F(1, 141) = 5.93, p = .016, partial η2 = .04, observed power = .43. This result suggests that participants used White Americans’ donation rates more than Black Americans’ donation rates to predict 21st-century donation rates in general. This is a second demonstration that participants took Whites as the implicit norm.
There was also a two-way interaction between the more generous group and target group, F(1, 141) = 129.06, p < .001, partial η2 = .48, observed power = 1.00, and this interaction was qualified by a three-way interaction involving all factors, F(2, 141) = 10.26, p < .001, partial η2 = .13, observed power = .940. Predicted donation rates and predicted change from the stimuli presented are arrayed for both target groups by condition in Table 1. The two-way interaction between the more generous group and the target group was consistently significant across the low, high, and split donation rates. This interaction simply reflects the fact that participants’ estimates were influenced by the stimuli they read. In addition, in conditions where donation rates were low, participants’ estimates mutated donation rates upwards. When donation rates were high, participants mutated them downward overall (see Table 1). There was also an effect of the more generous group in the high donation rate condition (see Table 1).
Predicted donation rates by target group and donation rate stimuli: Experiment 3.

Note. Raw percentage, percentage change (∆%) from stimuli, and simple interactions. Bl = Black American target group; Wh = White American target group.
In sum, the stimuli influenced participants’ estimates, and the participants mutated very high and very low donation rates towards more moderate values.
Discussion
The explanations of group differences in charitable donations produced in Experiment 3 supported Hypothesis 1. Black Americans were positioned as the EBE, and White Americans as the norm for comparison. We also found some support for Miller et al.’s (1991) mutability hypothesis.
Experiment 3 expands the support for Hypotheses 1 and 2 in two ways. First, charitable donations are not linked to structural racism or stereotypes of African Americans, unlike confidence in the police and drug use. Second, charitable donations are pro-social acts, and Black targets were taken as the EBE even when they engaged in such acts, and particularly when they were described as doing so more than White targets. Even engaging in unexpected moral behavior begs for explanation, particularly when Black targets do it.
The results of Experiment 3 support Hypothesis 2 under the assumption that high charitable donations are unexpected. However, this assumption is open to interpretation, as in previous experiments. Consequently, Experiments 4 and 5 experimentally established the expected norm and the group whose outcomes matched that expectancy or deviated from it to provide a clearer test of Hypothesis 2.
Experiment 4: Setting Expectations for Blood Pressure Medication
Experiment 4 tested Hypothesis 2 directly by setting expectations about the outcome of a study of a new blood pressure medication. Either Black or White Americans were described as responding to the medication at the same rate as in a pilot study, whilst the other target group was described as having a more or less successful treatment responses than in that pilot study. We predicted a focus of explanations on Black Americans (Hypothesis 1) and on whichever group’s outcomes differed from the results that could be expected from the pilot study (Hypothesis 2).
Pilot study
High blood pressure is more common and debilitating among Black Americans than White Americans (Guo et al., 2012; Lackland, 2014). We conducted a pilot study to assess if participants’ beliefs about race differences in blood pressure were accurate and if they would have similar expectations about Americans’, Black Americans’, and White Americans’ blood pressure. Participants’ stereotypes were not accurate (see Judd & Park, 1993). Twenty-five public university students completed a short questionnaire in which they estimated the percentage of Americans, Black Americans, and White Americans who have high blood pressure, mixed in with other estimates of various groups’ behaviors. A one-way ANOVA confirmed that these estimates differed significantly by target group, F(2, 23) = 10.63, p < .0001, partial η2 = .32, observed power = .99. Participants estimated that 59.8% of Americans (SE = 2.96%, 95% CI [53.7%, 66.0%]), 55.1% of White Americans (SE = 4.1%, 95% CI [46.6%, 63.6%]), and 40.0% of Black Americans (SE = 4.5% 95% CI [30.7%, 49.4%]) had high blood pressure. Planned contrasts showed the estimated rate for Americans as the same as that for White Americans, F(1, 23) = 1.94, p = .177, partial η2 = .08, observed power = .266, but higher than the mean for Black Americans, F(1, 23) = 9.74, p = .005, partial η2 = .30, observed power = .85 (see Figure 1). As in the pilot study for Experiment 1, “Americans” and “White Americans” were conceptualized similarly to each other but differently from “Black Americans.”
Method
Participants and procedure
Participants were 121 students in psychology courses at the same large U.S. university sampled in earlier studies (age range = 17 to 25 years), who received partial course credit. They reported their gender as women (n = 79), men (n = 39), or did not report it (n = 3). They reported their ethnicity to be White (n = 97), Black (n = 7), Latino/a (n = 8), Asian American (n = 5), or did not report it (n = 4).
Design
In all conditions, the expected success rate of the drug was set at 60% by communicating the results of a pilot study. We manipulated target group at expectancy by describing the drug as 60% successful with either Black or White patients as in the pilot study. We manipulated overall effectiveness as low or high by describing the drug as being either 30 or 90% effective for the target group who was not at expectancy. As before, the dependent variable was the count of references to Black and White Americans in participants’ explanations.
Materials
The materials were titled “Pharmacological Research.” The materials each began with an introductory paragraph describing Food and Drug Administration (FDA) procedures for screening new drugs. The second paragraph described a fictional team of researchers at a nearby university working on a fictional blood pressure drug (called “Explicol”), and health risks of high blood pressure. The third paragraph included critical information setting expectancies for the drug’s effectiveness at 60%:
In Phase 3 of their research, the Yale – New Haven medical team conducted a pilot study using 20 patients treated for 4 weeks with Explicol. The pilot study found that Explicol lowered the blood pressure in 60% of the patients treated with it. None of the patients experienced severe side-effects. The FDA deemed this level of effectiveness promising and approved a larger study to test for the drug’s effectiveness and safety. The larger study was designed to retest whether the drug was effective in a larger population, and also examine other safety issues, such as whether the drug interacted with other drugs or caused side-effects in certain people or with longer use. The larger study used 100 patients and lasted for 4 months.
The fourth paragraph contained the experimental manipulations. The low-effectiveness, effective for White Americans condition read as follows:
One of the results of the larger study was that the drug’s effectiveness rate varied by race of patient. In the larger study, 30% of Black (African American) patients responded to treatment, while 60% of White (European American) patients responded to treatment. In addition, 10 of the 100 patients experienced side-effects so severe that they had to be taken off the drug.
In the low-effectiveness, effective for Blacks condition, these percentages were reversed. In the two high-effectiveness conditions, success rates of 60% and 90% were presented.
On the second page, participants were told, “Suppose that you worked for the FDA and that your job is to make decisions about whether the drug is approved based on this research. Answer the questions below.” Participants were asked why they thought the drug was not equally effective in both race groups and asked to write a few sentences. Five blank lines were provided. Additional questions not pertinent to the present hypotheses were also presented, including having participants rate how safe/risky and how effective/ineffective the new drug is, whether the FDA should approve of it (from 1 to 7), and questions about different demographic groups who are or should be in drug trials.
Results
We conducted a 2 × 2 × 2 ANOVA in which group at expectancy (Black vs. White Americans) and the overall drug effectiveness (high vs. low) were between-participants factors, and target group referenced (Black vs. White Americans) was a within-subjects factor. Confirming Hypothesis 1, explanations contained significantly more references to attributes of Black Americans (M = 0.81, SE = 0.12), 95% CI [0.56, 1.05], than of White Americans (M = 0.26, SE = 0.07), 95% CI [0.12, 0.39], F(1, 117) = 18.81, p < .001, partial η2 = .14, observed power = .99 (see Figure 1). Confirming Hypothesis 2, this main effect was modified by an interaction with the target group at expectancy, F(1, 117) = 3.77, p = .049, partial η2 = .03, observed power = .51. When White Americans’ outcomes were at expectancy (i.e., 60% effective), the explanations included significantly more references to Black Americans (M = 1.01, SE = 0.175), 95% CI [0.67, 1.36], than references to White Americans (M = 0.21, SE = 0.10), 95% CI [0.02, 0.41], simple F(1, 117) = 11.09, p = .001, partial η2 = .07. This was also the case, but to a lesser extent, when Black Americans’ outcomes were at expectancy: references to Black Americans (M = 0.600, SE = 0.172), 95% CI [0.259, 0.940], were more frequent than to White Americans (M = 0.303, SE = 0.097), 95% CI [0.111, 0.495], simple F(1, 117) = 8.099, p = .0052, partial η2 = .087. No other main effects or interactions were reliable (ps > .48).
Discussion
Experiment 4 confirmed both Hypotheses 1 and 2. Explanations of race differences in a drug trial focused on Black Americans more than on White Americans, especially when Black Americans had unexpected treatment outcomes, whether good or bad. These hypotheses were confirmed for the first time when the effect to be explained was a biological outcome rather than a behavioral one.
Experiment 5: The Explanations of Black and White Americans
Support for Hypothesis 1 in Experiments 1–4 suggests two possible descriptions of the category norms that lead Black Americans to be the EBE across experiments. These descriptions differ in their account of why the mostly White samples would have taken White people as the norm for comparison. First, those participants may have done so due to a tendency to take one’s own in-group as the basis for representing larger groups and forming judgments about differences within those groups (e.g., Mummendey & Wenzel, 1999). Second, consistent with research reviewed in the introduction, White people may be conflated with the general case more than any other ethnic group in the US. Experiment 5 was a preregistered replication of Experiment 4 conducted online in 2024, including equal subsamples of Black and White Americans to address this question.
We preregistered Hypotheses 1 and 2, and four competing hypotheses about the impact of participant ethnicity on explanation (Hypotheses 3a–3d). The competing hypotheses all predicted that White participants would focus explanations on Black participants, as in Experiments 1–4, and made different predictions about the explanations of Black participants. Hypothesis 3a was derived from the claim that Americans in general take Whites as the norm for comparison, and it predicted that all participants would take White Americans as the norm for comparison here. Hypothesis 3b was derived from the claim that people take their own group as the norm for comparison, and it predicted that Black participants would take Black Americans as the norm for comparison here. Hypothesis 3c was informed by both frameworks and predicted that Black participants’ explanations would focus equivalently on both groups. Hypothesis 3d was derived from the claim that Black participants have more flexible explanations, and would take either White or Black targets as the norm for comparison according to whichever group yielded the predicted effects from the drug trial.
Method
Participants
We used PANGEA (Version 0.2; Westfall, 2016) to estimate power, specifying participant as a random factor nested within three between-subjects variables: (a) participant race (Black vs. White Americans), (b) target group at expectancy (Black vs. White Americans), and unexpected effect (high vs. low); and target group as a within-participants variable (Black vs. White Americans). With 30 participants per cell and Cohen’s d = 0.45, being the most common effect size in social psychology (Richard et al., 2003), power was calculated at .99 for the four-way interaction among variables. We initially planned to recruit an additional 40 participants in anticipation of exclusions, which we describe below.
We first recruited 282 participants who were all resident in the US, spoke English as their first language, and had completed high school. Following our preregistered criteria, we excluded four participants who identified as multiracial. Of the remaining 278 participants, 215 (77.3%) passed both manipulation check items and completed the explanation task. This number was above our fail-safe level of exclusion, and we collected data from an additional 88 Prolific users, among whom 16 failed the exclusion criteria. The final sample of 285 participants included 143 White/European Americans and 142 Black/African Americans, who identified their gender as women (n = 184), men (n = 92), nonbinary (n = 7), transmasculine (n = 1), or as no gender (n = 1). Age ranged from 18 to 79 years (M = 39.99 years, SD = 12.75 years). All participants were paid US$2.00.
Materials
The vignettes presented were identical to those used in Experiment 4. As before, the vignettes described two trials with the blood pressure medication Explicol, a pilot study with a 60% success rate, and the larger study with 60% success in one group and 30% or 90% success in the other group. Participants were prompted to explain “what caused the racial difference in effectiveness rates in the drug trial.” Two manipulation check items followed:
In the main drug trial, was Explicol effective in a higher percentage of Blacks or of Whites? In the main drug trial, 60% of one group of participants experienced the drug Explicol as effective, like the people in the pilot study. In contrast, the main drug trial yielded different results among the other group. Which group experienced Explicol as 60% effective in the main drug study just like the people in the pilot study had done?
Both items were followed by the options “Blacks,” “Whites,” and “I’m not sure.”
Procedure
Qualtrics survey software randomly assigned Prolific users to condition. After completing the materials, a debriefing page revealed that Explicol was fictional, and that the true purpose of the study was to examine which results of a scientific study seemed to “beg for explanation.” For Experiment 5, the second coder was trained on the first 30 cases, and interrater reliability was assessed on the remaining 255 cases.
Results
Participants’ explanations were coded for references to the target groups as in earlier studies. We tested the hypotheses using a 2 × 2 × 2 × 2 ANOVA. The ANOVA included three between-subjects factors: participant ethnicity (Black vs. White American), target group at expectancy (Black vs. White targets), and overall effectiveness (high vs. low). The within-subjects factor was the target group referenced (Black vs. White people). Supporting Hypothesis 1, we found a significant focus of all participants’ explanations on Black people (M = 1.28, SD = 2.20), 95% CI [1.03, 1.54], more than on White people (M = 0.18, SD = 0.57), 95% CI [0.11, 0.25], F(1, 277) = 69.24, p < .001, partial η2 = .20, observed power = 1.00. Whilst fewer references to Black targets and more to White ones were observed when Black targets’ outcome was at the 60% expectancy, this interaction was not significant, refuting Hypothesis 2 (see Figure 1). We observed a marginal interaction between the group at expectancy and whether unexpected outcome was high or low, which was not relevant to the preregistered hypotheses and did not involve either the race of the target group or the race of the participants, F(1, 277) = 2.81, p = .095, partial η2 = .01, observed power = .39. Otherwise, no main effects or higher order interactions approached significance (all Fs < 1.5, all ps > .23).
Discussion
The results replicate the support for Hypothesis 1 that was found in earlier studies with a well-powered, preregistered experiment conducted online. Moreover, among the competing hypotheses, the results clearly support Hypothesis 3a. Both White and Black participants framed White Americans as the norm for comparison, and Black Americans as the EBE. Consequently, the results of all studies are best interpreted as a consequence of participants taking White people, rather than in-groups, as the assumed default. Both Black and White participants showed this pattern here, and participant race did not moderate the focus of explanations at all. The results of Experiment 5 did not support Hypothesis 2; participants’ focus was not affected by the target group with the more expected results, two-way interaction F < 1. The results of all five studies were aggregated in a mini meta-analysis we present next.
Mini Meta-Analysis
Finally, we report a fixed effects mini meta-analysis of Experiments 1–5 to provide reliable estimates of the effect sizes. Because ANOVA does not provide very usable effect sizes for mini-meta-analyses (Goh et al., 2016), we calculated separate effect sizes for the conditions in each experiment where the more expected outcome was described as having been produced by White versus Black target groups. Estimates were weighted by sample size. As within-subjects t-test statistics can inflate estimates of effect sizes, we used Dunlap et al.’s (1996) Formula 3 to adjusted Cohen’s d for the correlation between the number of references produced to Black and White target groups. We converted these d values to Fisher r values, and calculated the weighted mean effect size using Goh et al.’s (2016) Formulas 4 and 5, and summary p values using Stouffer’s test (Goh et al., 2016, Formula 7). The effect to take Black Americans as the EBE was estimated to be large when White targets produced the more expected data (Cohen’s d = 0.86, Stouffer’s Z = 8.60, p < 1−10), and small to medium when Black targets produced the more expected data (Cohen’s d = 0.33, Stouffer’s Z = 4.27, p < 1−4; see Figure 1). We discuss these findings together next.
General Discussion
Five experiments consistently found that participants explained group differences by spontaneously framing Black, rather than White, Americans as the EBE. These studies extend norm theory hypotheses about explanation asymmetries from gender and sexual orientation to the important domain of race in the US context. These findings are consistent with Kahneman and Miller’s (1986) account of category norms, and Lorde’s (1984) description of Whiteness as an attribute of the mythical norm of what it means to be American that inhabits “the edge of consciousness.” Hypothesis 1 was confirmed in studies conducted with samples that were mostly White as well as overrepresentative of Black Americans, conducted now or a generation ago, and conducted using contemporary standards of psychological experimentation and online methods or older practices including hand-written responses. Hypothesis 2 also received support in four of five experiments. The effect to take Black Americans as the EBE is very large when Black Americans yield more surprising data, and medium in size when White Americans do. Hence, despite variability in sample size, stimulus content, and participant age, our explanation findings are robust. In contrast, only one of three studies (Experiment 3) supported Miller et al.’s (1991) hypothesis that Black Americans could be taken as the EBE because they are perceived as having more mutable attributes than White Americans. However, that prediction was made about the next century.
These findings have potential political and ethical implications for human scientists striving for impartiality in our research. The participants in these five experiments showed that it is easy to explain data in an unintentionally biased way by focusing explanations more on Black Americans than on White Americans. So doing may inadvertently do an injustice. Generalizing from research on the interpretation of explanations of other group differences to that of race in the US implies that consistently framing Black Americans as the EBE implicitly communicates that Black Americans lack agency and power (Bruckmüller & Abele, 2010), that racial inequalities are legitimate and unlikely to change (Bruckmüller et al., 2012), and that the solution to racial inequalities lies in changing Black people rather than White people (Bruckmüller & Braun, 2020). In other words, mere descriptions of race differences may, due to the operations of category norms that are based on White American exemplars, lead to the beginning of deficit thinking about Black Americans. Further, they prompt our own ethical reflection as to whether the Black participants in Experiment 5 experienced lower collective self-esteem because our experiment led them to write explanations that focused on how their group is different from White people (Bruckmüller, 2013), and yet did little to shift White participants’ beliefs about policies that maintain White advantage (Lowery et al., 2012). The present research was limited in that it did not explore whether such effects result from reading explanations that position Black versus White Americans as the EBE.
Like other researchers, we do not aim to implicitly communicate stereotypes in the course of communicating research findings. Accordingly, these results prompt reflexivity on the social norms for communicating findings about differences between meaningful social groups in psychology and other human sciences (see Richards & Stenner, 2022). The present studies raise the question of whether psychologists and other human scientists might explain race differences habitually, in print, by taking White Americans as the norm for comparison and Black Americans as the EBE, as participants did here. Sue (1999) has described how White Americans’ data have habitually been used to test the internal validity of psychologists’ causal theories, whereas ethnic minority Americans’ data have been habitually used to test their external validity or “generalizability.” Such habits would lead to a focus on ethnic minority groups as the EBE. Among 117 psychology papers published in 2007, Cundiff (2012) found that papers with higher proportions of White participants were less likely to mention race in the publication’s title, abstract, study rationale, or discussion of findings. Causadias et al. (2018) recently observed, in a controlled experiment, that academic psychologists in the US were quicker to approve a proposed study on individual factors, such as personality or cognition, if the proposed sample were White participants, but were quicker to approve a study on “culture, ethnicity, or race” if the proposed sample were US ethnic minority participants. Causadias et al. (2018) attribute these findings to a cultural attribution bias to conceptualize White Americans first as individuals, but to conceptualize individuals in American ethnic minority groups first as representatives of those groups, consistent with Sue’s (1999) analysis, Cundiff’s (2012) data, and the results of the present studies.
Given Lorde’s (1984) thinking and the robustness of our findings, it may be important to test the hypothesis that psychologists studying Americans take Whites as the norm for comparison and ethnic minorities as the EBE in their published research. A parallel focus of explanations on women and girls more than men and boys has been shown in the domain of gender (Hegarty & Buechel, 2006). Explanations of gender differences, where the lower and higher status groups are roughly equal in size, strongly compel such an analysis of psychologists’ published explanations of race differences. In addition to habits of taking White people as the norm, there are good logical reasons to focus on statistical minority phenomena in many hypothesis-testing environments (Klayman & Ha, 1987). The extent, and the reasons why, psychologists focus explanation on particular groups when race differences emerge as research findings is a topic for future research. Such research should also consider the full range of reasons why data may attract explanatory attention, including the tendency to focus on positive rather than negative findings (Hoorens & Bruckmüller, 2015).
Our mini meta-analysis showed that the tendency to take Black Americans as the EBE was dependent upon which target groups yielded the more expected or unexpected data. These results underscore the importance of considering how histories of research practices might affect the category norms that scientists reason with when they encounter differences. Psychology studies conducted in Europe show that data become the focus of explanation when they are more recently collected (Hegarty & Chryssochoou, 2005) or represent a more recent historical event (Teigen, 2004). The history of reliance on all-White samples in psychology is well documented (e.g., Graham, 1992; Roberts et al., 2020). That history means that even after samples have been diversified and race differences obscured by mostly White samples have been brought to light, the data representing ethnic minority groups are likely to attract explanatory attention. Put differently, we will more likely be explaining race differences in our data in contexts where White Americans produce the more expected pattern of results because theories have been based on their data all along (Causadias et al., 2018; Sue, 1999). This context even pertains to research on race differences in the explanation of race differences. In the present research, we included a balanced participant sample only in our final study, and our preregistered competing hypotheses warranted the analysis of Black American participants’ explanations to tease apart predictions derived from earlier studies of mostly White samples.
Are such biases undone by recruiting more diverse scientists to a research team? Experiment 5 here suggests that Black and White people similarly took Black Americans as the EBE. Similarly, both White and ethnic minority psychologists evidenced a cultural attribution bias in their study preferences in Causadias et al.’s (2018) experiment. Associations between White people and humans were shown in some circumstances among individual members of American ethnic minority groups (Morehouse et al., 2023), and U.K. students of color often failed to notice that White people were White in Hegarty’s (2017) studies of hypothesis formation and testing. Whilst diversifying samples and research teams are clearly necessary goals (Roberts et al., 2020), the present findings and others’ suggest that these actions are not sufficient to undo the impact of the White = neutral framework on the interpretation of data. There is nothing in recent advice against the White = neutral framework (e.g., Roberts & Mortenson, 2023) nor in the American Psychological Association’s (APA) Publication Manual (2020) on sensitive language that would caution authors against focusing explanations of race differences on Black Americans.
In this context, we call for concrete efforts to counter the habit of taking traditionally underrepresented groups as the EBE among all researchers. Allport (1954, p. 83) once observed, “[e]ven for the scholar, strict objectivity in the study of national and racial differences is hard to achieve.” We agree with this assessment. But rather than strict objectivity, researchers might aim for stronger objectivity that (a) recognize that all knowledge is generated in contexts and that (b) value insights that do not conflate the world view of a privileged group with objectivity (Collins, 1991; Intemann, 2010). The current laissez faire situation is one in which constructing hypotheses, finding similarities and differences, and constructing explanations gives rise to a particular kind of knowledge. Decolonial scholars emphasize a higher standard of explanation when they argue that diversifying samples should make groups that are familiar to the researcher seem strange as much as it makes groups that are strange to the researcher seem familiar (Adams et al., 2015). Similarly, we call authors, reviewers, and editors to be vigilant to the unconscious habit of taking any group that has historically been underrepresented in psychology as the EBE that represents difference in their first thoughts or final words about what the meaning of difference might be.
Footnotes
Acknowledgements
We thank April Groth, Aaron Ferguson, Deryl Wells, Paul Tentindo, Jennifer Donlin, Jacki Martorelli, Chloe LaFosse, Matthew Kobliner, Matthew Roy, and Ciaran Hegarty for their help with data collection and content coding.
Declaration of Conflicting Interests
The author(s) declared no potential conflicts of interest with respect to the research, authorship, and/or publication of this article.
Funding
The author(s) received no financial support for the research, authorship, and/or publication of this article.