






Abstract
We employed a multi-method approach to assess both stereotypes related to male race and male sexual orientation, and then analyzed how race stereotypes applied to sexual orientation categories and vice versa. Results from Study 1−3a-b (N = 552), along with internal meta-analyses, showed that White, Black, and Asian men were more strongly stereotyped as heterosexual than gay. This pattern was equally strong for White and Black men but weaker for Asian men. White men were more associated with heterosexual traits, while Black men were more perceived as lacking gay traits than the other race categories. Heterosexual men displayed a race-graded structure, favoring White over Black and then Asian traits. In contrast, the race-graded structure of gay men disfavored Black traits only, compared to White and Asian traits. The theoretical implications regarding the intersection of race and sexual orientation categories, as well as the social impact of these findings, are discussed.
Introduction
Research on stereotypes has traditionally focused on traits associated with single social categories. More recently, scholars adopting an intersectional framework have emphasized that social categories are linked in selective ways, such that activating one category can also activate the stereotypical content of a preferentially associated category (Coladonato et al., 2024; Hall et al., 2019; Remedios & Vinluan, 2024). For instance, activating the category “Black people” at the cognitive level does not make both gender categories equally available; rather, Black men are more readily activated than Black women, indicating a preferential association between the race category and a specific gender category. Race and sexual orientation categories referring to men are thought to hold such selective associations rather than operate independently, such that different male race categories entail distinct, or differentially strong, associations with specific male sexual orientation categories, and vice versa. However, how race categories referring to men shape the conceptualization of sexual orientation categories referring to men, and vice versa, remains an open question. Indeed, previous research on this topic has yielded mixed findings and has produced competing hypotheses that still need to be tested against one another. The present research tests alternative predictions about how male race and sexual orientation categories selectively intersect, and shed light on the cognitive processes that regulate such crossover.
Given that previous studies on this issue have primarily focused on the category of “men,” we limited our investigation to male race and sexual orientation categories. This restriction allows us to build on prior studies by formulating alternative hypotheses and to make a more direct comparison of the current results with those reported in prior research. Importantly, and differently from previous studies, we adopted a multi-method approach, enhancing confidence in the understanding of the stereotype intersections under analysis.
Race Stereotyping of Male Sexual Orientation Categories
In Western societies, and especially for White people, men are often associated with “White,” leading to the assumption that when race is unspecified, men are White by default (Hegarty, 2017; Stroessner, 1996). Likewise, men are overwhelmingly assumed to be heterosexual unless proven otherwise (Herek, 2007; Lick & Johnson, 2016). For White individuals, these two defaults coexist within the male category where these assumptions reinforce one another, contributing to a broader system of privilege (Reddy, 1998). Hence, the contents of the representations of heterosexual men and that of White men are likely congruent, if not overlapping. If so, the conceptualization of gay men, being oppositional to that of heterosexual men, may include fewer stereotypical traits associated with White men. From another perspective, racial stereotypes in general—beyond those of White men—may be weaker for gay than for heterosexual men, since both Black and White gay men are perceived more through their sexual orientation than their racial identity (Preddie & Biernat, 2021). Alternatively, stereotypes of racial minority men, particularly Black and Asian men, may follow opposite patterns in heterosexual and gay men rather than being equally diluted. Indeed, the conceptualization of gay men is especially distant from that of Black men, as the stereotypes of gay men overlap less with those of Black than White gay men (Calabrese et al., 2018; Preddie & Biernat, 2021). Moreover, stereotypes about Asian men may be perceived as more opposed to heterosexual than gay men due to traits linked to a perceived lack of masculinity (Wong et al., 2012, 2013). Research supporting this conjecture shows a stronger response bias in classifying faces of Asian men as gay compared to faces of Black men (Johnson & Ghavami, 2011).
Overall, the existing literature provides a fragmented picture of the racial conceptualization of sexual orientation categories among men. Thus, it remains unclear whether gay men, compared to heterosexual men, might be stereotyped less strongly in terms of White male stereotypes, whether racial stereotypes more broadly may be attenuated for gay men, or whether stereotypes of Black and Asian men might instead follow opposite patterns for heterosexual and gay men. To address these alternative hypotheses, the present research systematically investigates the stereotyping of male sexual orientation categories based on stereotypical traits of White, Black, and Asian men.
Sexual Orientation Stereotyping of Male Race Categories
Evidence suggests that White, Black, and Asian men are assumed to be heterosexual by default, making being gay incongruent with these male racial categories (Petsko & Bodenhausen, 2019; Petsko & Vogler, 2024). Whether the construal and strength of these heteronormative defaults are similar across race categories remains a debated issue. White men have typically served as a control group in previous research and are often reported to have a “normal” baseline level of masculinity compared to Black and Asian men (Galinsky et al., 2013; Hall et al., 2019). Since masculinity signals presume heterosexuality, White men may be perceived as the “heterosexual default,” establishing a standard of heteronormativity in comparison to Black and Asian men. However, the representations of White men and heterosexual men likely cognitively blend due to overlapping stereotypes, making White men sexual orientation stereotyping more strongly defined by shared heterosexual traits compared to traits of other race categories. Unlike White and especially Asian men, Black men are stereotyped as hyper-masculine (Galinsky et al., 2013; Wong et al., 2013), likely boosting heterosexual traits and/or downplaying gay traits among Black men compared to other race categories. Asian men are often conceptualized as less masculine (Chua & Fujino, 1999; Ho, 2011), likely misaligning with the heterosexual stereotype and/or aligning with that of gay men (Johnson & Ghavami, 2011). Thus, stereotypes of Asian men may feature fewer heterosexual traits and/or more gay traits compared to Black and White men.
Research addressing how sexual orientation is conceptualized across race categories among men has yielded mixed findings. Research using a global similarity measure found that White and Black men were perceived as more similar to their heterosexual than their gay counterparts, with this effect being particularly pronounced for Black men (Preddie & Biernat, 2021). Similarly, studies using pictures of White and Black men to assess perceived sexual orientation found that Black men were perceived as more heterosexual than White men (Benson & Volpe, 2023). By contrast, Carnaghi et al. (2020) showed that the relative advantage in the attribution of heterosexual over gay men traits was similar for White and Black men but reduced for Asian men.
While informative, these studies yield inconsistent findings and raise questions that this research seeks to address. First, research using pictures of faces (Benson & Volpe, 2023), although controlled for neutral expressions, may not have sufficiently accounted for confounding factors like dominance and masculine features essential for inferring sexual orientation (Johnson & Ghavami, 2011). Consequently, this may have unintentionally inflated the perceived heterosexuality of Black men relative to White men, leaving open the question of whether the heteronormative construal of these categories occurs similarly or more strongly for Black men. Additionally, it remains unclear whether White and Black men are construed in a heteronormative fashion through different processes, namely the enhancement of perceived heterosexual traits in the former and the downplaying of gay traits in the latter. Similarly, it is not yet known whether the diminished heteronormative construal of Asian men, compared to White and Black men, is driven by a reduction in perceived heterosexual traits, an increase in perceived gay traits, or both.
Overview of the Studies
Based on the reviewed literature, we suggest these hypotheses. When comparing the attribution of heterosexual to that of gay traits within each male race category, White and Black men may be more strongly associated with heterosexual traits than gay traits, though this pattern may be less pronounced for Asian men (H1). When comparing the attribution of heterosexual and that of gay traits among male race categories, two alternatives emerge. First, White and Black men may experience similar levels of sexual orientation stereotyping, with a similar attribution of heterosexual traits to White and Black men, but to a greater extent than that attributed to Asian men, and with a similar attribution of gay traits to White and Black men, but to a lower extent than that attributed to Asian men (H2a). Alternatively, Black men may be attributed more heterosexual traits than both White and Asian men, and fewer gay traits compared with both White and Asian men (H2b). Tentatively, as heterosexual traits are expected to be conflated with those of White men, sexual orientation stereotyping for White men could be especially centered on heterosexual traits, so that heterosexual traits would be more strongly attributed to White men than Black and Asian men (H3). In contrast, for Black men, as gay traits are seen as oppositional to the stereotypes of Black men, more so than to stereotypes of White and Asian men, sexual orientation stereotyping of Black men may be characterized by the absence of gay traits to a greater extent than that of White and Asian men (H4).
As for race stereotyping, heterosexual men may be more strongly associated with White traits than gay men, given the strong conflation of heterosexual men and White men (H5). This does not imply that gay men are not stereotyped as White, but rather that the strength of this association is more pronounced for heterosexual men. Moreover, gay men may be less strongly stereotyped than heterosexual men with regard to racial traits overall, indicating less intense race stereotyping for gay men (H6a). In other words, the attribution of White, Black, and Asian traits would be lower in gay men as compared to heterosexual men. Alternatively, heterosexual men might be more closely associated with Black traits than Asian traits, whereas gay men might show the opposite pattern (H6b).
Research on this topic has employed different methods of stereotype assessment, such as stereotype attribution and global similarity measures (Carnaghi et al., 2020; Preddie & Biernat, 2021). Evidence suggests that different methods for assessing stereotypes often yield inconsistent results (Biernat & Crandall, 1994; Jonas & Hewstone, 1986). As such, the observed contrasting findings may be method-dependent, highlighting the need for a more comprehensive examination of the sexual orientation stereotyping of race categories referring to men, and vice versa, using a diverse array of methods. To address this, we used three different procedures to gather stereotypical characteristics and test our hypotheses.
In Study 1, stereotypes are defined as beliefs about category characteristics that emphasize between-category distinctions (Tajfel, 1969, 1982). Stereotypes have often been measured through typicality ratings (e.g., Cadinu et al., 2013) and operationalized as traits highly typical of one category but not of another (“typicality procedure”; Judd & Park, 1993).
In Study 2, stereotypes mark a category as distinct from the general population (Kunda & Thagard, 1996). Traits that are distinctive, meaning their prevalence in the category either exceeds or falls below expected default values, are considered stereotypical (McCauley & Stitt, 1978; McCauley & Thangavelu, 1991). This is assessed by estimating the percentage of individuals in each category possessing certain traits compared to the general population. Distinctive traits for a given category are those that maximize the difference between that category and the general population more than the differences between other categories and the general population (“distinctiveness procedure”).
In Study 3, we used an adapted version of the Princeton Trilogy procedure, initially developed by Katz and Braly (1933), which involves two participant samples. Based on a list of traits, the first sample selects those associated with various categories (e.g., Black and Asian men). Framing stereotypes as consensual beliefs about a category, stereotypical traits are those most frequently selected. Next, a second sample rates the traits along relevant dimensions. The traits selected by the first sample are then scored based on these ratings. In this research, ratings from the second sample were derived from the typicality procedure (Study 3a) and the distinctiveness procedure (Study 3b).
After identifying stereotypical traits for sexual orientation and race categories referring to men via three procedures, we analyzed how male race categories are conceptualized through the lens of the stereotypes of male sexual orientation categories, and vice versa (i.e., stereotyping). Using different procedures to identify these traits helps minimize the risk that our analysis of stereotyping depends on the specific stereotypical traits derived from any specific procedure.
Furthermore, we used three distinct stereotyping assessment methods to minimize the dependence of results on any single approach. In Study 1, we assessed the extent to which sexual orientation stereotypes referring to men are attributed to race categories referring to men, and vice versa (Coladonato et al., 2024; Galinsky et al., 2013). In Study 2, we assessed the extent to which distinctive traits of sexual orientation categories referring to men are distinctive for male race categories, and vice versa. In Study 3, we scored selected traits for race and those for sexual orientation categories referring to men based on ratings derived from both the typicality (Study 3a) and distinctiveness procedures (Study 3b) for male sexual orientation and male race categories, respectively.
Methodology
The studies were run via Qualtrics (2024) and data were collected via Prolific (2024). We chose to filter for Italian participants who were native Italian speakers and identified as heterosexual. However, when reporting their demographics, participants may have self-identified differently from their initial declaration on the crowdfunding platform (see Table 1). The sample size was defined before data collection (see Table S1 in the supplemental material), and data were analyzed only after data collection was completed using jamovi (The jamovi project, 2024), and RStudio (RCoreTeam, 2025) for both sensitivity power analyses (WebPower package; Zhang et al., 2023) and meta-analyses (metafor package; Viechtbauer, 2010). Post-hoc comparisons were Bonferroni corrected (jamovi correct p-values are reported; for effect-size calculation, see supplemental material). Marginal means and standard errors are reported in the figures. All independent and dependent variables are disclosed.
Age, Gender, Sexual Orientation, Citizenship, and Native Language of Participants as a Function of Studies 1–3.
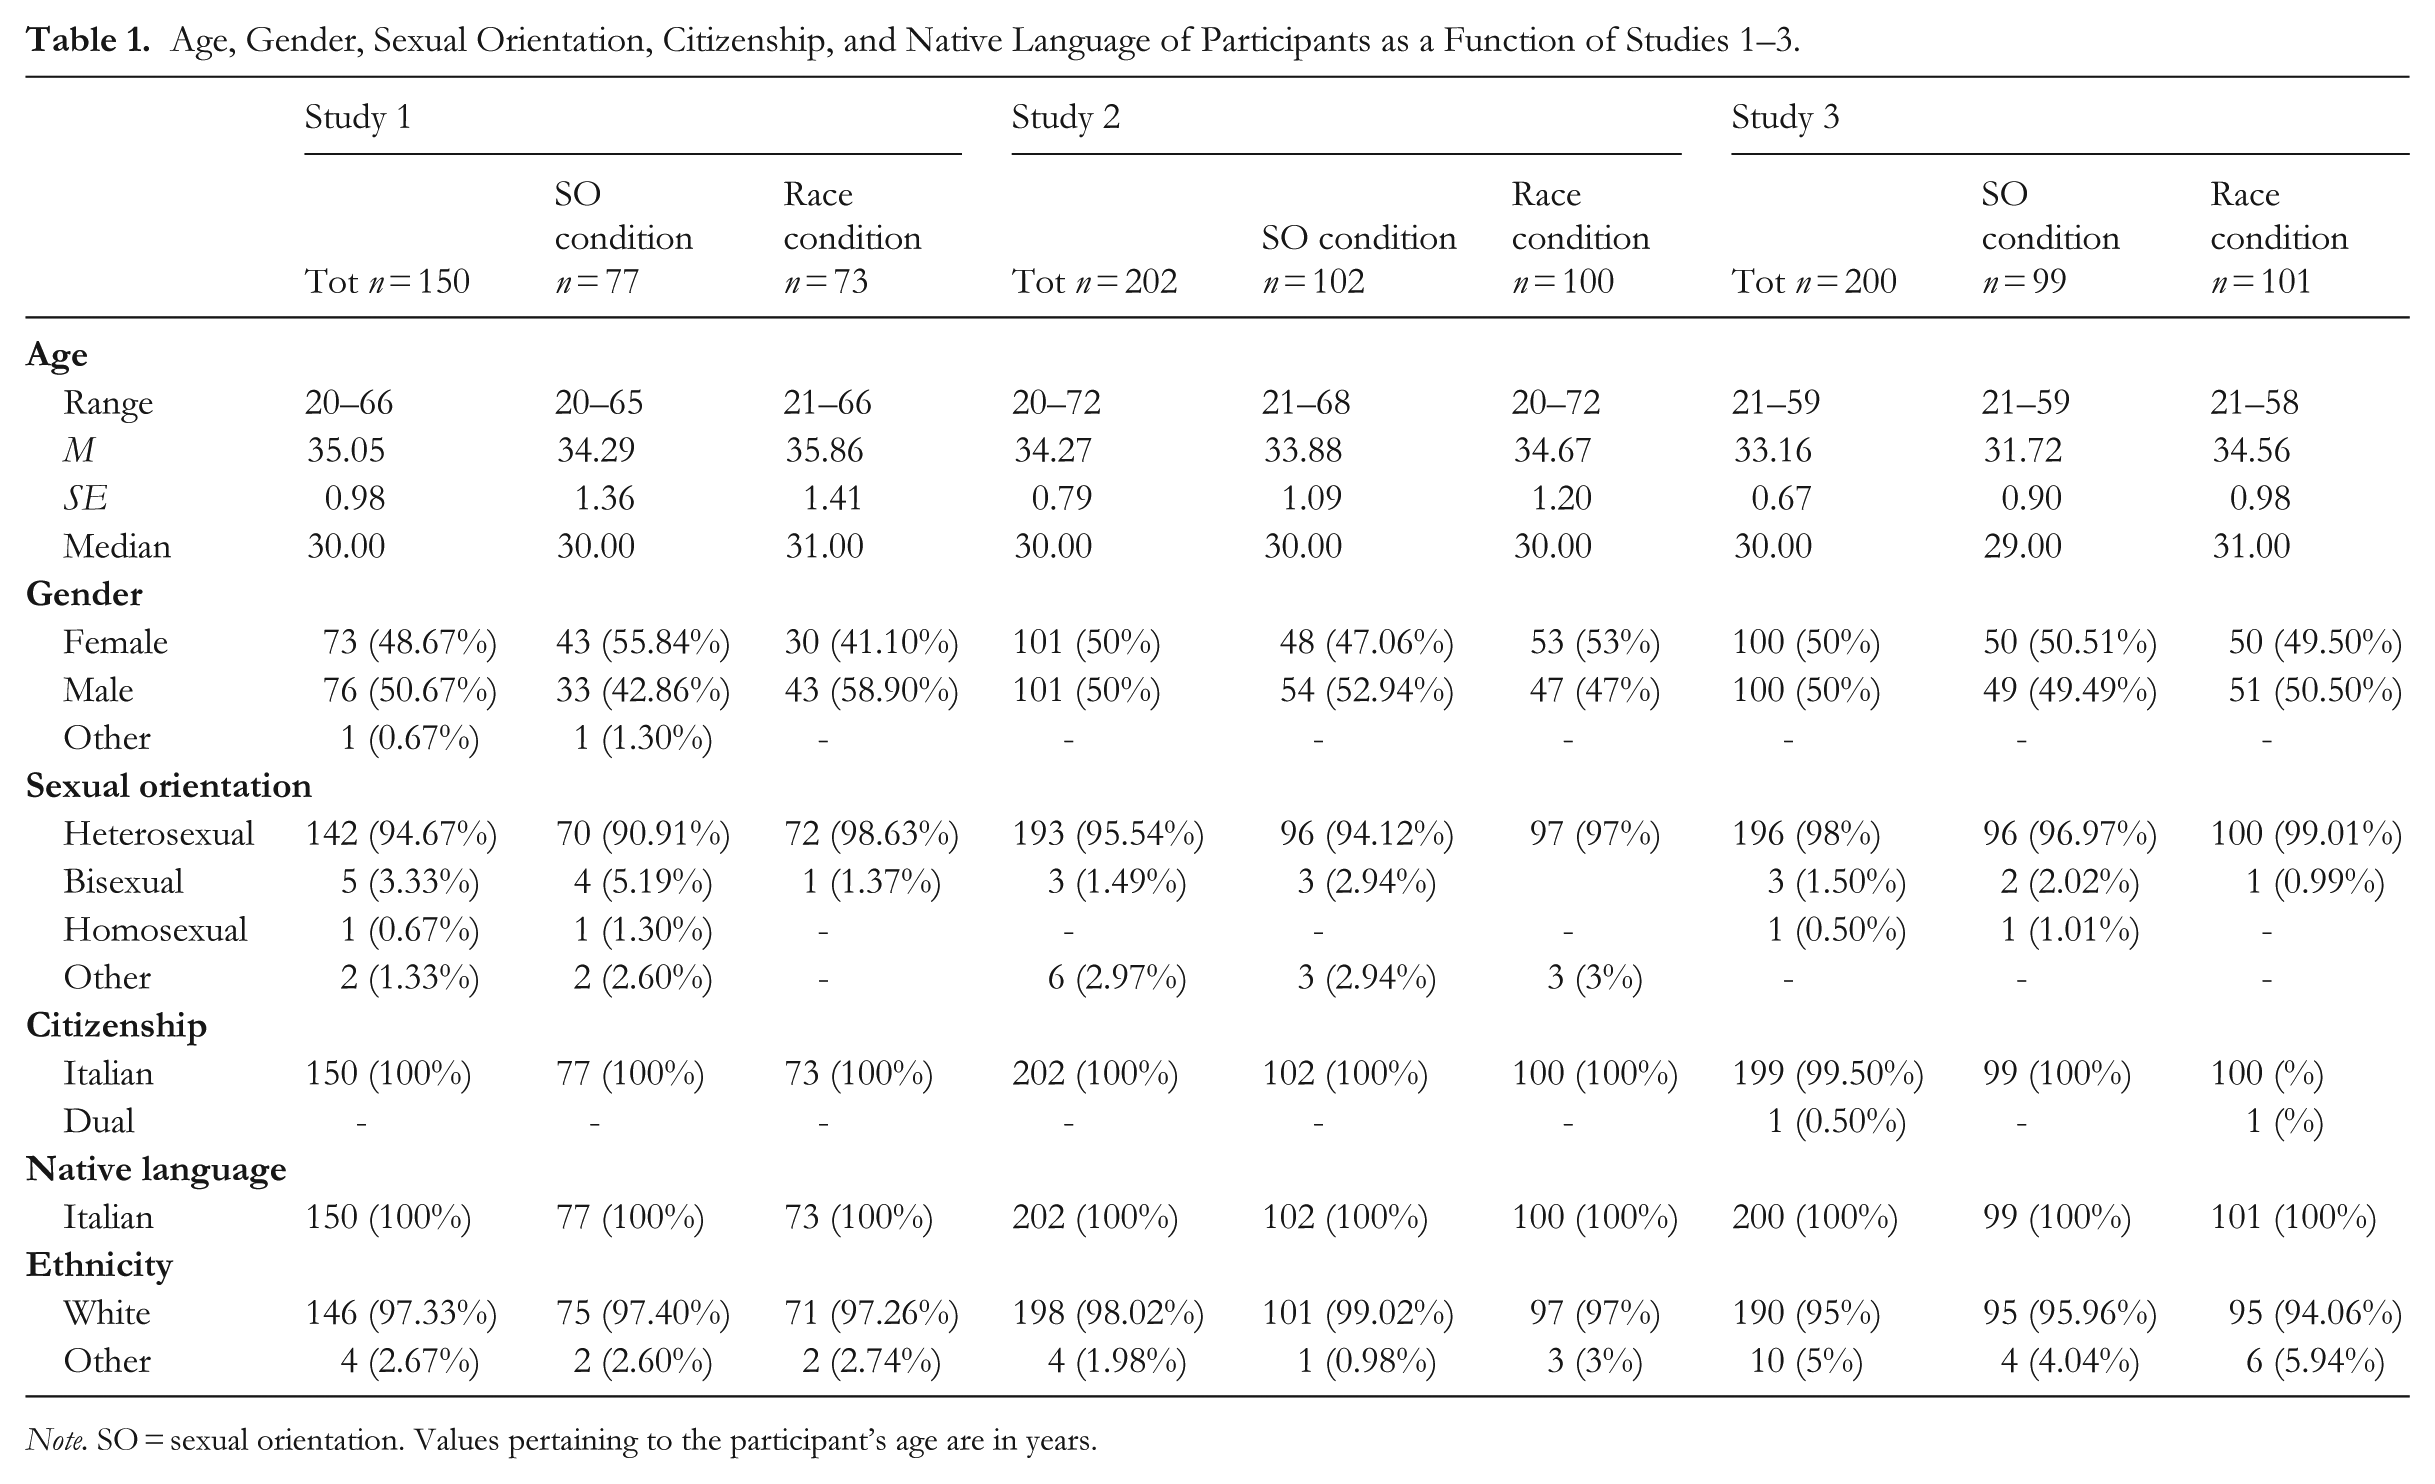
Note. SO = sexual orientation. Values pertaining to the participant’s age are in years.
Results of each study were discussed and compared across methods in a dedicated section.
Data files, analyses, and the text of the survey are available on the OSF website: https://osf.io/z7xhf/overview?view_only=4eea768c756a432f9833de4c4157ff51. The studies were approved by the Ethics Board of the University.
Study 1
Participants
Participants (N = 150) were assigned to the sexual orientation condition (n = 77), and to the race condition (n = 73; see procedure below). Demographics are reported in Table 1. The Minimum Detectable Effect (i.e., MDE) with this sample size fell within the medium-to-large effect range (Cohen, 1988).
Procedure
Participants were informed that the study examined how people form impressions of individuals or groups based on limited information. After providing consent, participants were told that they would be presented with various social categories one at a time. Participants were further informed that, for each category, they would view a list of attributes and rate the extent to which society, rather than they themselves, associated each attribute with the category. Participants were then randomly assigned to either the sexual orientation condition or the race condition. In the sexual orientation condition, participants were informed that “in the world, there are different sexual orientations” and then told that “in this case, you are asked to think of” one of the randomly selected sexual orientation categories: “Heterosexuals (heterosexual men)” [in Italian, gli Eterosessuali (uomini eterosessuali)] and “Homosexuals (homosexual men)” [in Italian, gli Omosessuali (uomini omosessuali)]. The categories were presented one at a time in a sequential order. The term “homosexuals” is commonly used in Italian and is not considered offensive. 1
In the race condition, participants were informed that “in the world, there are different ethnic groups” (in Italian, gruppi etnici 2 ) and were then asked to “think of” one of the randomly selected race categories: “Whites (White men)” [in Italian, i Bianchi (uomini bianchi)], “Blacks (Colored men)” [in Italian, i Neri (uomini di colore)], and “Asians (Asian men)” [in Italian, gli Asiatici (uomini asiatici)]. The categories were presented one at a time and in succession.
Regardless of the condition, directly below the category, participants found a list of n = 116 adjectives and brief expressions (i.e., traits). They rated how much each trait was considered typical in our society (i.e., characteristic) of the category, by using a 7-point Likert scale, ranging from 1 (not at all typical) to 7 (completely typical). Given the high number of ratings, we divided the list of traits into two blocks (i.e., Block A and Block B), each comprising fifty-eight randomly selected traits. The order of the presentation of Blocks A and B was randomized across participants. Participants were reminded of the category they had rated in the first block before starting the second block. Participants reported demographics (for their assessment, see supplemental material), and were debriefed afterward.
Experimental Material
Traits were selected from prior research on sexual orientation and race stereotypes (see supplemental material). If available in English, they were translated into Italian by the authors (without back translation) and adjusted for the Italian context. New traits such as “assertive” were added (see Appendix A).
Results and Discussion
Stereotypes about Sexual Orientation Categories and Race Categories
We identified stereotypical traits of each sexual orientation and race category (Tables 2 and 3, respectively) using the typicality procedure (detailed in the supplemental material). Analyses showed that traits highly typical of heterosexual men were not typical for gay men, and vice versa (Figure S1 in the supplemental material), and that traits highly typical of one race category were not typical for the other categories (Figure S2 in the supplemental material). These results confirmed that the selected traits are indeed stereotypical of the categories in question and can be used in the subsequent stereotyping analyses.
List of Highly Typical (Study 1), Most Distinctive (Study 2), and Most Frequently Selected (Study 3) Traits of Heterosexual and Gay Men.
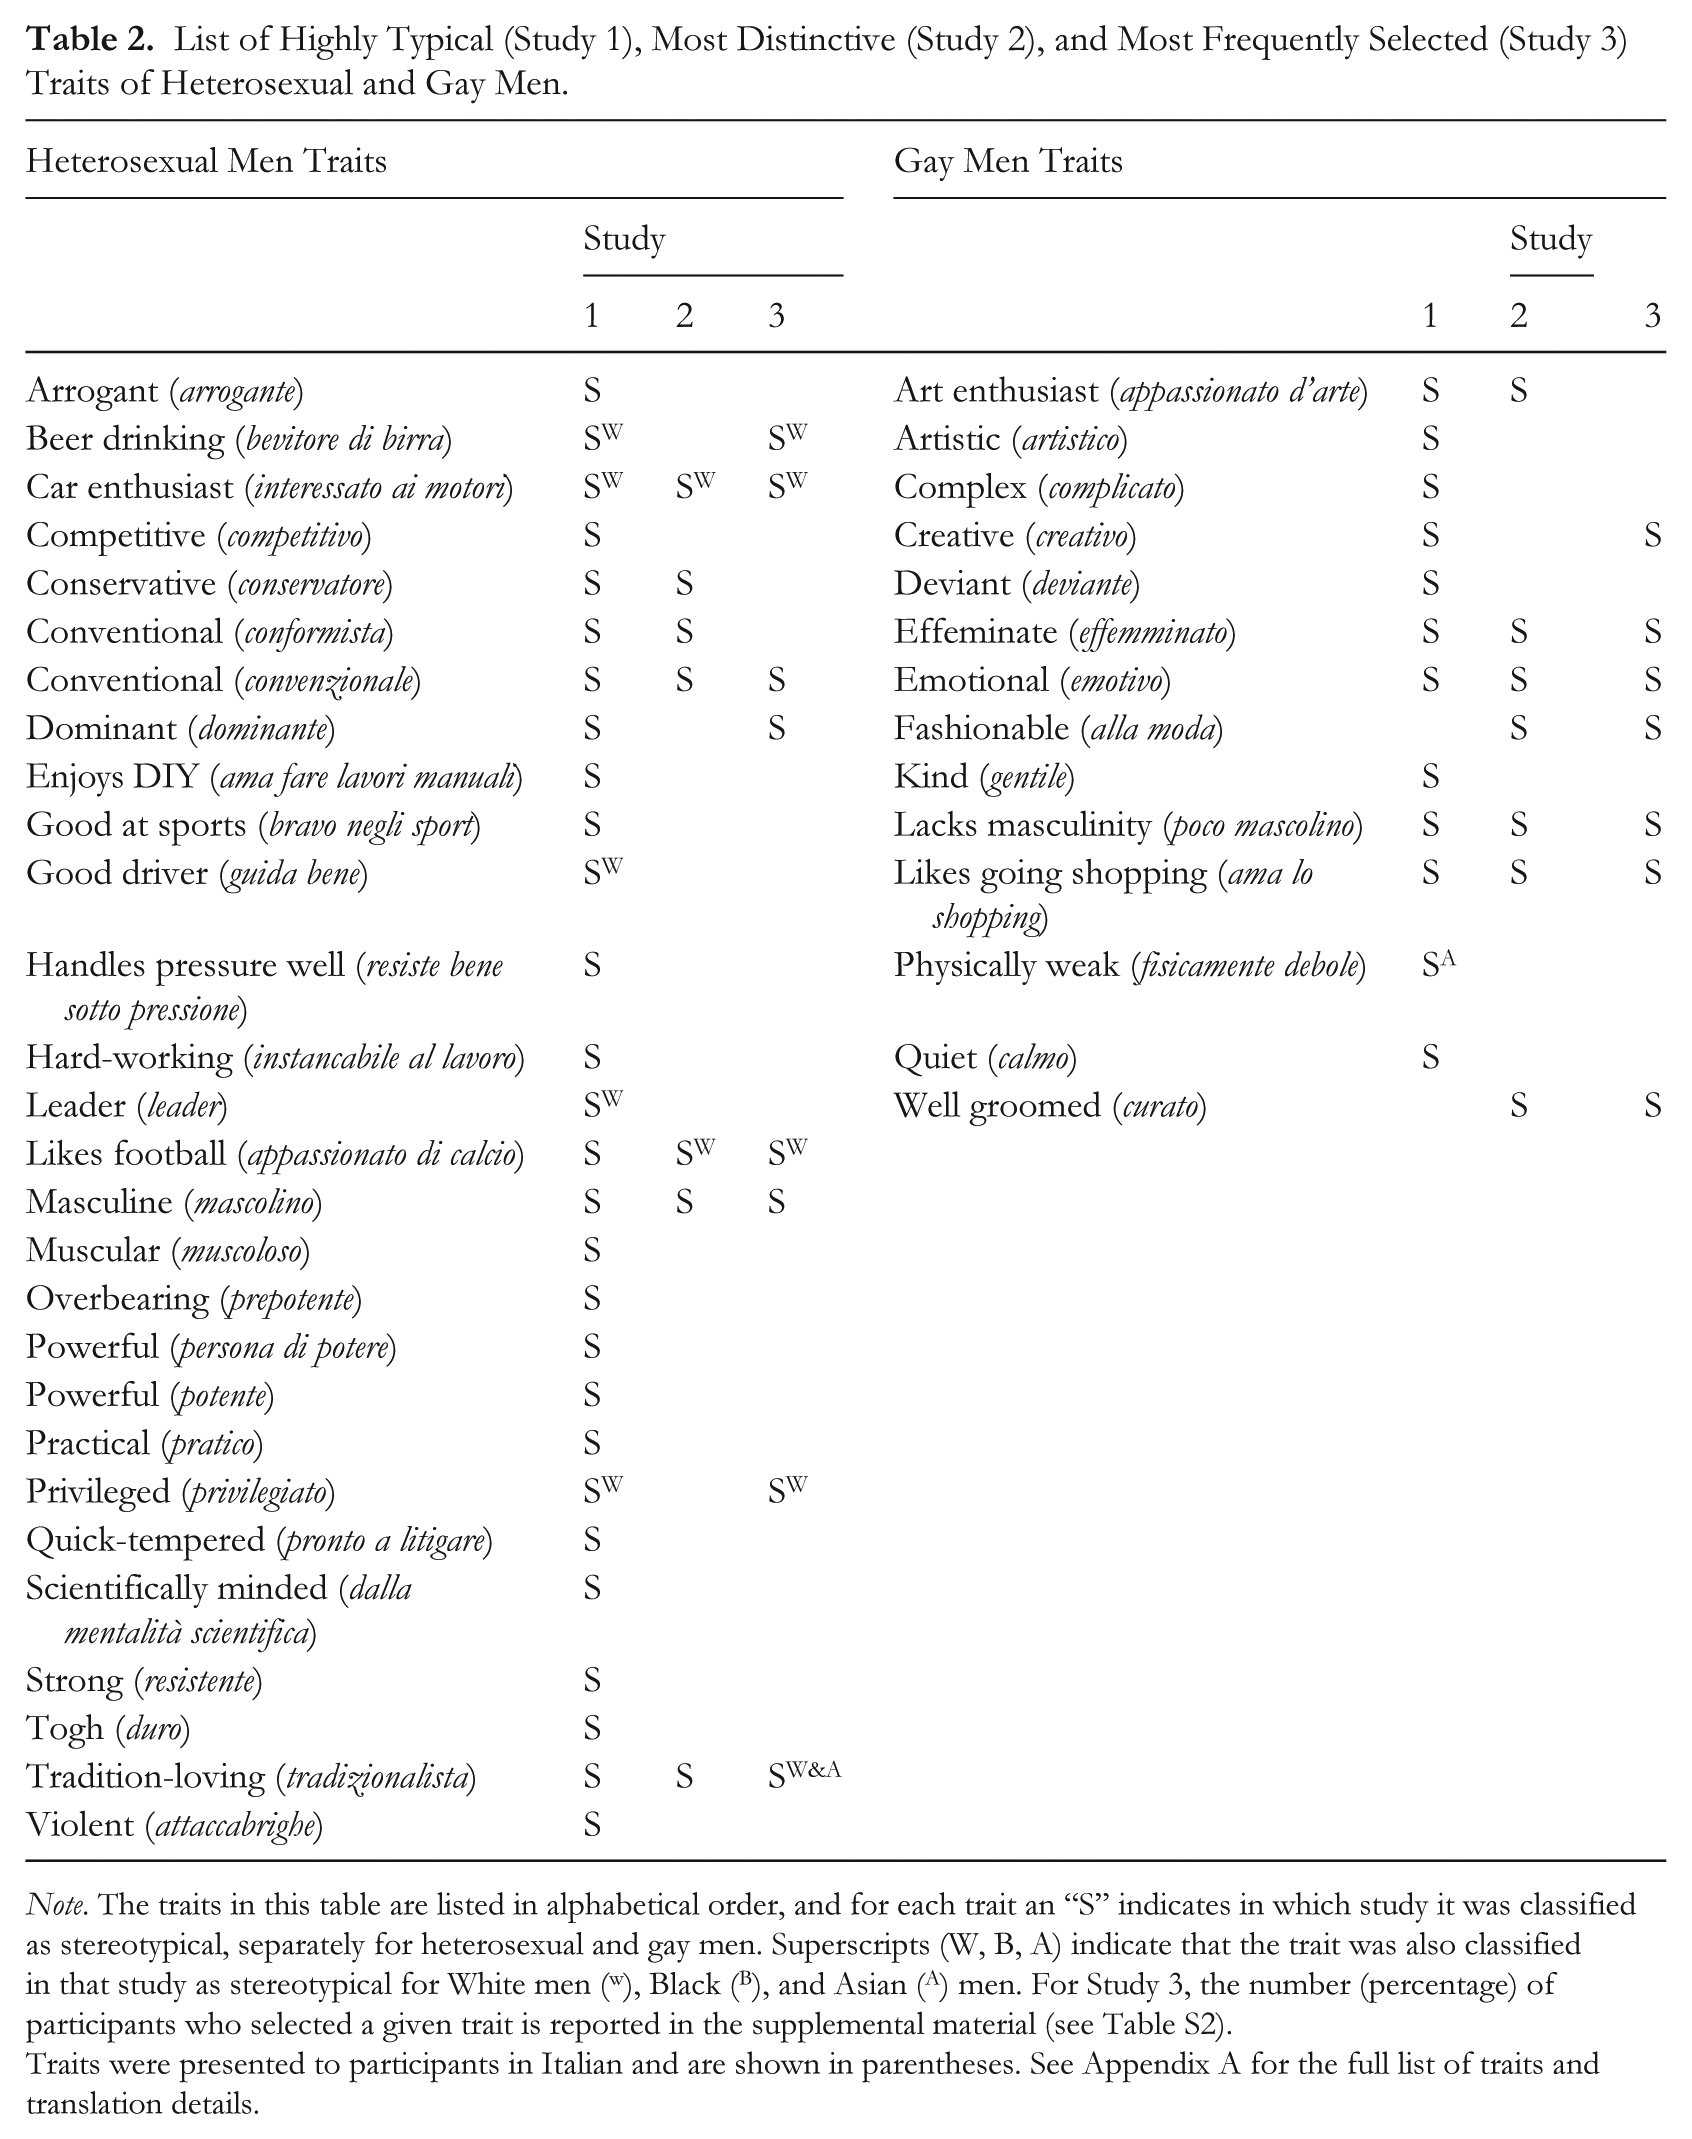
Note. The traits in this table are listed in alphabetical order, and for each trait an “S” indicates in which study it was classified as stereotypical, separately for heterosexual and gay men. Superscripts (W, B, A) indicate that the trait was also classified in that study as stereotypical for White men (w), Black (B), and Asian (A) men. For Study 3, the number (percentage) of participants who selected a given trait is reported in the supplemental material (see Table S2).
Traits were presented to participants in Italian and are shown in parentheses. See Appendix A for the full list of traits and translation details.
List of Highly Typical (Study 1), Most Distinctive (Study 2), and Most Frequently Selected (Study 3) Traits of White, Black, and Asian Men.
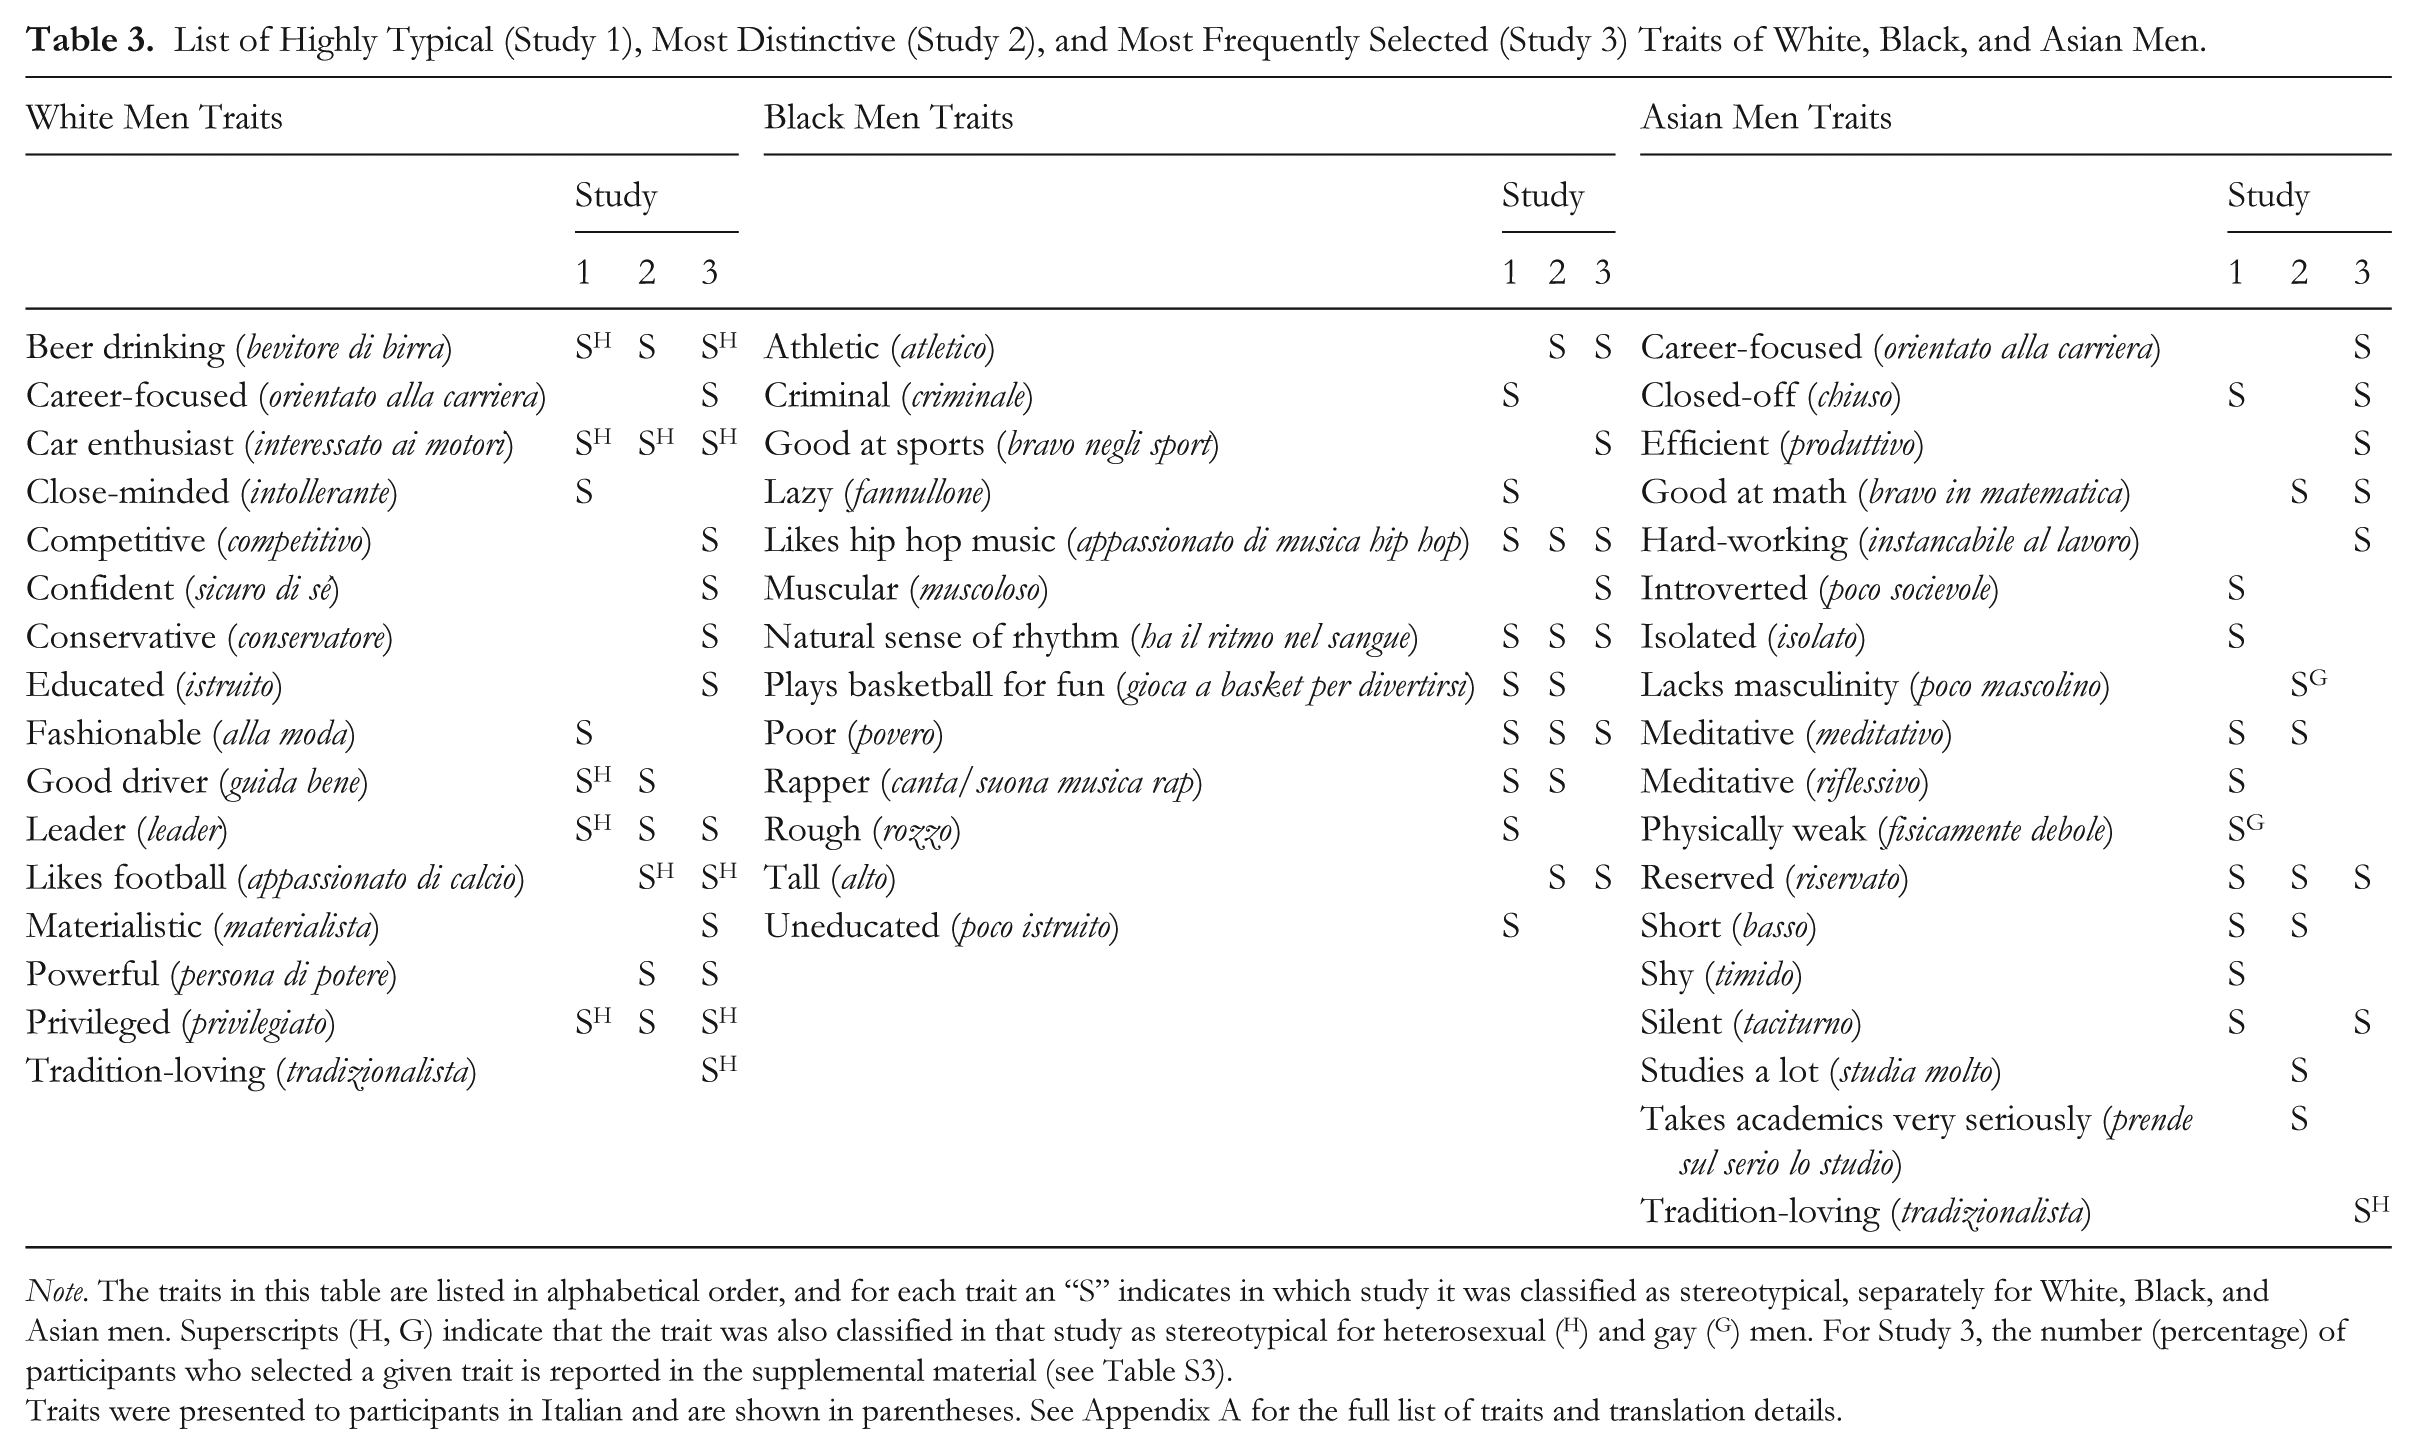
Note. The traits in this table are listed in alphabetical order, and for each trait an “S” indicates in which study it was classified as stereotypical, separately for White, Black, and Asian men. Superscripts (H, G) indicate that the trait was also classified in that study as stereotypical for heterosexual (H) and gay (G) men. For Study 3, the number (percentage) of participants who selected a given trait is reported in the supplemental material (see Table S3).
Traits were presented to participants in Italian and are shown in parentheses. See Appendix A for the full list of traits and translation details.
Sexual Orientation Stereotyping of Race Categories
We assessed the extent to which participants attributed heterosexual and gay traits to race categories. After assessing their reliability (Appendix B), participants’ ratings on the heterosexual (i.e., HM traits) and gay traits (i.e., GM traits) were averaged separately for each race category. Participants’ averaged ratings were analyzed via an ANOVA 3(category: White men, Black men, Asian men) × 2(traits: HM, GM), with both variables as within-participants factors.
The category by traits interaction was significant, F(2, 144) = 52.47, p < .001, η2 = .08 (Figure 1). White and Black men were both attributed more HM than GM traits, t(72) = 9.71, p < .001, d = 1.18, t(72) = 12.49, p < .001, d = 1.47, respectively. No difference occurred between the attribution of HM and GM traits to Asian men, t(72) = 1.12, p = 1.000, d = 0.14.
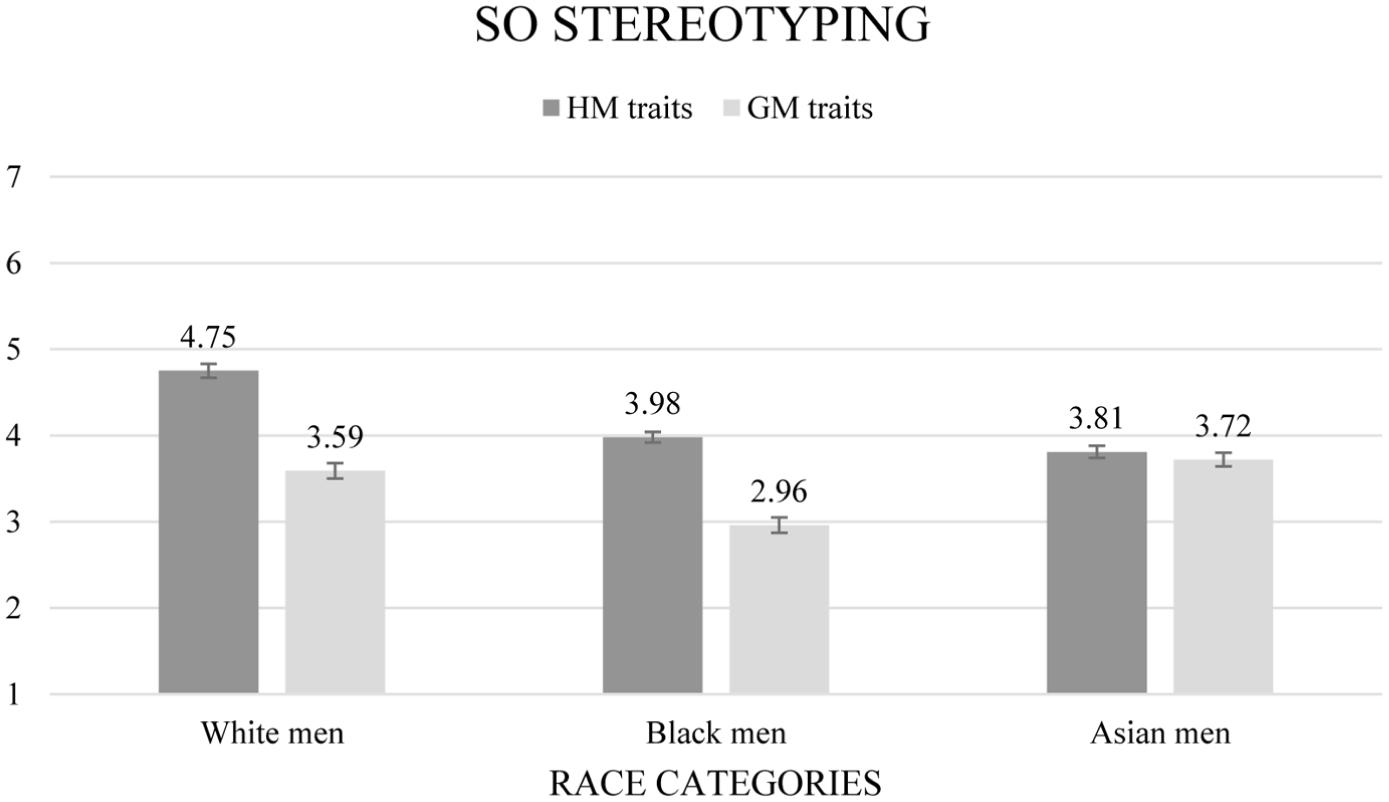
Participants’ average ratings of highly typical traits of heterosexual and gay men by race category (i.e., White men, Black men, and Asian men) in Study 1.
Moreover, White men were attributed more HM traits than both Black, t(72) = 10.29, p < .001, d = 1.24, and Asian men, t(72) = 10.90, p < .001, d = 1.29, who were similarly rated on HM traits, t(72) = 2.77, p = .107, d = 0.32. By contrast, Black men were attributed fewer GM traits than both White, t(72) = 6.25, p < .001, d = 0.75, and Asian men, t(72) = 9.96, p < .001, d = 1.16, who were similarly rated on GM traits, t(72) = 1.69, p = 1.000, d = 0.20. 3
In summary, White and Black men were stereotyped more based on heterosexual traits than gay traits, whereas Asian men were stereotyped equally on both. Additionally, the sexual orientation stereotyping of White men was characterized by an emphasis on heterosexual traits, while for Black men, it involved downplaying gay traits.
Race Stereotyping of Sexual Orientation Categories
We assessed the extent to which participants attributed White, Black, and Asian traits to sexual orientation categories. Participants’ ratings of White (i.e., WM traits), Black (i.e., BM traits), and Asian traits (i.e., AM traits) were averaged separately for each sexual orientation category (reliability analyses in Appendix B). Participants’ averaged ratings were analyzed via an ANOVA 2(category: heterosexual men, gay men) × 3(traits: WM, BM, AM), with both variables as within-participants factors.
The category by traits interaction was significant, F(2, 150) = 72.67, p < .001, η2 = .14 (Figure 2). Heterosexual men were attributed more WM traits than both BM, t(75) = 10.85, p < .001, d = 1.18, and AM traits, t(75) = 12.30, p < .001, d = 1.36. Also, heterosexual men were attributed more BM than AM traits, t(75) = 5.45, p < .001, d = 0.61. Gay men were attributed BM traits to a lesser extent than WM traits, t(75) = 6.67, p < .001, d = 0.76, and AM traits, t(75) = 6.80, p < .001, d = 0.79, while the attribution of WM and AM traits to gay men did not differ from each other, t(75) = 1.66, p = 1.000, d = 0.19.
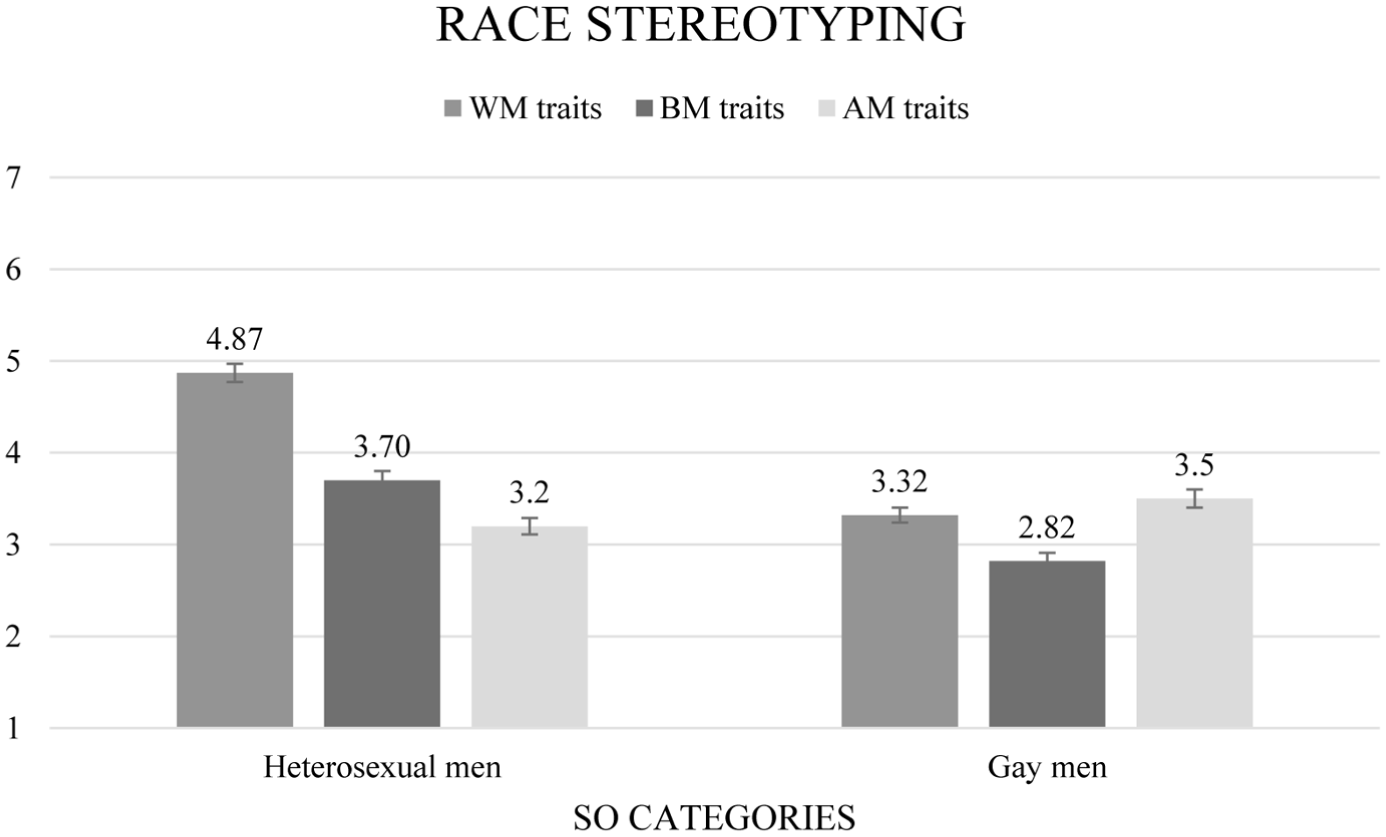
Participants’ average ratings of traits highly typical of White, Black, and Asian men by sexual orientation category (i.e., heterosexual men and gay men) in Study 1.
Heterosexual men were attributed more WM, t(75) = 12.07, p < .001, d = 1.34, and BM traits than gay men, t(75) = 8.36, p < .001, d = 0.93, while there was no difference in the attribution of AM traits between heterosexual and gay men, t(75) = 2.45, p = .246, d = 0.29.
Heterosexual men exhibited a race-graded structure, favoring White, then Black, and then Asian men stereotypical traits. Gay men were particularly characterized by a lack of traits associated with Black men. Heterosexual men were more strongly racialized as White and then as Black men compared to gay men, whereas no significant difference was observed for Asian traits.
Study 2
Participants
Two hundred and three participants were recruited. Of these, n = 1 did not agree to participate; n = 102 were assigned to the sexual orientation condition, and n = 100 to the race condition (demographics are reported in Table 1). The MDE with this sample size fell within the medium effect range.
Procedure
Procedures were the same as in Study 1 unless otherwise specified. Participants were presented with a general category, namely “Men” [in Italian, gli Uomini], along with either the sexual orientation or the race categories. For each trait, participants were prompted with the following question: “What is the percentage of [category] who are [trait]?,” and used a slider from 0 to 100% 4 to report the desired percentage. Participants answered the questions by indicating what they believed the societal response would be. Unlike in Study 1, the traits were presented in the plural rather than the singular form.
Results and Discussion
Stereotypes about Sexual Orientation and Race Categories
In line with the distinctiveness procedure (detailed in the supplemental material), we retained traits more distinctive of heterosexual men compared to gay men, and vice versa, as well as traits distinctive of one race category over others in comparison to “men” (Tables 2 and 3, respectively). Analyses indicated that the traits distinctive of heterosexual men (i.e., HM traits) characterized equally heterosexual men and men overall, but less strongly gay men; conversely, the traits distinctive of gay men (i.e., GM traits) characterized gay men more than both heterosexual men and men (Figure S3 in the supplementary material). The distinctive traits of a race category characterized this race category more than the other race categories. While the traits distinctive of Black (i.e., BM traits) and Asian men (i.e., AM traits) characterized these groups more strongly than men in general, the traits distinctive of White men (i.e., WM traits) characterized White men to a similar extent as men in general (Figure S4 in the supplemental material). Hence, “men” is characterized as both heterosexual and White.
Overall, the results confirmed that the selected traits were distinctive to the categories in question and formed a valid set for the upcoming stereotyping analyses.
Sexual Orientation Stereotyping of Race Categories
We assessed the extent to which HM and GM traits characterized each race category and the general category. 5 After assessing their reliability (Appendix B), participants’ ratings on HM and GM traits were averaged separately for the general category and each race category. Participants’ averaged ratings were analyzed via an ANOVA 4(category: men, White men, Black men, Asian men) × 2(traits: HM, GM), with both variables as within-participants factors.
The category by traits interaction was significant, F(3, 294) = 41.95, p < .001, η2 = .04 (Figure 3). Men were characterized more by HM than by GM traits, t(98) = 19.16, p < .001, d = 1.92. White, Black, and Asian men were all characterized more by HM than GM traits, t(98) = 14.64, p < .001, d = 1.49; t(98) = 13.97, p < .001, d = 1.40; t(98) = 4.95, p < .001, d = 0.50, respectively.
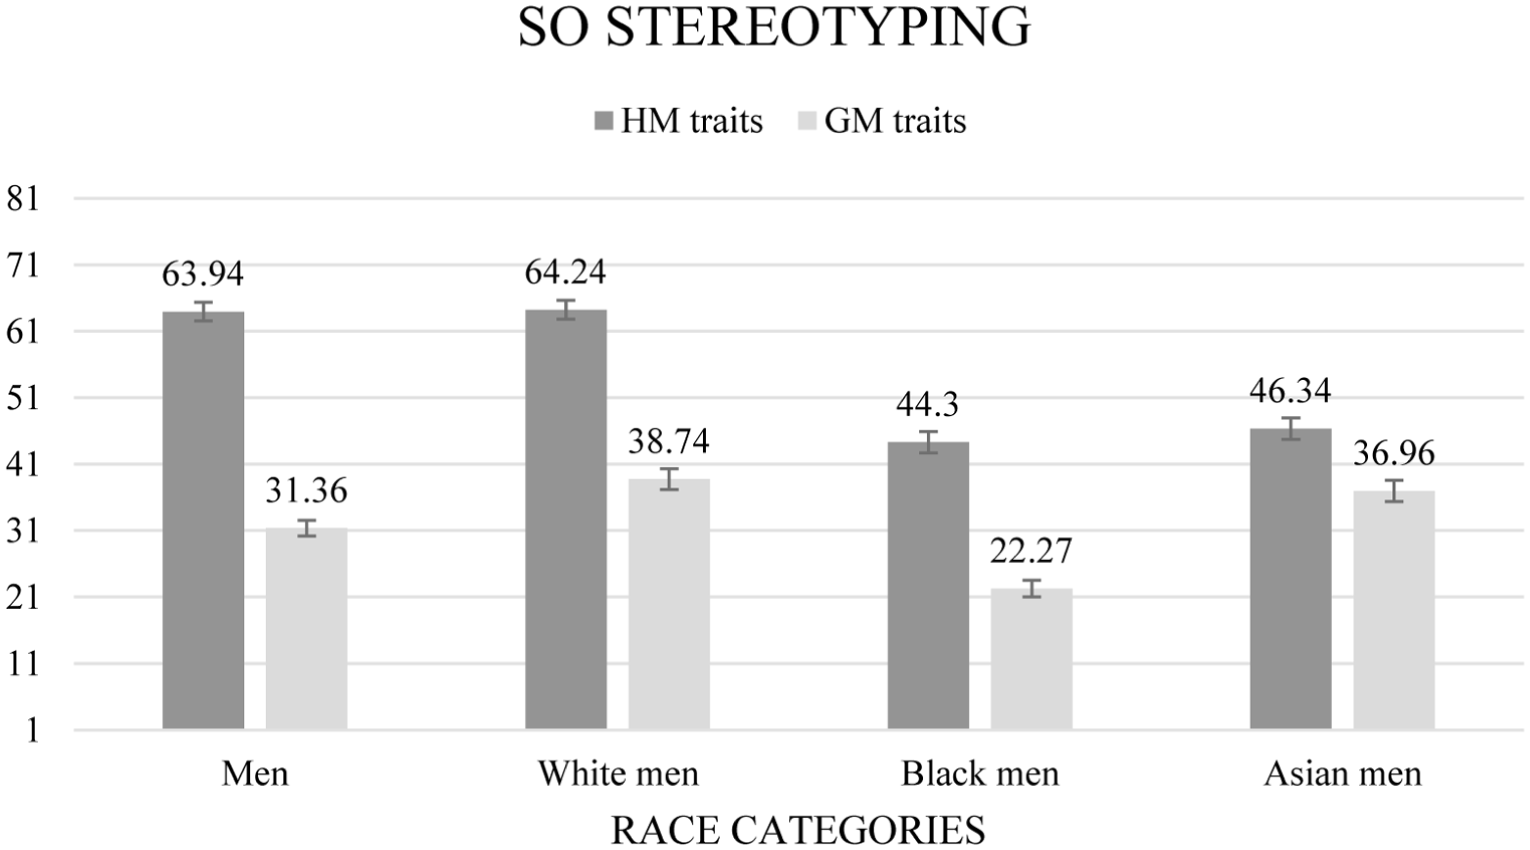
Participants’ average ratings of traits most distinctive of heterosexual and gay men by category (i.e., men, White men, Black men, and Asian men) in Study 2.
Men and White men were similarly characterized by HM traits, t(98) = 0.36, p = 1.000, d = 0.03. Men and White men were both more strongly characterized by HM traits than Black men, t(98) = 11.92, p < .001, d = 1.19; t(98) = 11.77, p < .001, d = 1.17, respectively, as well as than Asian men, t(98) = 10.57, p < .001, d = 1.06; t(98) = 11.09, p < .001, d = 1.11, respectively. Black men and Asian men were characterized by HM traits to a similar extent, t(98) = 1.32, p = 1.000, d = 0.13.
By contrast, Black men were attributed fewer GM traits than men overall, t(98) = 7.14, p < .001, d = 0.71, White men, t(98) = 9.58, p < .001, d = 0.96, and Asian men, t(98) = 9.15, p < .001, d = 0.34. White men and Asian men were equally characterized by GM traits, t(98) = 1.04, p = 1.000, d = 0.11, and more than men as a whole, t(98) = 5.81, p < .001, d = 0.93, t(98) = 3.46, p = .023, d = 0.57, respectively.
All racial categories were stereotyped more on heterosexual traits than gay traits. The sexual orientation stereotyping of White men was marked by an enhancement of heterosexual traits, while that of Black men by a pronounced lack of gay traits. Men and White men were particularly conflated in terms of heterosexual but not of gay traits.
Race Stereotyping of Sexual Orientation Categories
We assessed the extent to which WM, BM, and AM traits characterized each sexual orientation category and the general category (see note 5). After assessing their reliability (Appendix B), participants’ ratings on WM, BM, and AM traits were averaged separately for the general category and each sexual orientation category. Averaged ratings were subjected to an ANOVA 3(category: men, heterosexual men, gay men) × 3(traits: WM, BM, AM), with both variables as within-participants factors.
The category by traits interaction was significant, F(4, 404) = 194.40, p < .001, η2 = .21 (Figure 4). Men were characterized more strongly by WM traits than both BM, t(101) = 20.20, p < .001, d = 2.03, and AM traits, t(101) = 19.18, p < .001, d = 1.92. Also, men were equally characterized by BM and AM traits, t(101) = 1.70, p = 1.000, d = 0.17. Similarly, heterosexual men were characterized more strongly by WM traits than by both BM, t(101) = 18.20, p < .001, d = 1.84, and AM traits, t(101) = 17.86, p < .001, d = 1.80, which did not significantly differ from each other, t(101) = 1.77, p = 1.000, d = 0.18. By contrast, gay men were characterized more strongly by AM traits than by both WM, t(101) = 9.86, p < .001, d = 0.99, and BM traits, t(101) = 9.91, p < .001, d = 1.00. Gay men were equally characterized by WM and BM traits, t(101) = 2.31, p = .819, d = 0.23.
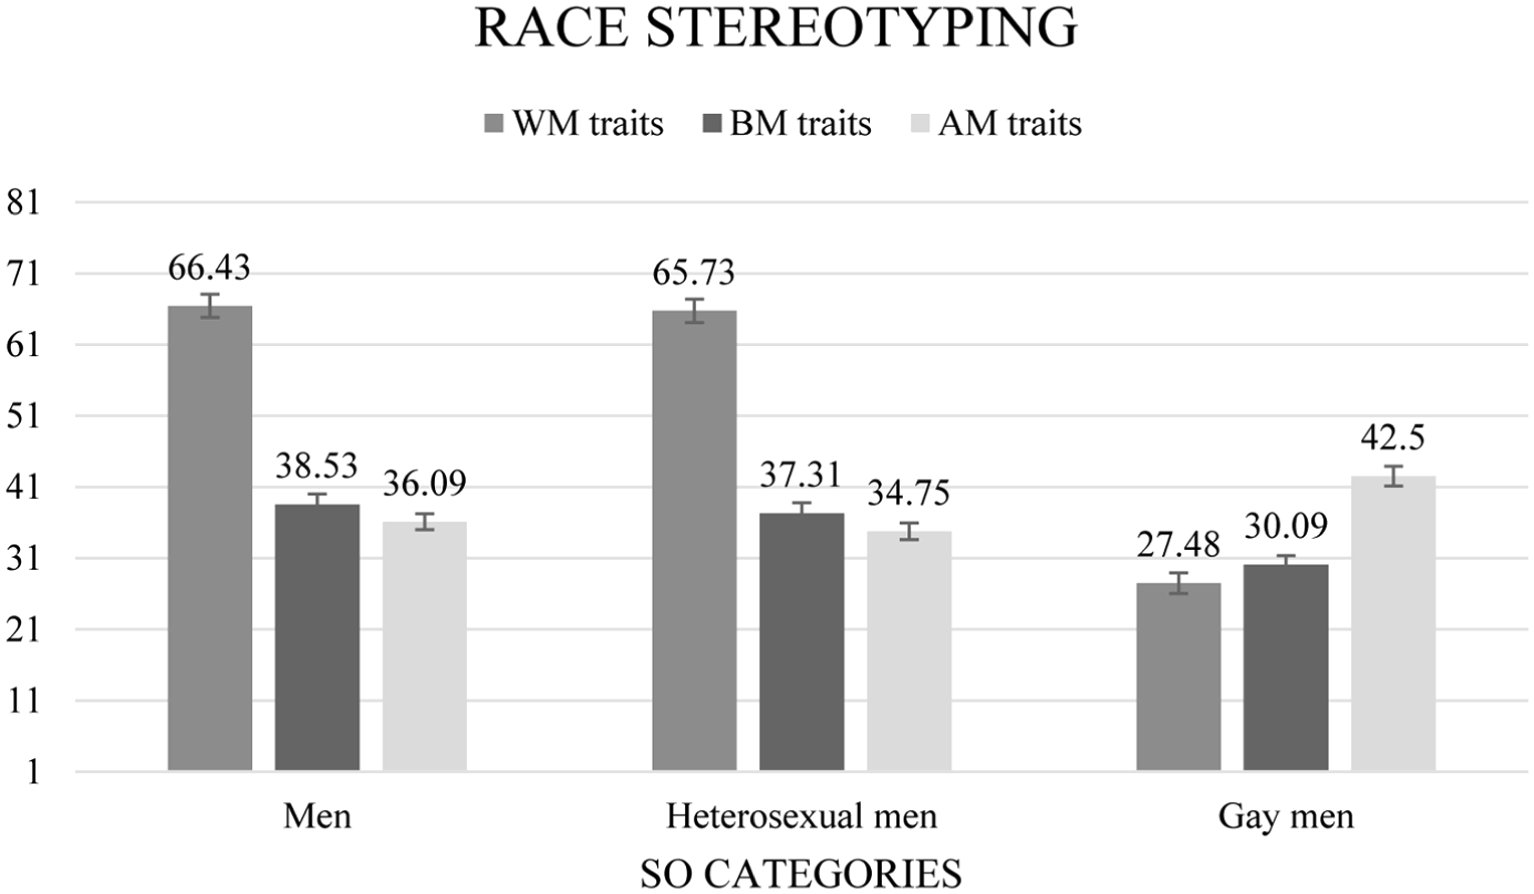
Participants’ average ratings of traits most distinctive of White, Black, and Asian men by category (i.e., men, heterosexual men, and gay men) in Study 2.
Men and heterosexual men were similarly characterized by WM traits, t(101) = 0.60, p = 1.000, d = 0.06, and to a greater extent than gay men, t(101) = 16.98, p < .001, d = 1.70 and t(101) = 16.57, p < .001, d = 1.66, respectively. Also, men and heterosexual men were similarly characterized by BM traits, t(101) = 1.18, p = 1.000, d = 0.12, and both to a greater extent than gay men, t(101) = 5.87, p < .001, d = 0.59 and t(101) = 5.07, p < .001, d = 0.51, respectively. Finally, men and heterosexual men were similarly characterized by AM traits, t(101) = 1.61, p = 1.000, d = 0.16, but to a lesser extent than gay men, t(101) = 5.10, p < .001, d = 0.51 and t(101) = 6.40, p < .001, d = 0.65, respectively.
Heterosexual men and men in general were similarly perceived as being exclusively White men, while the racial stereotyping of gay men was particularly pronounced in the attribution of Asian men traits. White and Black men traits were diluted in gay compared to heterosexual men, but gay men were stereotyped more than heterosexual men on Asian men traits.
Study 3
Participants
Participants (N = 200) were assigned to the sexual orientation condition (n = 99) and the race condition (n = 101). Demographics are reported in Table 1. The MDE with this sample size fell within the medium effect range.
Procedure
The procedures and material were the same as those used in Study 1, unless otherwise specified. Participants were given two tasks (i.e., T1 and T2), one after the other. In T1, participants were informed they would be presented with 116 traits listed in random order and had to select the traits that reflected how society perceives and represents each category. Specifically, they read: “You may select as many traits as you wish, but we ask that you choose at least 10.” After completing this task, in T2 they were then presented with the traits they had selected in T1 and instructed to narrow these traits down to seven. 6 If participants had selected seven or fewer traits in T1, they had to reconfirm those selections in this phase.
Results
Study 3a
Stereotypes about Sexual Orientation and Race Categories
We retained the seven traits most frequently selected in T2 for each sexual orientation and race category (Tables 2 and 3).
By using the typicality ratings of each trait with respect to heterosexual and gay men in Study 1, we computed how stereotypically heterosexual (i.e., HM) and how stereotypically gay (i.e., GM) each participant’s selected traits were on average for each sexual orientation category. Analyses confirmed that traits selected for heterosexual men, compared to those for gay men, were more HM stereotypical and less GM stereotypical (Figure S9 in the supplemental material). Following the same logic, we computed how stereotypically White (i.e., WM), Black (i.e., BM), and Asian (i.e., AM) each participant’s selected traits were on average for each race category. Analyses confirmed that traits selected for White men, compared to those for the other race categories, were more WM stereotypical. Traits selected for Black men, compared to those for the other race categories, were more BM stereotypical. Traits selected for Asian men, compared to those for the other race categories, were more AM stereotypical (Figure S10 in the supplemental material). Traits selected by participants were then used in the stereotyping analyses.
Sexual Orientation Stereotyping of Race Categories
Using the typicality ratings of each trait with respect to heterosexual and gay men in Study 1, we computed how stereotypically heterosexual (i.e., HM) and how stereotypically gay (i.e., GM) each participant’s selected traits were on average for each race category. Averaged ratings were analyzed by means of ANOVA 3(category: White men, Black men, Asian men) × 2(stereotypicality: HM, GM), with both variables as within-participants factors.
The category by stereotypicality interaction was significant, F(2, 198) = 63.92, p < .001, η2 = .08 (Figure 5). Selected traits for White, Black, and Asian men were more HM than GM stereotypical, t(99) = 19.09, p < .001, d = 1.91; t(99) = 21.09, p < .001, d = 2.07; t(99) = 9.49, p < .001, d = 0.94, respectively. Selected traits for White men were more HM stereotypical than those selected for both Black, t(99) = 11.14, p < .001, d = 1.20, and Asian men, t(99) = 13.03, p < .001, d = 1.22, which did not differ from each other, t(99) = 2.77, p = .101, d = 0.28.
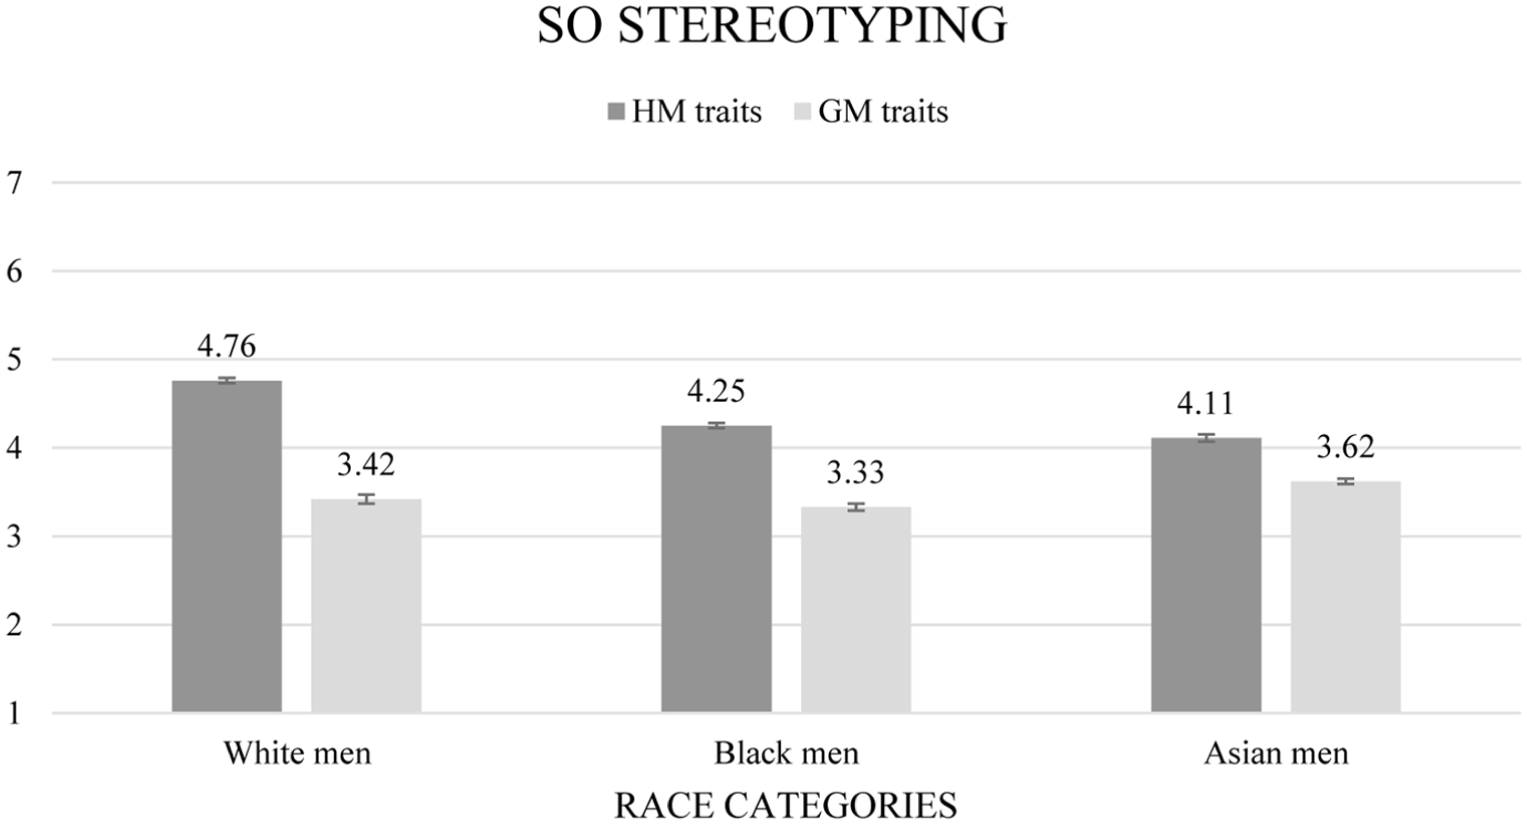
Participants’ average stereotypicality ratings of selected traits of heterosexual and gay men by race category (i.e., White men, Black men, and Asian men) in Study 3a.
Additionally, selected traits for White and Black men were equally GM stereotypical, t(99) = 1.56, p = 1.000, d = 0.14, while those for Asian men were more GM stereotypical than those for White, t(99) = 3.45, p = .012, d = 0.36, and Black men t(99) = 6.41, p < .001, d = 0.62, respectively.
All racial categories were stereotyped more as heterosexual than gay men. White men were particularly stereotyped as heterosexual men, whereas both White and Black men were attributed fewer gay male stereotypes than Asian men.
Race Stereotyping of Sexual Orientation Categories
Using the typicality ratings of each trait with respect to White, Black, and Asian men in Study 1, we computed how stereotypically White (i.e., WM), Black (i.e., BM), and Asian (i.e., AM) each participant’s selected traits were on average for each sexual orientation category in Study 3. Averaged ratings were analyzed by means of ANOVA 2(category: heterosexual men, gay men) × 3(stereotypicality: WM, BM, AM), with both variables as within-participants factors.
The category by stereotypicality interaction was significant, F(2, 196) = 56.49, p < .001, η2 = .07 (Figure 6). Selected traits for heterosexual men were more WM stereotypical than both BM, t(98) = 19.13, p < .001, d = 1.88, and AM stereotypical, t(98) = 18.95, p < .001, d = 1.94. Also, selected traits for heterosexual men were more BM than AM stereotypical, t(98) = 3.70, p = .005, d = 0.38. Selected traits for gay men were more WM stereotypical than both BM, t(98) = 21.78, p < .001, d = 2.31, and AM stereotypical, t(98) = 8.75, p < .001, d = 0.93. Moreover, selected traits for gay men were less BM than AM stereotypical, t(98) = 5.92, p < .001, d = 0.59.
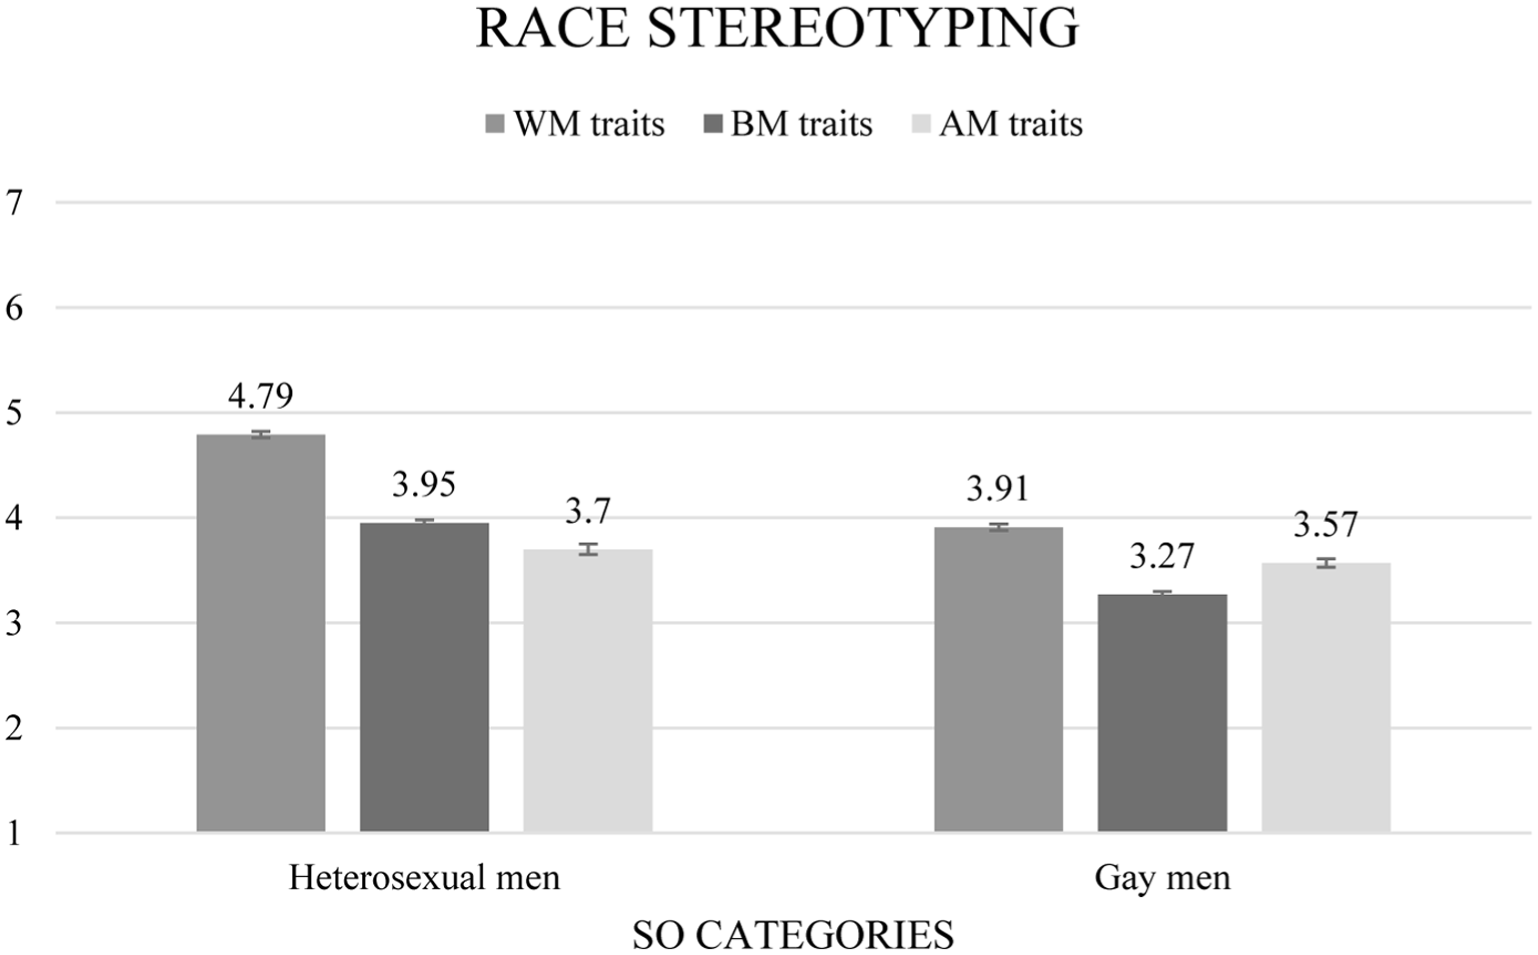
Participants’ average stereotypicality ratings of traits selected as distinctive of White, Black, and Asian men by sexual orientation category (i.e., heterosexual men and gay men) in Study 3a.
Additionally, compared to selected traits for gay men, those for heterosexual men were more WM, t(98) = 18.11, p < .001, d = 1.90, and BM stereotypical, t(98) = 14.97, p < .001, d = 1.48, but similarly AM stereotypical, t(98) = 1.86, p = .999, d = 0.19.
Both heterosexual and gay men were primarily associated with White men, although this association was more pronounced among heterosexual than gay men. Heterosexual men were next more strongly associated with Black than with Asian men, whereas gay men displayed the opposite pattern. Heterosexual men more than gay men were strongly stereotyped as Black men, while both categories were similarly stereotyped as Asian men.
Study 3b
Stereotypes about Sexual Orientation and Race Categories
We followed the same scoring procedure as in Study 3a, but this time using the distinctiveness ratings from Study 2. Traits selected for heterosexual men, compared to those for gay men, were more distinctive of heterosexual men (i.e., HM distinctive) and less distinctive of gay men (i.e., GM distinctive; Figure S11 in the supplemental material). Also, traits selected for a race category were more distinctive of that race category compared to the others, namely White (i.e., WM distinctive), Black (i.e., BM distinctive), and Asian men (i.e., AM distinctive; Figure S12 in the supplemental material). The traits selected by participants were then used in the stereotyping analyses.
Sexual Orientation Stereotyping of Race Categories
Using the distinctiveness ratings of Study 2, we computed how distinctive of heterosexual men (i.e., HM distinctive) and of gay men (i.e., GM distinctive) each participant’s selected traits were on average for each race category. Averaged ratings were analyzed by means of ANOVA 3(category: White men, Black men, Asian men) × 2(distinctiveness: HM, GM), with both variables as within-participants factors.
The category by distinctiveness interaction was significant, F(2, 198) = 61.68, p < .001, η2 = .08 (Figure 7). Traits selected for White, Black, and Asian men were more distinctive of HM than GM, t(99) = 17.26, p < .001, d = 1.73; t(99) = 19.17, p < .001, d = 1.92; t(99) = 9.00, p < .001, d = 0.90, respectively.
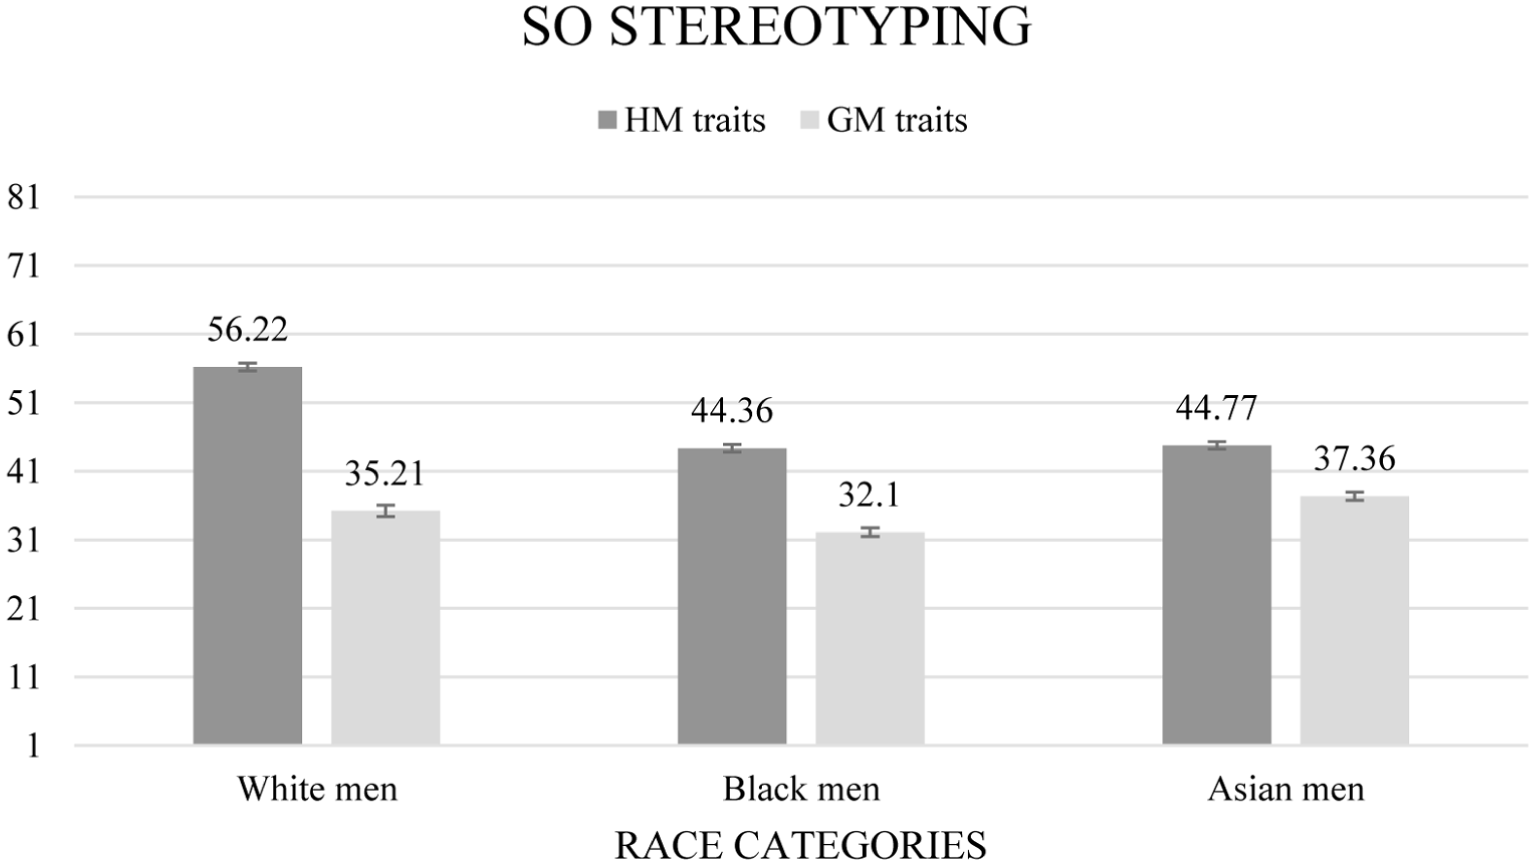
Participants’ average distinctiveness ratings on heterosexual and gay men selected traits by race category (i.e., White men, Black men, and Asian men) in Study 3b.
Moreover, traits selected for White men were more distinctive of HM than those selected for Black men, t(99) = 14.97, p < .001, d = 1.49, and for Asian men, t(99) = 13.94, p < .001, d = 1.39, which were similarly distinctive of HM, t(99) = 0.53, p = 1.000, d = 0.05. Traits selected for Black men were less distinctive of GM than those selected for Asian men, t(99) = 6.62, p < .001, d = 0.66, but were similarly distinctive of GM as those selected for White men, t(99) = 2.90, p = .069, d = 0.29. Selected traits for Asian and White men were distinctive of GM to a similar extent, t(99) = 2.13, p = .532, d = 0.21.
All racial categories were stereotyped more as heterosexual than as gay men. White men were particularly stereotyped as heterosexual men. Black men were stereotyped as gay less strongly than Asian men, while White men were perceived at an intermediate level.
Race Stereotyping of Sexual Orientation Categories
Using the distinctiveness ratings with respect to White, Black, and Asian men in Study 2, we computed how distinctive of White (i.e., WM distinctive), Black (i.e., BM distinctive), and Asian men (i.e., AM distinctive) each participant’s selected traits were on average for each sexual orientation category in Study 3. Averaged ratings were analyzed by means of ANOVA 2(category: heterosexual men, gay men) × 3(distinctiveness: WM, BM, AM), with both variables as within-participants factors.
The category by distinctiveness interaction was significant, F(2, 196) = 65.25, p < .001, η2 = .08 (Figure 8). Traits selected for heterosexual men were more distinctive of WM (M = 57.78, SE = 0.56) than both BM (M = 43.78, SE = 0.51), t(98) = 17.81, p < .001, d = 1.79, and AM (M = 39.98, SE = 0.85), t(98) = 17.92, p < .001, d = 1.79. Also, traits selected for heterosexual men were more distinctive of BM than AM, t(98) = 3.39, p = .015, d = 0.34.
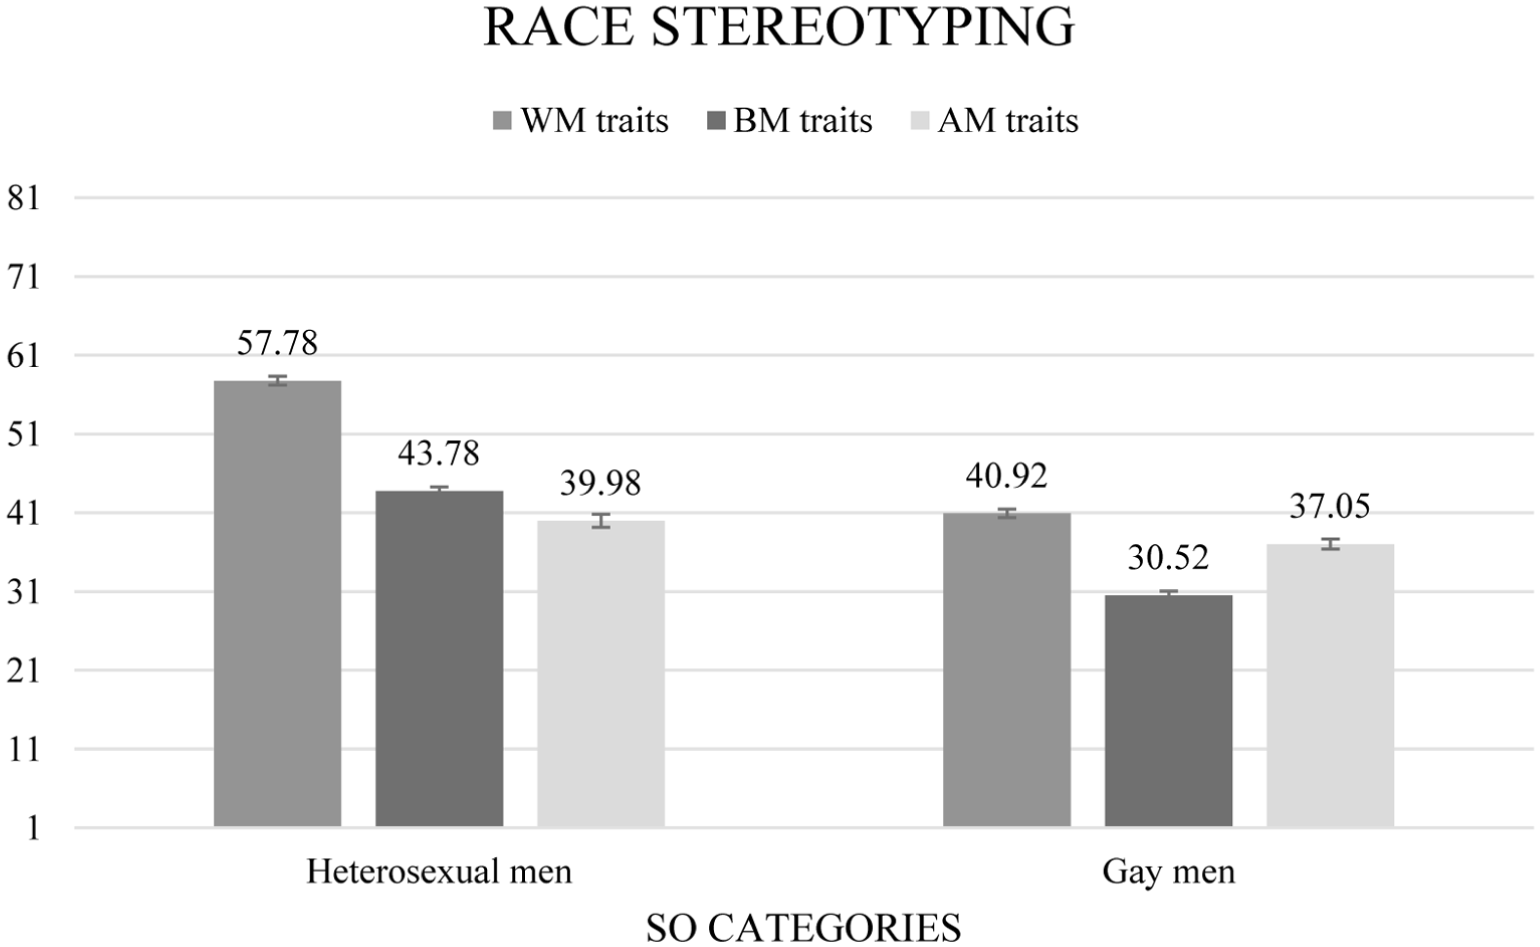
Participants’ average distinctiveness ratings of traits selected as distinctive of White, Black, and Asian men by sexual orientation category (i.e., heterosexual men and gay men) in Study 3b.
Traits selected for gay men were more distinctive of WM (M = 40.92, SE = 0.55) than both BM (M = 30.52, SE = 0.53), t(98) = 18.17, p < .001, d = 1.83, and AM (M = 37.05, SE = 0.64), t(98) = 6.52, p < .001, d = 0.65. Moreover, selected traits for gay men were less distinctive of BM than AM, t(98) = 7.53, p < .001, d = 0.76.
Also, compared to the traits selected for gay men, those for heterosexual men were more distinctive of WM, t(98) = 19.45, p < .001, d = 1.95, and BM, t(98) = 16.73, p < .001, d = 1.69. Selected traits for gay men and heterosexual men were distinctive of AM to a similar extent, t(98) = 2.61, p = .157, d = 0.26.
This pattern of results replicated that of Study 3a.
Discussion of Studies 1–3 and Small-Scale Meta-Analyses
Results are summarized in Table 4. We conducted internal meta-analyses with fixed-effects models (Goh et al., 2016) to resolve inconsistencies and obtain more precise effect estimates (Table 5; for random-effects model analyses, see supplemental material).
Summary of the Outcomes of the Sexual Orientation Stereotyping (Upper Part) and Race Stereotyping Analyses (Lower Part), Studies 1, 2, 3a, and 3b.
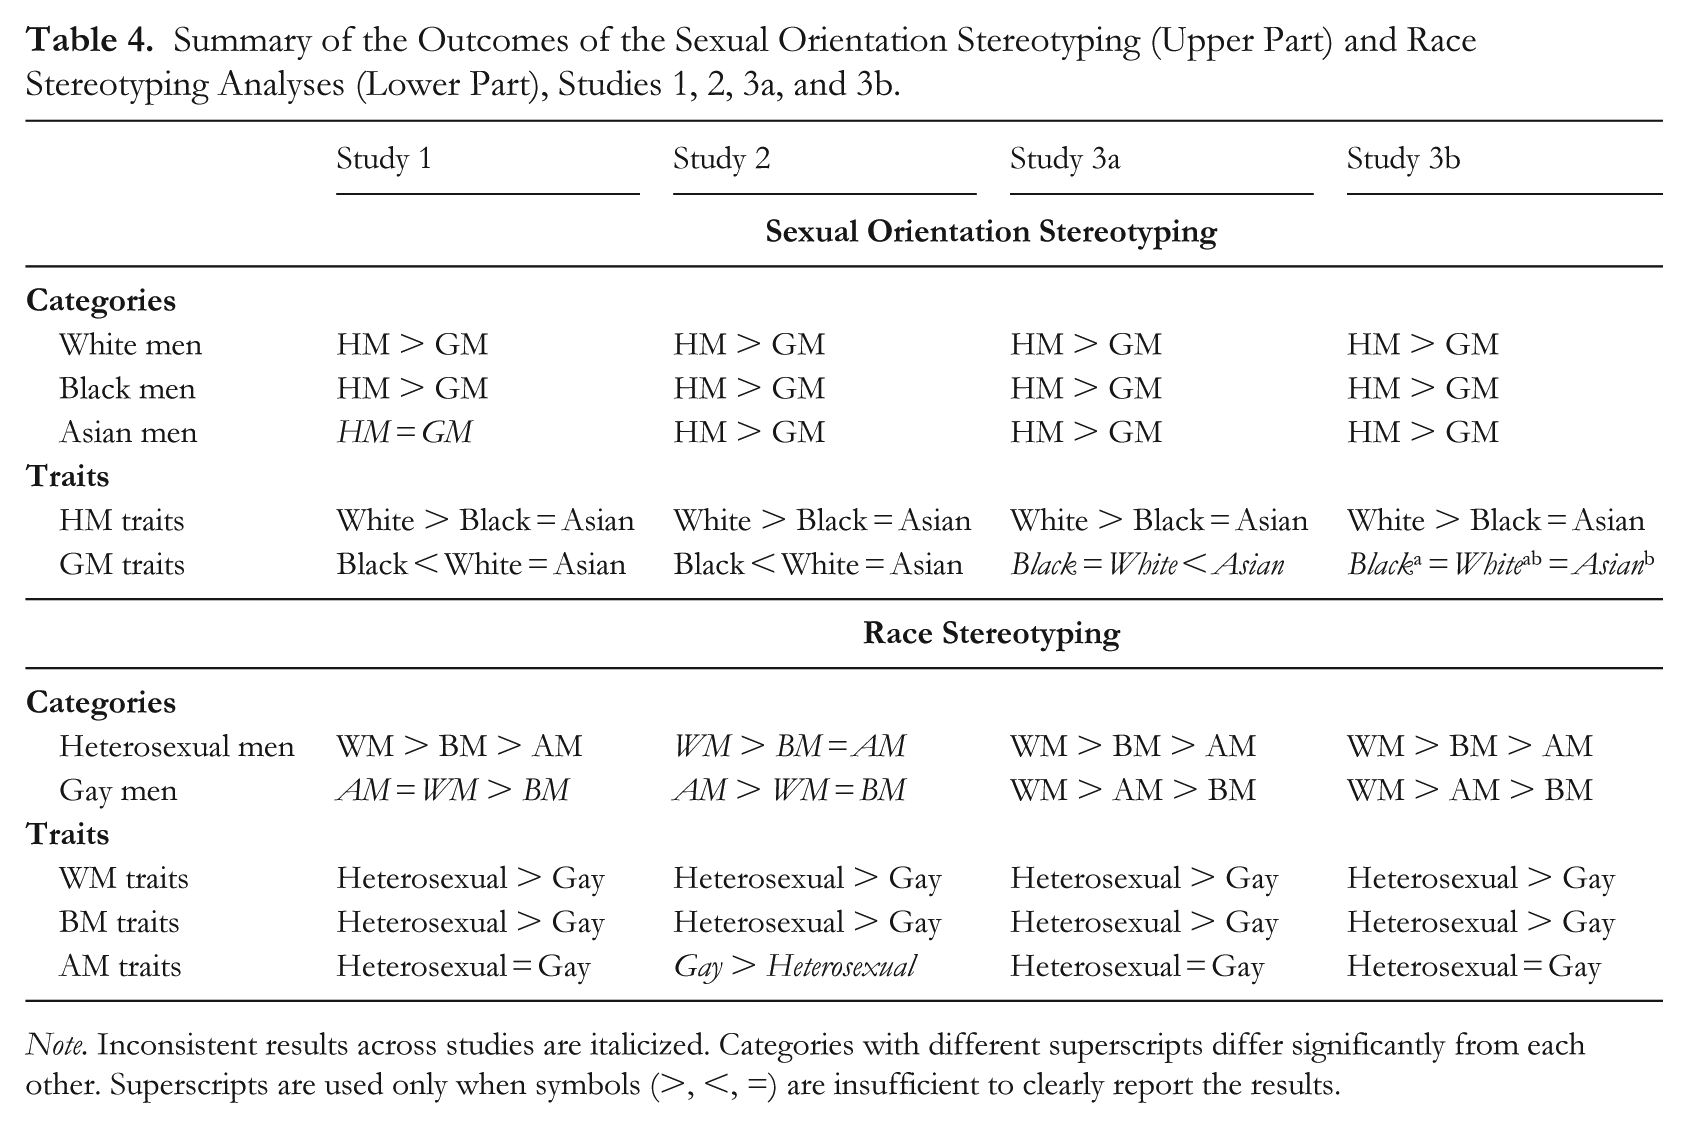
Note. Inconsistent results across studies are italicized. Categories with different superscripts differ significantly from each other. Superscripts are used only when symbols (>, <, =) are insufficient to clearly report the results.
Results of the Internal Meta-Analyses.
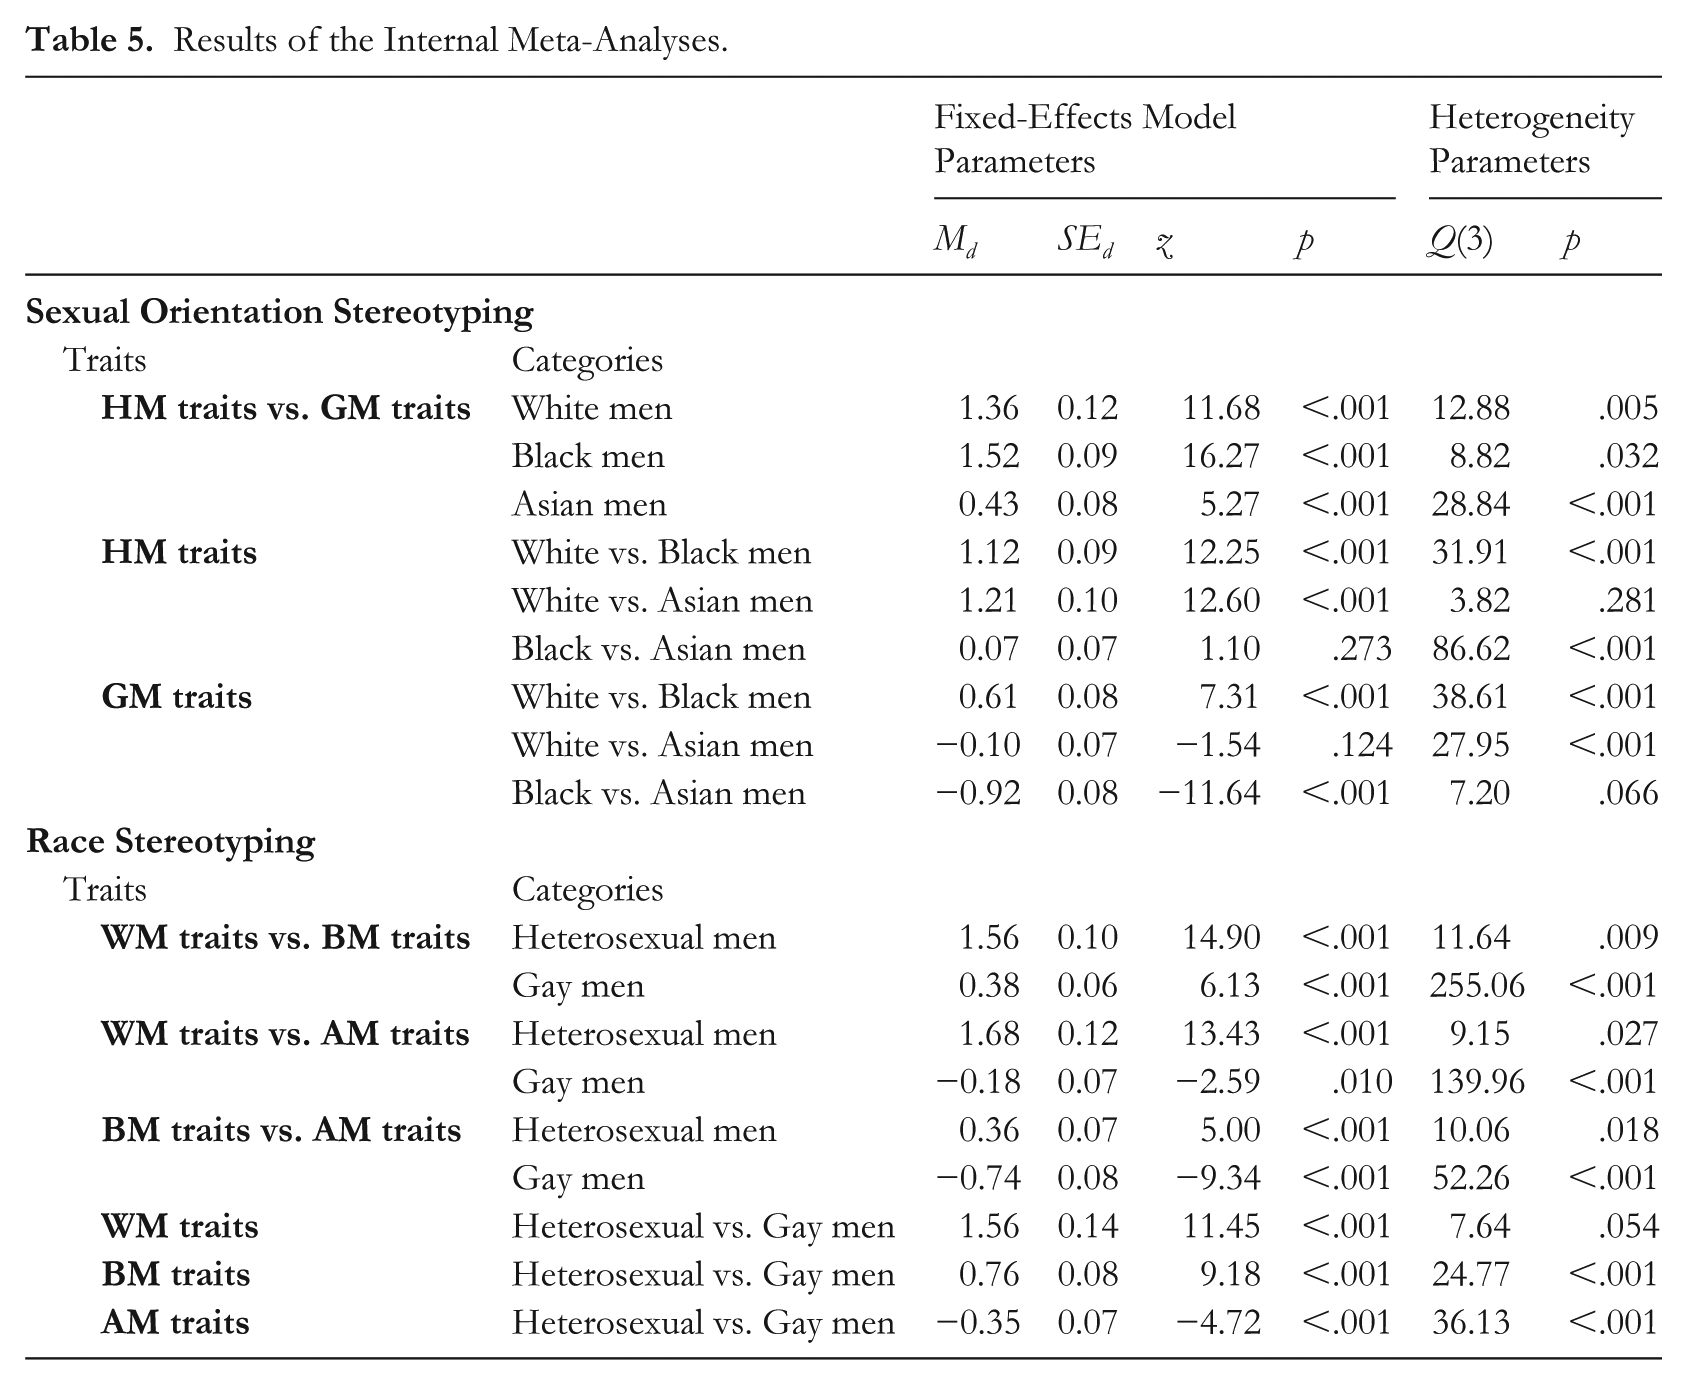
White and Black men were consistently stereotyped as more heterosexual than gay across all studies, whereas Asian men showed this pattern in Studies 2, 3a and 3b, but were equally stereotyped on heterosexual and gay traits in Study 1. Meta-analyses confirmed H1, with all race categories more strongly stereotyped as heterosexual than gay (Figure 9), showing large and similar effect size for White and Black men (ps < .001)—confirming H2a—and a small-to-medium effect size for Asian men (p < .001).
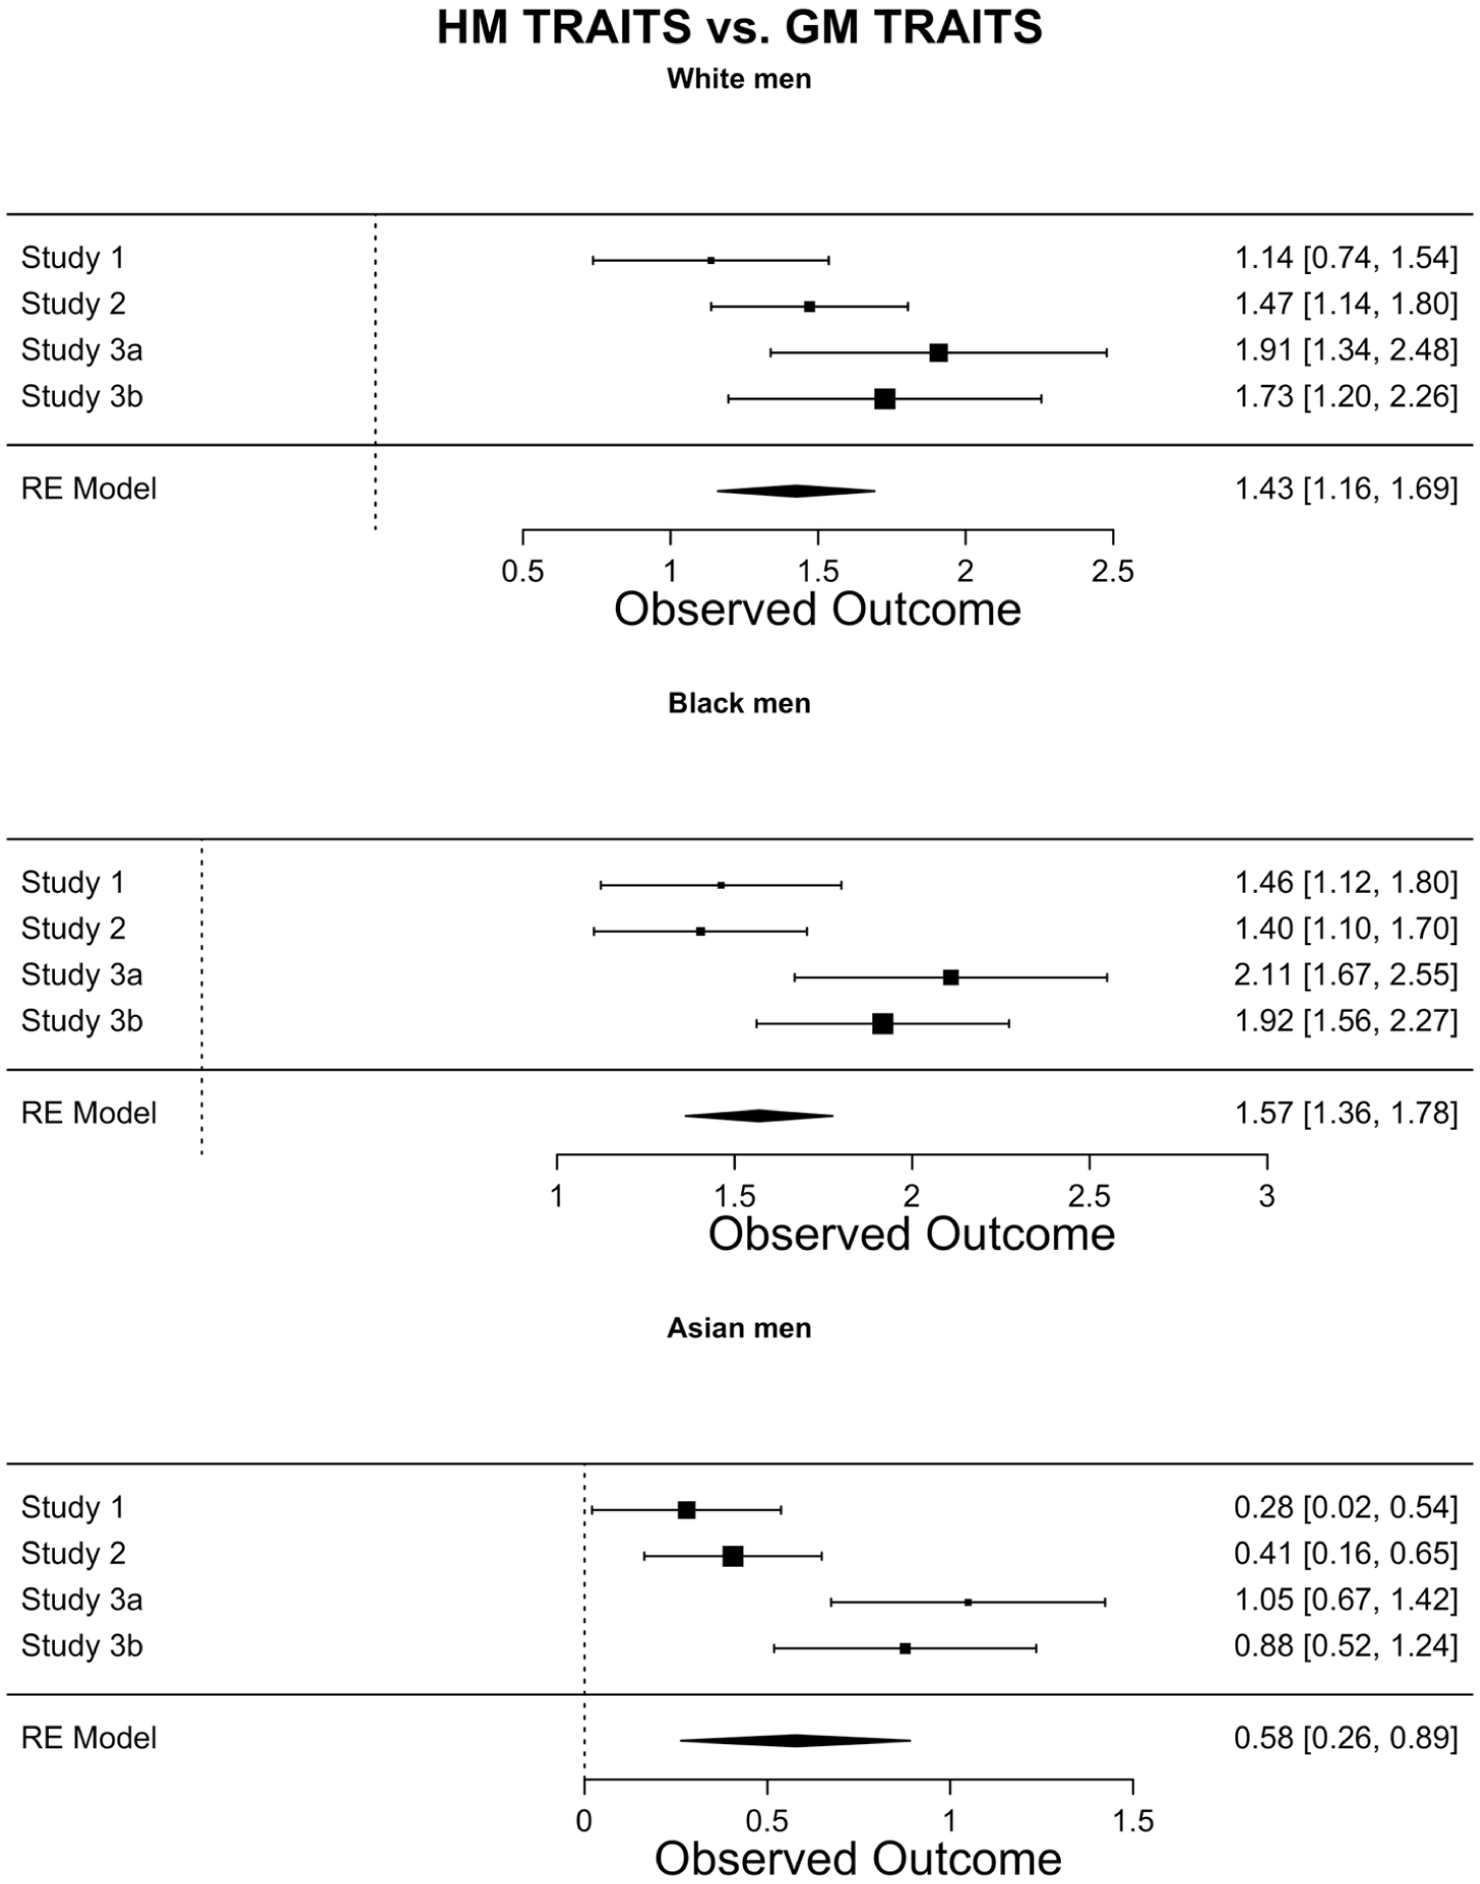
Results of the internal meta-analysis on the sexual orientation stereotyping of White, Black, and Asian men across Studies 1, 2, 3a, and 3b.
Across the studies, White men were more strongly stereotyped as heterosexual than Black and Asian men, who showed similar patterns. Meta-analyses confirmed H3 (Figure 10), with large effects for White men compared to both Black and Asian men (ps < .001), who did not differ from each other (negligible effect size; p = .273). Black men were consistently stereotyped as less gay than Asian men. They were also stereotyped as less gay than White men in Studies 1 and 2 but similarly in Studies 3a and 3b. White and Asian men showed similar patterns, except in Study 3a, where White men were stereotyped as less gay than Asian men. Meta-analyses confirmed H4 (Figure 11): Black men were stereotyped as less gay than Asian and White men, with a stronger effect for the former (ps < .001). White and Asian men showed similar patterns (p = .124).
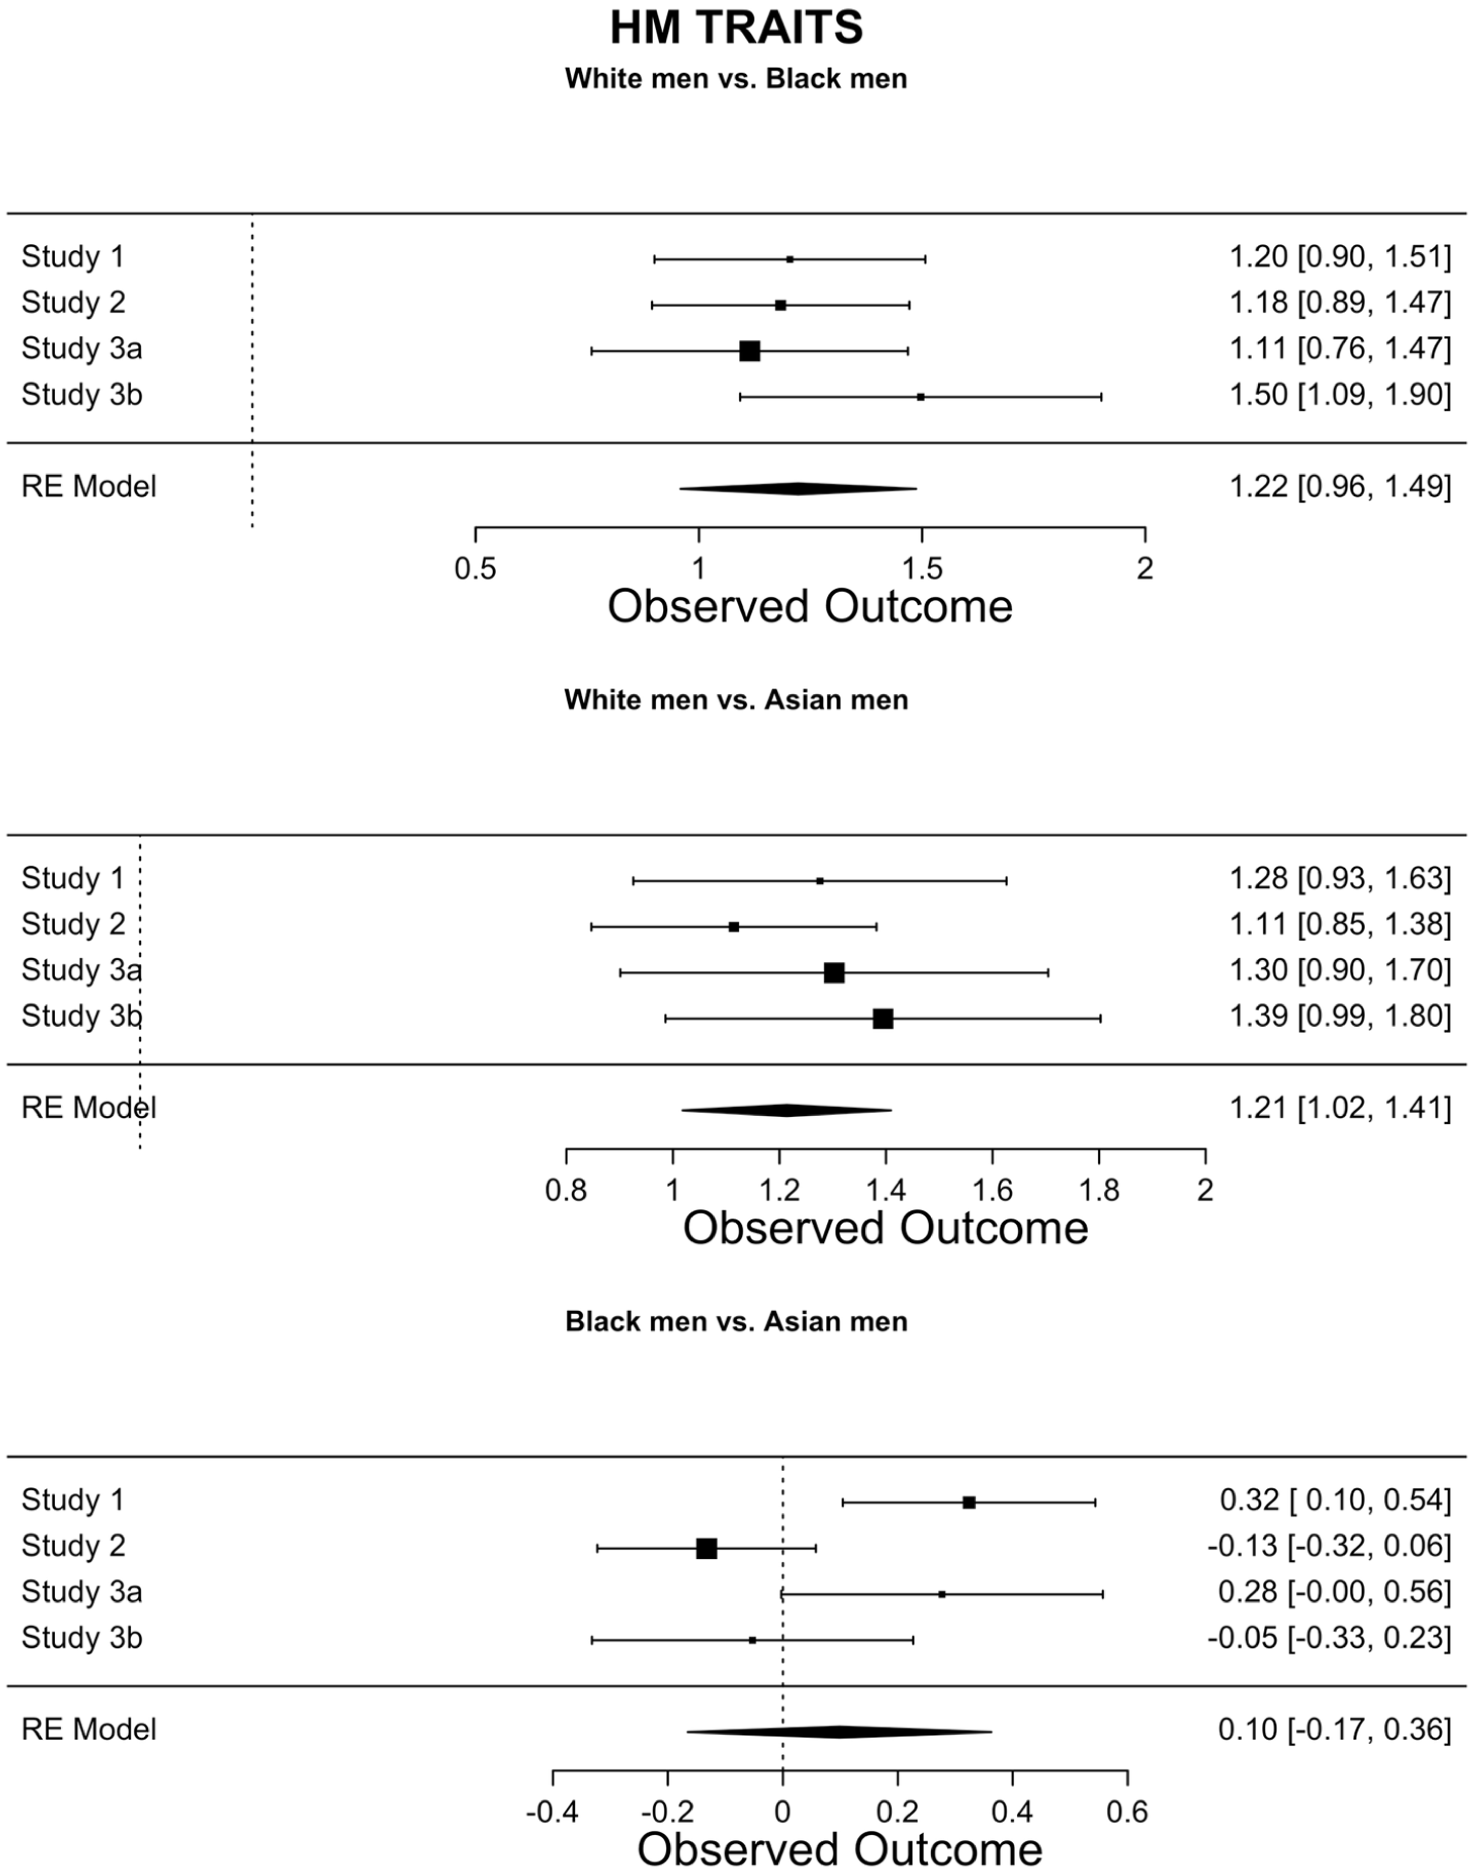
Results of the internal meta-analysis on the stereotyping of White, Black, and Asian men on heterosexual traits across Studies 1, 2, 3a, and 3b.
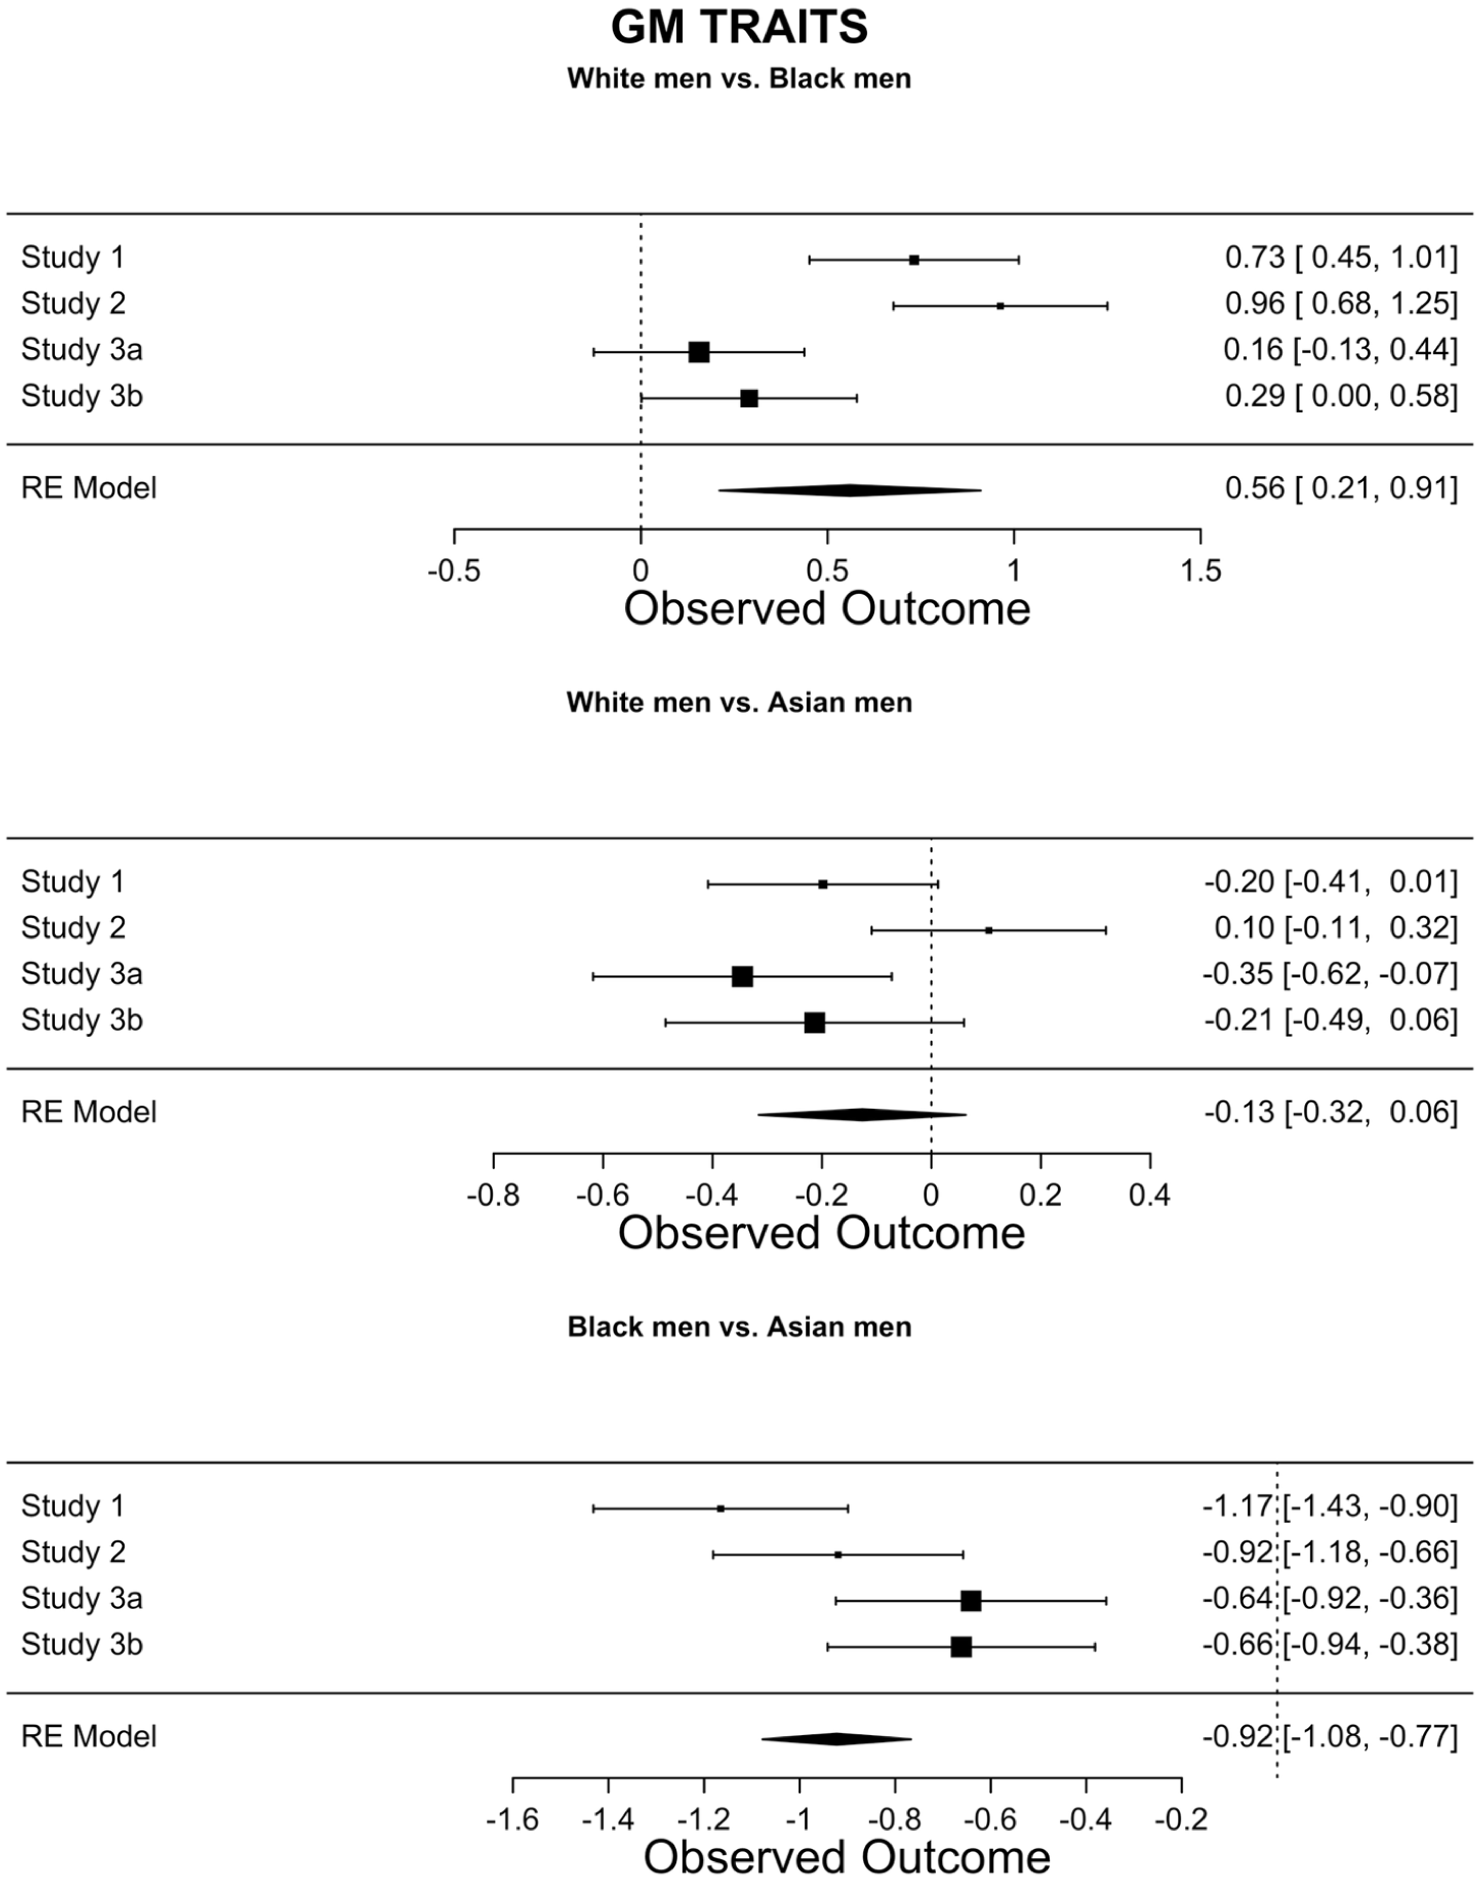
Results of the internal meta-analysis on the stereotyping of White, Black, and Asian men on gay traits across Studies 1, 2, 3a, and 3b.
Across the studies, heterosexual men were more stereotyped as White and Black than gay men, while they were similarly stereotyped as Asian in Studies 1, 3a, and 3b, but less so in Study 2.
Meta-analyses confirmed H5 (Figure 12), showing heterosexual men were stereotyped more as White men than gay men, with a large effect size (p < .001). Heterosexual men were stereotyped more as Black (medium-to-large effect) but less as Asian men (small-to-medium effect) than gay men (ps < .001), thus confirming H6b.
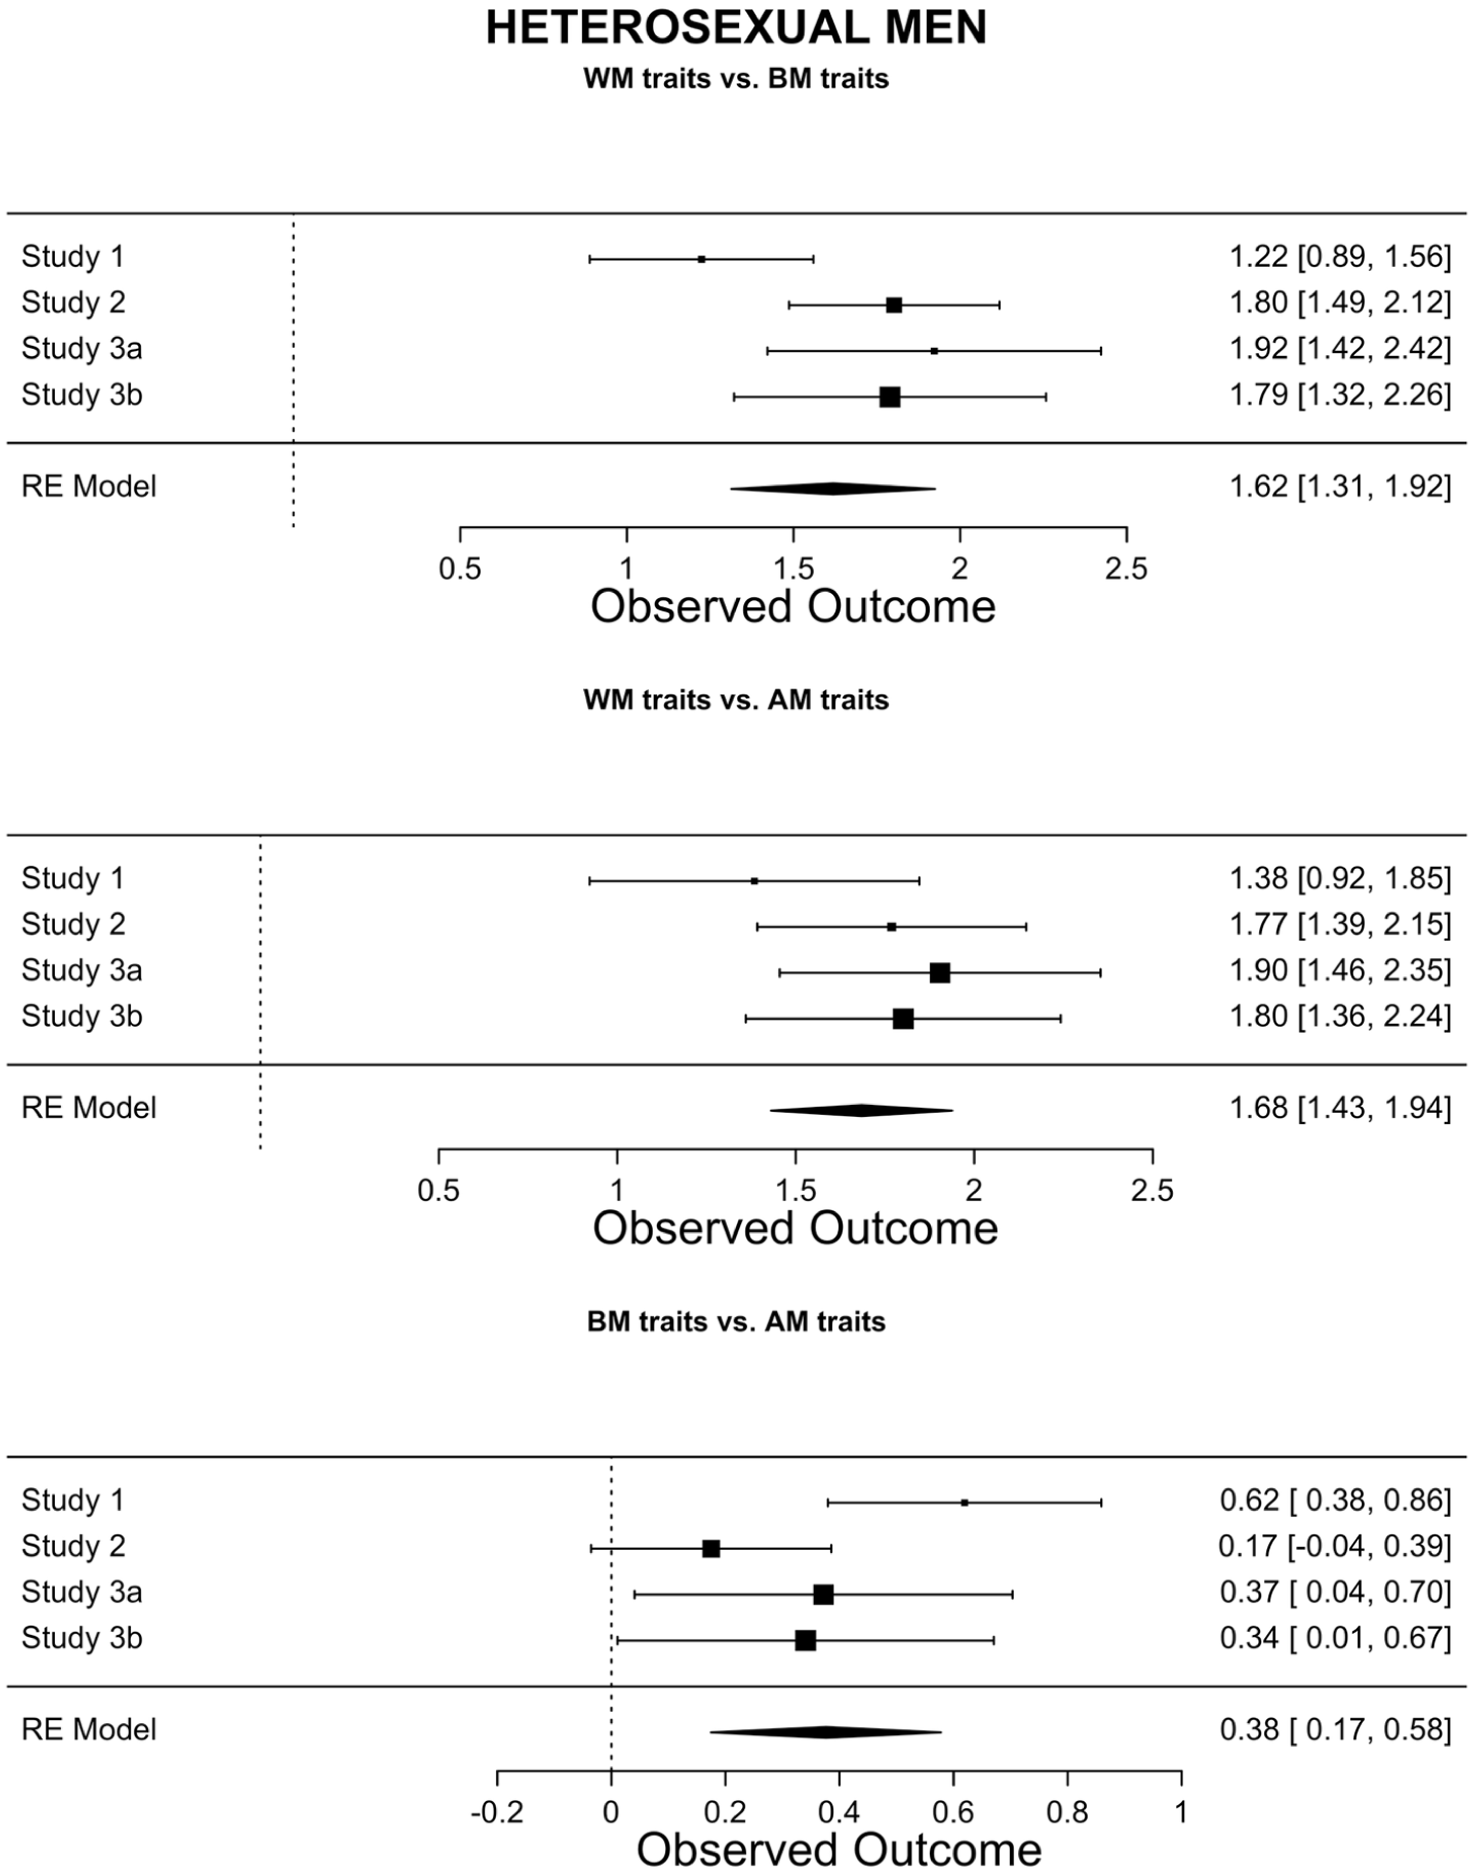
Results of the internal meta-analysis on stereotyping of heterosexual men on White, Black, and Asian traits across Studies 1, 2, 3a, and 3b.
Moreover, heterosexual men were consistently stereotyped more as White than as Black or Asian, with large effect sizes (ps < .001; Figure 13). In Studies 1, 3a, and 3b, they were stereotyped more as Black than Asian, but to similar extent in Study 2. Meta-analyses showed a small-to-medium effect size for the stereotyping of heterosexual men more as Black compared to Asian (p < .018). Gay men were consistently stereotyped as less Black than Asian across Studies 1, 3a and 3b, with a medium-to-large effect (p < .001). They were also stereotyped less as Black than White men in Studies 1, 3a, and 3b, but to a similar extent in Study 2. In Studies 3a and 3b, gay men were stereotyped more as White than Asian, while Study 2 showed the reverse, and Study 1 showed no difference. Meta-analyses indicated that gay men were stereotyped less as Black than White, with a small-to-medium effect size (p < .001), while the effect for White versus Asian fell under the small-size threshold, suggesting a negligible difference (p = .010; Figure 14).
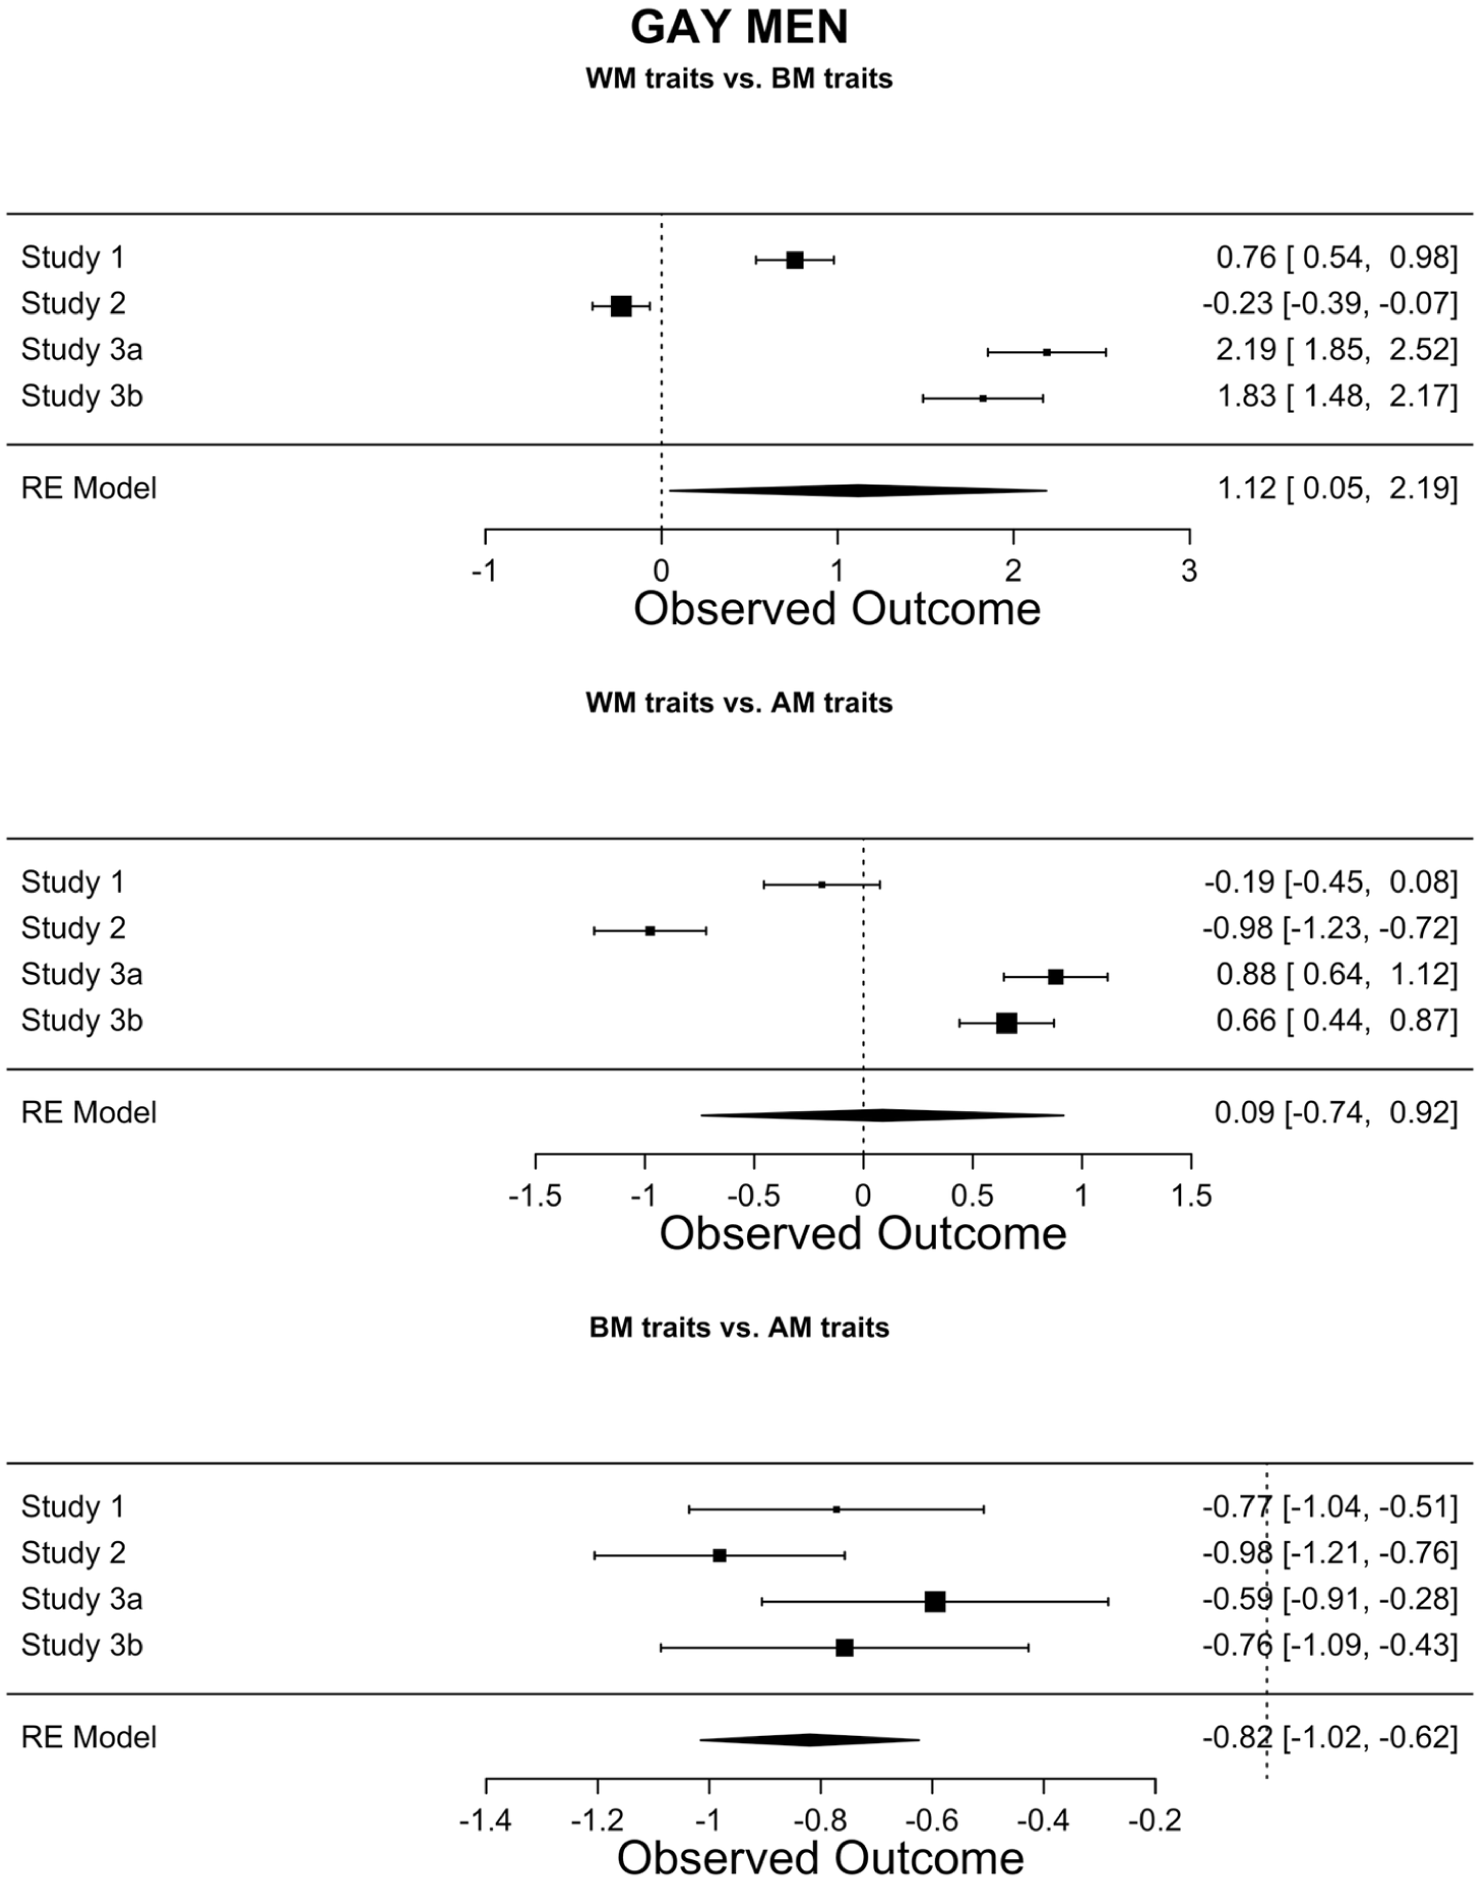
Results of the internal meta-analysis on stereotyping of gay men on White, Black, and Asian traits across Studies 1, 2, 3a, and 3b.
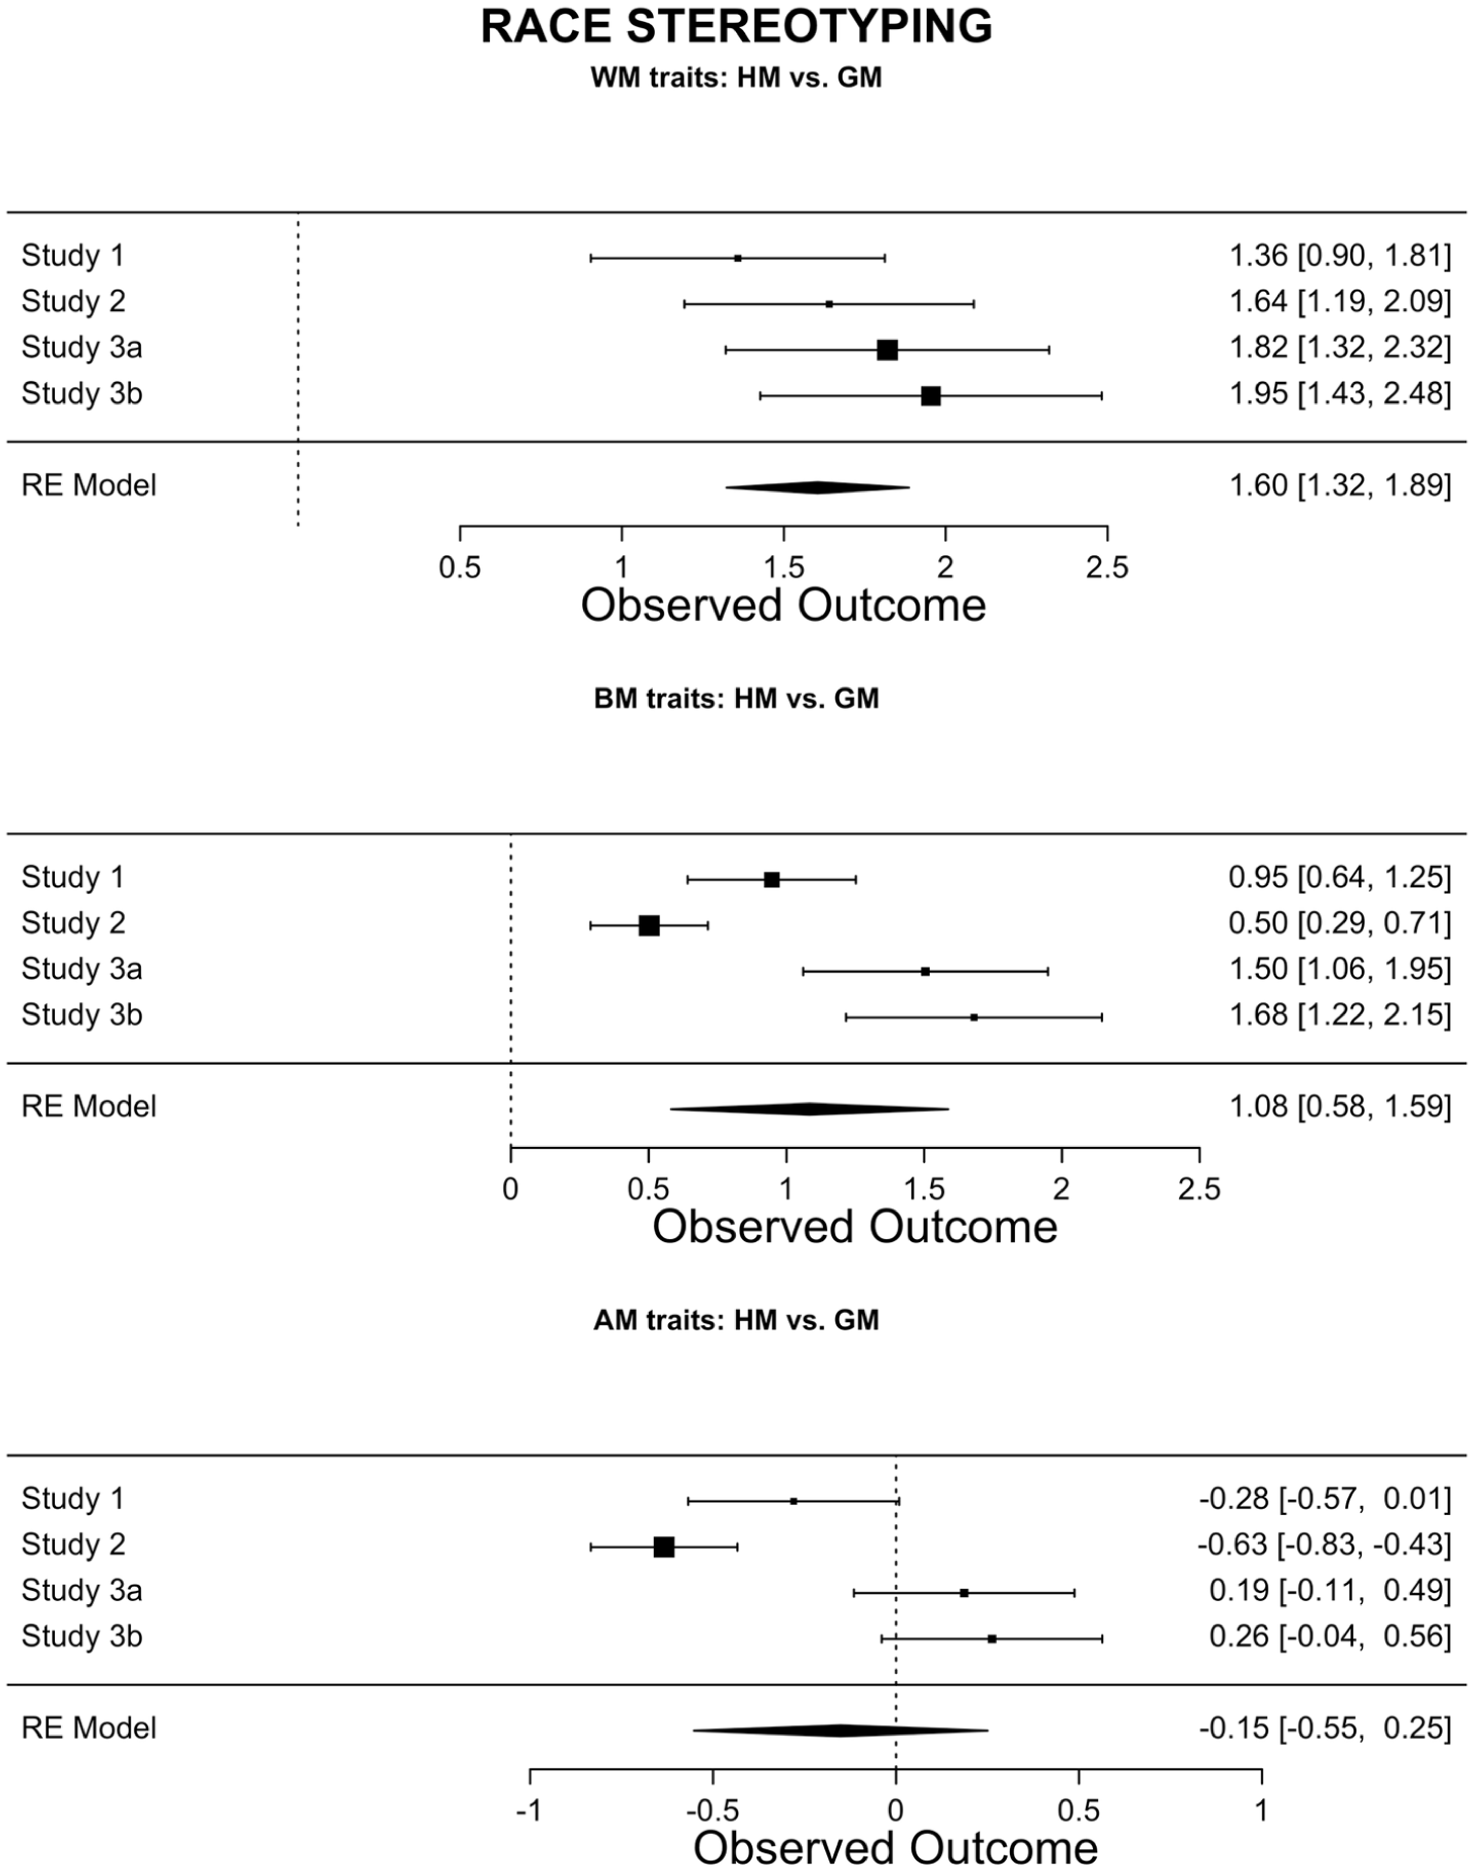
Results of the internal meta-analysis on the race stereotyping of heterosexual and gay men across Studies 1, 2, 3a, and 3b.
In Table 5 we reported heterogeneity across the studies (Q-test; Cochran, 1954). 7
General Discussion
This research examined how sexual orientation and race stereotypes referring to men intersect. Meta-analyses showed that all male race categories are more strongly stereotyped as heterosexual than gay. Unlike studies suggesting heightened heteronormativity in Black versus White men, our findings showed both categories exhibit comparable heteronormative patterns. Importantly, these findings advance the literature by demonstrating that such patterns arise from different processes: Alignment with heterosexual traits in White men and distancing from gay traits in Black men. The large overlap between traits associated with heterosexual and White men, together with the oppositional nature of stereotypes associated with Black and gay men, likely accounts for the observed pattern. Since the stereotypes of Asian men were neither strongly characterized by heterosexual traits, which are more prominent among White men, nor did they exhibit the reduced characterization of gay traits seen in Black men, their perceived heteronormativity is diminished.
The current studies also extend prior research on the conceptualization of sexual orientation categories among men, demonstrating that heterosexual and gay men are racially defaulted in different ways. Race stereotyping of heterosexual men has a race-graded structure, favoring White over Black and then Asian traits. In contrast, the race-graded structure of gay men appears to disfavor Black traits only, compared to White and Asian traits. Additionally, heterosexual men are more intensely linked to White and Black traits, but less strongly linked to Asian traits, than gay men.
Moreover, “men” are defaulted to both White and heterosexual, as shown in Study 2 and in line with previous studies (Hegarty, 2017; Herek, 2007). We further found that these category defaults are intertwined: White men are perceived as particularly heterosexual and heterosexual men are conceptualized as White, given the overlap between the stereotypes of White and heterosexual men (Tables S2–S3 in the supplemental material). Additionally, Black men are the least characterized by gay stereotypes, and gay men are less racialized with Black traits. This aligns with studies suggesting that stereotypes of Black men often conflict with those of gay men (Calabrese et al., 2018; Preddie & Biernat, 2021), and that Black male faces are processed with a strong heterosexual bias (Johnson and Ghavami, 2011). Stereotypical traits of Asian men are less associated with heterosexuality. This sexual orientation framing may complicate the conceptualization of Asian men as heterosexual, though it does not entirely negate it—a result that aligns with a less pronounced heterosexual response bias for faces of Asian than of both White and Black men (Johnson & Ghavami, 2011).
For the first time, we used a multi-method assessment of both stereotypes and stereotyping. The stereotypical traits assigned to these categories referring to men depended on the specific methods used, with traits identified as stereotypical across methods varying between 4% and 15.38%. While this variability may reflect the multidimensional nature of these traits—differing in associative strength, group distinctiveness, and consensus—it also highlights a key limitation of studies using predefined stereotype lists. The analysis of stereotyping highlights a non-negligible variability among findings. This underscores the need to routinely employ diverse stereotyping assessment methods in intersectional research and to integrate multi-method findings through small-scale meta-analyses, thereby strengthening support for theoretical inferences.
Our research has several limitations. First, our sample primarily consisted of White and heterosexual participants, limiting the generalizability of our findings. A more diverse sample in terms of race and sexual orientation would help determine if the observed effects depend on inter-group processes, as White heterosexual participants may project their sexuality onto the representation of White men (Bianchi et al., 2010). Additionally, the need for a racially diverse sample is supported by findings suggesting that effects related to the gendered nature of race categories are less pronounced in participants with subordinate gender and race memberships (Axt et al., 2023). Similarly, our findings on the sexual orientation stereotyping of male race categories may be influenced by participants’ race and sexual orientation. Our studies relied on online sampling, which was not probability-based. Consequently, our sample may differ from the broader Italian population on key demographic variables, limiting generalizability. For example, the median age of our participants was lower than that of the general population (Median = 48.7 years; Istat, 2025). As younger people typically express more positive and less extreme stereotypes toward gay individuals (Lingiardi et al., 2016), future research should examine the intersectional stereotypes under investigation in a more age-diverse and nationally representative sample.
Second, our results are culturally specific, as the study was run in a country with lower racial diversity compared to, for example, North America (e.g., European Union, 2021; United State Census Bureau, 2021), and reduced visibility of sexual minorities (GLAAD, 2023; ILGA-Europe, 2023).
Third, participants evaluated numerous traits for multiple targets, which may have contributed to cognitive fatigue. This issue is particularly relevant in Study 2, where fewer traits are recommended (McCauley & Thangavelu, 1991), and less so in Study 3, where the number of traits aligns with prior Princeton Trilogy studies. Although we attempted to reduce the effects of cognitive fatigue on measurement reliability through trait randomization, future work could replicate our findings by focusing solely on traits identified as stereotypical (Tables 2 and 3).
Fourth, the scope of our analyses was limited to race and sexual orientation categories among men, thus preventing the generalizability of these findings to analogous intersections involving women. Future studies should therefore test whether (or not) the observed patterns of sexual orientation stereotyping of race categories and race stereotyping of sexual orientation categories are replicated across both binary gender groups.
This research has significant social implications. Foregrounding Black men with a lack of gay traits may contribute to the cognitive “invisibility” of Black gay men (Coladonato et al., 2026), as highlighted by campaigns like #MoreColorMorePride. Asian heterosexual men may experience stress from mitigated heteronormative assumptions, prompting compensatory behaviors to assert their sexuality and identity (Liu & Wong, 2018). Our findings call for an intersectional approach to revising stereotypes, promoting visibility for sexual diversity within racial groups, and vice versa.
Supplemental Material
sj-docx-1-gpi-10.1177_13684302261460832 – Supplemental material for Sexual Orientation Stereotyping of Race Categories Referring to Men, and Vice Versa
Supplemental material, sj-docx-1-gpi-10.1177_13684302261460832 for Sexual Orientation Stereotyping of Race Categories Referring to Men, and Vice Versa by Rosandra Coladonato, Federico D’Atri, Francesca Trevisan, Patrice Rusconi, Mauro Bianchi, Valentina Piccoli and Andrea Carnaghi in Group Processes & Intergroup Relations
Supplemental Material
sj-docx-2-gpi-10.1177_13684302261460832 – Supplemental material for Sexual Orientation Stereotyping of Race Categories Referring to Men, and Vice Versa
Supplemental material, sj-docx-2-gpi-10.1177_13684302261460832 for Sexual Orientation Stereotyping of Race Categories Referring to Men, and Vice Versa by Rosandra Coladonato, Federico D’Atri, Francesca Trevisan, Patrice Rusconi, Mauro Bianchi, Valentina Piccoli and Andrea Carnaghi in Group Processes & Intergroup Relations
Footnotes
Acknowledgements
We thank Karolyn Close for carefully proofreading a draft of the manuscript.
ORCID iDs

Ethical Considerations
The studies were approved by the Ethics Board of the University of Trieste.
Consent to Participate
Participants provided written (online) consent to participate.
Author Contributions
RC, AC, PR, and MB contributed to the conceptualization of the three studies. RC and AC developed the methodology of the three studies. RC was involved in data curation and online research implementation. RC contributed to formal analyses, later joined by FD for the meta-analyses. RC and AC were in charge of writing the preliminary draft of the paper. RC, FD, FT, PR, MB, VP, and AC reviewed and edited the successive drafts, and contributed to the presentation of the submitted work.
Funding
The authors disclosed receipt of the following financial support for the research, authorship, and/or publication of this article: This project has been funded by European Union- Next Generation EU, Missione 4 Componente 1, PRIN n. 20228NXSAY–CUP: J53D23007910006.
Declaration of Conflicting Interests
The authors declared no potential conflicts of interest with respect to the research, authorship, and/or publication of this article.
Data Availability Statement
Supplemental Material
Supplemental material for this article is available online.
Notes
References
Supplementary Material
Please find the following supplemental material available below.
For Open Access articles published under a Creative Commons License, all supplemental material carries the same license as the article it is associated with.
For non-Open Access articles published, all supplemental material carries a non-exclusive license, and permission requests for re-use of supplemental material or any part of supplemental material shall be sent directly to the copyright owner as specified in the copyright notice associated with the article.
