
Abstract
This article addresses a critical gap in the literature on winner–loser effects that consists of the lack of attention for highly contentious constitutional referenda. It uses unique multi-wave panel data of over 13,000 people that is unrivalled in size and richness. We estimate causal effects of the referendum on rarely studied but crucial public perceptions of the fairness of the way a referendum is conducted. These perceptions pertain to the highly contentious 2016 European Union (Brexit) referendum in the United Kingdom, which is an ideal-type example of a wider class of referenda for which similar outcomes can be expected. We use difference-in-differences methods and find winner–loser effects of a magnitude far greater than ever observed for general elections. Moreover, we find that these effects not only persist, but even grow over time. The findings have profound implications for the use of such referenda.
Keywords
Introduction
The seminal contribution by Anderson and his collaborators (see for example, Anderson et al., 2005; Anderson and Guillory, 1997; Anderson and LoTempio, 2002) sparked a lively field of research on questions of losers’ consent and winner–loser effects. Almost without exception, this research finds that those who see their preferred side win in elections are more positive than those whose preferred side lose (cf., Anderson et al., 2005; Beaudonnet et al., 2014; Blais and Gélineau, 2007; Delgado, 2016; Howell and Justwan, 2013; Martini and Quaranta, 2019; Singh et al., 2011, 2012; Van der Meer and Steenvoorden, 2018). While some disappointment among electoral losers may be expected, the winner–loser gap can pose substantive challenges to political systems.
Such challenges are of at least two different kinds. The first concerns losers’ consent. If the group that lost is sufficiently large, and sufficiently disaffected by having lost, the normative basis of legitimacy of political systems that derives from the consent of the governed (see for example, Franck, 1992; Locke, 1821 [1689]) may be eroded. The widely subscribed belief that ‘a democratic political system cannot survive for long without the support of a majority of its citizens’ (Miller, 1974: 951) does not specify how large that majority should be, but it should be sizable. Losers’ consent can also be a challenge at more mundane levels, particularly when it undermines voluntary compliance with the law, collective decisions and policies (cf., Nagin and Telep, 2017; Scholz and Lubell, 1998). This may be the result of lack of diffuse support (in Easton’s terms, 1965). Such diffuse support is particularly important for electoral ‘losers’. Simply put, it is easy to support a system that is delivering preferred policies, but it is harder to acquiesce to a system that is not. Diffuse support helps prevent dissatisfaction or disappointment leading to rejection of, and refusal to comply with, policies and policy decisions or, in extremis, rebellion and revolt. Much of the research on losers’ consent relates to diffuse support, often operationalised by survey questions about satisfaction with democracy.
The second challenge to political systems that derives from winner–loser gaps relates not to losers’ consent for substantive policies, but to their possible lack of confidence in the impartiality of central procedures of democratic governance. Among these are the electoral processes that determine parliamentary and executive power and in the case of referenda, substantive political decisions. The focus here is on procedural fairness, which is more specific than the somewhat nebulous but more commonly used focus on satisfaction with democracy. Yet, procedural fairness is of crucial importance because it relates to the democratic basis of the legitimacy of governments. Moreover, elections are supposed to be processes that make inevitable inequalities of political power justifiable (Buchanan, 2002: 710). Thus, if citizens are systematically dissatisfied with elections, and consistently see them as unfair, then there is a very great legitimacy problem indeed. Where strong winner–loser gaps of this nature exist, it reflects not only doubts about legitimacy, but a potentially even more severe problem for a democratic system of the politicisation of legitimacy. Yet, this has been rarely studied, and even where studied is often done by reference to data from module 1 of the CSES that is now some 20 years old (see for example, Singh et al., 2011).
There are important understudied elements within the winner–loser literature. As indicated, one of these involves procedural fairness. Also mostly ignored are winner–loser effects in referenda (for a recent exception that focuses on a district-level referendum, see Marien and Kern, 2018). The winner–loser literature almost always focuses on national-level elections, especially those that decide a country’s executive. Yet, referenda are not just another context to study winner–loser gaps, they are of major importance because their outcomes will generally have an impact that lasts far longer than a regular electoral cycle. Particularly, in the case of contentious referenda that seek to change the constitutional settlement of a country, a referendum can be the most significant electoral competition for a generation, often carrying (ostensibly) irreversible consequences.
From the literature, it also remains as yet unresolved what kind of dynamics of attitudes and perceptions are generated by being on the winning or losing side in an election, let alone in the specific context of a referendum. Do winner–loser gaps originate from opposed dynamics (winners becoming more positive and losers becoming less positive), or from asymmetric dynamics (winners becoming more positive, and losers less so)? In the light of what has been noted earlier, this is of enormous practical significance. If losers simply gain less than winners, but do not see their positive perceptions decline in absolute terms, then there is little possibility of the more serious consequences discussed earlier. Conversely, if losers do see their positive perceptions decline noticeably, then more serious concerns could be realised. The lack of systematic evidence here reflects the scarcity of data from consistent panels, as well as the dearth of studies in referendum contexts.
Our study addresses each of these lacunae by using a large and rich panel study (the British Election Study Internet Panel (BESIP)) that contains both traditionally used attitudes and perceptions of fairness in multiple waves of interviews; by leveraging the potential of panel data for difference-in-differences (d-i-d) analyses; and by systematically comparing winner–loser effects of the United Kingdom’s 2016 European Union (EU) referendum and in the 2017 General Elections in the United Kingdom. This article first reviews the winner–loser literature. We then discuss likely differences between referenda and more commonly studied general elections. We discuss our focus on procedural fairness and its measurement. After an overview of the data and our analytical approach, we present the results. The conclusion of the article is that winner–loser effects are much larger for the EU referendum than for a general election, and that they increase over time. Finally, we reflect on the generalisability of our findings, and on their implications for the evaluation of constitutional referenda and further study.
Winner–loser effects: Theoretical background
The literature consistently shows that those whose preferred side ‘won’ are more positive towards politics and the political process than those who ‘lost’. Nonetheless, the magnitude of these differences varies strongly. Singh et al. (2011), in a cross-sectional study using CSES data from Australia, Canada, Britain and the United States covering elections between 1996 and 2005, consistently find a statistically significant winner–loser effect at the national level, but mostly insignificant results at the district level. However, while the effect at the national level was statistically significant, it was of only moderate size for outcome variables such as whether democracy is the best form of government, satisfaction with democracy, or whether elections were conducted fairly (Singh et al., 2011: 703–704). Most often, the effect was smaller than that of age, income, or education. Only for direct evaluations of government performance was the ‘winner–loser’ effect consistently larger than for demographic variables (Singh et al., 2011: 703–704). Similarly, in wide-ranging analyses of election studies from 1972–2006 in Britain, Canada, Germany, The Netherlands, New Zealand, Norway, Sweden and the United States, Esaiasson (2011: 106–107) finds mixed results for the size of the winner–loser gap across a range of indicators tapping satisfaction with democracy and system support. Esaiasson (2011) sometimes finds statistically and substantively insignificant effects, but sometimes also large effects.
Regardless of the dependent attitudes under study, context appears to be particularly important for the size of the winner–loser effect. Howell and Justwan (2013: 341) demonstrate the importance of margin of victory for electoral winners’, but not for losers’ satisfaction with democracy. Supporting the winning side in a close election dramatically increases satisfaction with democracy, while supporting the winning side in a landslide election makes little difference; yet the magnitude of the margin is irrelevant for electoral losers. Delgado (2016: 81), in a study following the 2011 general election in Spain, also finds a contextually nuanced winner–loser effect upon satisfaction with democracy, in which supporters of losing parties that have recent experience of government are noticeably more satisfied than supporters of parties who do not. Han and Chang (2016: 90) demonstrate an independent effect upon satisfaction with democracy of ideological proximity to the winning parties (see also Delgado, 2016: 80). They also show that financial inequality, measured through the Gini coefficient, has an interaction effect with electoral winner status on satisfaction with democracy whereby the winner–loser effect is smaller in more equal societies. Finally, opportunities for sub-national representation also matter in some situations. Singh et al. (2012), in a study of the 2010 North Rhine-Westphalia state election, and Rose (2014: 84), in a study using data from the United Kingdom in 2008, demonstrate not only significant winner–loser effects at the national level, but also positive effects of winning only at the sub-national level (although these findings contrast with those by Anderson and LoTempio, 2002: 346; Singh et al., 2011).
Even more importantly, and crucially significant for gauging potential political consequences of winner–loser effects, are the absolute changes in system support among both winners and losers. Indeed, a large winner–loser gap in system-supportive orientations is possible even when both winners and losers become more positive after the election. This would unlikely lead to significant alienation of the losers and would undoubtedly boost their acceptance of democratic decisions. Indeed, one might hope that free and fair elections will enhance system-supportive orientations among both winners and losers. Assessing absolute rather than relative changes in a wide variety of support indices, Esaiasson (2011: 106–107) finds that increases in positive orientations among both winners and losers in national elections are common, although a gap between winners and losers usually remains. Similarly, and again reinforcing the supremacy of national-level winning, Singh et al. (2012: 206) observe, ‘being in government boosts satisfaction, while going into opposition does not foster dissatisfaction’. Van der Meer and Steenvoorden (2018), using a panel study of the 2012 Dutch Lower House elections, find positive (but small) effects of an election upon both political losers and non-voters; while again the gains are larger for supporters of the electoral winners. While there may be some conditionality within these results from the specific cases analysed and of how individuals experienced patterns of (repeated or alternating) winning and losing over electoral cycles, there is rough consistency across cases that losers’ evaluations of the system and its procedures do not tend to decline much if at all.
While the literature tends to find that losers generally do not see their system-supportive orientations decline much, if at all, there is little research to suggest whether this finding could be expected to apply to all political competitions. As already noted, analyses of winner–loser effects are predominantly based on elections, which are routine and repeat periodically. Much less research has been done on the winner–loser gap in referenda (for a recent exception studying short-term effects in a local referendum in Belgium, see Marien and Kern, 2018). Yet, it is a priori unlikely that the general form of the effect following ordinary elections – differential increases in system-supportive orientations – will carry over to referenda. For several reasons referenda are more likely to produce outsized winner–loser effects, and moreover, to show a decline in positive perceptions among losers.
First, a significant proportion of voters have strong electoral preferences for more than one party (Van der Eijk and Franklin, 2009: 52). Thus, in ordinary elections it is possible that people not ordinarily considered ‘winners’ might nonetheless see their second most preferred party win. This may explain the observed effect of ideological proximity on post-election satisfaction with democracy (Delgado, 2016; Han and Chang, 2016 see also Leiter et al., 2019). Moreover, in systems that habitually produce coalitions, ‘winning’ has a broader meaning that encompasses being included in a coalition (Van der Meer and Steenvoorden, 2018). In referenda, however, the likelihood that losers regard the option they did not vote for as an acceptable second-best is much more remote. Indeed, the dichotomous choice presented by many referenda seems more likely to lead to higher levels of polarisation. Losers are, therefore, likely to decline in their system-supportive orientations following referenda. Moreover, while the magnitude of winner–loser effects in regular electoral contexts may be limited because winners in one election are often losers in another, such countervailing and mitigating influences are usually absent in the case national referenda.
Second, as noted earlier, losers who have recent experiences of seeing their party in government are generally more satisfied than those who do not, indicating the existence of a carry-over effect in system-supportive orientations (Delgado, 2016: 81). Referenda, by contrast, are usually one-shot competitions. Thus, it is unlikely that there will be any compensatory effects from previous electoral victories. Moreover, past research on the moderating role on the winner–loser effect of recent experience with governing implies that an expectation of seeing one’s most preferred party in government at some future point in time is also a moderating factor. However, referenda are not ordinarily re-run, and issues decided by referenda may be taken as politically ‘settled’ for a significant period. It is, therefore, plausible that losers in referenda may feel their loss to be perpetual, which again would increase winner–loser effects.
In sum, we may reasonably expect referenda to have an outsized winner–loser effect, relative to much more commonly studied general elections. Nonetheless, it is still uncertain exactly how large the effect will be in the context of a highly salient national referendum and whether losers will get more negative absolutely or simply fail to gain in positive perceptions.
Winner–loser effects: The dependent variable(s)
The winner–loser literature frequently takes satisfaction with democracy as the dependent variable (cf., Blais and Gélineau, 2007; Delgado, 2016; Han and Chang, 2016; Martini and Quaranta, 2019). Satisfaction with democracy is an important evaluation of a democratic political system, and is generally interpreted as an indicator of diffuse support for the existing political regime. Nonetheless, the literature is rife with discussions about what ‘satisfaction with democracy’ exactly means, and about the extent to which it represents Easton’s (1965) concept of diffuse support (see for example, Anderson and Guillory, 1997: 70; Ezrow and Xezonakis, 2016; Linde and Ekman, 2003). Moreover, satisfaction with democracy is inherently less specific than evaluations that directly relate to a single electoral competition. Precisely because of this, satisfaction with democracy is less helpful for considering whether people will regard specific collective decisions as legitimate. For that purpose, evaluations of procedural fairness of electoral competitions are more relevant.
Perceptions of procedural fairness are of crucial importance. A range of research has shown that people are more likely to accept decisions that go against their individual interests or preferences if they believe those decisions were obtained in a procedurally fair manner (cf. Tyler, 1988, 2003). Much of this work has taken place in the context of policing, but the same effect also appears in relation to rulings of the United States Supreme Court which involve broader public policy issues (Tyler and Rasinski, 1991). Procedural fairness is especially important with respect to general public policy making. An experimental study of acceptance of systemic tax law changes demonstrates that support was higher for decisions made using a fair procedure irrespective of how beneficial or detrimental the decision was individually, even though acceptance of ad hoc individual tax decisions did not show a fairness effect (Niesiobędzka and Kołodziej, 2017). In 27 small scale studies (n = 57–312) of decision acceptance of changes to school-level educational regulations, Esaiasson et al. (2019) show a significant effect of perceived procedural fairness on decision acceptance, alongside a key role of outcome favourability. Nonetheless, because neither Niesiobędzka and Kołodziej (2017) nor Esaiasson et al. (2019) focus on national-level electoral competitions, it is difficult to derive clear expectations from their research for the role of fairness perceptions in referenda and general elections.
Regardless of the effect of procedural fairness on outcome acceptance, perceptions of procedural fairness have frequently been shown to lead to greater compliance with the law (for a review, see Nagin and Telep, 2017), and to boost perceived legitimacy of collective decisions (Martin et al., 2020), which in turn drives support, compliance and acquiescence (Sunshine and Tyler, 2003). At the same time, perceptions of electoral fairness are also importantly associated with turnout, which is higher among citizens who believe that the election is likely to be fair (Birch, 2010). Enhanced engagement is again plausibly related to greater perceptions of the legitimacy of systems, as well as being good in its own right. More generally, procedural fairness itself is a normative good, and its presence is always better than its absence.
Perceptions of procedural fairness are, therefore, important for tracking the extent to which individuals believe they experience a fair system, but are arguably of greater importance politically, because individuals act based on their perceptions rather than the objective facts on the ground. Moreover, because perceptions of the fairness of elections seem to have an important role in outcome acceptance, over and above the important role of decision favourability, they are likely to be a particularly important concern in the context of contentious political competitions. Therefore, we focus our research upon perceptions of procedural fairness.
Data
We use data from the BESIP, which is the first large scale British survey since the late 1990s that contains questions about the fairness of the electoral process. 1 Wave 1 of BESIP was fielded in February/March 2014; we focus mainly on waves 7, 9, 10 and 11, which cover the period of April 2016 to early May 2017. Fieldwork for Wave 7 (n = 30,895) was between 14 April and 4 May 2016 (shortly before the EU referendum of 23 June); for wave 9 (n = 30,036) between 24 June and 4 July 2016 (immediately after the EU referendum). Wave 10 (n = 30,319) was fielded between 24 November and 12 December 2016 during a relatively quiet period after Theresa May assumed the position of Prime Minister in July, and while specifics of her Brexit policy still had to take shape. Wave 11 (n = 31,014) was fielded between 24 April and 3 May 2017, shortly after the government notified the EU formally of its intention to leave (29 March), and also, shortly after the early General Election of 2017 was called (on 18 April 2017), but before the hot phase of the campaign for this election. Occasionally, we use data from other waves, at which times we will briefly introduce the context in which those waves took place.
The number of respondents that were surveyed in all these four waves is smaller than indicated earlier (because of attrition and replenishment of the panel), but still amounts to a respectable 13,115. To avoid comparison problems arising from compositional differences, we conducted all analyses reported below on this subset of 13,115 respondents. To approximate the characteristics of the British population, and in particular, because the BESIP deliberately oversampled Scottish and Welsh respondents, we conducted our analyses on weighted data. This translates into a weighted n of 9373. For details of sampling and of weights, we refer to the BESIP documentation. 2
As indicated earlier, our focus is on the magnitude of the winner–loser effect of the EU referendum outcome on perceptions of the fairness of the referendum. Questions about this were included in the questionnaires of BESIP waves 7, 9, 10 and 11, which are as follows: How fairly do you expect the EU referendum to be conducted? (wave 7)
and
How fairly do you think the EU referendum was conducted? (wave 9, wave 10, wave 11) Each of these questions could be answered via a 5-point rating scale with 1 labelled as ‘conducted fairly’ and 5 as ‘conducted unfairly’. Respondents could also indicate ‘don’t know’.
Although the questions are formulated differently, prospectively in wave 7 and retrospectively in waves 9, 10 and 11, they are obviously equivalent in their substantive meaning, and, therefore, we can compare the responses over time.
Equivalent questions relating to the General Election of 2017 were included in BESIP wave 11 (prospective) and wave 13 (retrospective), and, although these are not at the heart of the study we report here, we use these questions to put the estimates of the winner–loser effect on the fairness of the EU referendum into a broader perspective. We introduce additional variables, used as controls or to distinguish groups, at the time that they are used. These variables and their coding are reported in Section 1 of the online Supplementary information.
Analytical approach
As indicated earlier, we are not primarily interested in the distribution of responses to the questions about the fairness of the EU referendum, or in explaining the variance of these responses. Instead, we are interested in how these answers changed from before to after the referendum as a consequence of the referendum outcome. Such changes reflect winner–loser effects much more directly than cross-sectional analyses which focus on response differences between winners and losers. The panel character of our data allows us to observe individual-level changes in responses to the referendum fairness question and assess to what extent these changes are attributable to one’s status as winner or loser in the referendum. The procedure we use for this is d-i-d analysis.
D-i-d estimation is a well-established procedure that is often used in empirical studies in economics, policy evaluation, education and health research. It compares the difference in responses between groups of cases that are ‘treated’ differently by an event. It compares these differences between the groups before and after the event, which is in our case the EU referendum. The two groups of relevance in our analyses are ‘referendum winners’ (those who voted to leave the EU) and ‘referendum losers’ (those who voted to remain in the EU). Although none of the respondents were winners or losers before the referendum, the panel structure of the data allows us to identify the eventual winners and eventual losers in pre-referendum waves.
The d-i-d approach helps to address two endemic problems when pursuing the estimation of causal effects in nonexperimental data: selection bias and the confounding effect of other (exogenous) factors than the event in question (see for example, Angrist and Pischke, 2009; Imbens and Rubin, 2015; Imbens and Wooldridge, 2009; Shadish et al., 2002). Most assumptions of a d-i-d design are met by the panel character of the data, by our use of a fixed group of respondents (only those who participated in all four waves of interest), and by the unequivocal time sequence of observations and the referendum. Yet, three aspects of our use of d-i-d are not trivial and require some explanation.
The first, somewhat uncommon element in our application of d-i-d is that it deviates from its classic form in which only one of the two groups is exposed to a treatment, while nothing changes for the other group (the control group). This definition of treatment is not plausible in our case. The outcome of the referendum does not only designate the ‘leave’ voters as winners, but simultaneously designates the ‘remain’ voters as losers. In short, both groups are ‘treated’, but in opposite ways, and there is no untreated ‘control group’. Although most discussions of d-i-d focus on the comparison of a treated and an untreated group, the d-i-d design is actually quite flexible and can be applied to a wider set of conditions than this simple classic case (cf., De Chaisemartin and D’Haultfeuille, 2018; Fricke, 2017; Wing et al., 2018). In our case, we apply a form of d-i-d analysis that utilises a ‘reversed treatment control group’ (as used by, for example, Hackman et al., 1978; see also Shadish et al., 2002: 147–148, who emphasise its strengthening of construct validity).
The second aspect that warrants some discussion relates to a central assumption of d-i-d analyses, known as the parallel trend assumption. This holds that, had the referendum not taken place, the groups compared would exhibit the same change over time. The plausibility of this assumption can only be assessed if the referendum fairness question would have been asked at multiple times before the referendum. Unfortunately, that was not the case. However, we can use another variable as a functional proxy: satisfaction with democracy. Although it is more diffuse in character than the referendum fairness question, it also taps into evaluations of political processes in the country. 3 This question has been asked repeatedly before the referendum, thus allowing a ‘placebo test’ of the parallel trend assumption (reported in Section 2 of the online Supplementary information). The results of this test provide compelling support for the parallel trend assumption, on which the validity of d-i-d effects rests.
The third aspect of our estimation of d-i-d effects that needs to be explicated concerns covariates. We use covariates to control for factors that may affect the individual (i.e. person level) response to the treatment, and which may differ systematically between the two groups. Controlling for these, thus, reduces the risk of incorrectly attributing response changes to the differential treatment of the groups. We use only variables as covariates that have been observed before the referendum, and that, therefore, cannot have been influenced by the winner–loser distinction. In the analyses to be reported later, we use as covariates gender, age, education, ethnicity, nationality and social grade (details about the measurement of these covariates are provided in Section 1 of the online Supplementary information).
We estimate d-i-d effects with the Stata module diff (Villa, 2016), using the fixed set of 13,115 respondents that participated in all relevant waves of BESIP (waves 7, 9, 10 and 11), with a weighted n of 9373 (see also Note 2). The dependent variable (referendum fairness) is an ordered categorical variable (ranging from 1–5). One could question the appropriateness of the linear regression procedures that underlie d-i-d analyses, and whether other procedures (e.g. various forms of logit or probit analysis) would be preferable. Although this would be possible in principle, the disadvantage is that, as Lechner (2011: 198) explains, such specifications usually lead to inconsistent d-i-d estimators. Moreover, as Hellevik (2009) convincingly demonstrates, the advantage of such nonlinear specifications over OLS is small if the dependent variable is not very skewed. For these reasons, we use d-i-d models that are based on straightforward linear regression procedures.
Results
As stated earlier, we focus on winner–loser effects in responses to referendum fairness questions. Table 1 presents the response distribution of this question for each of the four waves.
Distribution of responses to referendum fairness question.
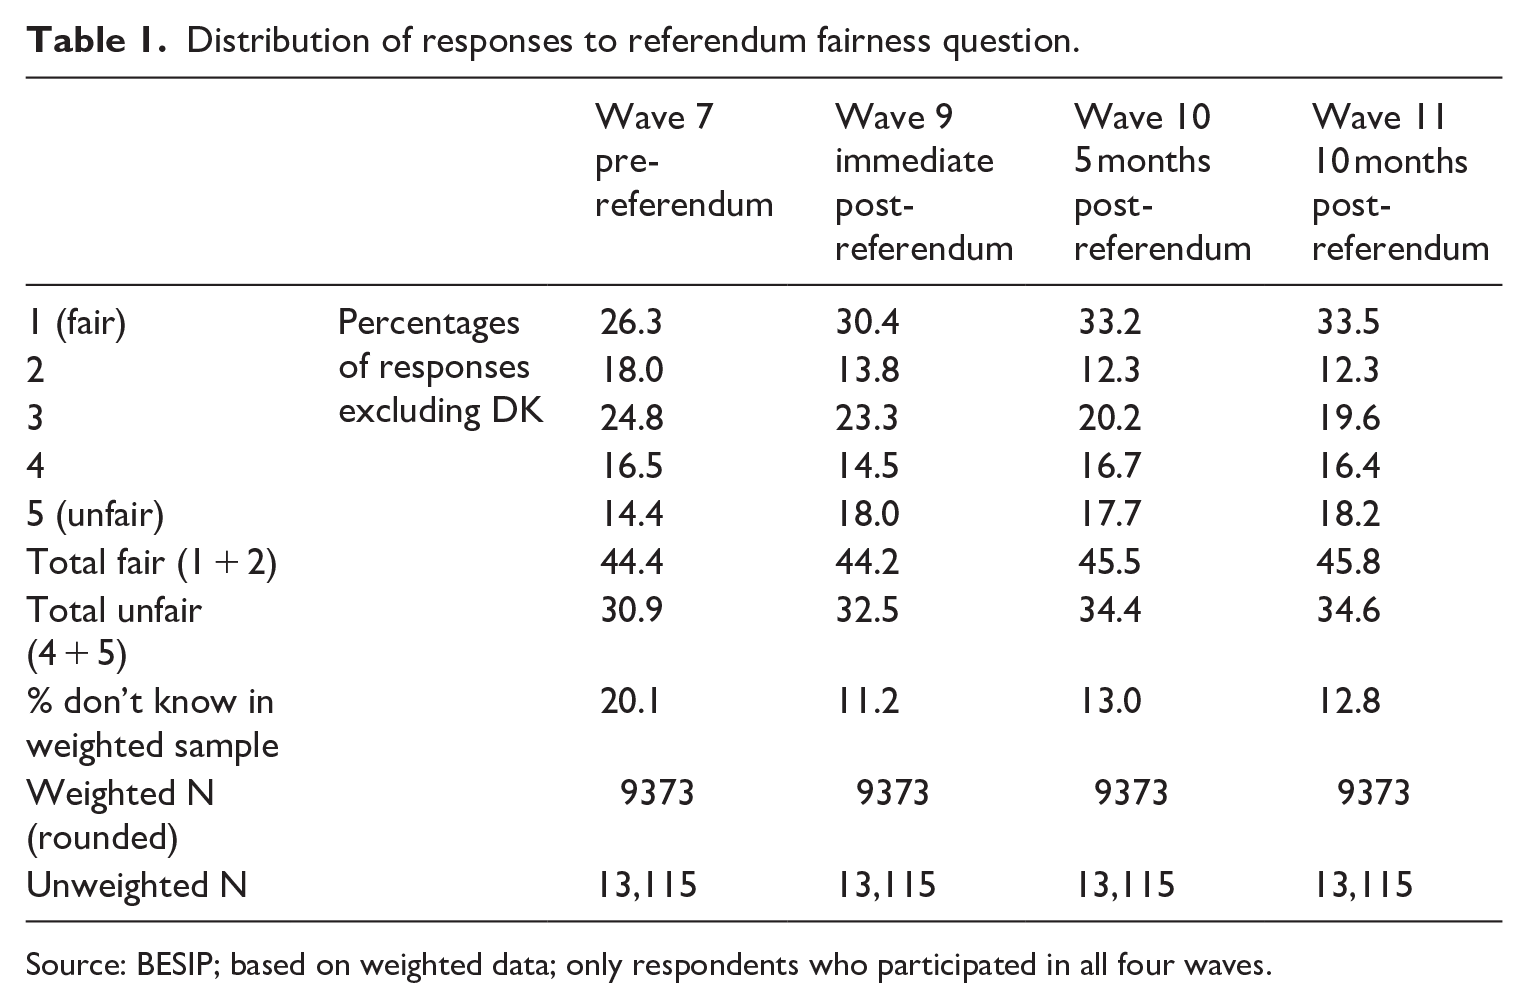
Source: BESIP; based on weighted data; only respondents who participated in all four waves.
Table 1 shows some interesting changes which occur against the backdrop of considerable aggregate stability. The proportion of people who perceived the referendum as having been conducted (at least somewhat) fairly (categories 1 and 2 combined, see row labelled ‘total fair’) remains stable over time at around 45%, with a slight increase in the percentage in category 1 (at the expense of category 2). On the other pole (row labelled ‘total unfair’, comprising categories 4 and 5), we observe a slight increase from about 31% to about 35%, most of this increase is to category 5. 4 The middle response category 3 becomes gradually smaller. The magnitude of these changes is limited, but jointly they result in a gradual increase in polarisation of the responses. In addition to these limited shifts in the distributions of valid responses, we observe also a strong drop in the percentage of don’t know responses, from about 20% to about 13%.
The limited changes in these overall response distributions mask, however, a tremendous degree of churn below the surface, which is strongly related to whether respondents find themselves after the referendum on the winning or losing side. It is these changes that we now concentrate on.
Table 2 presents the results of a d-i-d analysis on the responses to the referendum fairness question asked shortly before and immediately after the referendum (BESIP waves 7 and 9). As the same individuals are observed at the two moments in time, we estimated clustered standard errors. 5
Difference-in-differences analysis of responses to referendum fairness question.
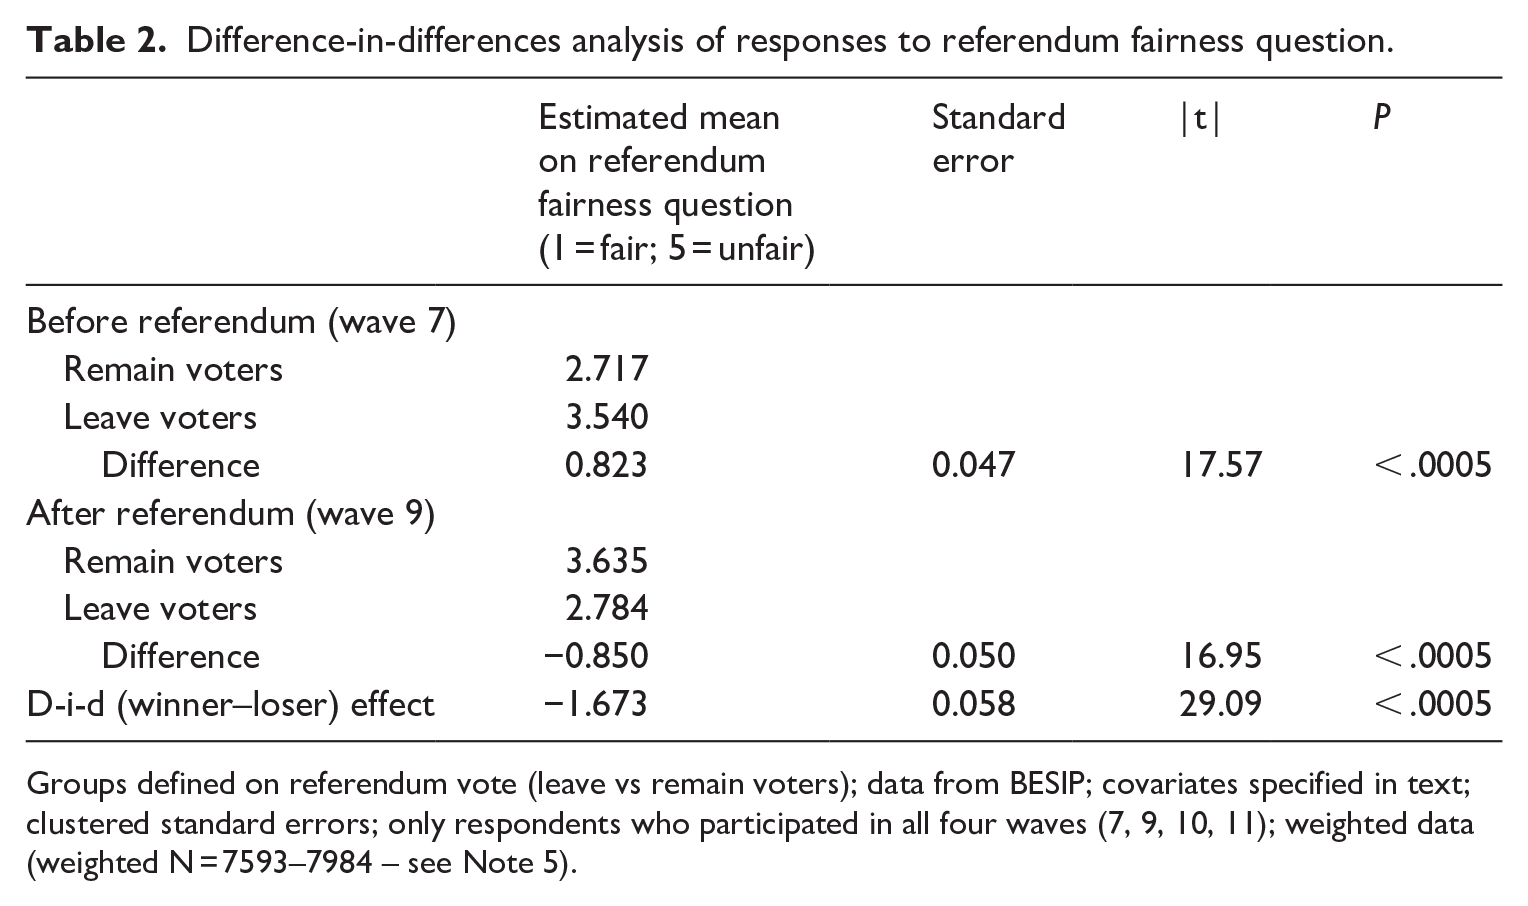
Groups defined on referendum vote (leave vs remain voters); data from BESIP; covariates specified in text; clustered standard errors; only respondents who participated in all four waves (7, 9, 10, 11); weighted data (weighted N = 7593–7984 – see Note 5).
As Table 2 shows, the eventual leave voters were (before the referendum) considerably less convinced about the fairness of the referendum than the eventual remain voters: their respective means on the 5-point scale are 3.54 and 2.72, resulting in a difference of means of 0.82. After the referendum, the positions of the two groups reversed, and the magnitude of the change makes it an almost perfect swap between the positions of the two groups. This pattern of changes contradicts suggestions that a winner–loser difference might originate from different rates of change in the same direction (Esaiasson, 2011; Singh et al., 2012; Van der Meer and Steenvoorden, 2018). We find this pattern in all our d-i-d analyses. The post-referendum averages are 2.78 for leave voters, and 3.64 for remainers, which gives a difference of their means of −0.85 (in the other direction as before the referendum, hence the minus sign). The combination of the two differences of group means yields the d-i-d estimate, which is −1.67. The estimated d-i-d effect is a proper winner–loser effect that reflects how strongly perceptions of referendum fairness have changed because of having been on the winning or on the losing side of the referendum. This d-i-d effect is significant but given the large N (9373) that is unsurprising. Of greater interest is the large absolute magnitude of the d-i-d effect, 1.673 on a dependent variable with a range of 5.
The most obvious interpretation of the origin of the effect reported in Table 2 is the respondent’s status as winner or loser in the referendum. One could wonder, however, whether the findings could be interpreted in other ways. Two potentially rivalling interpretations come to mind. One is that the effect was generated by other, contemporaneous stimuli and events. A second potential problem is that the effect may be partly endogenous if expectations about the outcome would already have been factored in pre-referendum responses to the fairness question. Both potential problems can be assessed using other variables from the pre-referendum questionnaire.
The interpretation that the d-i-d effect is generated by being on the winning or on the losing side of the outcome implies that respondents were ‘treated’ with a political outcome that they desired (leave voters), or that they did not desire (the ‘reversed’ treatment for remain voters). The logic of this argument has as an observable implication that the magnitude of the winner–loser effect should correlate with how strongly respondents desired or abhorred the outcome. This can be tested empirically, using the (wave 7, pre-referendum) question: ‘How will you feel if Britain votes to leave the EU?’ with response options ‘Very unhappy’ (1), ‘Somewhat unhappy (2), ‘A little unhappy’ (3), ‘Indifferent’ (4), ‘A little happy’ (5), ‘Somewhat happy’ (6) and ‘Very happy’ (7). 6 Combining categories of equal strength of feeling on both sides of the divide (1 and 7; 2 and 6; 3 and 5) leads to 4 categories, ranging from very strong feelings about the outcome to indifference. We conducted d-i-d analyses for each of these groups and report the estimated winner–loser effect in Table 3 (more detailed results are reported in Section 3 of the online Supplementary information).
Magnitude of winner–loser effect on perceived referendum fairness for different strengths of preference for outcomes.
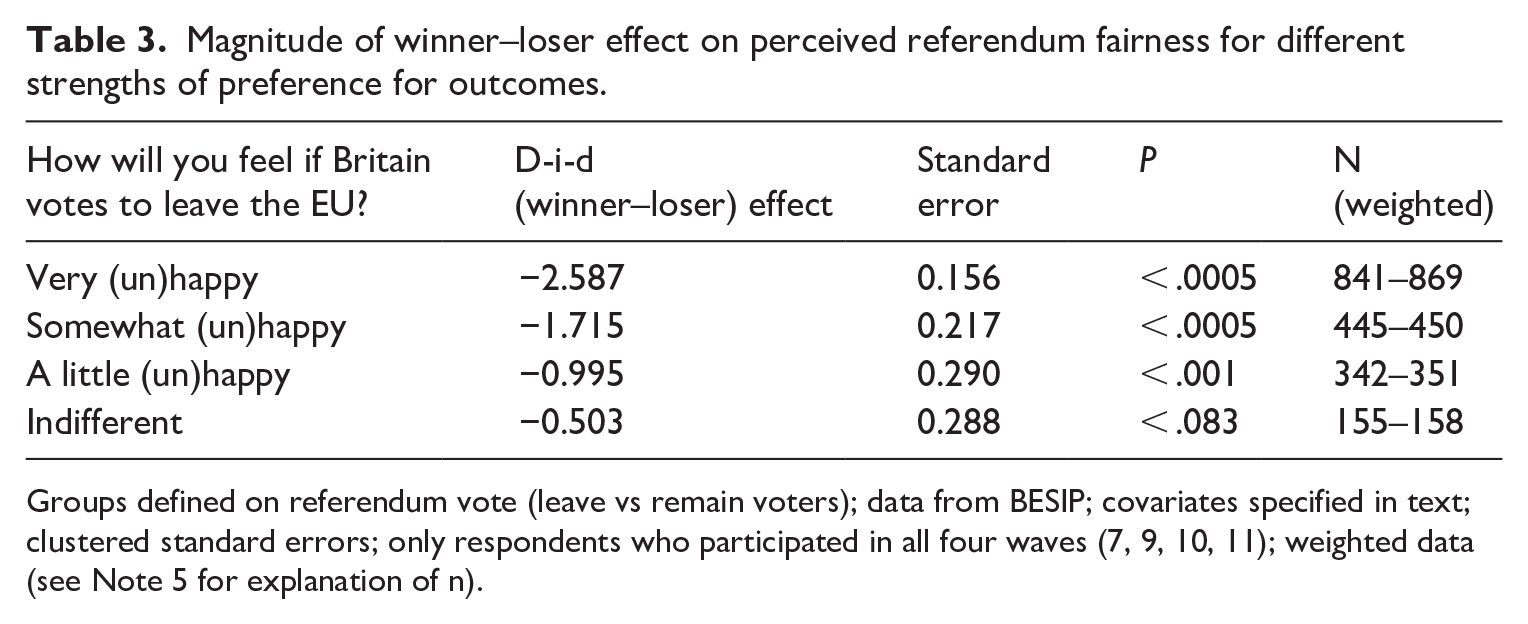
Groups defined on referendum vote (leave vs remain voters); data from BESIP; covariates specified in text; clustered standard errors; only respondents who participated in all four waves (7, 9, 10, 11); weighted data (see Note 5 for explanation of n).
Table 3 shows that the stronger respondents’ preferences about the outcome of the referendum, the larger the winner–loser effect is. This supports our interpretation of the d-i-d effects in winner–loser terms. At the same time, it reduces the plausibility of the effect having been generated by other contemporaneous events, as those would have to be differentially relevant for people with different strengths of preference for the outcome of the referendum to understand the results reported in Table 3. Interestingly, even for those who claimed (before the referendum) to be indifferent, we find a non-negligible winner–loser effect in the same direction as for the other groups (that this effect is only significant at the 10% level reflects also the limited number of cases in this group). This may either reflect that these respondents were not entirely indifferent, or that the mere fact of being in the ‘winning’ group has a positive impact on perceived referendum fairness.
The second potential problem with attributing the effects reported in Table 2 (and Table 3) to being on the winning or losing side of the outcome is that expectations about the outcome may have influenced pre-referendum responses to the fairness question, thereby introducing an element of endogeneity in the analyses. The potential presence of such endogeneity can be assessed in multiple ways using respondents’ expectation of which side would win the referendum, which was asked in wave 7 (pre-referendum). 7 The respective analyses (reported in Section 4 of the Supplementary information for the sake of brevity) do not provide any support to the notion that our main results (reported in Table 2) are an artefact of, or biased by, endogeneity.
As stated earlier, the referendum fairness questions were not only asked immediately after the referendum, but also 5 months and 10 months later. We can thus test whether the winner–loser effect decreases, remains the same, or increases over time. Were it to decrease, this would signify that the outcome of the referendum has gradually become the ‘new normal’, and that the referendum outcome gets gradually ‘accepted’ by the losers. Were the winner–loser effect to increase over time, it would reflect continued and increased politicisation of the legitimacy of the outcome and non-acceptance of the outcome by the losing side. Table 4 reports the magnitude of the winner–loser effects based on d-i-d analyses on different time intervals (full results in Section 5 of Supplementary information).
Magnitude of winner–loser effect on perceived referendum fairness for different time intervals.
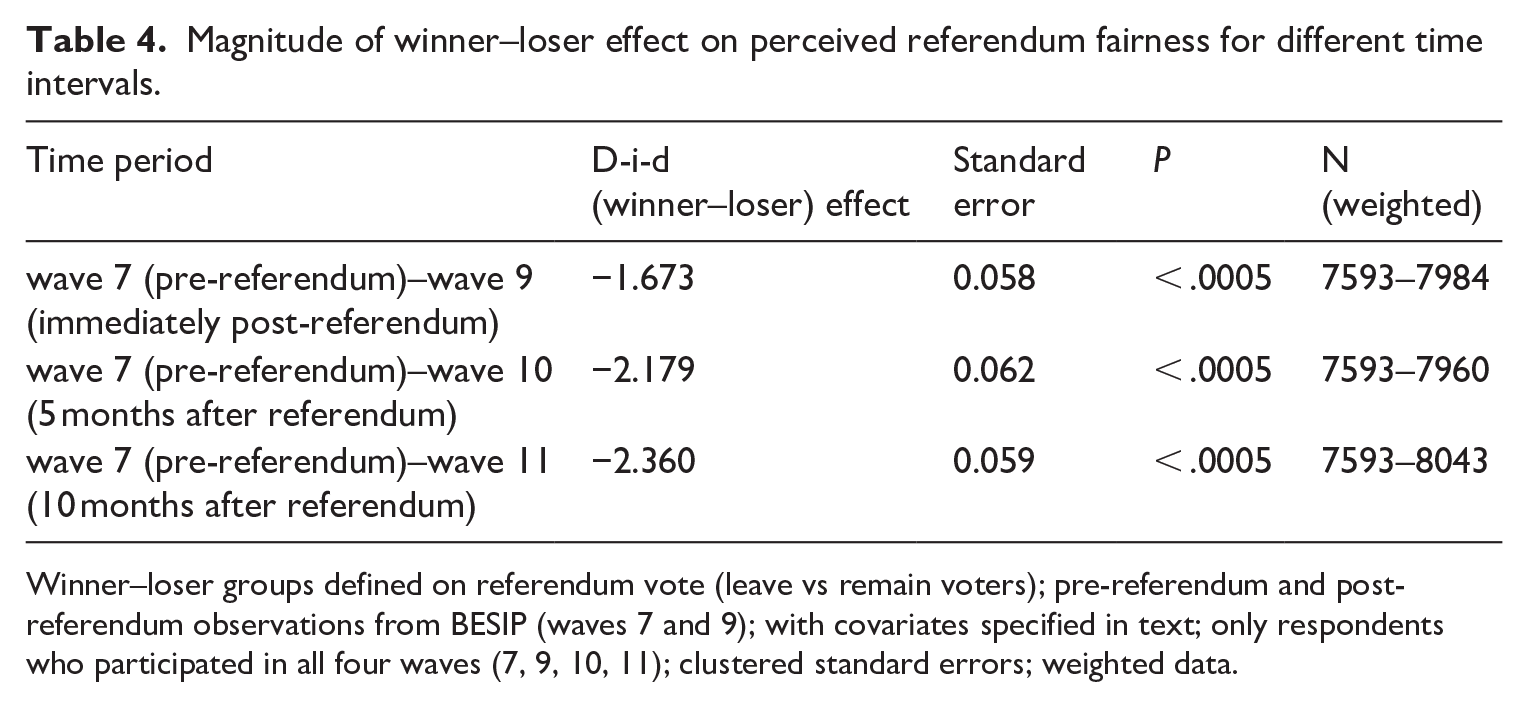
Winner–loser groups defined on referendum vote (leave vs remain voters); pre-referendum and post-referendum observations from BESIP (waves 7 and 9); with covariates specified in text; only respondents who participated in all four waves (7, 9, 10, 11); clustered standard errors; weighted data.
The analyses clearly demonstrate that, even 10 months after the referendum, the outcome had not been ‘accepted’ by the losers in any meaningful way. On the contrary, their perception that the referendum had been conducted unfairly has been strengthened considerably. It is, of course, impossible to determine to what extent this also reflects the ongoing contestation about the desired character of Brexit and the gradually emerging flow of new information suggesting that the conduct of the referendum was marred by real improprieties (campaigns exceeding legal spending limits; questions about the legality of donor contributions; social media meddling from abroad; etc.) which may affect perceptions of referendum fairness.
As discussed earlier, studies of winner–loser effects in the extant literature generally focus on elections, not on referenda. The question, therefore, arises how these findings compare with similar findings relating to general elections. Because the same questions about fairness have been asked with respect to the General Election of 2017, we can address this question directly. This puts the winner–loser effects on perceived referendum fairness in a broader perspective, and also tests our expectation that these effects are larger in a contentious constitutional referendum than in a regular election. The questions about perceived fairness of the way the general election is conducted were asked in BESIP waves 11 and 13. Wave 11 was fielded between 24 April and 3 May 2017, shortly before the election of 8 June. Wave 13 took place immediately following that election, between 9 and 23 June 2017. In terms of this election, winners were voters for the Conservative party, and losers were voters for all other parties. 8 The winner–loser effect from a d-i-d analysis for these data is 0.630 (p < .0005). 9 In short, there is a significant, but more moderately sized winner–loser effect in the General Election. This comparison supports our expectations that contentious referenda are likely to generate much larger winner–loser effects than generally observed in the context of regular elections.
Discussion and conclusions
Our analyses demonstrate that worryingly large groups of British citizens have rather dim views of the fairness of electoral processes in the United Kingdom. Compared to the (unlikely) normative ideal of all citizens seeing electoral competitions as fair, we find less than 50% of respondents express this view in the case of the EU referendum. The results also demonstrate that beliefs about the fairness of the referendum changed strongly (and in opposite directions) for leave and remain supporters because of the referendum outcome, representing a large decline for remain supporters in absolute terms. Given the extant literature, a winner–loser effect was expected. Previous research generally reports winner–loser effects of around 5%–10% of the range of the outcome variable (Singh at al., 2011: 704; Rose, 2014: 84). Yet, in the case of the EU referendum, we find effects far larger (and also far larger than we found for the general election of 2017). Indeed, for the EU referendum the winner–loser effect is 33% of the range of the outcome variable, and over 50% for the (relatively large) group who cared most about the outcome of the referendum. These are winner–loser differences of an unprecedented magnitude. Furthermore, this effect did not dissipate over time, but instead grew importantly over the course of the first year after the referendum. These results demonstrate that the leave and remain sides have not ‘come together’ since the vote. As this division concerns a base evaluation of the fairness of the vote, rather than a measure of satisfaction with the outcome, this cleavage also reflects that the legitimacy of the referendum and its outcome have become both hotly contested and politicised. That makes it unlikely that leave and remain supporters will easily ‘come together’ in the future, irrespective of how Brexit will proceed. A similar conclusion has also been reached by Evans and Schaffner (2019) who analysed political identities. They found that leave and remain have evolved into central aspects of citizens’ political identity, held with great social and emotional intensity, and likely to remain important drivers of political orientation. Our analyses not only affirm the existence of these rivalling identities but supplement it by demonstrating that they are also the basis for political contestation about the legitimacy of the referendum and its outcome. This latter aspect has the potential to undermine the consent of the governed upon which democratic governance rests, at least for a significant part of the population. Moreover, this contestation may provide the context in which future trade negotiations, which will determine the form that Brexit takes, will be understood by the public.
What, if any, conclusions can be drawn from our analyses for other referenda? Or is the 2016 EU referendum a sui generis event that does not lend itself to sensible generalisation? In our view, this referendum is not a unique case; instead, on the basis of Gerring’s (2008) discussion of case selection for case study analysis, the EU referendum can be considered as an almost ideal-typical case of a broader universe of referenda that is characterised by (a) being highly emotive for large segments of the electorate, (b) appealing to (and giving rise to) exclusive political identities strongly amplified by regular or social media, with (c) neither side having a large majority and (d) with far-reaching and enduring consequences for the organisation of the polity at large. Based on these criteria, the ‘Brexit’ referendum belongs to the same class of referenda as the 1995 Quebec independence referendum (Sklar, 1999), the 2014 Scottish independence referendum (Dekavalla, 2018), the 2017 Turkish constitutional referendum (Furman and Tunç, 2019), the 1950 Belgian monarchy referendum (Van den Wijngaert, 2001), and yet others. For referenda of this kind, our analyses demonstrate that the idea they are useful instruments to come to a solution for political problems that are beyond the capacity of parties and politicians is overly simplistic. 10 Indeed, when such problems become heavily politicised (as in the case with the EU referendum) referenda aggravate the problem rather than solve it, particularly when they contribute to contestation about the legitimacy of electoral processes. Without sufficient agreement about the legitimacy of these central processes of popular political involvement, no democratic rule can survive (Miller, 1974: 951). This also implies that, irrespective of how the Brexit process will play out, British parties and politicians have an urgent responsibility to restore widely shared confidence in the fairness of electoral processes.
Our analyses also demonstrate that our discipline has too long disregarded how citizens perceive and experience the fairness of elections. The most recent previous election study about this in the United Kingdom was more than two decades ago and contained just a single relevant question. The BES Internet Panel has had the wisdom to not only repeat that single question, but to complement it with related questions, and with repeat observations at different moments and for different kinds of elections. In view of both, the severe winner–loser effects that we identified and the worryingly large groups that express doubts about the fairness of electoral processes, we can no longer take-for-granted that elections generate their own legitimacy. We hope, therefore, that in the future more surveys will include the kind of questions we analysed here, and expand on them.
Supplemental Material
Supplementary_Files – Supplemental material for Winner–loser effects in contentious constitutional referenda: Perceptions of procedural fairness and the Brexit referendum
Supplemental material, Supplementary_Files for Winner–loser effects in contentious constitutional referenda: Perceptions of procedural fairness and the Brexit referendum by Cees van der Eijk and Jonathan Rose in The British Journal of Politics and International Relations
Footnotes
Acknowledgements
The authors thank Anja Neundorf and participants of the 2017 Elections, Public Opinion and Parties (EPOP) Conference for their useful comments on an earlier version of this paper.
Funding
The author(s) received no financial support for the research, authorship, and/or publication of this article.
Supplementary information
Additional supplementary information may be found with the online version of this article.
Notes
References
Supplementary Material
Please find the following supplemental material available below.
For Open Access articles published under a Creative Commons License, all supplemental material carries the same license as the article it is associated with.
For non-Open Access articles published, all supplemental material carries a non-exclusive license, and permission requests for re-use of supplemental material or any part of supplemental material shall be sent directly to the copyright owner as specified in the copyright notice associated with the article.