
Abstract
Cold-formed steel members can be assembled in various combinations to provide cost-efficient and safe light gauge floor systems for buildings. Such light gauge steel framing floor systems are widely accepted in industrial and commercial building construction. Light gauge steel framing floor systems must be designed to serve as fire compartment boundaries and provide adequate fire resistance. Floor assemblies with higher fire resistance rating are needed to develop resilient building systems for extreme fire events. Recently, a new composite panel system based on external insulation has been developed for light gauge steel framing floors to provide higher fire resistance rating under fire conditions. This article presents the details of an experimental investigation of light gauge steel framing floors made of both the conventional (with and without cavity insulation) and the new composite panel systems under standard fires. Analysis of the fire test results showed that the thermal and structural performance of externally insulated light gauge steel framing floor system was superior than conventional light gauge steel framing floors with or without cavity insulation. Details of the experimental results including the temperature and deflection profiles measured during the tests are presented along with the joist failure modes. Such fire performance data can be used in the numerical modelling of light gauge steel framing floor systems to further improve the understanding of their fire behaviour and to develop suitable fire design rules.
Keywords
Introduction
Light gauge steel framing (LSF) floor systems made of cold-formed steel lipped channel section (LCS) joists are commonly used in the building industry (Alfawakhiri, 2001; Sakumoto et al., 2003; Sultan et al., 1998). However, these thin, cold-formed steel sections heat up quickly under fire conditions, resulting in rapid reduction in their strength and stiffness. Gypsum plasterboard linings provide protection to steel joists during building fires by delaying the temperature rise in the cavity. The fire resistance of a floor is its ability to remain stable under exposure to fire. It is usually expressed in terms of its fire resistance rating (FRR), which is the length of time the floor can stay exposed to a standard fire resistance test without losing its load-bearing or fire separating functions. It is important to develop and use LSF floor systems with enhanced FRR as part of resilient building systems to avoid disasters during extreme fire events. FRR of LSF floor systems can be increased by adding more plasterboard sheets to the steel joists (the traditional method). However, innovative fire protection systems are essential without simply adding more plasterboard sheets, which is inefficient.
Many research studies (Alfawakhiri, 2001; Ariyanayagam and Mahendran, 2014; Feng et al., 2003; Feng and Wang, 2005; Gerlich, 1995; Gunalan et al., 2013; Keerthan and Mahendran, 2014; Kesawan and Mahendran, 2016; Ranby, 1999; Kaitila, 2002; Klippstein, 1978; Outinen et al., 2001; Sakumoto et al., 2003) have been undertaken on the fire behaviour of LSF wall panels. In comparison, such work on LSF floor panels has been limited. Sakumoto et al.’s (2003) experimental study on LSF floor panels has shown that the use of interior cavity insulation improved their FRR. However, Alfawakhiri (2001) and Sultan et al. (1998) found that floor assemblies without cavity insulation provided higher fire resistance compared to cavity insulated assemblies. Hence, past research was unable to conclude the effects of this traditional approach of using cavity insulation. Recently, Kolarkar and Mahendran (2008) developed a new composite panel system, where the insulation was sandwiched between two plasterboards and placed outside the steel frame, and suggested that the fire resistance of LSF floors and walls can be improved considerably. Such innovations in the plasterboard and insulation systems, steel joist configurations and construction methods have the potential of increasing the FRR of LSF floor systems.
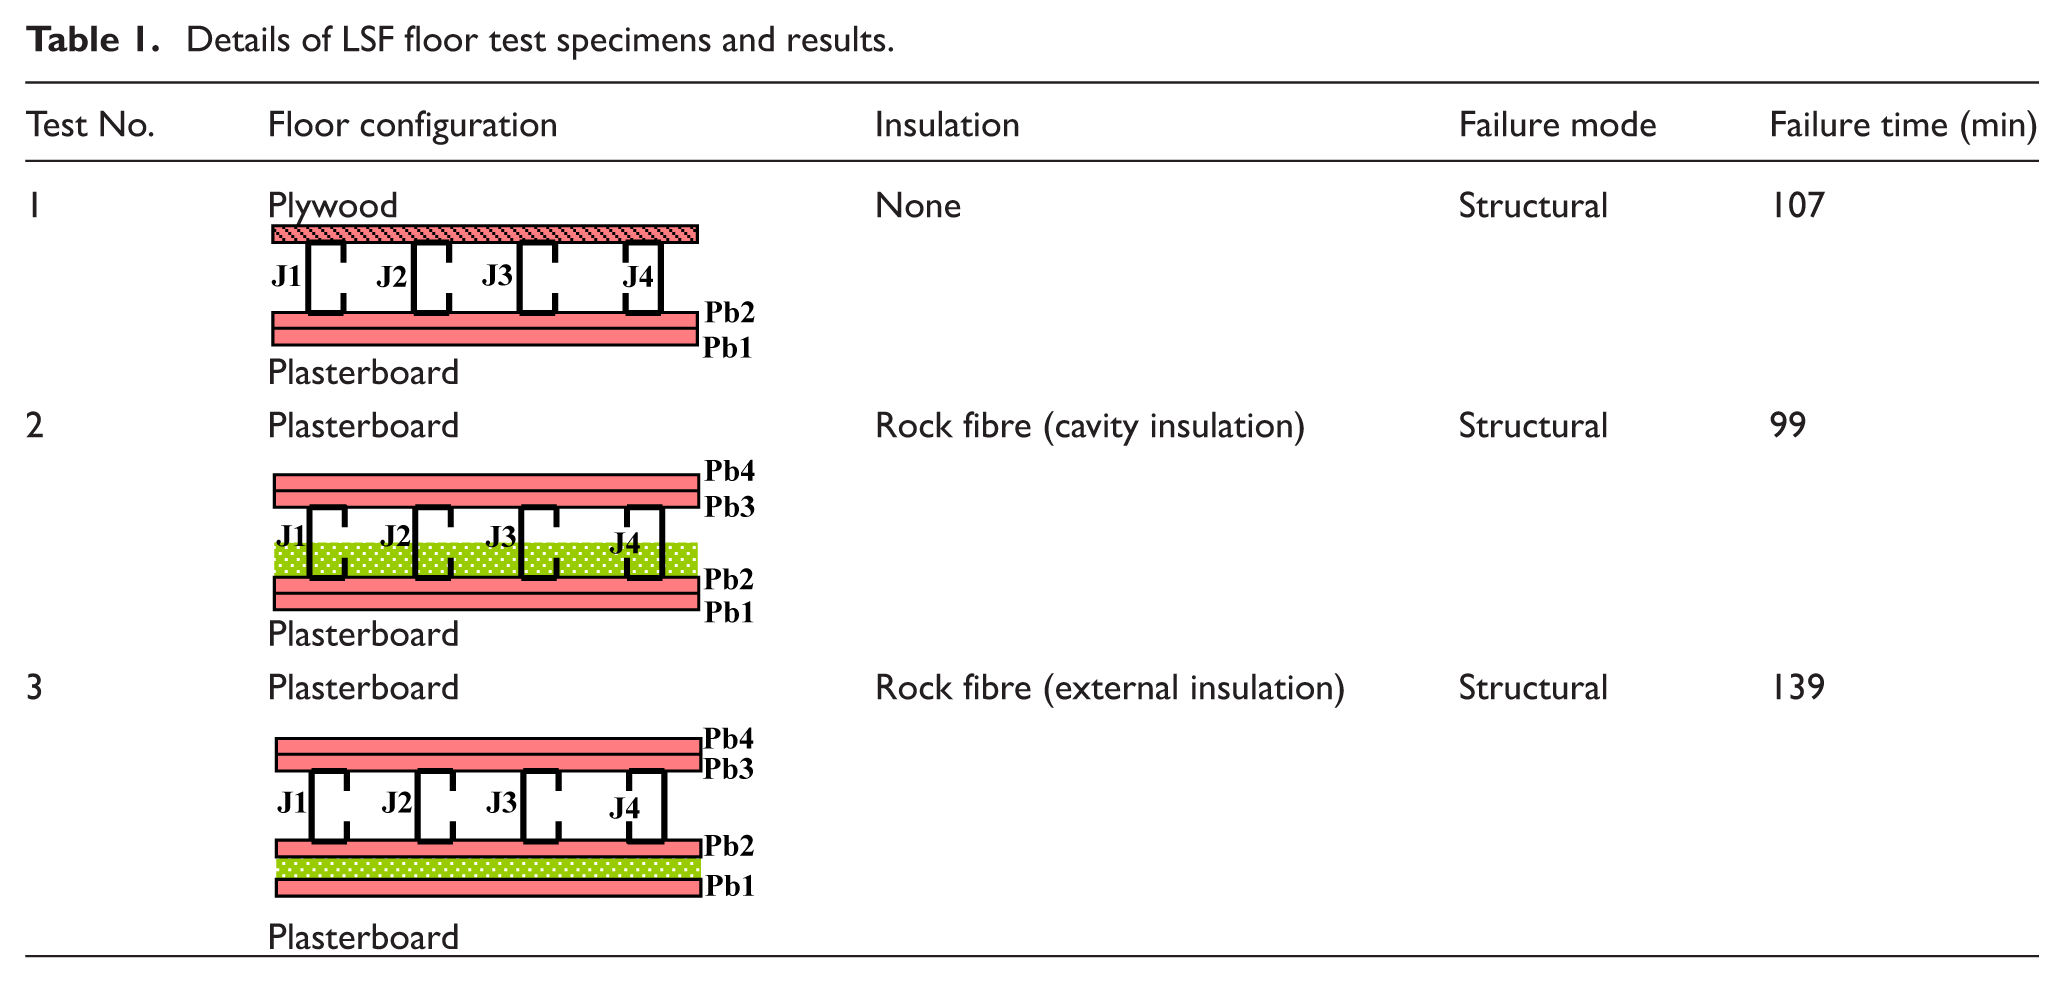
This research investigated the structural and fire performance of LSF floor systems with the new composite panel system using full-scale fire tests. In this experimental study under standard fire conditions, both the conventional (with and without rock fibre cavity insulation) and the new composite panel systems were tested. In the new composite floor system, a composite panel including rock fibre insulation between two plasterboards was used on the ceiling side of the steel frame. The LSF floor specimens were first loaded to pre-determined values and then exposed to standard fire conditions on the ceiling side (plasterboards). Table 1 gives the details of the three full-scale floor specimens used in this study. This article presents the details of the experimental study into the thermal and structural performance of the chosen LSF floor assemblies and the results.
Details of LSF floor test specimens and results.
Test specimens
Test specimens were built using four joists, two tracks, two layers of plasterboard and one layer of plywood. The floor area was more than 5 m2 (2.4 m × 2.1 m) with a span of 2400 mm and the floor specimen was simply supported at its two short sides. All the joists and tracks used were fabricated from galvanized steel sheets having a nominal base metal thickness of 1.15 mm and a measured yield strength of 612 MPa (G500 steel). The frames were made of four joists made of 180 × 40 × 15 × 1.15 mm LCSs as shown in Figure 1(a) and (b). Test frames were made by attaching the joists to the top and bottom tracks made of 182 × 50 × 1.15 mm unlipped channel sections using 12-mm-long self-drilling wafer head screws as shown in Figure 1(b) and (c).
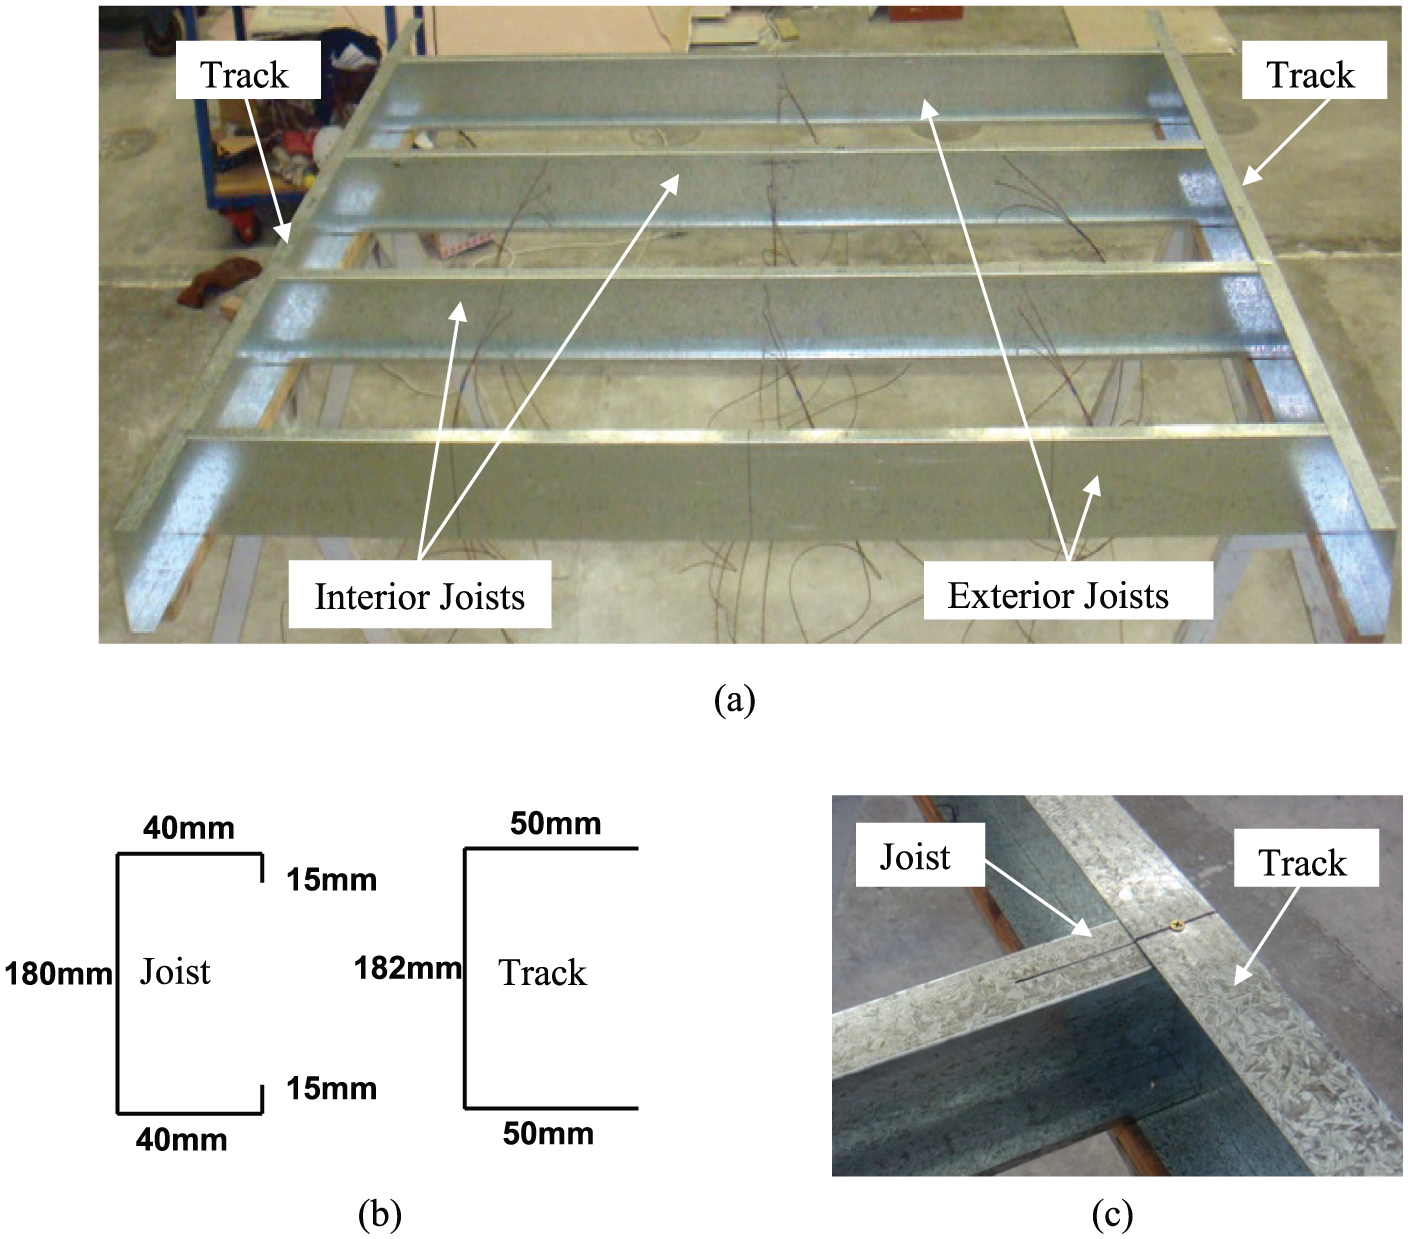
Details of LSF floor frames: (a) LSF floor frame, (b) joist and track sections and (c) screw connecting joist and track.
Test steel frames were lined on the ceiling side (fire side) by two layers of 16-mm-thick 1200 mm width × 2400 mm length gypsum plasterboards manufactured by Boral Plasterboard under the product name Firestop (850 kg/m3). The frames were lined on one side by a single layer of 19-mm-thick plywood board to simulate the sub-floor for Test Specimen 1. Two layers of the plasterboards were used in the other two tests to avoid any burning of plywood.
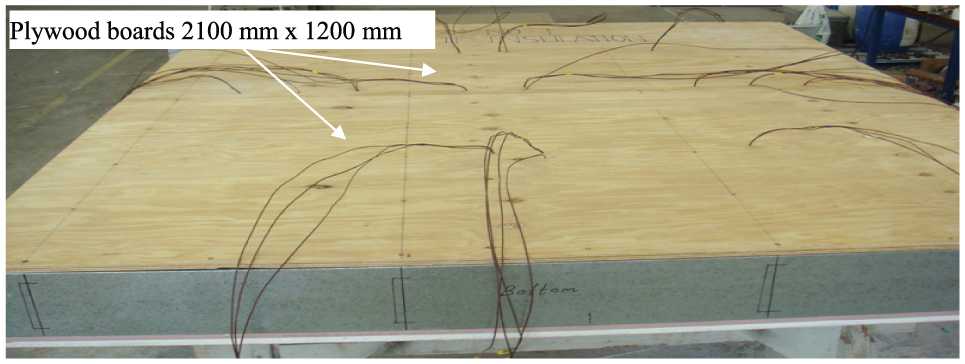
The plasterboards were placed across the steel joists and attached to the joists by 25-mm-long drill point screws. The first layer of the plasterboard was fastened at 200-mm centres in the field of the plasterboard (Figure 2(a)) while the second layer was fixed in the same manner, but their joints were staggered by 200 mm as shown in Figure 2(b). The second layer of the plasterboards was attached to the joists by 45-mm-long self-drilling bugle head screws spaced at 200-mm centres in the field of the plasterboard. A minimum edge distance of 10–15 mm was maintained for all the screws from plasterboard edges.
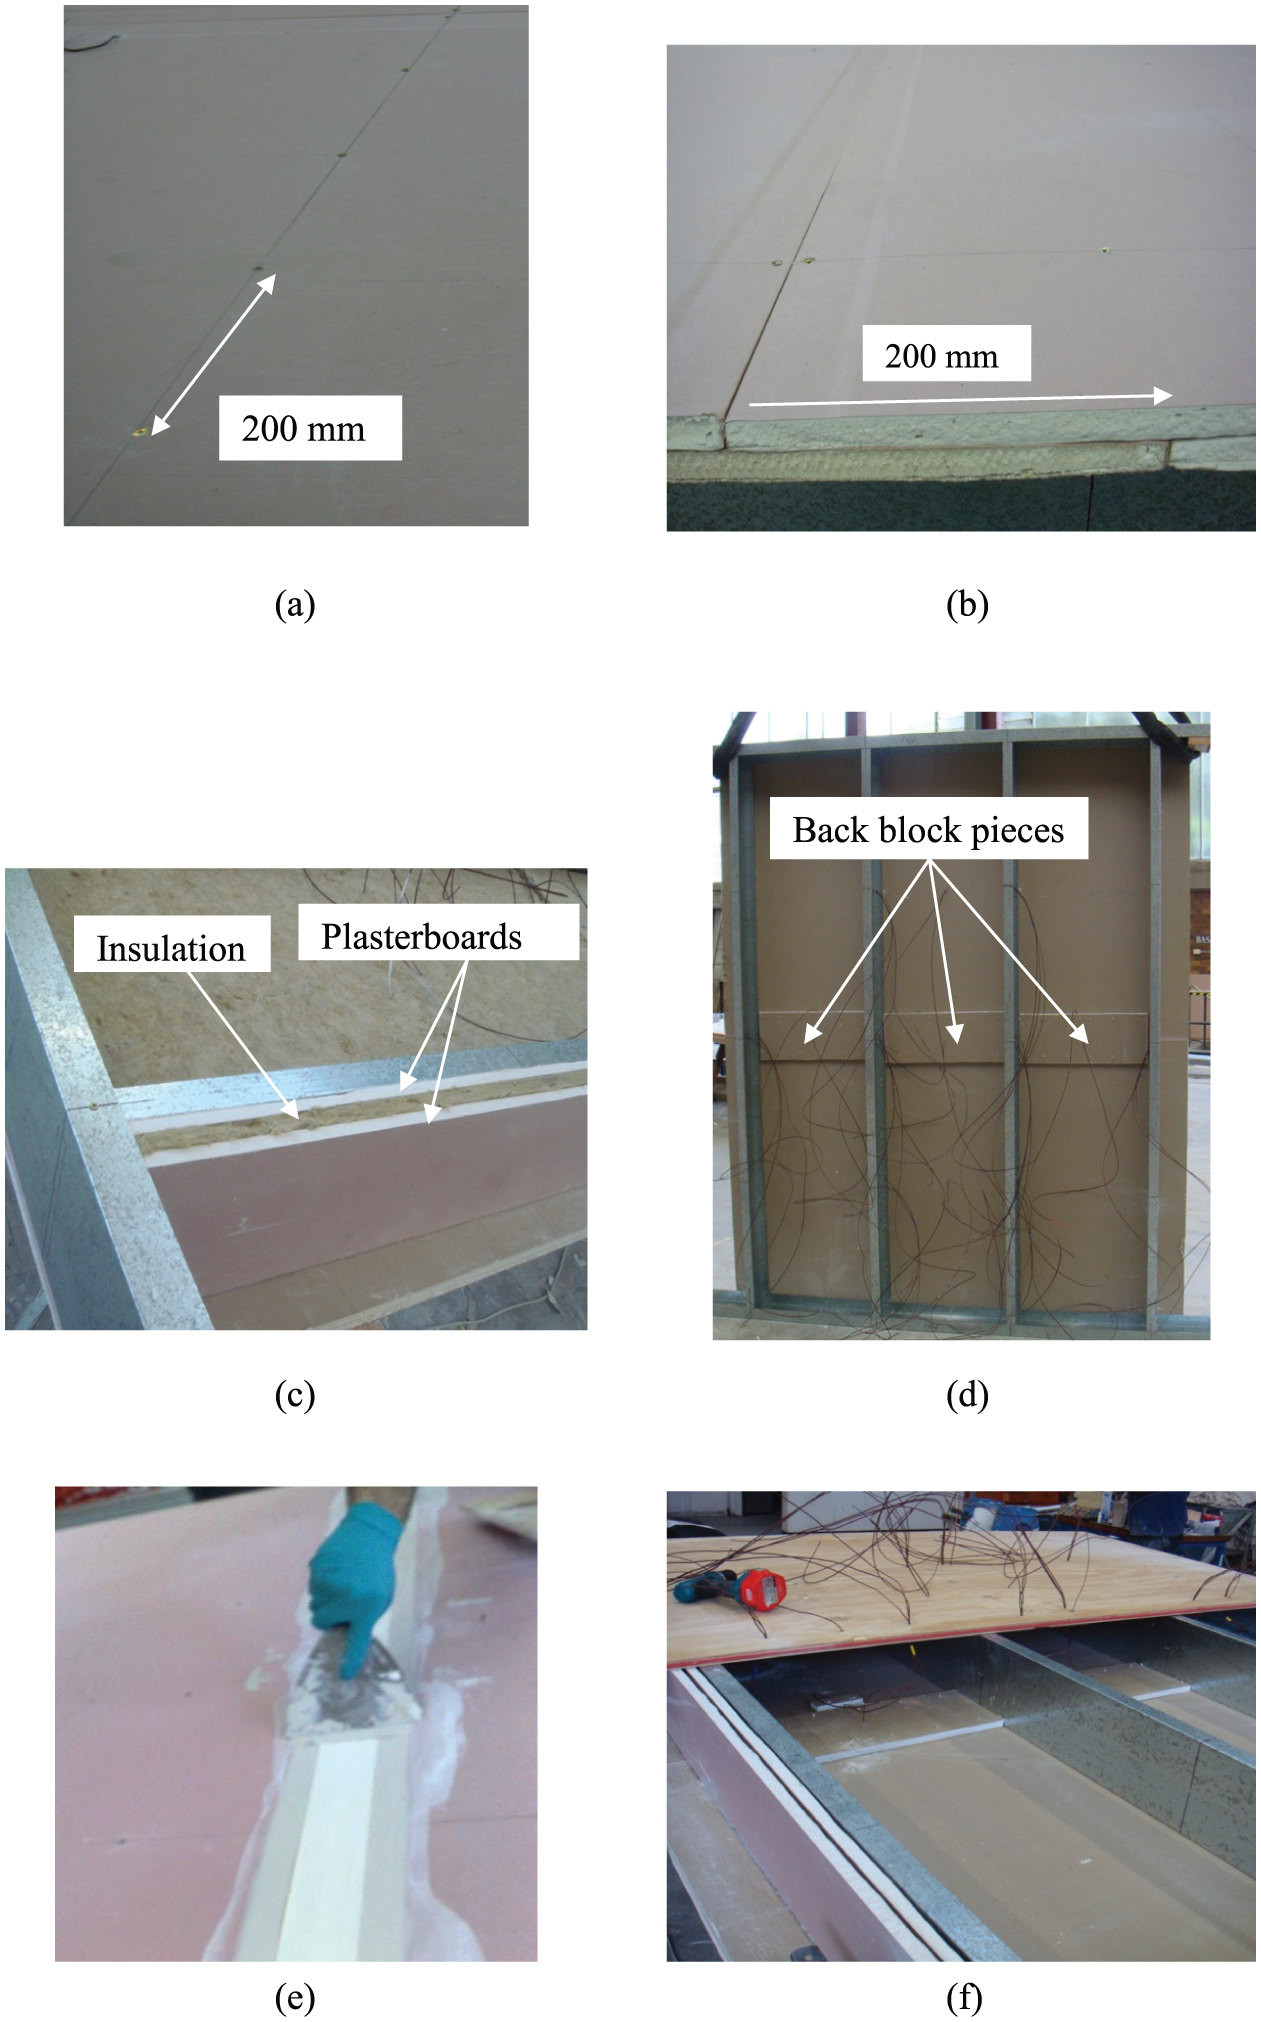
Fixing of plasterboard, insulation and plywood: (a) screw spacing along the vertical direction, (b) staggered plasterboards, (c) insulation layer next to exterior joists, (d) details of back-blocking, (e) protection of plasterboard joints and (f) fixing of plywood boards.
To prevent any heat loss from the edge of the floor, exterior joists were protected with the plasterboards and insulation as shown in Figure 2(c). The plasterboards in the first layer were back blocked as specified in AS/NZS 2589.1 (Standards Australia (SA), 1997). The 200-mm-wide back-blocking pieces were cut from 16-mm fire stop plasterboard to the required sizes and fixed between the joists to the ceiling plasterboards using 10 × 38 mm Type L screws at 200-mm centres (Figure 2(d)).
All the exposed screw heads were covered with two coats of joint compound. The joints were sealed with 50-mm-wide reinforced paper tape and covered with two coats of joint compound (Figure 2(e)). On the other side (ambient side), one layer of plywood board was fixed at right angles to the joists as shown in Figure 2(f) for Test Specimen 1. For other specimens, two plasterboard layers were used on both sides.
K-type thermocouple wires were installed to measure the temperature variations across the width and along the length of the test floor (over the plasterboard and joist surfaces). Figure 3(a) to (d) shows the attachments of the thermocouples. On the joists, the thermocouple wires were attached to the hot flange, web and cold flange.
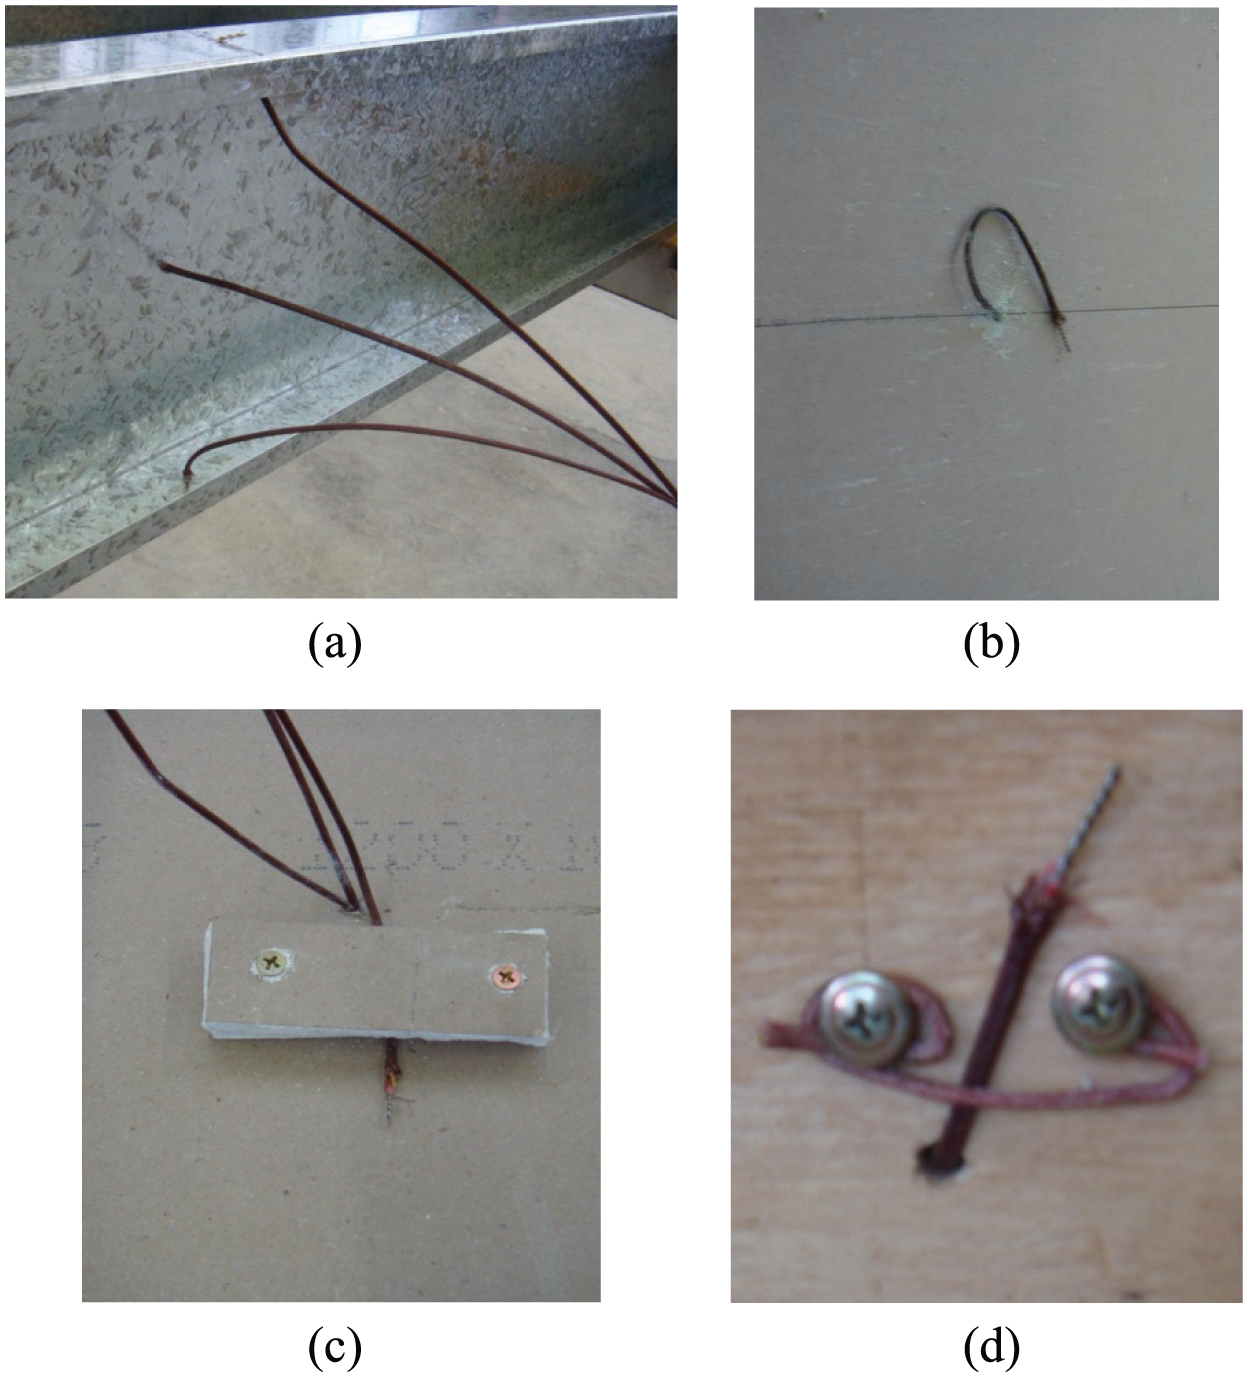
Fixing of thermocouples: (a) joist, (b) plasterboard, (c) inside the cavity fire side and (d) inside the cavity ambient side.
Test Specimen 1
The test steel frame was lined on the ceiling side (fire side) by two layers of the plasterboard. The base layer of the plasterboard on the fire side was attached first across the joists with its associated K-type thermocouples to the steel frame. The face layer of the fire side plasterboard was fixed in the same manner. The floor panel was then turned over to fix the ambient side plywood. Before fixing this plywood board, all the thermocouples attached to the base layer plasterboard on the fire side were drawn to the ambient side through tiny holes drilled in the plywood boards. Figure 4 shows the assembled Test Specimen 1.
Test specimen 1.
Test Specimen 2
In Test Specimen 1, there was considerable smoke during the fire test, which was followed by plywood burning despite being on the ambient side. Hence, plywood was not used in Test Specimen 2. Two plasterboards were used on both sides with cavity insulation. Three 25-mm-thick layers of rock fibre insulation were used in the cavity space between the joists after fixing the two plasterboards on the fire side along with their associated thermocouples. Figure 5(a) shows the installation of the rock fibre cavity insulation. The cavities of the individual joists and tracks were also packed with rock fibre insulation to avoid the formation of air pockets within the floor cavity. Figure 5(b) shows the positioning of the base layer plasterboard on the ambient side to facilitate the passing of thermocouple wires through holes drilled at appropriate places. After fixing the base layer plasterboard, the face layer plasterboard on the ambient side was fixed in a manner similar to the base layer.
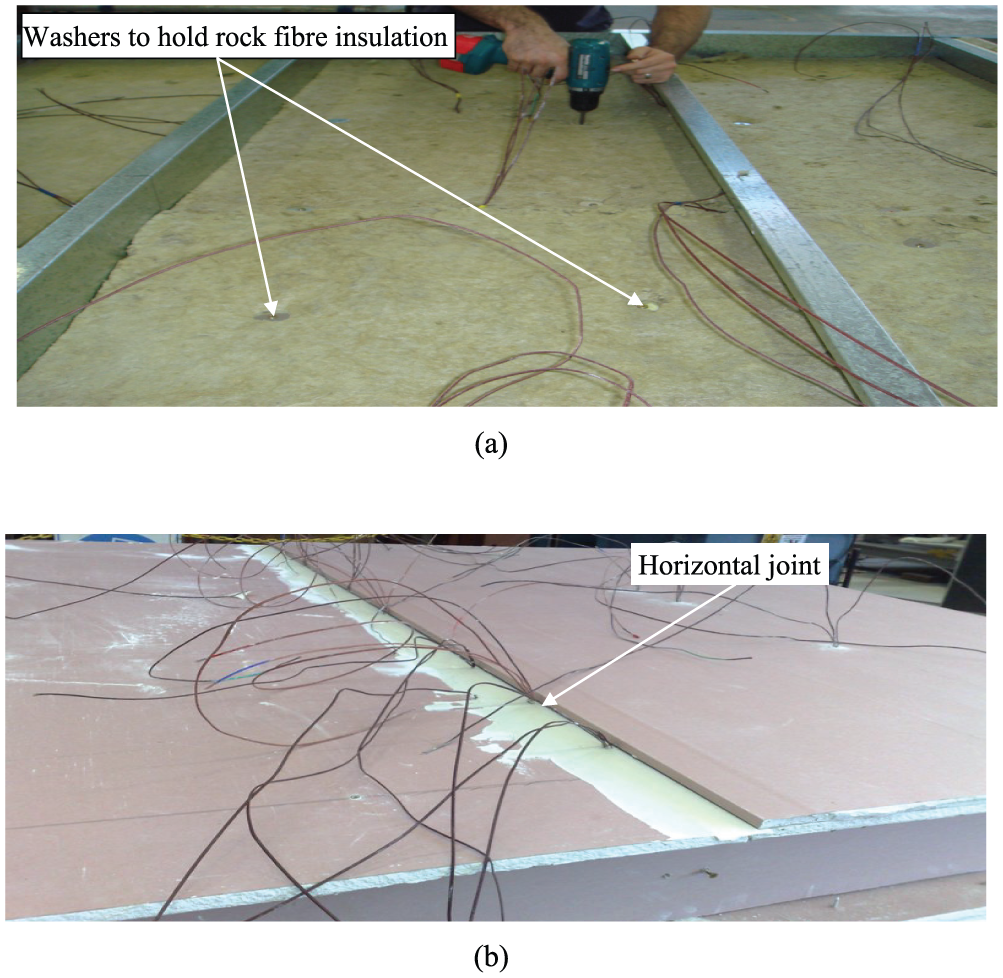
Test specimen 2 with cavity insulation: (a) rock fibre insulation in cavity and (b) placing the ambient side plasterboard face layer.
Test Specimen 3
In this test specimen, the new composite panel with external insulation was used. The base layer plasterboard on the fire side was attached across the joists with its associated thermocouples to the steel frame. Two 13-mm plasterboard strips were then fixed to the base layer plasterboards (Figure 6(a)) along the periphery of the panel giving a total depth of 26 mm. The space generated by these edge strips was filled with a single layer of 25-mm-thick rock fibre mat (Figure 6(b)). Finally, the face layer plasterboards were fixed on the fire side (sandwiching the insulation between the face and base layer plasterboards). The floor specimen was then turned over to fix the two ambient side plasterboards as shown in Figure 6(c).
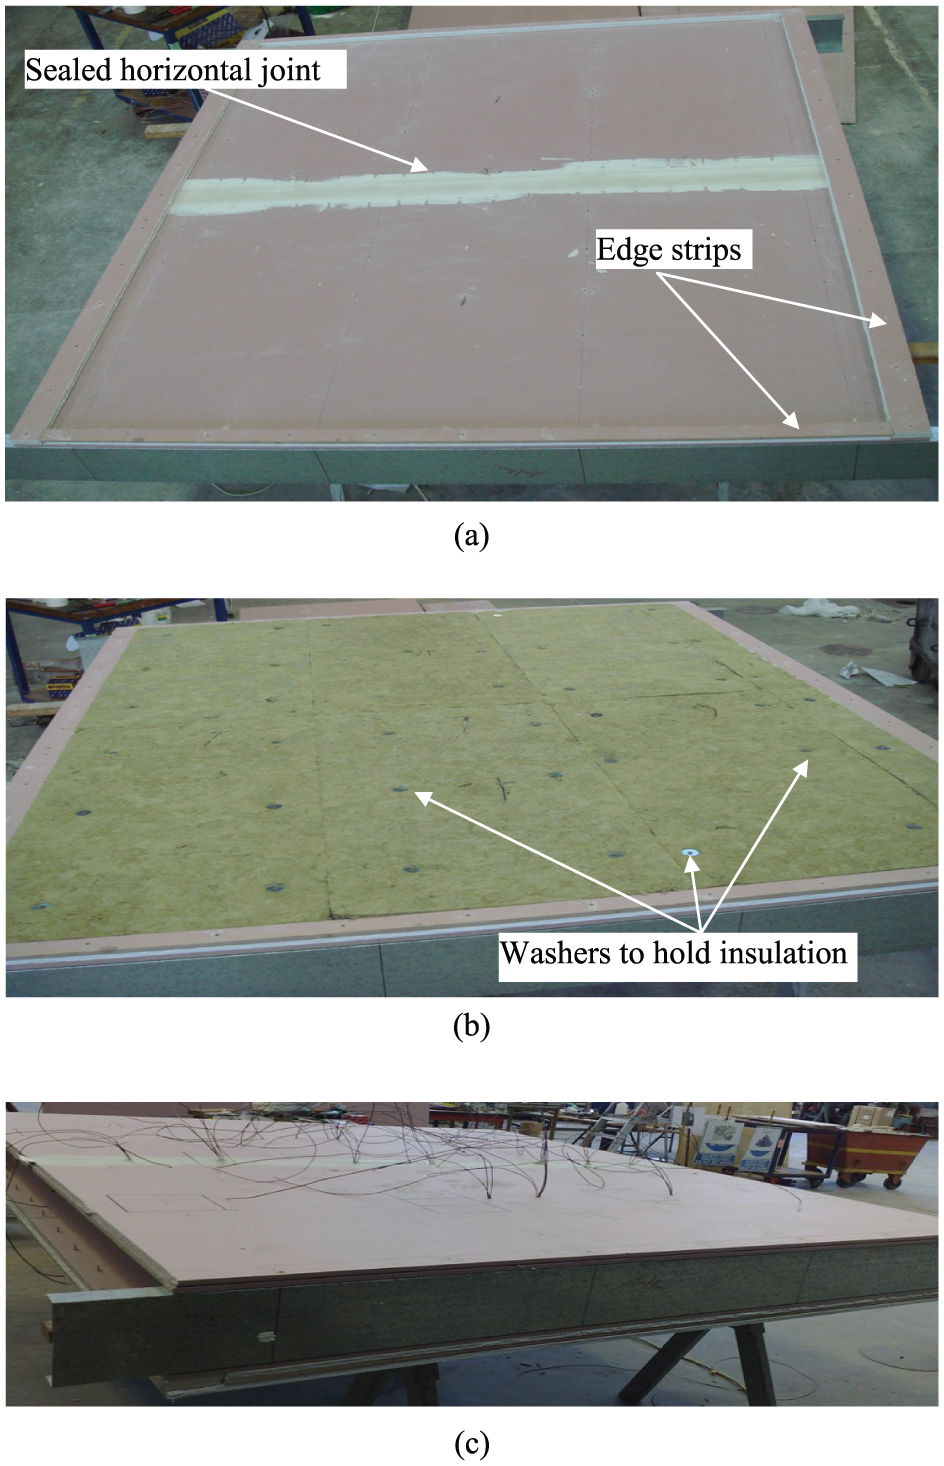
Test Specimen 3 with external insulation: (a) edge strips placed to hold the insulation, (b) after placing the rock fibre insulation and (c) after fixing the ambient side external layer.
Test arrangement
Gas furnace
A propane fired gas furnace mounted on a carriage and wheel arrangement, with internal dimensions of 2.1 m width, 2.4 m height and 0.3 m depth, was used to conduct the fire tests. To start the test, the carriage was moved forward to make contact with the large steel frame holding the test floor specimen, thereby completing the combustion chamber. On starting the furnace, the specimen was exposed to heat from one side as desired. The furnace was designed to deliver heat in accordance with AS 1530.4 (SA, 2005b) to develop the required standard fire time–temperature curve.
Loading frame
A heavy steel frame was specially constructed to support the test floor specimens. It consisted of two columns firmly bolted to the strong floor and a universal beam connecting the two columns to form an ‘H’-shaped portal frame (Figure 7(a)). The floor specimen was located within this portal frame with its ends simply supported by angle sections as shown in Figure 7(b). The gas furnace only allowed test floor specimens to be set in a vertical position. Hence, the transverse loads on the floor specimens were applied in a horizontal direction.
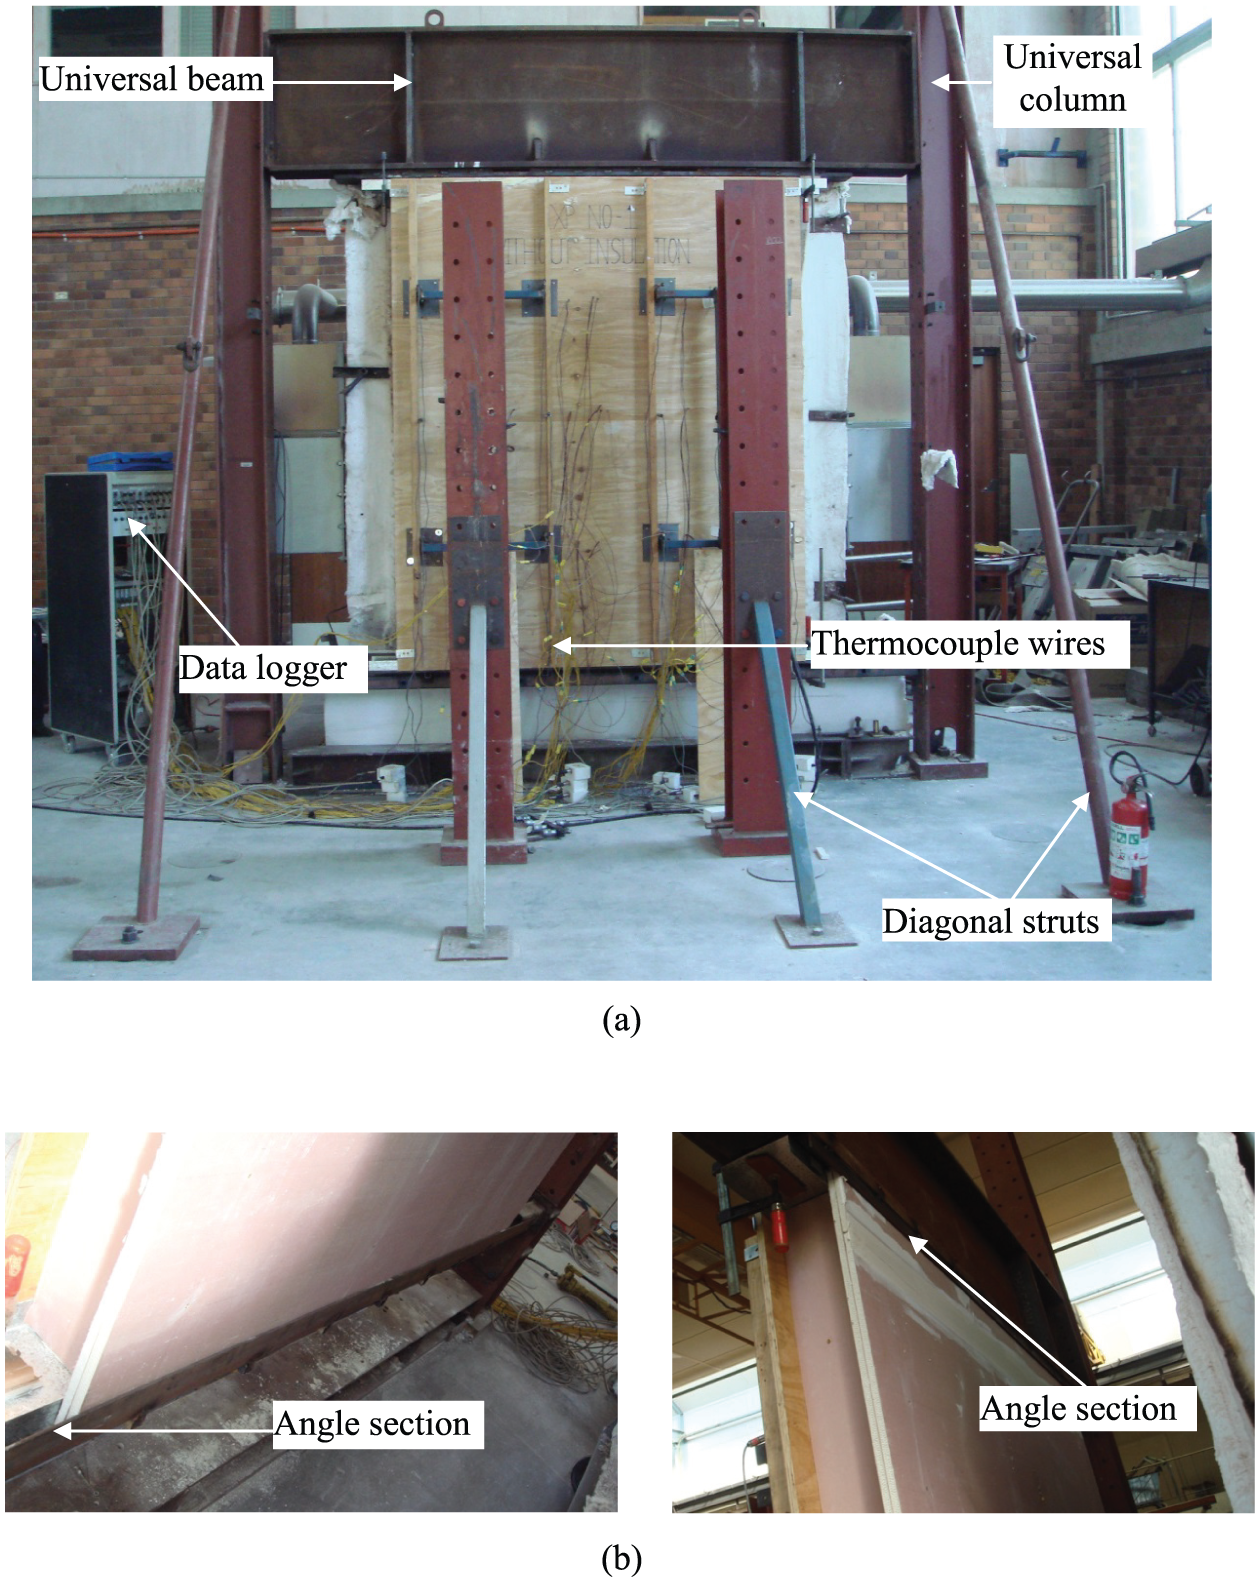
Fire test set-up: (a) gas furnace and portal frame and (b) specimen supports.
In order to simulate a uniformly distributed loading present in LSF floor systems, a load distribution system was developed (Figure 8(a)). Each load distribution unit consisted of a main spreader beam and two secondary spreader beams. At the ends of each secondary beam, there were 180 mm × 180 mm loading plates to apply the loads to each joist. The spreader beams had bolted pinned connection at its centre and ends. Each load distribution unit with four loading points was able to load two joists at two loading points each. The main spreader beam was connected to the end of an Square Hollow Section (SHS) using bolts as shown in Figure 8(b). The other side of the SHS was welded with a nut so that the loading cell end could be screwed into it. The load was applied using two hydraulic jacks that were connected to the load distribution units via load cells. A single pump was used to ensure equal loading to the joists.
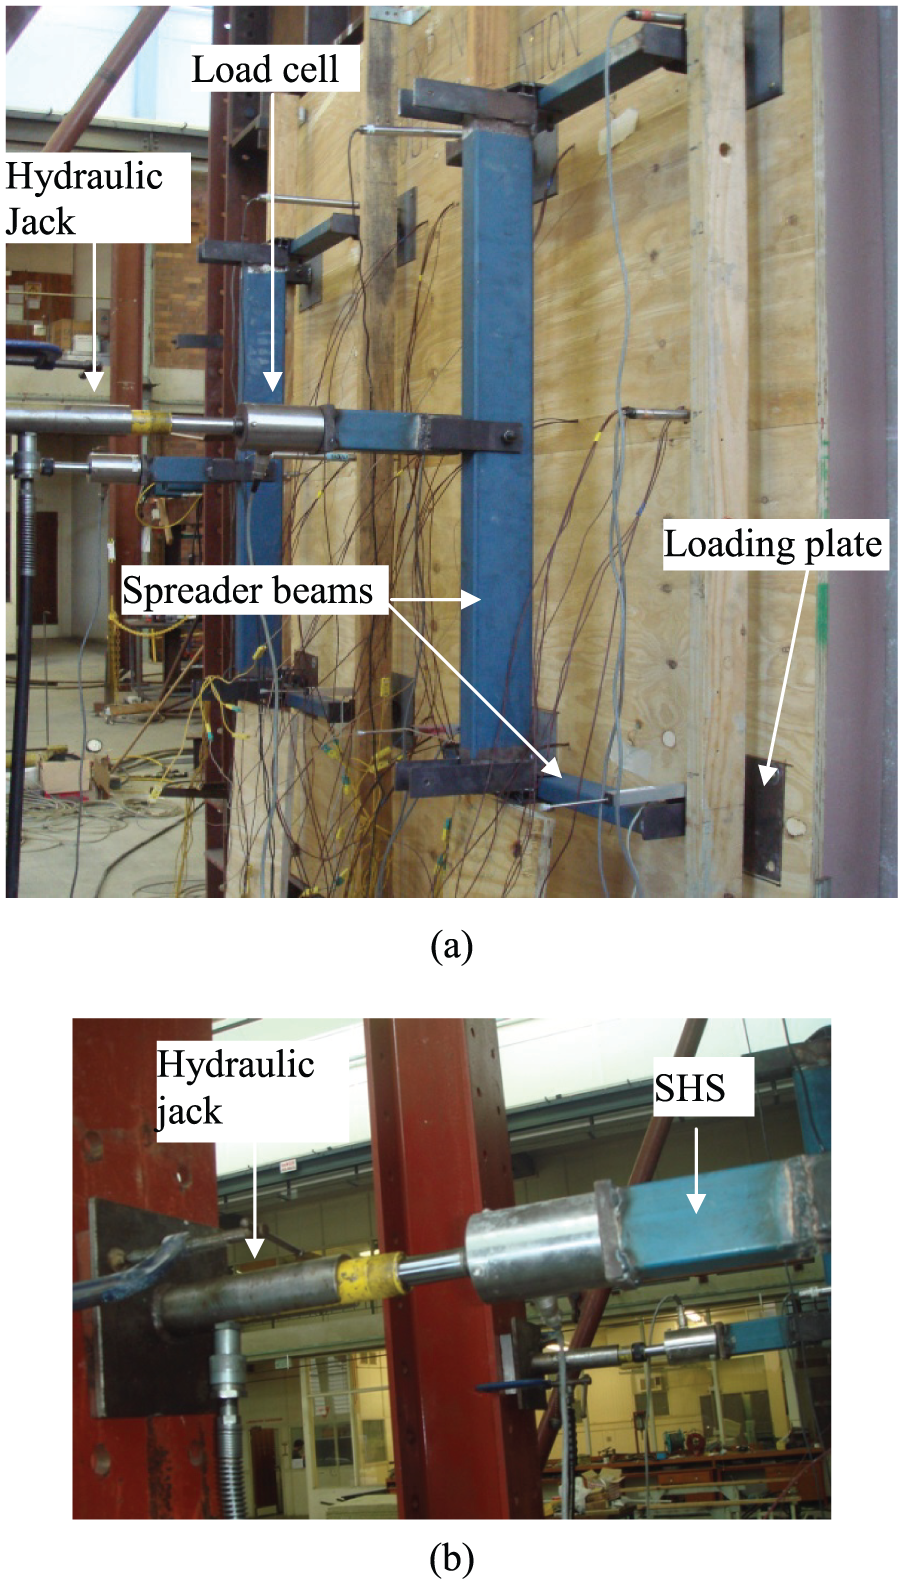
Loading system: (a) load distribution unit and (b) load cell connected to hydraulic jack.
Deflection and temperature measurements
To measure the out-of-plane deflections of floor specimens, 12 linear variable displacement transducers (LVDTs) were used at 0.25L, 0.50L and 0.75L (where ‘L’ is the joist length) along the length of each joist as shown in Figure 9. The transducers were attached to a series of wooden beams in front of the specimen.
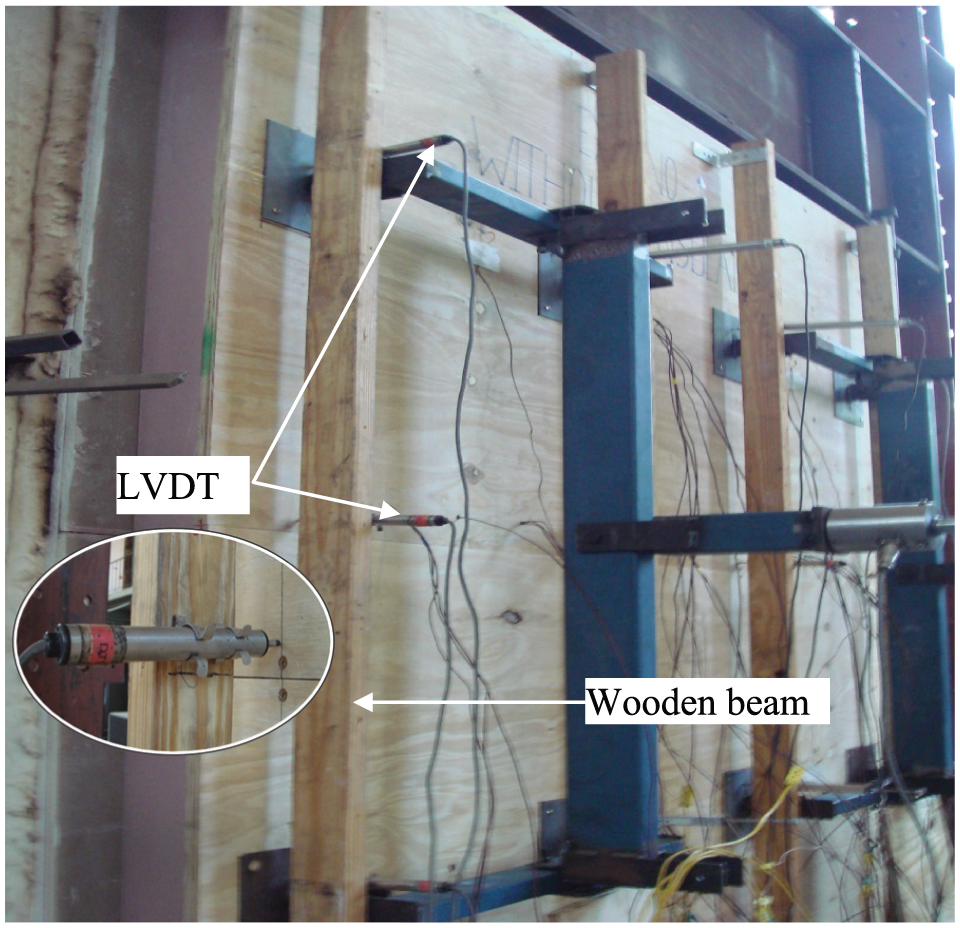
LVDTs for deflection measurements.
K-type thermocouples were used to measure the temperature development across the floor specimens. The joist temperatures were measured along the interior joists at 0.25L, 0.50L and 0.75L. At each point, three thermocouples were attached to measure the temperatures of the hot flange, web and cold flange, thus giving a total of nine thermocouples per joist. For exterior joists, they were attached only at 0.5L. This gave a total of 24 thermocouples that allowed the determination of the average joist temperature and the temperature gradients across the joist cross section and along the joist length.
To measure the plasterboard surface temperatures, three sets of 12 thermocouples were attached to these surfaces between the joists at 0.5L. Two more sets of thermocouples were attached at 0.25L and 0.75L height along the mid-vertical line assembly between the two interior joists. This gave a total of 44 thermocouples for Test Specimen 1 (Figure 10(a)). For Test Specimen 2 with cavity insulation, additional thermocouples were installed between the plasterboard surfaces on the ambient side at mid-height (Figure 10(b)), giving a total of 47 thermocouples. For Test Specimen 3 with external insulation, five more thermocouples were installed to measure the temperature across the insulation layers at mid-span, thus giving a total of 52 thermocouples (Figure 10(c)). To measure the average temperature on the ambient side, five thermocouples were used, one at the centre of the area and one at the centre of each quarter section as mentioned in AS 1530.4 (SA, 2005b). To measure the temperature at various other points on the ambient side, an infrared gun was also used.
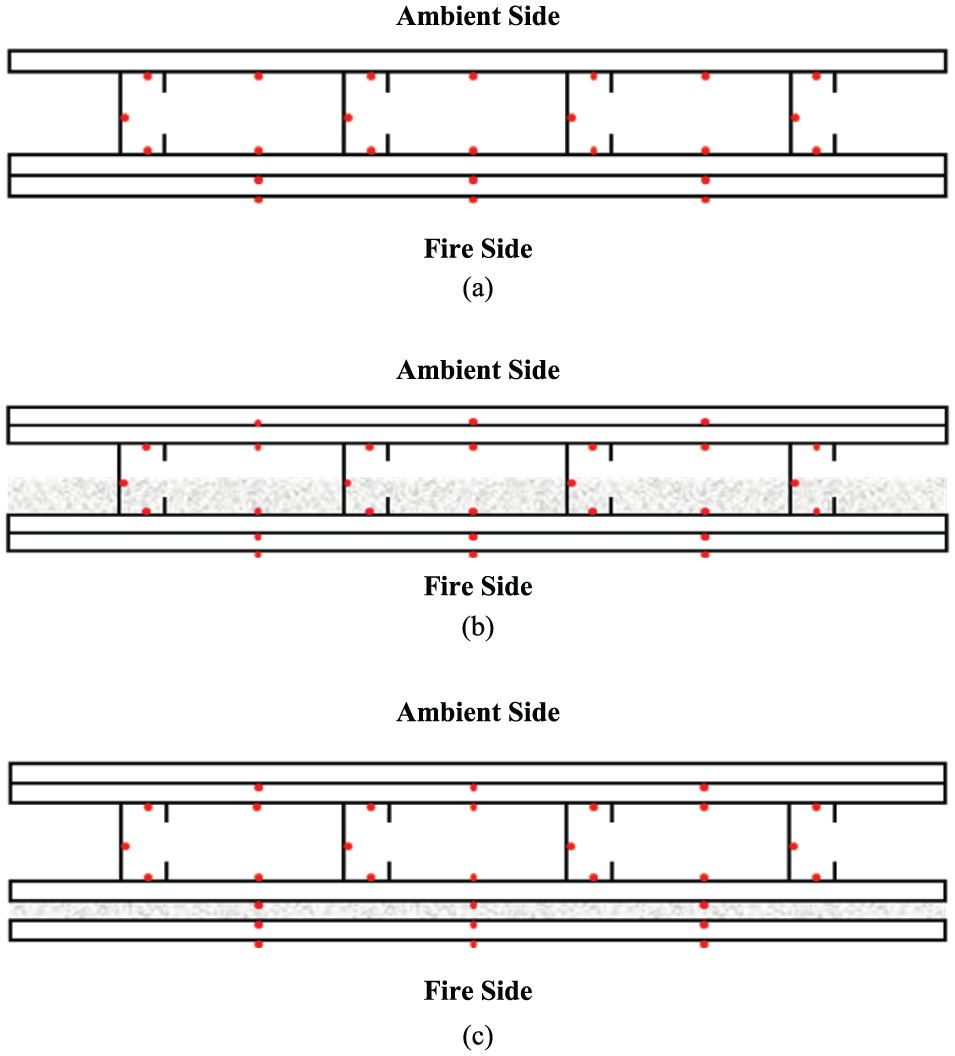
Thermocouple locations: (a) Test Specimen 1 without insulation, (b) Test Specimen 2 with cavity insulation and (c) Test Specimen 3 with external insulation.
Test method
The test floor specimen was installed within the heavy steel frame as shown in Figure 7. After proper positioning of the floor with furnace location, the top track was fastened to the top beam on each side. The furnace was then moved next to the test floor specimen and this completed the combustion chamber of the furnace with the test floor specimen forming the fourth side of the chamber facing the burners. This arrangement ensured that only one face of the test specimen was exposed to fire conditions. The floor specimen width was 20 mm less than that of the furnace opening, which gave a gap of 10 mm on each side of the specimen. This gap was packed with Isowool, a non-restraining and non-combustible mineral fibre.
A target load of 18 kN per jack (9 kN per joist) was applied to the specimen first using the two hydraulic jacks. This target load was determined based on a load ratio of 0.4 where the load ratio is the target load in the fire test to the ultimate failure load of the floor specimen at ambient temperature. The latter ultimate failure load was predicted to be 23 kN per joist based on AS/NZS 4600 (SA, 2005a) design rules and numerical modelling (Baleshan and Mahendran, 2016a, 2016b). Following the application of the target load, the furnace was started. During the fire test, the furnace temperature was regulated such that the average temperature recorded by the control thermocouples inside the furnace followed the standard cellulosic time–temperature fire curve based on AS 1530.4 (SA, 2005b). The load of 18 kN per jack was maintained throughout the fire test. During the fire test, the lateral displacements, the temperature readings from all the thermocouples and the furnace pressure readings were taken at intervals of 1 min. The test was stopped immediately following the failure of the floor specimen and the time to failure recorded. Test specimen was assumed to have failed when the applied load could not be maintained. This was also confirmed by the measured load–displacement/time graph, which showed rapid load reduction.
Results of Test Specimen 1
Structural and fire behaviour of Test Specimen 1
Smoke was observed after 3 min (Figure 11(a)) due to the burning of the plasterboard paper on the exposed side. This intensified after 10 min associated with steam escaping from the outer edges of the specimen. After the complete burning of the paper and the conversion of water into steam from the plasterboard, there was steady burning with little or no smoke or steam, although smoke and steam resumed with subsequent layers of plasterboard heating up from 30 to 40 min. After 70 min, considerable smoke appeared because the exposed plywood boards started to burn (Figure 11(b)).
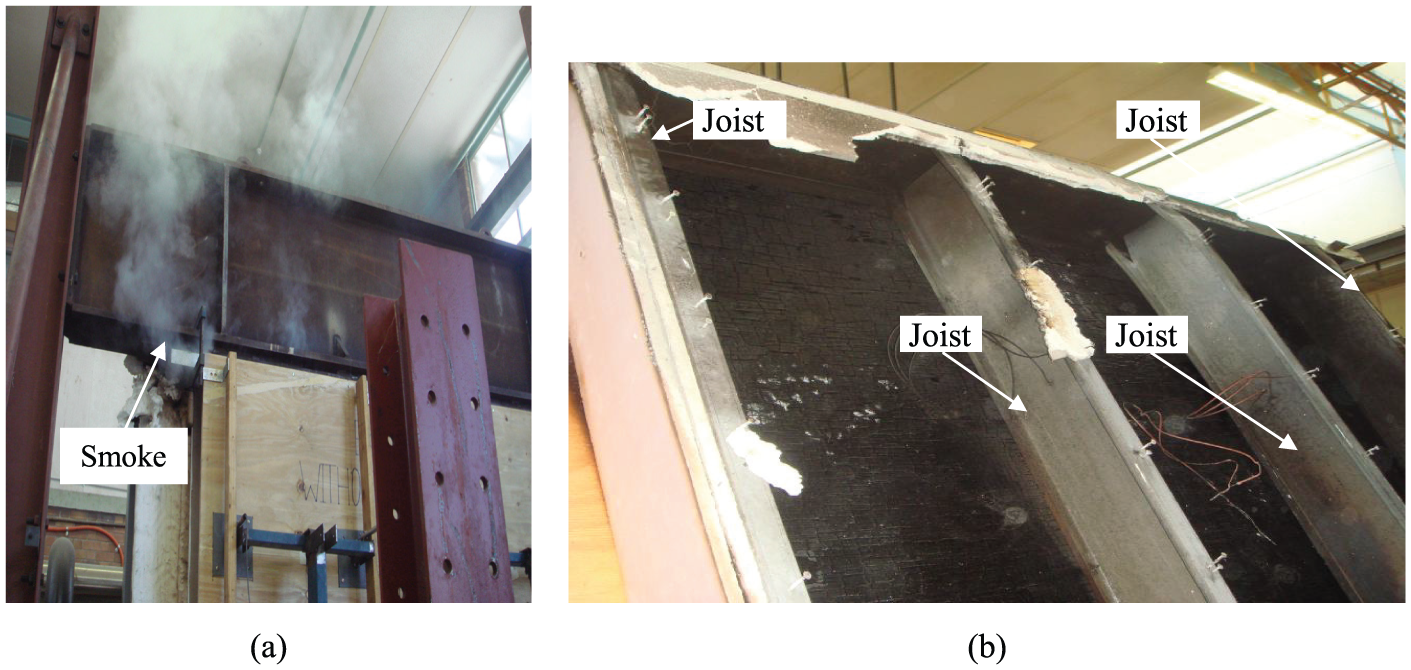
Fire performance of Test Specimen 1: (a) heavy smoke and (b) test specimen after the fire test.
Lateral deformation of the floor specimen could be seen by 80 min and then the failure was sudden at 107 min with the load quickly dropping with the joists moving in the inward direction and bending the plywood on the ambient side. The measured ambient surface temperatures (<90°C) were well below the insulation failure temperature of 140°C throughout the test. The failure was due to the structural failure of the joists.
On rolling the furnace back to expose the plasterboard on the fire side, it was noted that the exposed plasterboard pieces, especially at the top, had fallen off as it was the first layer of the fire side. All four joists failed near the top, due to the higher temperatures in the chamber at the top caused by the upward movement of hot air. Due to the plasterboard fall-off, the joists in this area not only lost their lateral support from the plasterboard on the fire side but also were severely exposed to higher temperatures. By visual inspection, it was clear that Joist 2 was the first to fail. Lateral deflection graphs (Figure 14) showed that Joist 2 had the maximum deflection and also the sudden deflection change. The upper and lower tracks supporting the joists were relatively undamaged and were seen holding the joists firmly in place. The plywood boards on the ambient side were intact giving good lateral support to the compression flange of the joists, and hence, the flexural torsional buckling of joists was fully prevented throughout the test. When the exposed plasterboards were removed, the presence of local web buckling waves was seen along Joist 1, confirming the occurrence of local buckling of joists before the ultimate failure (Figure 12(c)).Figure 12(a) and (b) shows the failures of joists at their supports.
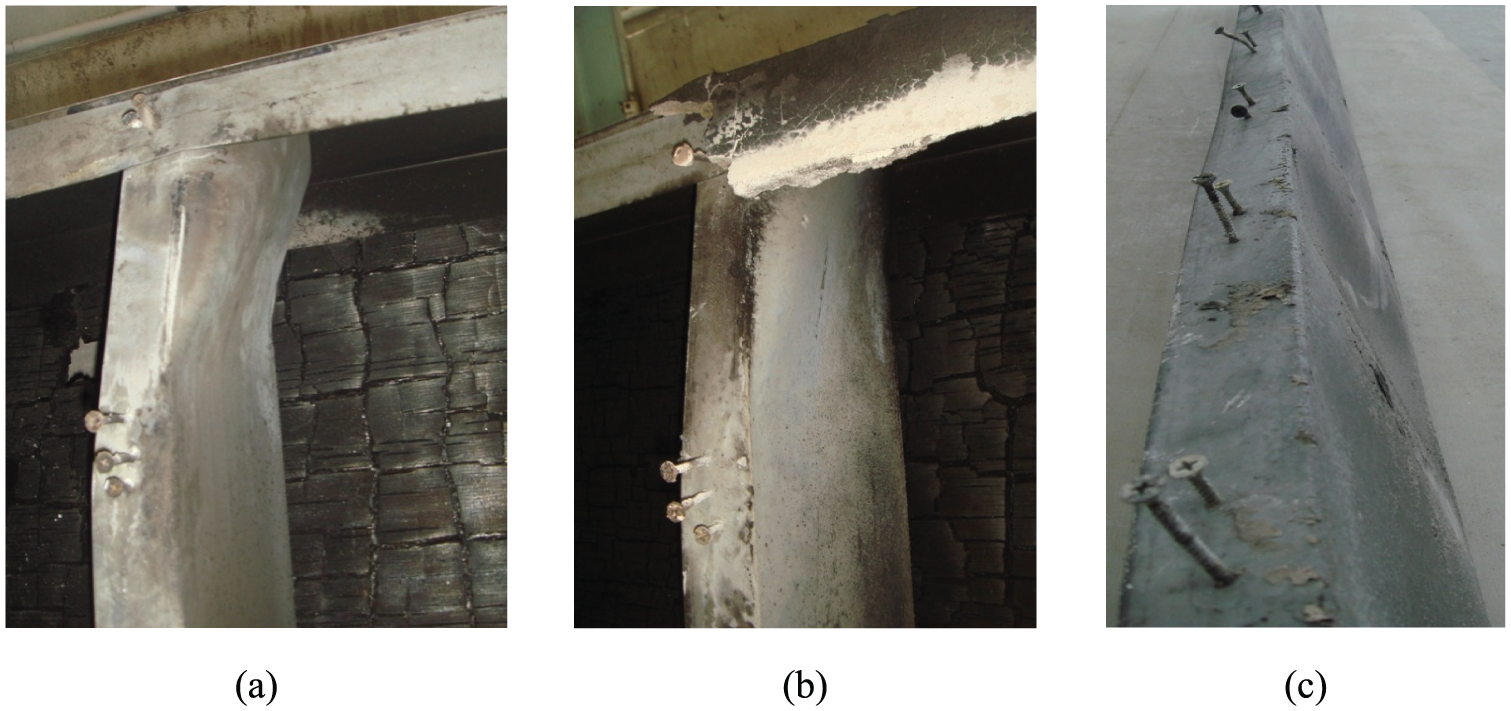
Failure modes of joists in Test 1: (a) Joist 2, (b) Joist 3 and (c) Local buckling of Joist 1.
The cavity facing surface of plywood board on the ambient side was burnt and had built up a charred layer (Figure 11(b)), but the other surface of plywood was in good condition, thus maintaining the integrity of the floor. Insulation failure was also not detected as the temperature on the ambient surface was much lower than the limiting temperature given in AS 1530.4 (SA, 2005b) until the end of the test.
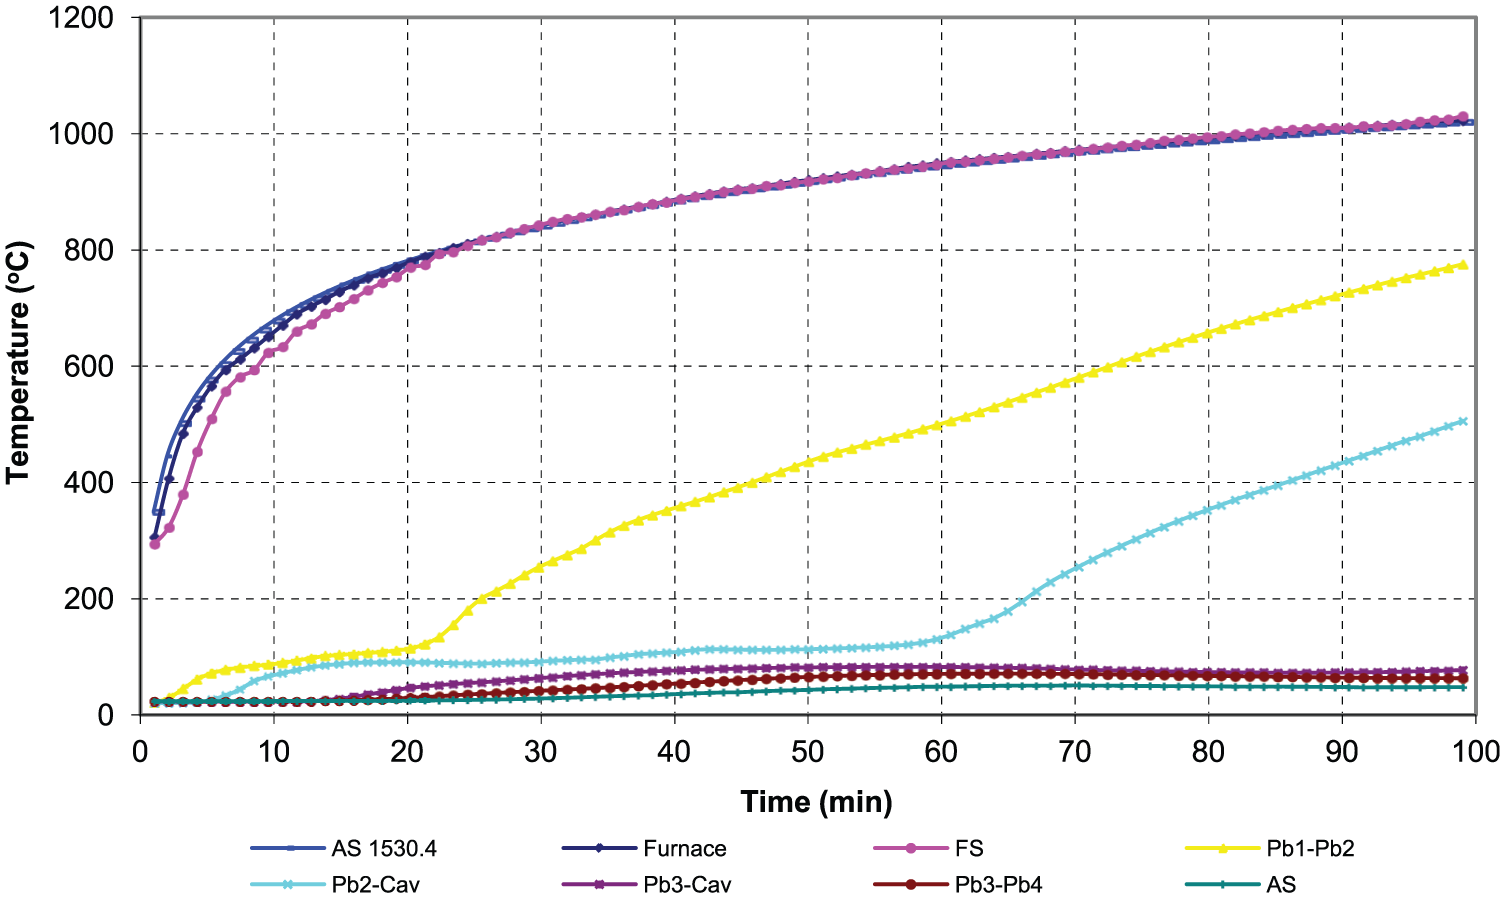
Time–temperature profiles of Test Specimen 1
Figure 13 presents the time–temperature profiles of plasterboard and plywood surfaces (see Table 1 for notations). It shows that the time–temperature profile of the furnace and the exposed face of the floor followed the standard time–temperature curve as defined by AS 1530.4 (SA, 2005b).
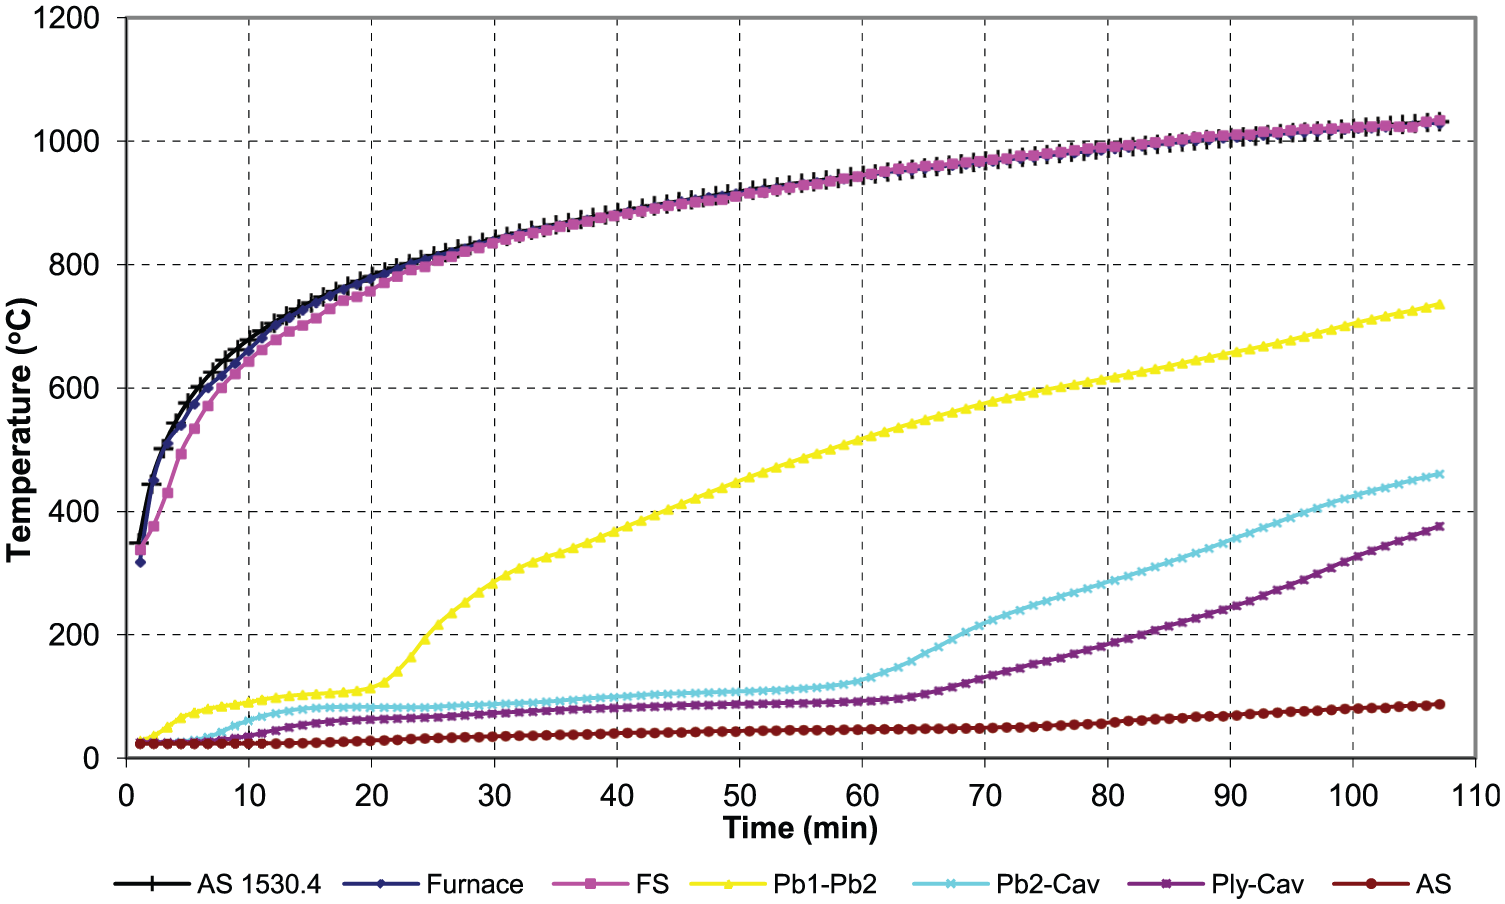
Average time–temperature profiles of plasterboard and plywood surfaces in Test Specimen 1.
Lateral deflection behaviour of Test Specimen 1
Figure 14 shows the lateral deflections of the floor during the fire test. The sudden increase in lateral deflection in these figures confirms the time of failure. Around this time, the average temperatures across the hot flanges, webs and cold flanges were 450°C, 400°C and 340°C, respectively.
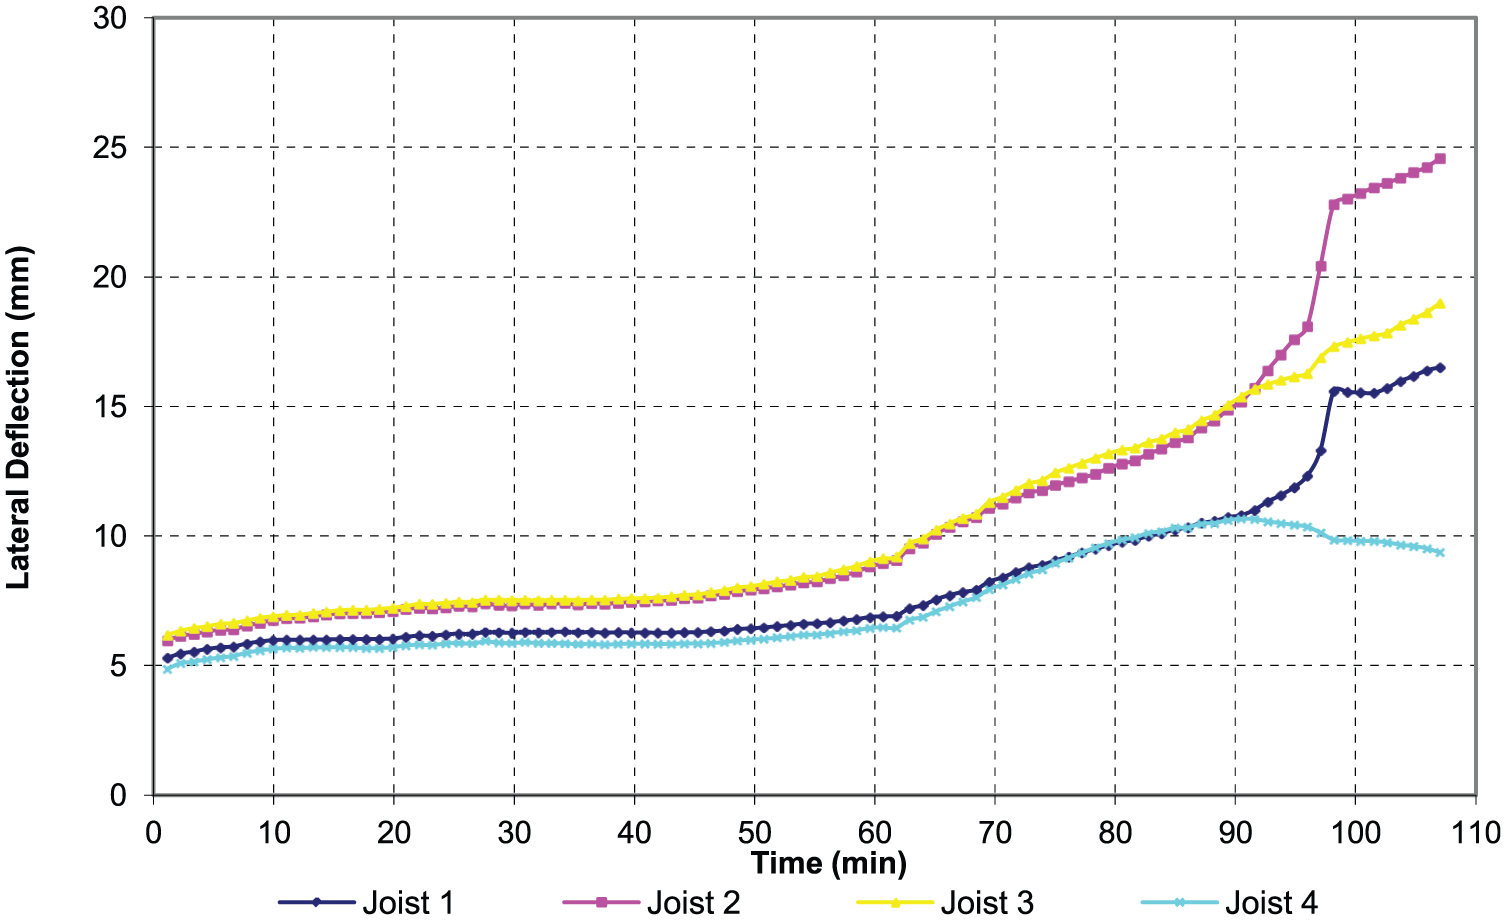
Lateral deflection–time profiles of Test Specimen 1.
Results of Test Specimen 2
Structural and fire behaviour of Test Specimen 2
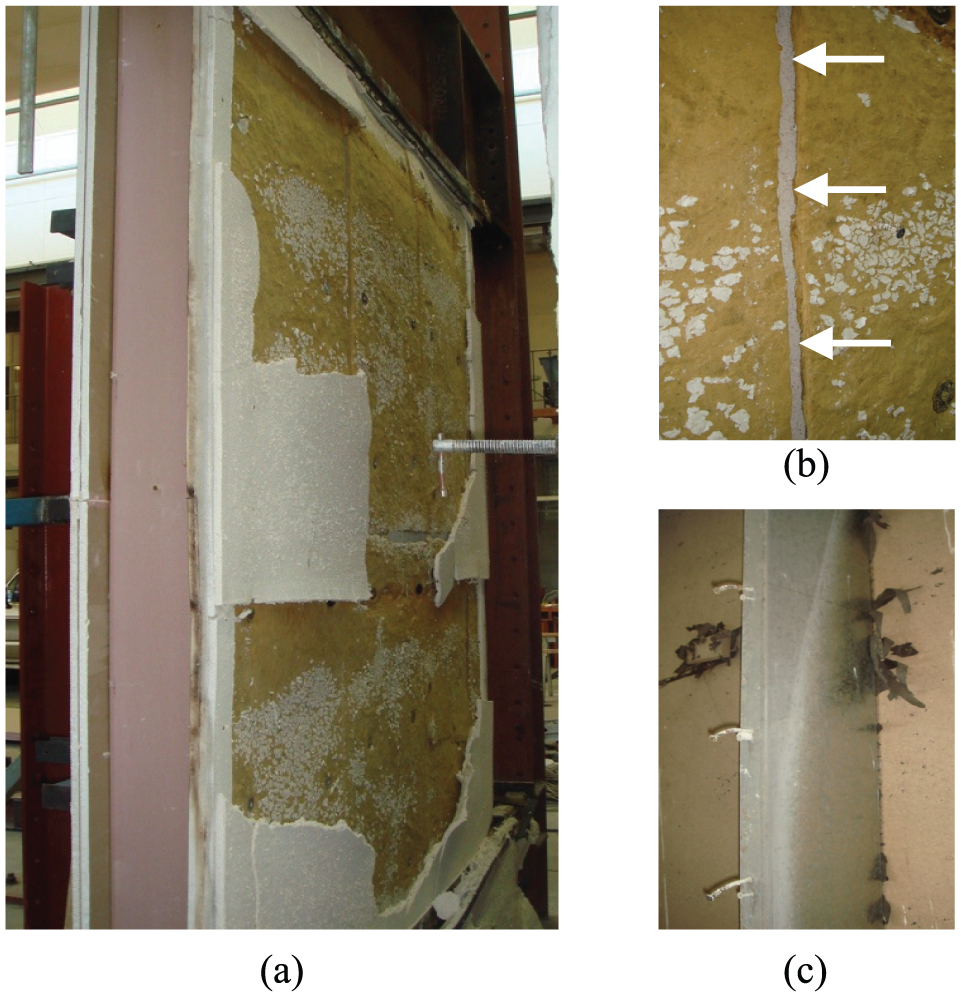
The initial response of Test Specimen 2 was similar to that of Test Specimen 1. Smoke was seen due to the burning of plasterboard papers which was different to Specimen 1 that had plywood on one side. Only the face layer of the fire side plasterboards had fallen off partially at the end of the test (Figure 15(a)). The rock fibre cavity insulation was almost fully intact with only the outer layer of insulation having lost its integrity at certain locations as shown in Figure 15(b). On stripping the cavity insulation from the test floor, it was noted that both ambient side plasterboards remained in good condition.
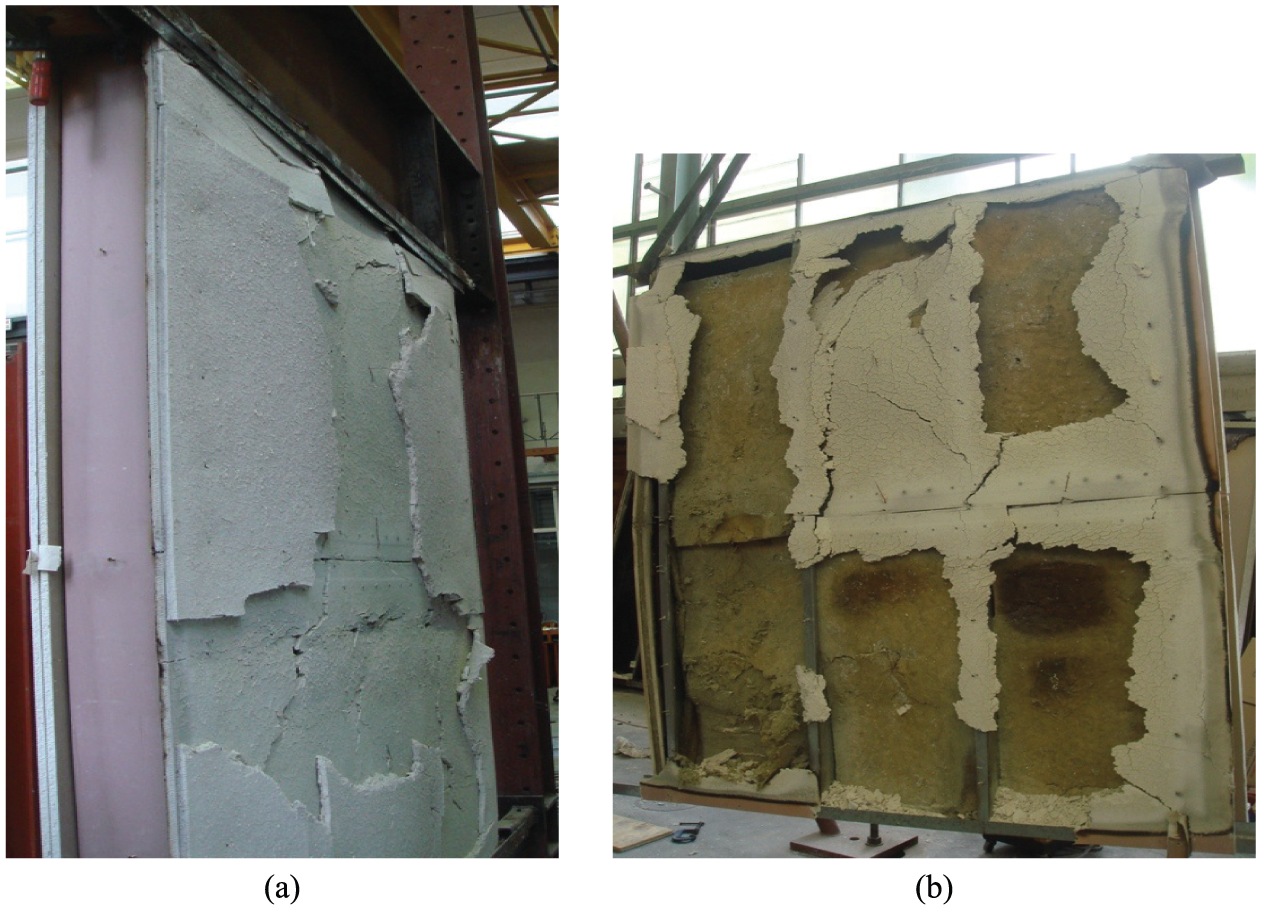
Fire performance of Test Specimen 2: (a) exposed plasterboards and (b) cavity insulation (rock fibre).
Lateral deflection was more noticeable after about 65 min. This continued until the failure and resulted in failing towards the furnace. The lateral deflection was the largest in this test with cavity insulation compared with the other two tests. This was due to the higher temperature difference between the hot and cold flanges of the joists, which caused larger thermal bowing effects in this test. The failure was sudden with the load quickly dropping off at 99 min.
Flexural buckling about the minor axis and torsional buckling of joists were fully prevented by the lateral support offered by the double layers of plasterboard. Figure 16 shows the failures of joists near their supports in Test 2 including the local buckling in Joist 2.
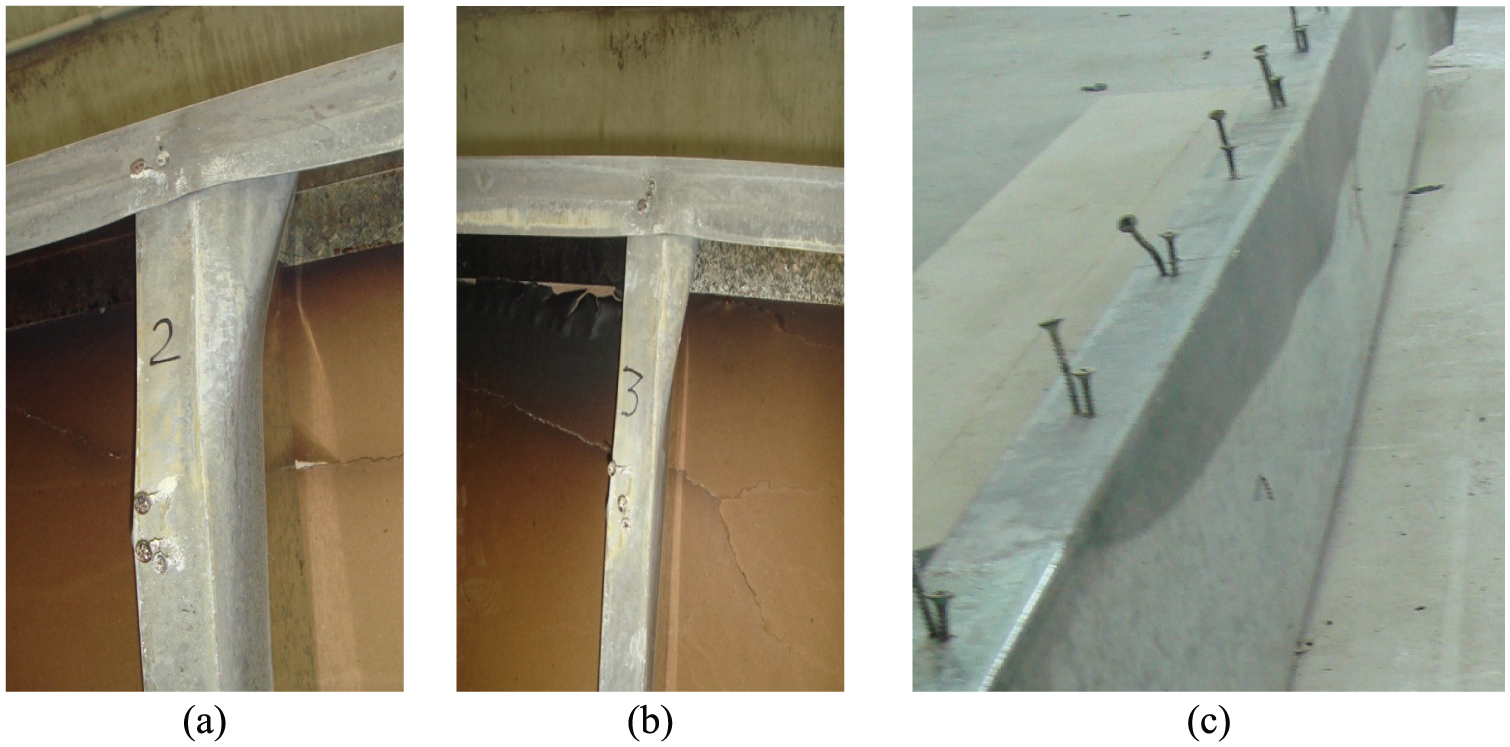
Failure modes of joists in Test 2: (a) Joist 2, (b) Joist 3 and (c) local web buckling along Joist 2.
Time–temperature profiles of Test Specimen 2
Figure 17 presents the time–temperature profiles of plasterboard surfaces. It shows that the time–temperature profile of the furnace and the exposed face of the floor followed the standard time–temperature curve as defined by AS 1530.4 (SA, 2005b).
Average time–temperature profiles of plasterboard surfaces in Test Specimen 2.
Lateral deflection behaviour of Test Specimen 2
Figure 18(a) and (b) shows the lateral deflections of the joists. The sudden increase in lateral deflection as shown in Figure 18(a) confirms the failure at 99 min. Around this time, the average temperatures across the hot flanges, webs and cold flanges were 446°C, 198°C and 100°C, respectively.
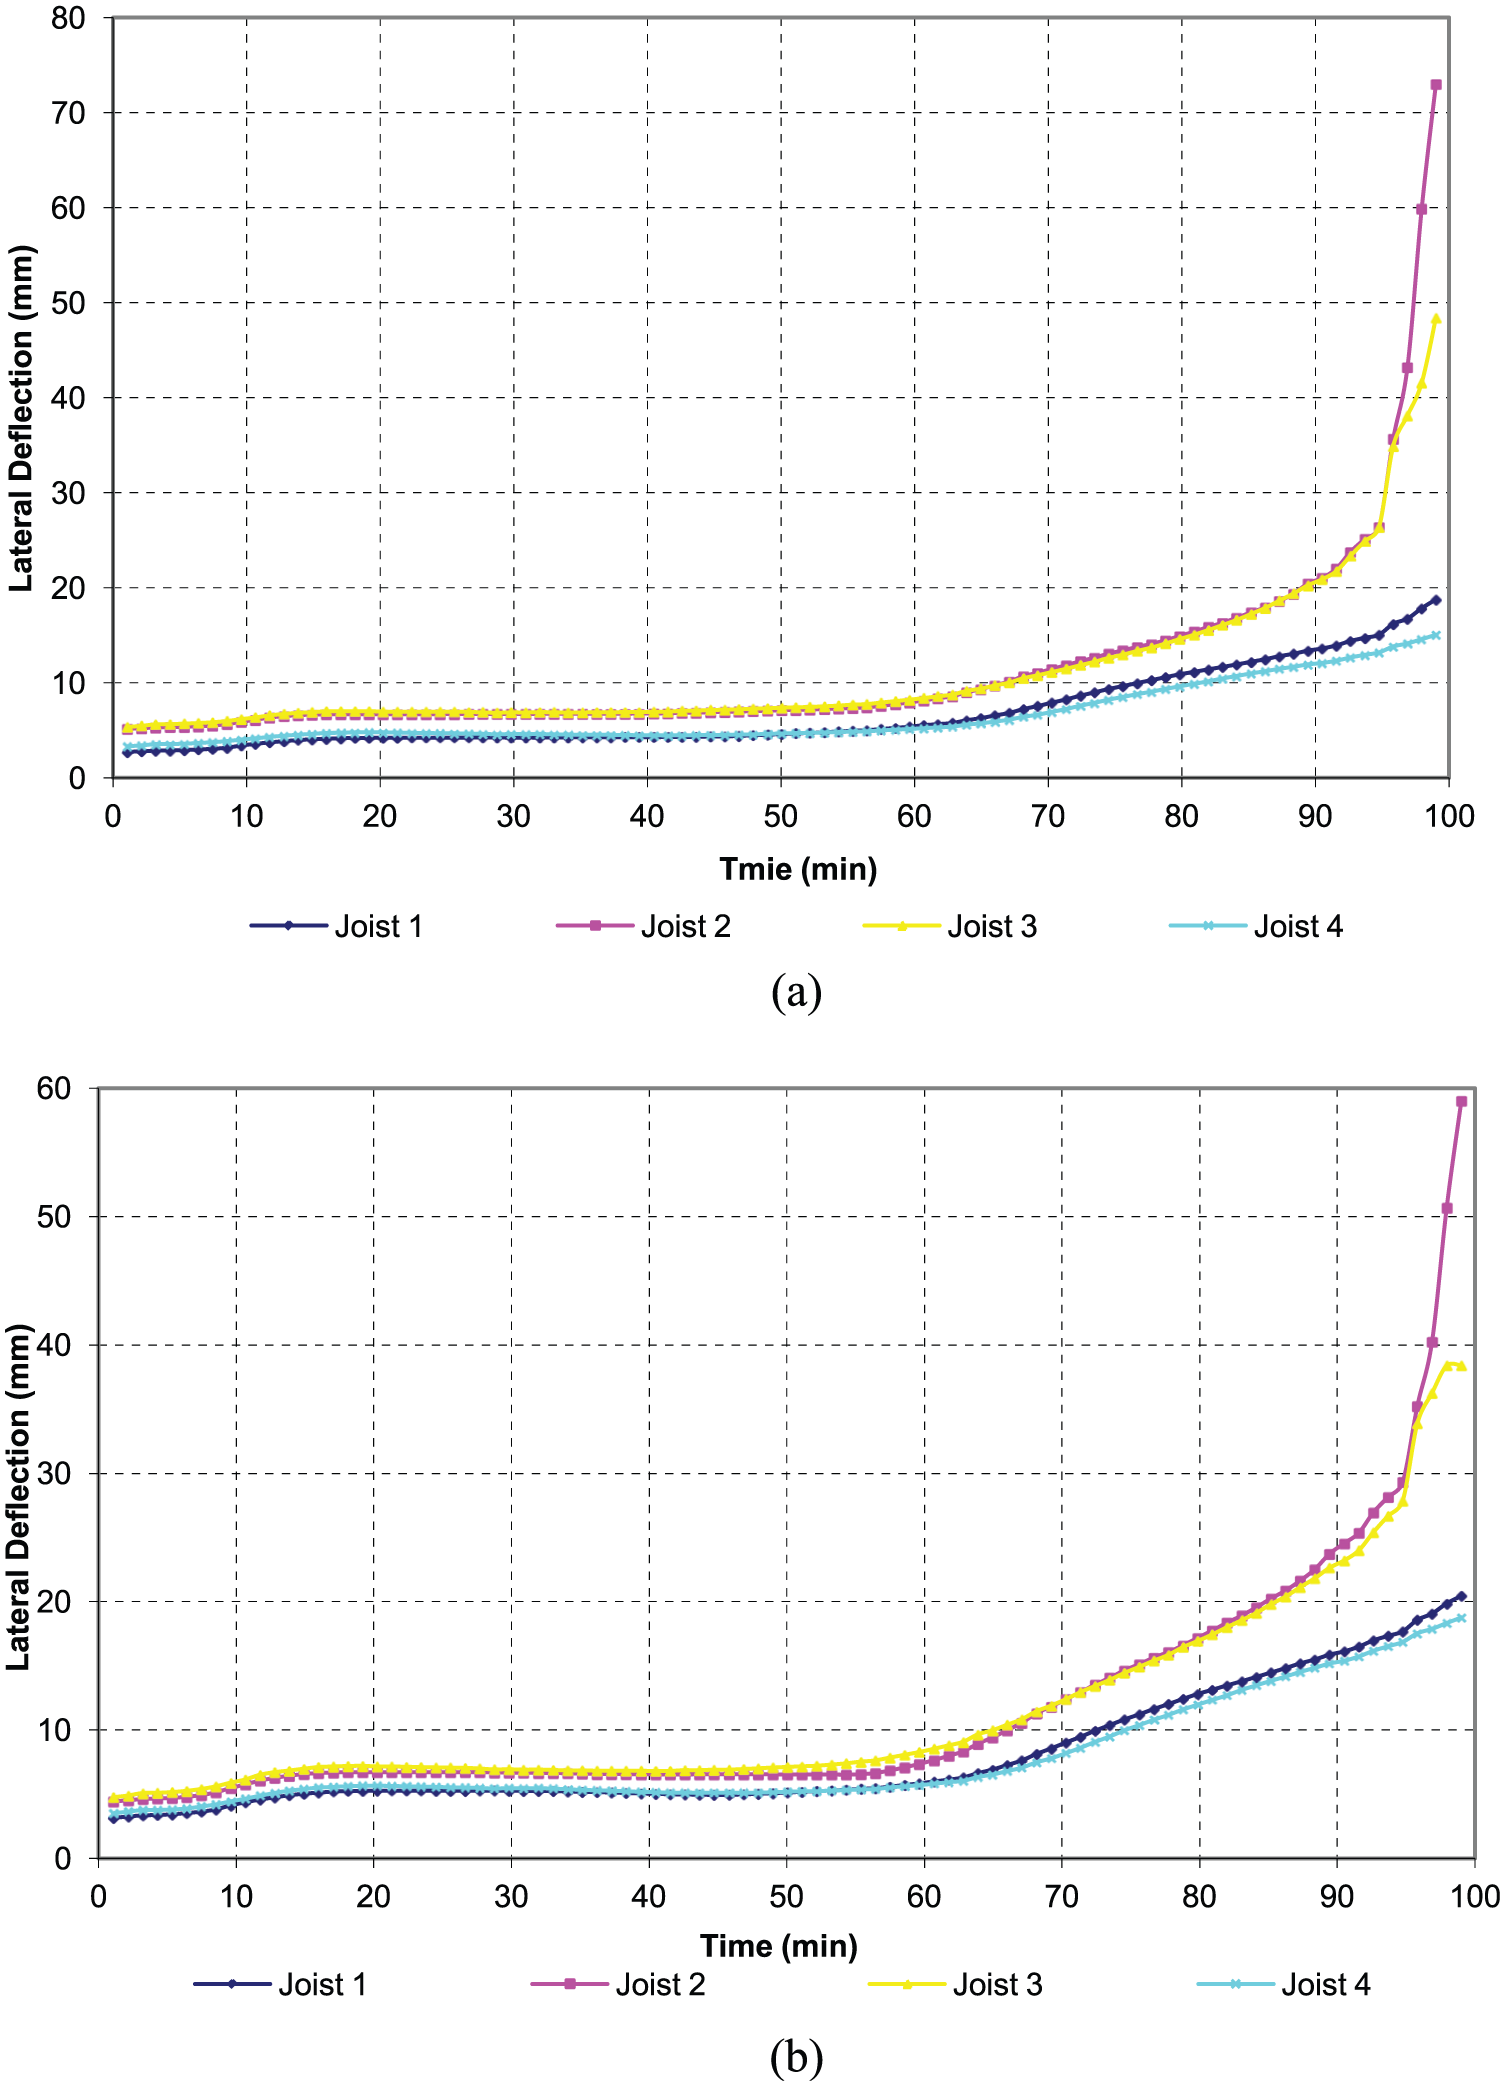
Lateral deflection–time profiles of Test Specimen 2: (a) at upper level (0.75L) and (b) at middle level (0.5L).
Results of Test Specimen 3
Structural and fire behaviour of Test Specimen 3
The behaviour of Test Specimen 3 was similar to that of Test Specimens 1 and 2. However, Test Specimen 3 with external insulation survived the fire for 139 min. Observations relating to smoke and steam were the same as in Test 2. From the beginning of the test, the specimen bent inwards and this continued until the end of the test when the specimen suddenly failed towards the furnace. Figure 19(a) to (c) shows the specimen soon after the fire test. Exposed plasterboard (Pb1) had fallen off in most areas. The external insulation had undergone overall shrinking, leading to the opening of the joints and exposing the base plasterboard layer (Pb2) (Figure 19(b)). On stripping the cavity insulation, it was noted that ambient side plasterboards remained in good condition except for some burning of the cavity facing surface of Pb3 in certain locations. The joists did not suffer from any torsional or flexural buckling about the minor axis. Figure 20 shows the failures of Joists 2 and 3 near their supports.
Fire performance of Test Specimen 3: (a) partial collapse of fire side plasterboards and external insulation, (b) gap in insulation and (c) screws bent on the fire side.
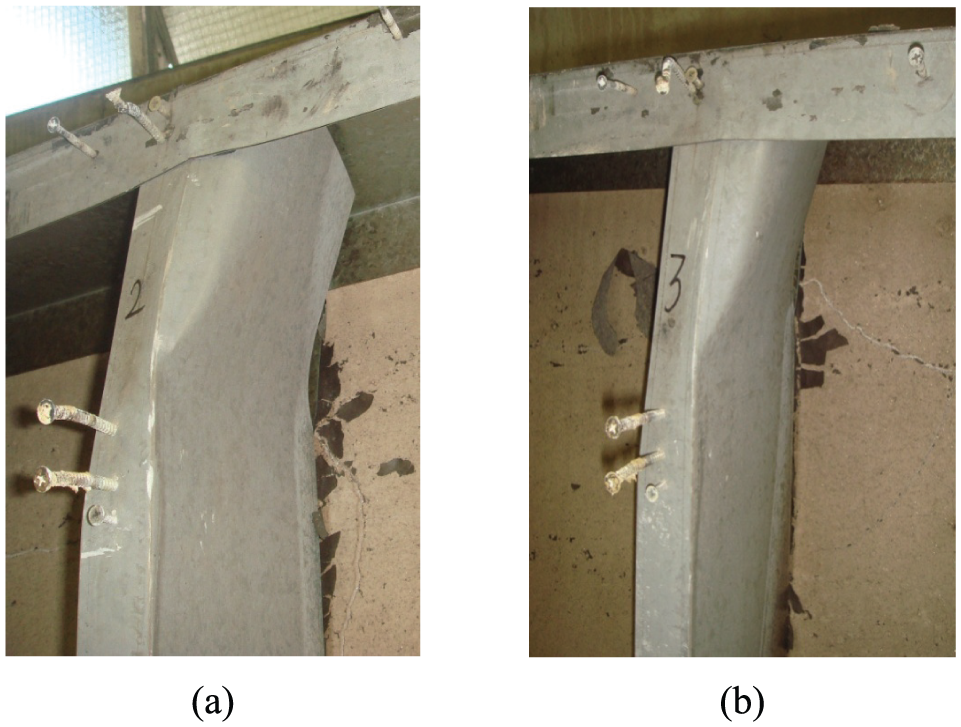
Failure modes of joists in Test 3: (a) Joist 2 and (b) Joist 3.
Time–temperature profiles of Test Specimen 3
Figure 21 presents the time–temperature profiles of plasterboard surfaces. It shows that the time–temperature profile of the furnace and the exposed face of the floor followed the standard time–temperature curve as defined by AS 1530.4 (SA, 2005b).
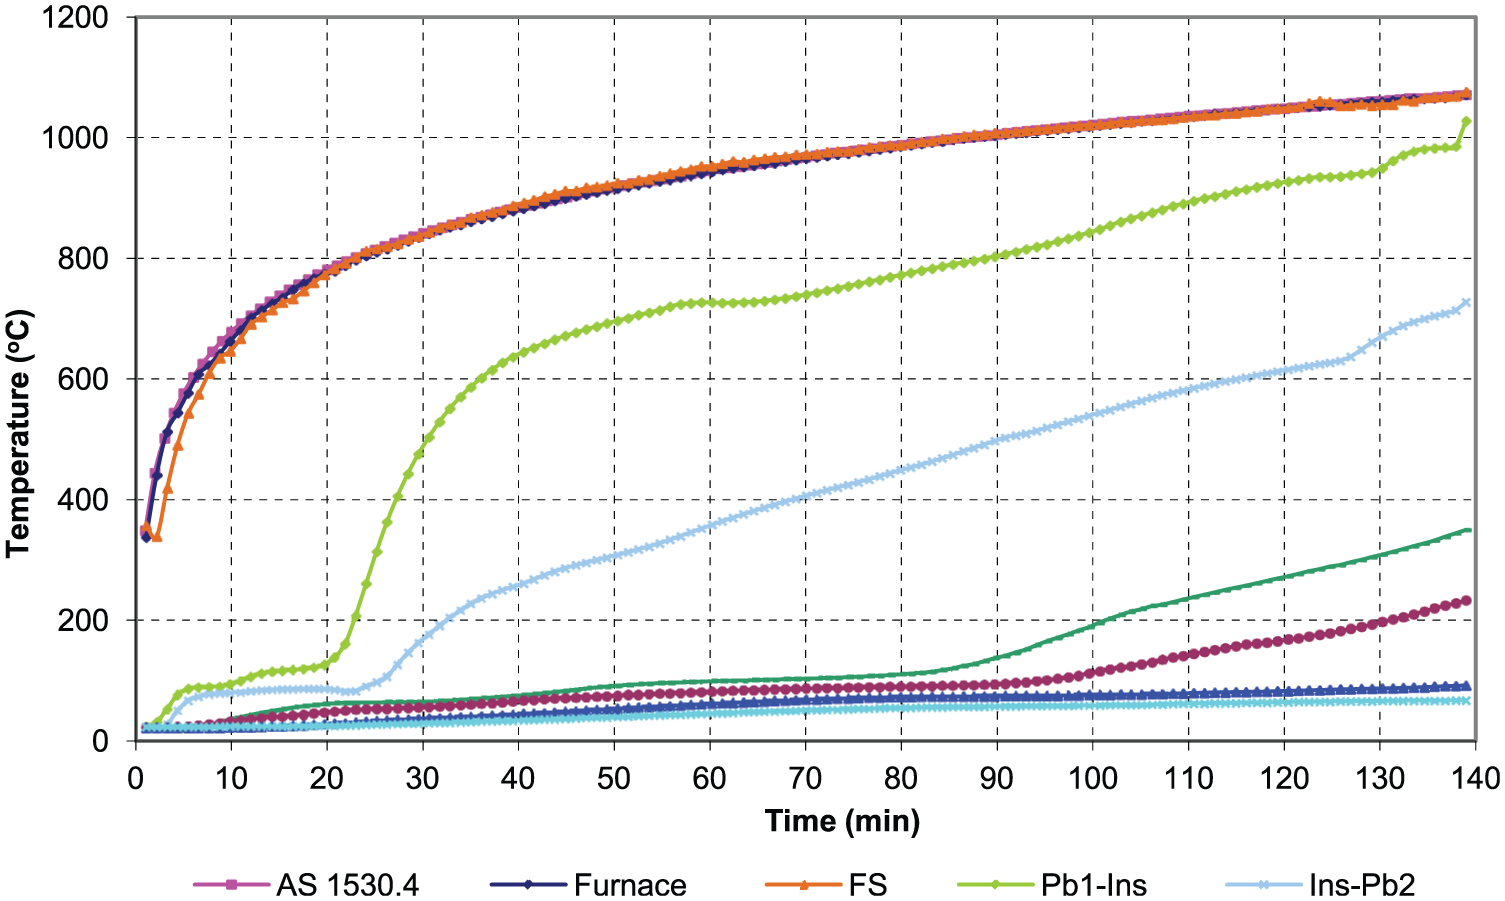
Average time–temperature profiles of plasterboard surfaces in Test Specimen 3.
Lateral deflection behaviour of Test Specimen 3
Figure 22(a) and (b) presents the lateral deflections of the joists. These figures showing a sudden increase in deflection near the end of the test confirm the specimen failure at 139 min. At this time, the average temperatures across the hot flanges, webs and cold flanges were 340°C, 260°C and 210°C, respectively.
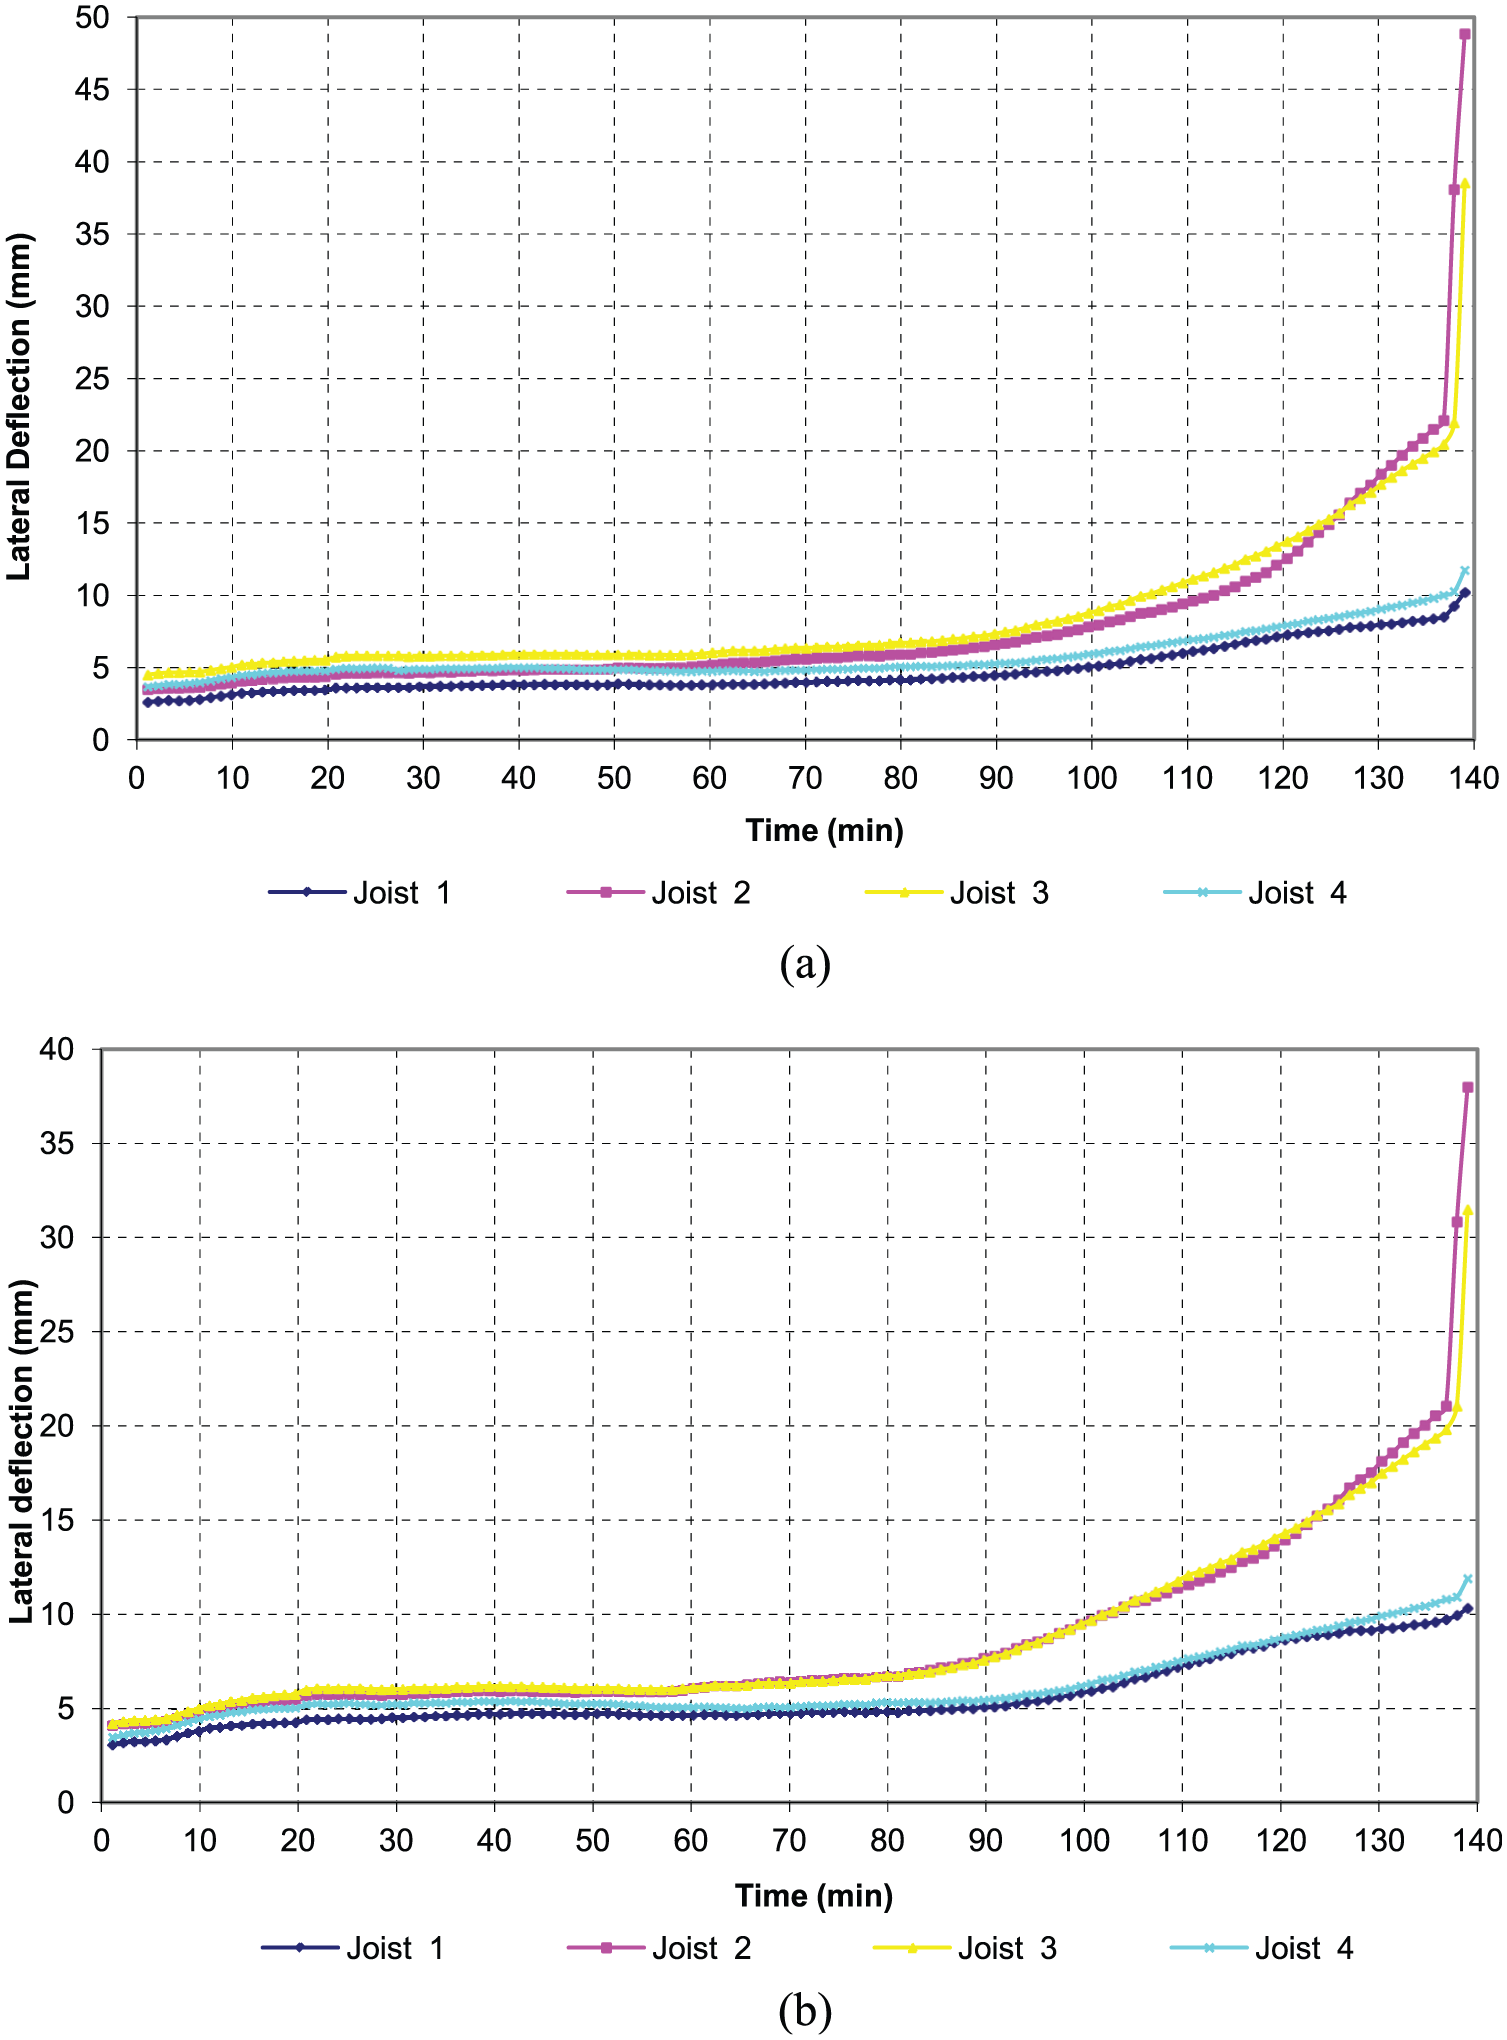
Lateral deflection–time profiles of Test Specimen 3: (a) at upper level (0.75L) and (b) at middle level (0.5L).
Discussion of fire test results
The full-scale fire test results are summarized in Table 1. It gives the FRRs (in minutes) of the three LSF floor specimens tested in this experimental study. This study provided the fire performance results for the LSF floor systems using both conventional (with and without cavity insulation) and external insulation systems. The results confirmed the superior performance of the LSF floor system using external insulation over cavity insulation (139 vs 99 min). Detailed results of time–temperature profiles and structural behavioural characteristics of joists obtained from this study can now be used in the numerical analyses of LSF floor systems (Baleshan, 2012). The following sections present some of the main findings by comparing the results of Tests 1–3.
Comparison of the fire performance LSF floor systems with external insulation, cavity insulation and no insulation
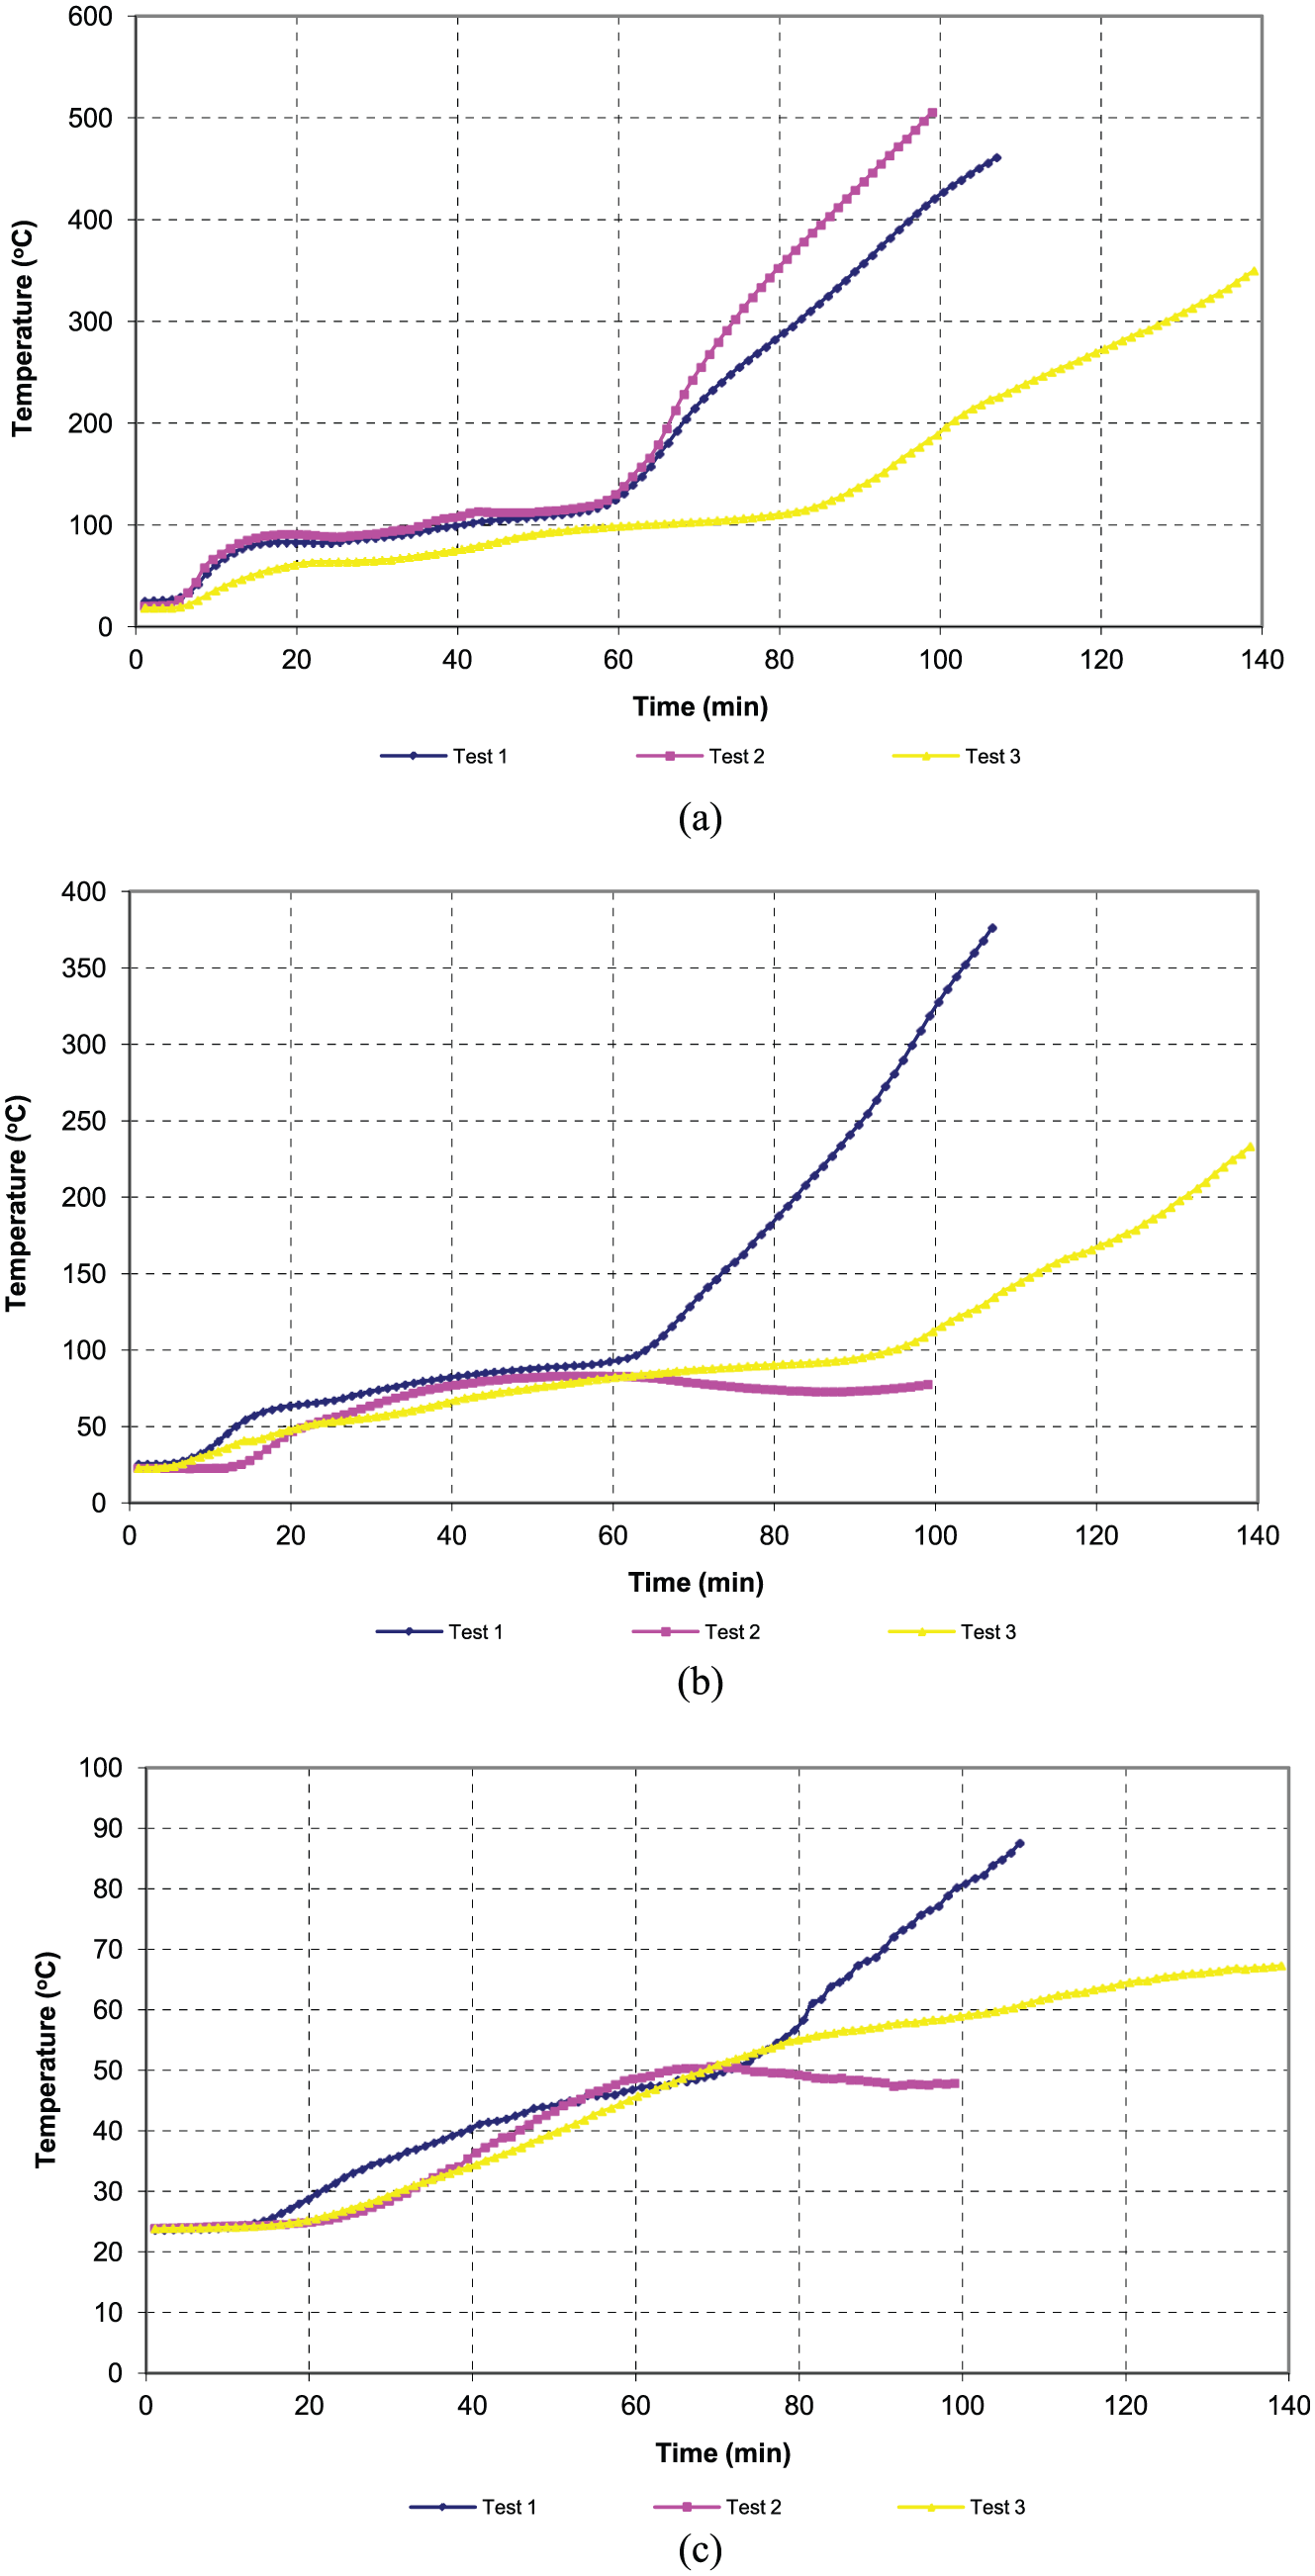
The average time–temperature profiles of joists from all three tests are compared in Figure 23(a). It compares the variations in thermal responses of joists due to the different ways of using insulation. In the case of cavity insulated specimen, the average temperature plateau (second phase) of joists was seen to last only up to 60 min in comparison to 90 min in the case of externally insulated specimen. The average hot flange and cold flange temperature profiles of the interior joists are shown in Figure 23(b) and (c), respectively. The hot flange temperatures in the cavity insulated specimen (Test 2) were seen to rise very rapidly with large temperature differences across the joist cross sections due to the presence of cavity insulation. The hot flange temperatures of the externally insulated floor specimen (Test 3), on the other hand, were seen to rise gradually with a small temperature difference across the joist cross sections due to the faster transfer of heat by radiation across the empty cavity. This is probably because, in the cavity insulated specimens, the insulation is on the ambient side of the hot flange and thus is incapable of offering any protection to it. In the case of externally insulated specimens, it is seen that the temperature profiles of the joists are well separated implying the effect of insulation on the joist temperatures. From Figure 23(b) and (c), it is clear that external insulation offers the maximum protection to the joists.
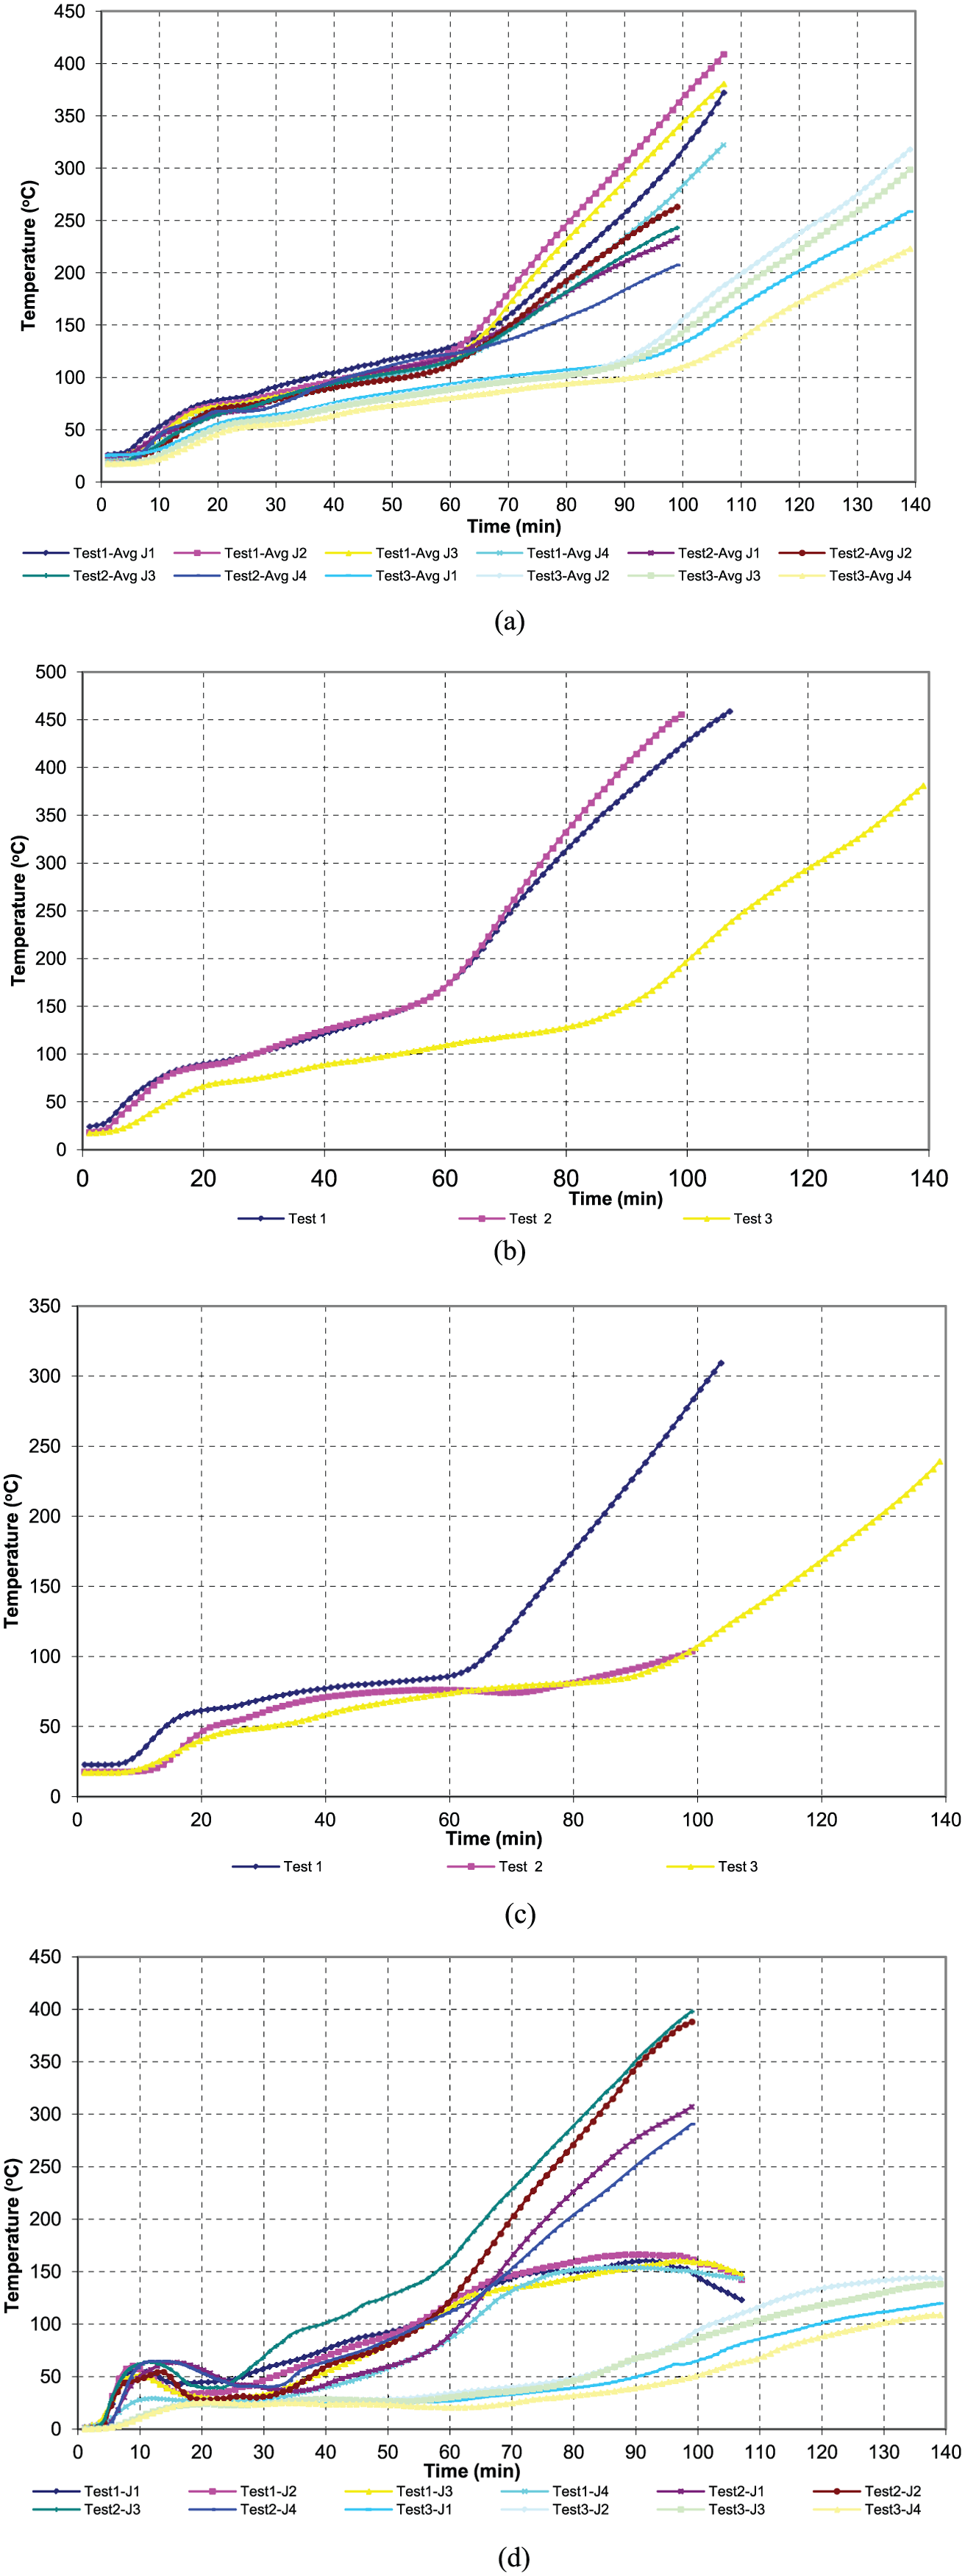
Average time–temperature profiles of steel surfaces in Test Specimens 1, 2 and 3: (a) average time–temperature profiles of joists, (b) average time–temperature profiles of hot flanges of interior joists, (c) average time–temperature profiles of cold flanges of interior joists and (d) difference between hot and cold flange temperatures of joists.
The temperature difference between the hot and cold flanges of the joists during the fire test is shown in Figure 23(d). By 80 min, the hot flange temperatures of the cavity insulated specimens had crossed 340°C with a temperature difference of over 250°C across the joist cross section whereas the hot flange temperatures in the externally insulated specimens at the same time were 128°C with a temperature difference of less than 50°C across the joist cross sections. At the end of the test, the average hot flange temperature of the joists for cavity insulated test specimen was about 455°C with a temperature difference of about 346°C across the joist cross sections, whereas in the case of externally insulated test specimen the average hot flange temperature was close to 381°C with a temperature difference of only about 128°C across the joist cross sections. These temperature measurements and differences show the superior fire performance of the externally insulated specimen compared with cavity insulated specimen.
The higher temperature differences across the joist cross section in the cavity insulated specimen led to higher lateral deformations compared to the externally insulated specimen (Figure 24). After 80 min, the lateral deflection in the cavity insulated specimen was close to 13 mm, compared to about 6 mm in the case of externally insulated specimen. By the end of 90 min, the lateral deflection in the cavity insulated specimen had crossed 20 mm whereas it was still less than 8 mm for the externally insulated specimens.
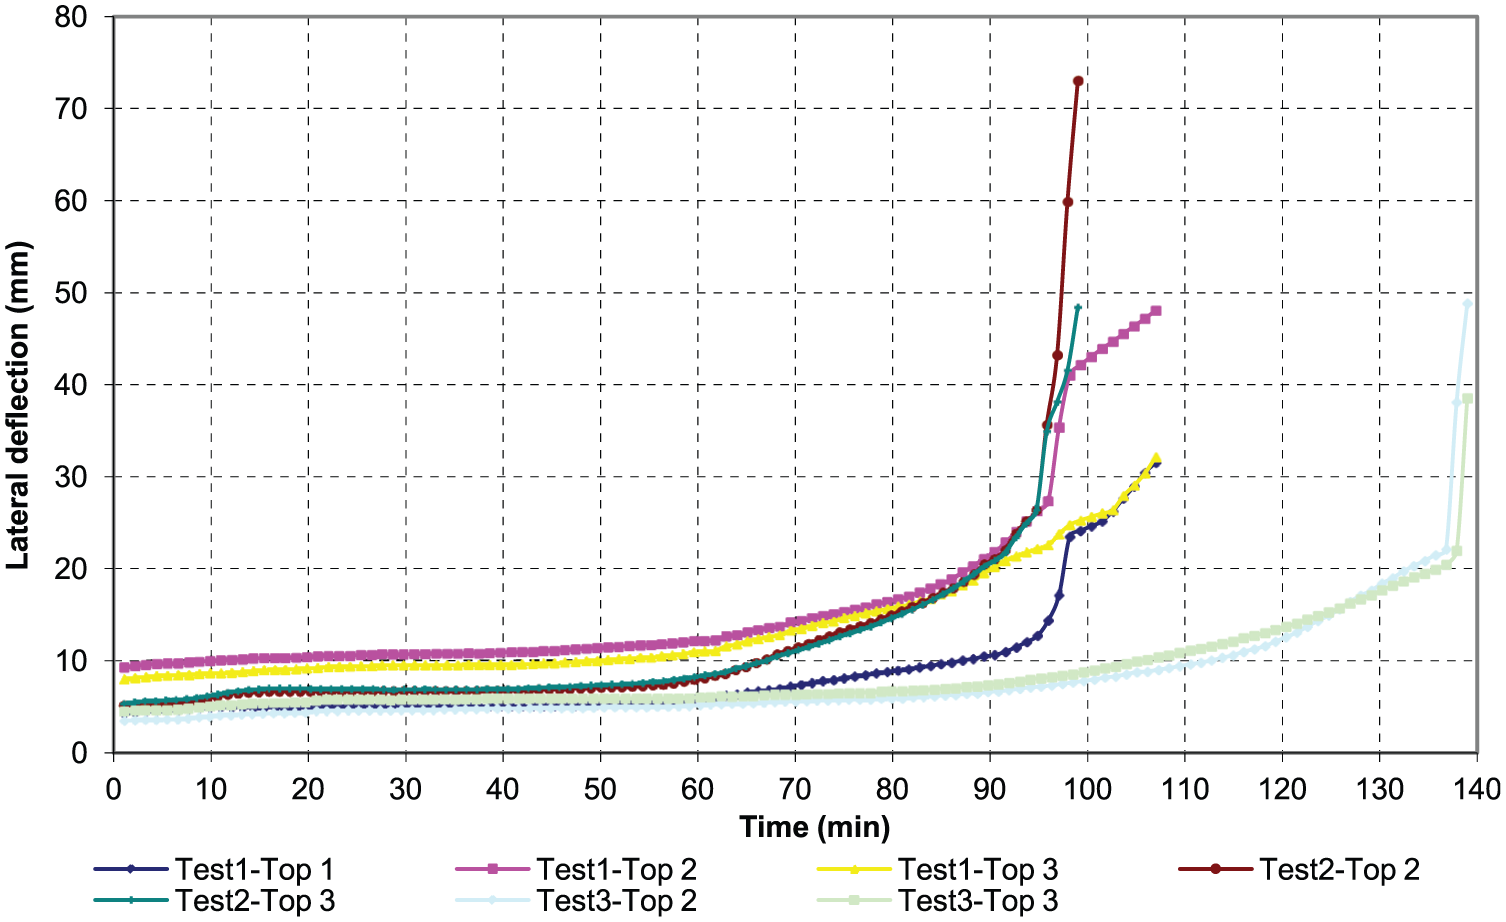
Lateral deflection–time profiles at upper level.
Figure 25(a) shows the time–temperature profiles of the Pb2-Cav surface for the specimens. The temperature profiles of the cavity insulated and non-insulated specimens were seen to be almost identical up to 60 min. Beyond 60 min, cavity insulation caused the temperature profiles to rise sharply by blocking and redirecting the heat flow back to the cavity facing surface. Figure 25(b) shows the time–temperature profiles of the Ply/Pb3-Cav surface of the specimens. In this case, the temperature profile increased dramatically for the non-insulated specimen whereas the temperatures were low for the cavity insulated specimens. The ambient side temperatures of all the floor specimens were observed to be below 90°C, that is, well below the insulation failure temperature of 140°C (Figure 25(c)).
Average time–temperature plots of plasterboard surfaces in Test Specimens 1, 2 and 3: (a) average time–temperature profiles of Pb2-Cav surface, (b) average time–temperature profiles of Ply/Pb3-Cav surface and (c) average time–temperature profiles of ambient surface.
The time–temperature profiles of the externally insulated floor specimens were found to be the most favourable. This is probably because any insulation by virtue of their physical presence essentially serves the main function of eliminating the transfer of heat across the floor cavity by radiation and convection which essentially are the faster modes of heat transfer as compared to conduction. No cavity insulation can reduce the transfer of heat towards the cold flange by conduction along the metallic cross section of the joist. Thus, the cold flange picks up heat from the hot flange by conduction along the web, which would be the fastest mode of heat transfer in the case of cavity insulated specimens. Because of the very low conductivity of the cavity insulating material as compared to steel, most of the heat gets directed and channelled along and across the steel joists, which act as the heat sink and raise their own temperatures much faster than in the case of non-cavity insulated specimens. This makes the very presence of cavity insulation a threat to the survival of steel during fire conditions.
Externally insulated specimens, on the other hand, can offer a much higher level of protection to the joists as they are installed on the fire side of the joist, thus minimizing the transfer of heat by radiation (by virtue of their physical presence) and conduction (on account of their low conductivity). Rock fibre insulation when used externally was seen to give the maximum protection.
Joist temperatures and failure
The failure of the specimens was always by the structural failure of the joists and never by insulation or integrity failure. In the case of cavity insulated specimen, the external plasterboards collapsed prior to joist failure thus hastening the collapse of the floor specimen by exposing the steel frame to direct furnace heat.
The two interior joists recorded higher temperatures during the test. Table 2 gives a comparison of the thermal and structural responses of these interior joists (J2 and J3) at the end of 30, 60, 90 and 120 min. Joists of Specimens 1 and 2 reached higher temperatures compared to those in Specimen 3. This is because of the external insulation used in Specimen 3. The cold flange temperature values near the failure of the interior joists of Specimens 1 and 2 were 320°C and 105°C, respectively. The hot flange failure temperatures of these interior joists are very close to each other (i.e. 489°C and 491°C for J2). For these joists (J2), the temperature differences between hot and cold flanges were 143°C and 388°C, respectively. This may mean that joist failure is mostly governed by the (maximum) hot flange temperature than the temperature difference between hot and cold flanges. Hence, we can conclude that structurally similar LSF floor panels will fail once their joists reach a particular temperature and the fire resistance can be increased only by delaying the maximum temperature in the joists. This is confirmed by the increase in fire resistance time of Specimen 3, which was achieved by the delay in temperature rise in joists due to external insulation.
Thermal and structural response of interior joists.
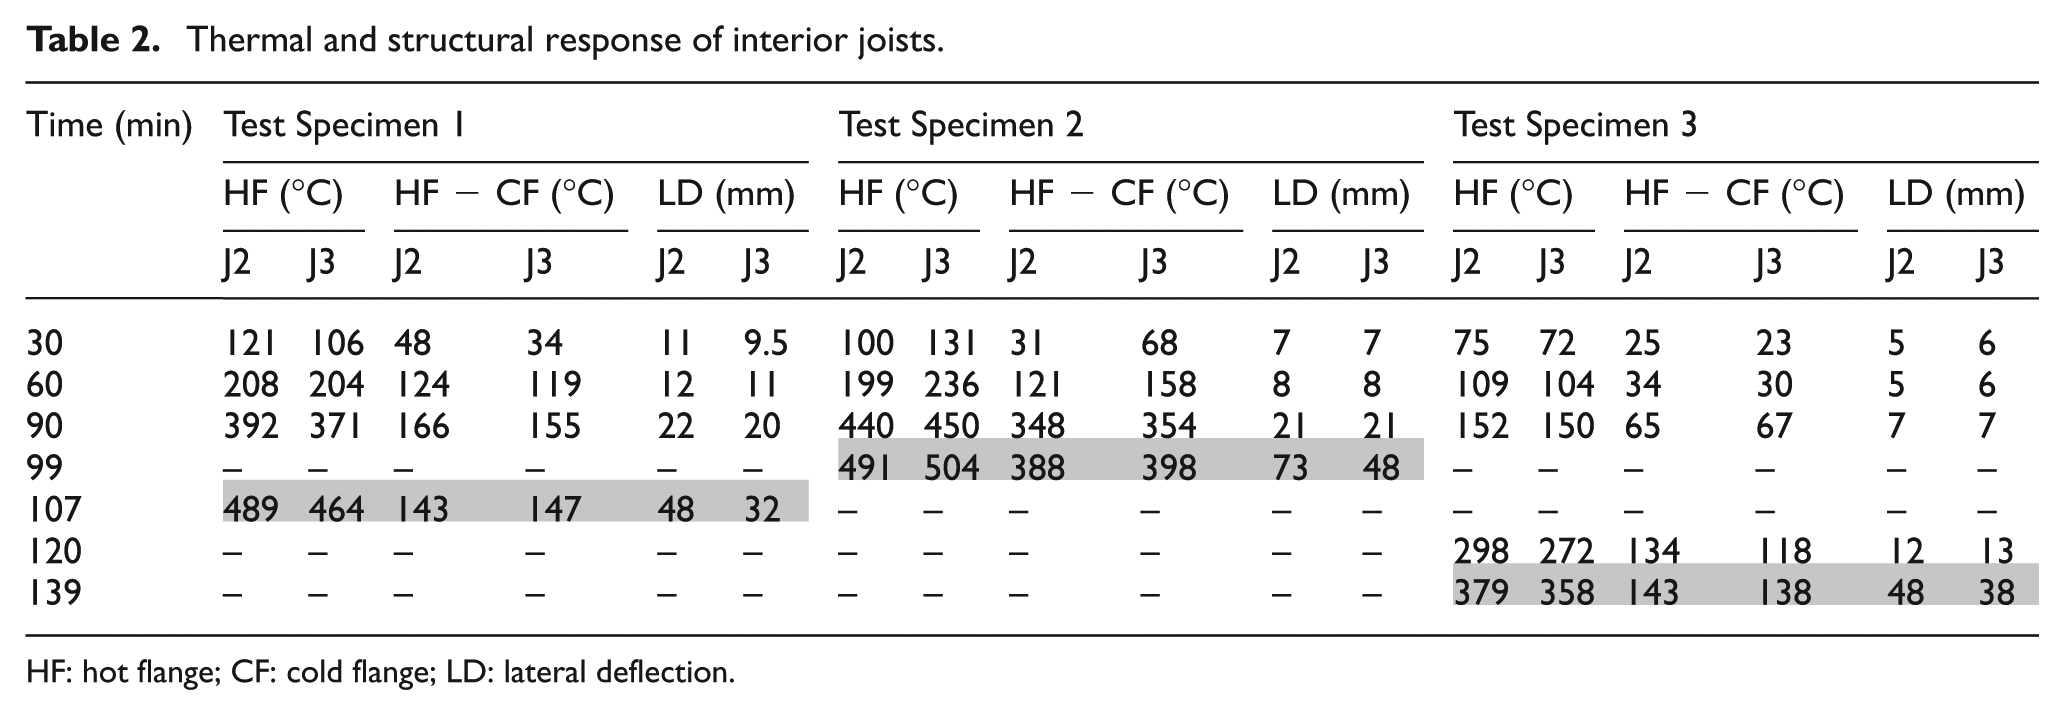
HF: hot flange; CF: cold flange; LD: lateral deflection.
Conclusion and recommendations
This article has presented the details of three full-scale fire tests of conventional LSF floor systems with and without cavity insulation, and the new composite panel system using external insulation, and the results. The test results have shown the superior fire resistance characteristics of the LSF floor system using the new composite panels. Temperature measurements showed that structurally similar LSF floor panels will fail when their joists reach a critical temperature and the fire resistance can be increased only by delaying the temperature in the joists. This is confirmed by the higher fire resistance time of Test Specimen 3, which was achieved by the reduced temperature rise in joists by the use of external insulation. This study has shown that the use of cavity insulation led to poor thermal and structural performance of LSF floors. In contrast, the thermal and structural performance of externally insulated LSF floor system was superior than conventional LSF floors with or without cavity insulation. Details of the three fire tests and the results are presented and discussed in this article. Details of the experimental results including the temperature and deflection profiles measured during the tests are also presented along with the joist failure modes.
Footnotes
Acknowledgements
The authors would like to thank Queensland University of Technology for providing fire testing facilities and the technical support to conduct this research project.
Declaration of Conflicting Interests
The author(s) declared no potential conflicts of interest with respect to the research, authorship and/or publication of this article.
Funding
The author(s) disclosed receipt of the following financial support for the research, authorship, and/or publication of this article: This study was financially supported by the Australian Research Council.