
Abstract
The selection of an efficient mitigation technique from a number of alternatives to reduce the seismic risk of pre-seismic code school buildings is the main focus of this study. An on-ground survey of the school building stock in a large study area that extends for 6000 km2 enabled the selection of four different benchmark structures. Detailed simulation models are developed for the selected benchmark buildings and 14 retrofit alternatives to define their performance criteria and assess their seismic vulnerability. The earthquake hazard of the study region is accounted for using a wide range of ground motions, representing two seismic scenarios pertinent to several medium seismicity regions. The relative seismic performance of pre-code buildings and different mitigation alternatives from a large number of dynamic response simulations up to collapse is described in terms of fragility curves as well as a proposed measure of response termed the overall performance factor. This measure of response along with the systematic seismic assessment approach adopted in this study enable prioritizing different retrofit alternatives based on their performance-to-cost ratios, which help to arrive at an efficient and cost-effective mitigation strategy for the implementation at the regional scale.
Keywords
Introduction
The existing building stock around the world includes a large number of structures that are at the risk of poor performance during earthquakes as a result of the inefficient seismic design provisions implemented during the design and construction phases. Serious consequences are anticipated if this seismic risk is overlooked, particularly for school buildings with a high-risk category. This highlights the pressing need for upgrading the seismic performance of pre-seismic code buildings to reduce seismic risk. The retrofit of a pre-seismic code building stock requires a systematic vulnerability assessment and ranking of different mitigation alternatives based on the anticipated risk from various seismic scenarios taking into consideration retrofit costs. Moreover, in order to assess the seismic performance of mitigation alternatives accurately, the inelastic response of a structure should be compared before and after retrofit with realistic performance criteria (ASCE/SEI-41, 2014). A retrofit alternative evaluated against stringent performance limit states will have a lower ranking compared with the same mitigation action when evaluated just to avoid collapse. Hence, the selection of a mitigation technique involves several interrelated aspects, including the seismic risk, vulnerability, structural deficiencies, seismic performance objectives, and retrofit costs and applicability. This highlights the pressing need for a systematic vulnerability assessment and prioritization approach for the seismic retrofit measures of pre-code buildings, considering the diverse inventories and seismo-tectonic settings around the world.
The retrofit techniques of pre-seismic code structures include adding an efficient lateral force–resisting system or upgrading the existing elements. The latter retrofit category is split into those reducing seismic demand and those enhancing capacity, which involve strength, stiffness, ductility, or combinations. Ductility is attributable to inadequate component detailing, and hence, its retrofit techniques such as improving beam–column joints are expensive, disruptive, and rarely used in low-to-medium seismic zones. Even in regions of high seismicity, the retrofit of the ductility deficiency can be accomplished by improving the lateral force–resisting system to reduce ductility demands. This study is directed toward the retrofit approaches related to upgrading member strength and stiffness, which are judged to be the most suitable and commonly used for pre-code school buildings in regions of low-to-medium seismicity (e.g. Federal Emergency Management Agency (FEMA), 2006).
Fragility relationships, which play a vital role for the estimation of seismic losses and retrofit decisions, are derived analytically using a wide range of details in structural idealizations, analysis methods, seismic hazard representation, and damage models (e.g. Jeong et al., 2012; Mwafy et al., 2015). The most rational analytically derived fragility relationships are based on demanding computations since detailed numerical models, large number of dynamic analyses, and a wide range of input ground motions are needed to realistically account for the most important uncertainties. Therefore, simulation-based methods are typically applied to a selected range of buildings deemed to be representative of an entire building population.
The main objective of this article is thus to assess the vulnerability of a range of benchmark structures that represent the pre-code school building stock in a region of medium seismicity and to select an efficient retrofit measure from several alternatives to mitigate the earthquake risk. The adoption of a probabilistic assessment approach and weighing different retrofit techniques based on their effectiveness and costs for the selection of a suitable mitigation strategy are key elements in this study. The adopted approach for prioritizing different retrofit techniques is summarized in Figure 1 and discussed in detail in subsequent sections.
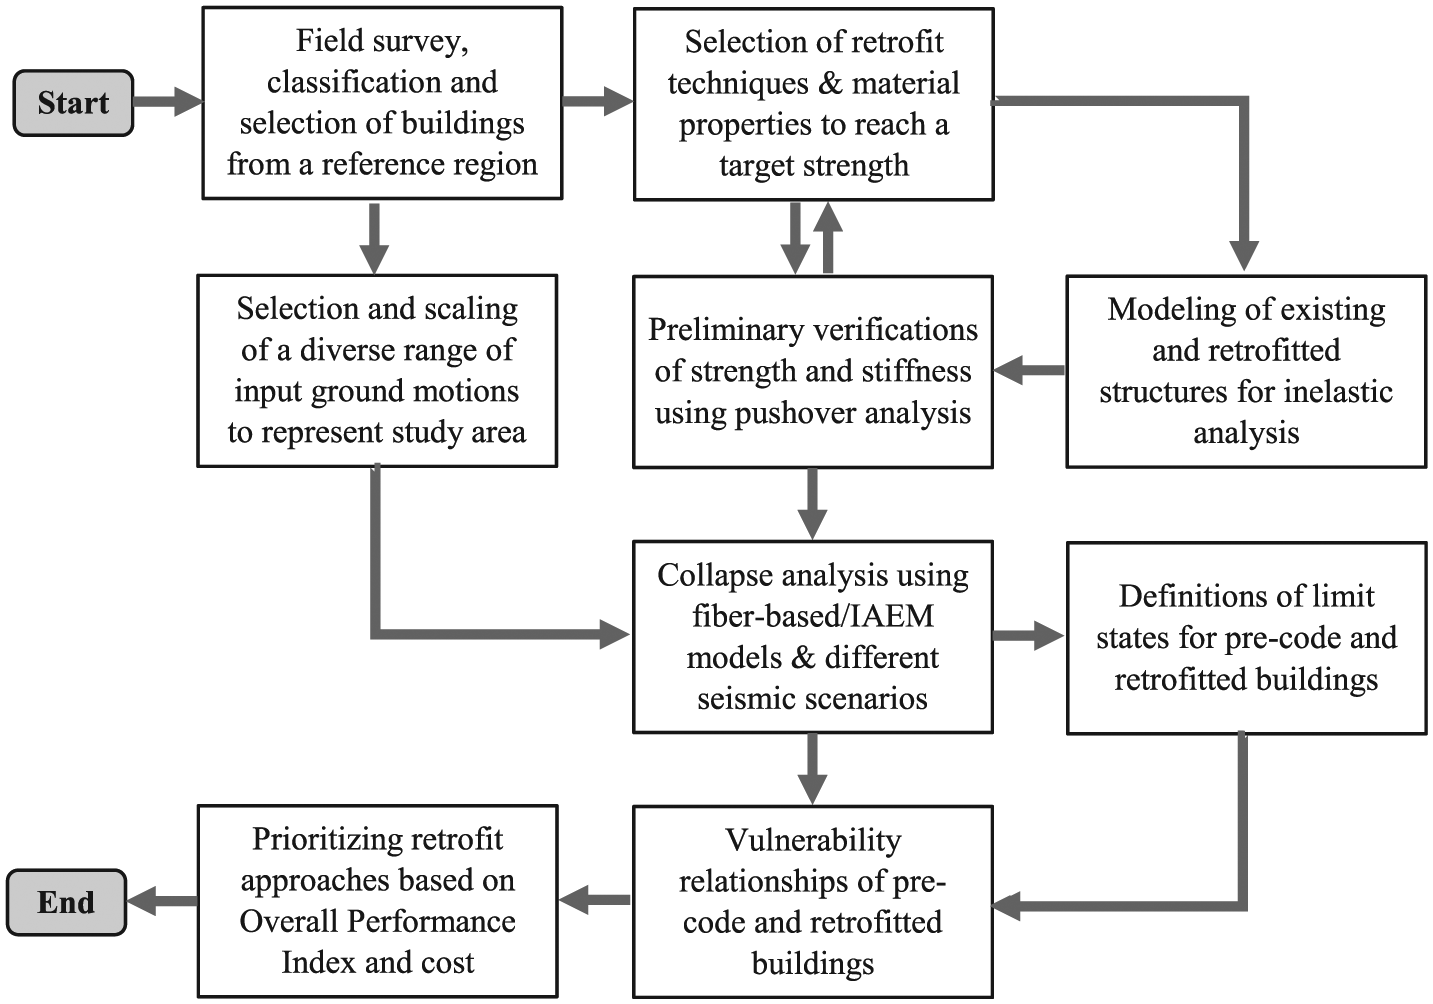
Adopted approach for prioritizing different retrofit techniques of pre-code buildings based on seismic performance and costs.
Selection of reference buildings based on field survey
The approach depicted in Figure 1 is applied to the pre-code school building inventory in the Fayoum district, Egypt, which is selected as a case study. The school buildings that were constructed before 1992 are the focus of this study. This year was selected due to the major development in seismic design provisions that took place in Egypt after the 1992 Dahshur earthquake (e.g. Sykora et al., 1993). The large study area extends for 6000 km2 with a total population of 2.9 million. The district capital, the Fayoum town, is located 130-km south-west of Cairo and was founded in 4000 B.C. The building database of this study is collected using an on-ground survey rather than other approaches such as satellite image processing since it was difficult to distinguish schools in the study area from other buildings using other approaches. Important information such as the building height, possible irregularity, and soil characteristics are also collected during the site visits.
The on-ground survey enabled collecting the construction typologies of 1416 school buildings. From this database, 1334 structures were reinforced concrete (RC) moment-resisting frames (MRFs), while only 82 were masonry buildings. Figure 2(a) depicts the construction age map of the surveyed buildings. Figure 2(b) and (c) presents the detailed statistics of the school buildings in the Fayoum county. Figure 2(b) shows the percentages of school buildings in different counties comprising the Fayoum district, including the Fayoum county which includes 23% of the school building stock. The survey statistics indicates the following:
33% of the buildings are pre-code structures (were built before 1992);
98% of the buildings are RC frames;
80% of the buildings are three to five stories;
60% of the buildings were constructed on clayey soil (CL).
The inventory mainly includes the four building topologies shown in Figure 2.
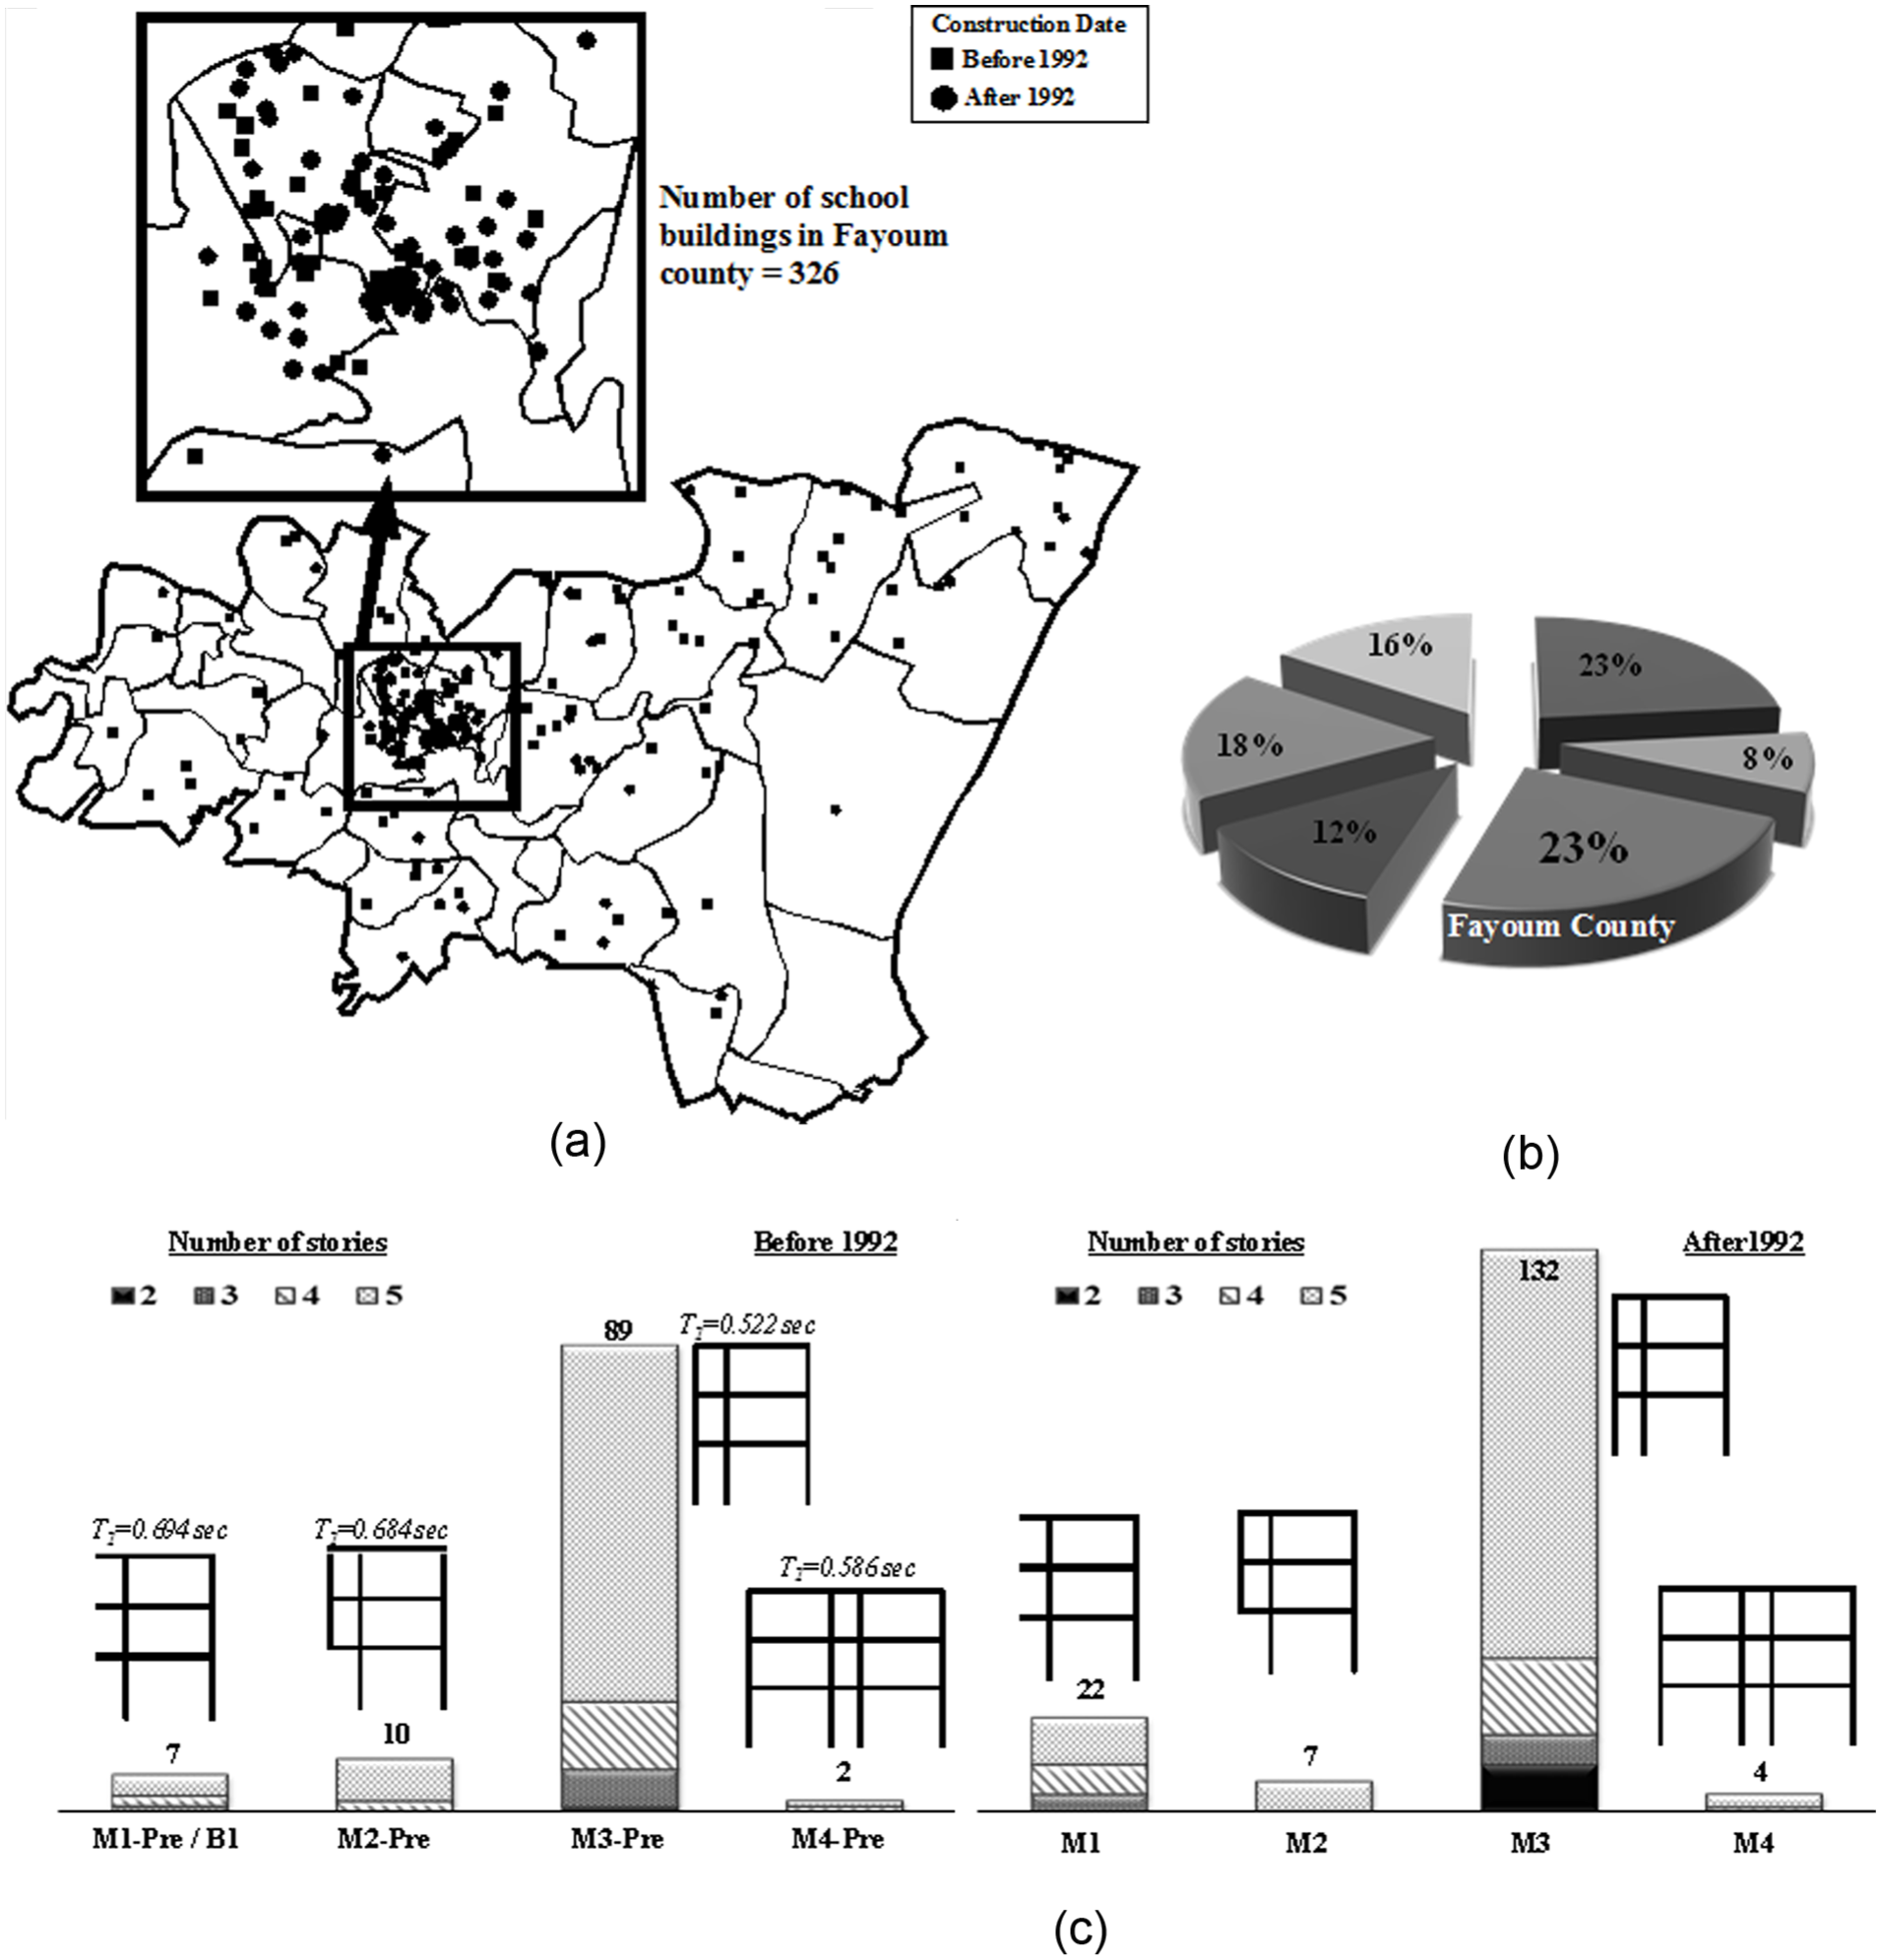
Construction date map of the school building stock in the 6000-km2 study area and the survey statistics of the Fayoum county, which includes 23% of the total school building inventory: (a) construction date map of the school buildings in Fayoum district; total number of schools 1416; (b) percentage of school buildings in the main counties of Fayoum district; and (c) survey statistics of the building topologies in Fayoum country before and after 1992 along with the elastic periods of vibrations of the pre-code structures.
Since the main objective of this study is to assess the effectiveness of retrofit techniques to mitigate earthquake losses for the possible application at an urban scale, the selection of pre-seismic code representative structural configurations from this large building database is required. This is particularly needed in view of the adopted approach in this study for assessing the vulnerability of pre-code school buildings using realistic modeling and analysis technique, as explained hereafter. Four reference school buildings, referred to as M1-Pre to M4-Pre, are therefore selected according to their topologies to represent the four framing systems indicated in the survey statistics, as shown in Figure 3. The reference buildings were constructed before 1992 without seismic provisions, and hence, their lateral force–resisting systems do not fulfill with the capacity design requirements. Structural and non-structural damage was reported in some of the selected school buildings during the 1992 Dahshur earthquake (e.g. Elkholy et al., 2010). The availability of the material characteristics and construction drawings supported the selection of the three-story benchmark structures, which represent the typical pre-seismic code school buildings in medium seismicity urban areas. Moreover, although the five-story buildings are more pronounced in the collected database, particularly for the M3-Pre configuration, it was decided to select reference buildings representing the mid-range of building heights in the study area, rather than the extremities of the two-story or five-story buildings.
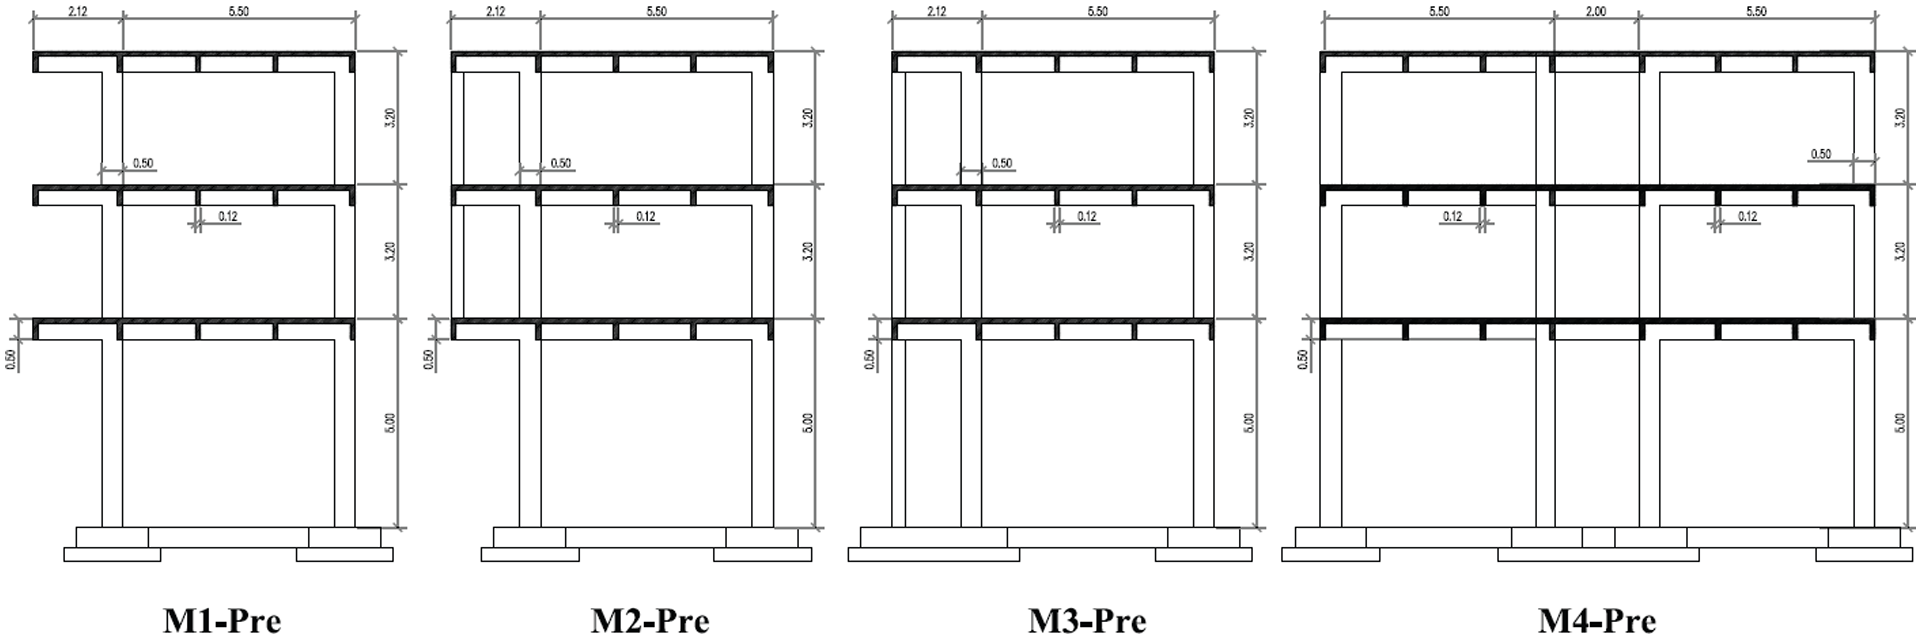
Configuration and dimensions of the pre-code reference structures.
The total height of each of the selected buildings is 11.4 m, with equal story heights of 3.2 m except for the ground story, which has a story height of 5.0 m high, as shown in Figure 3. The lateral force–resisting systems in both the longitudinal and transverse directions are MRFs, while the floor system is solid slab. The reference buildings are founded on silty clay soil. Live loads are 5.0 kN/m2, while loading from floor finishes is 1.5 kN/m2. The yield strength of the longitudinal and transverse reinforcing steel is 240 MPa, while the concrete cube strength is 25 MPa. A sample of the steel reinforcement of different structural members for building M1-Pre is depicted in Figure 4.
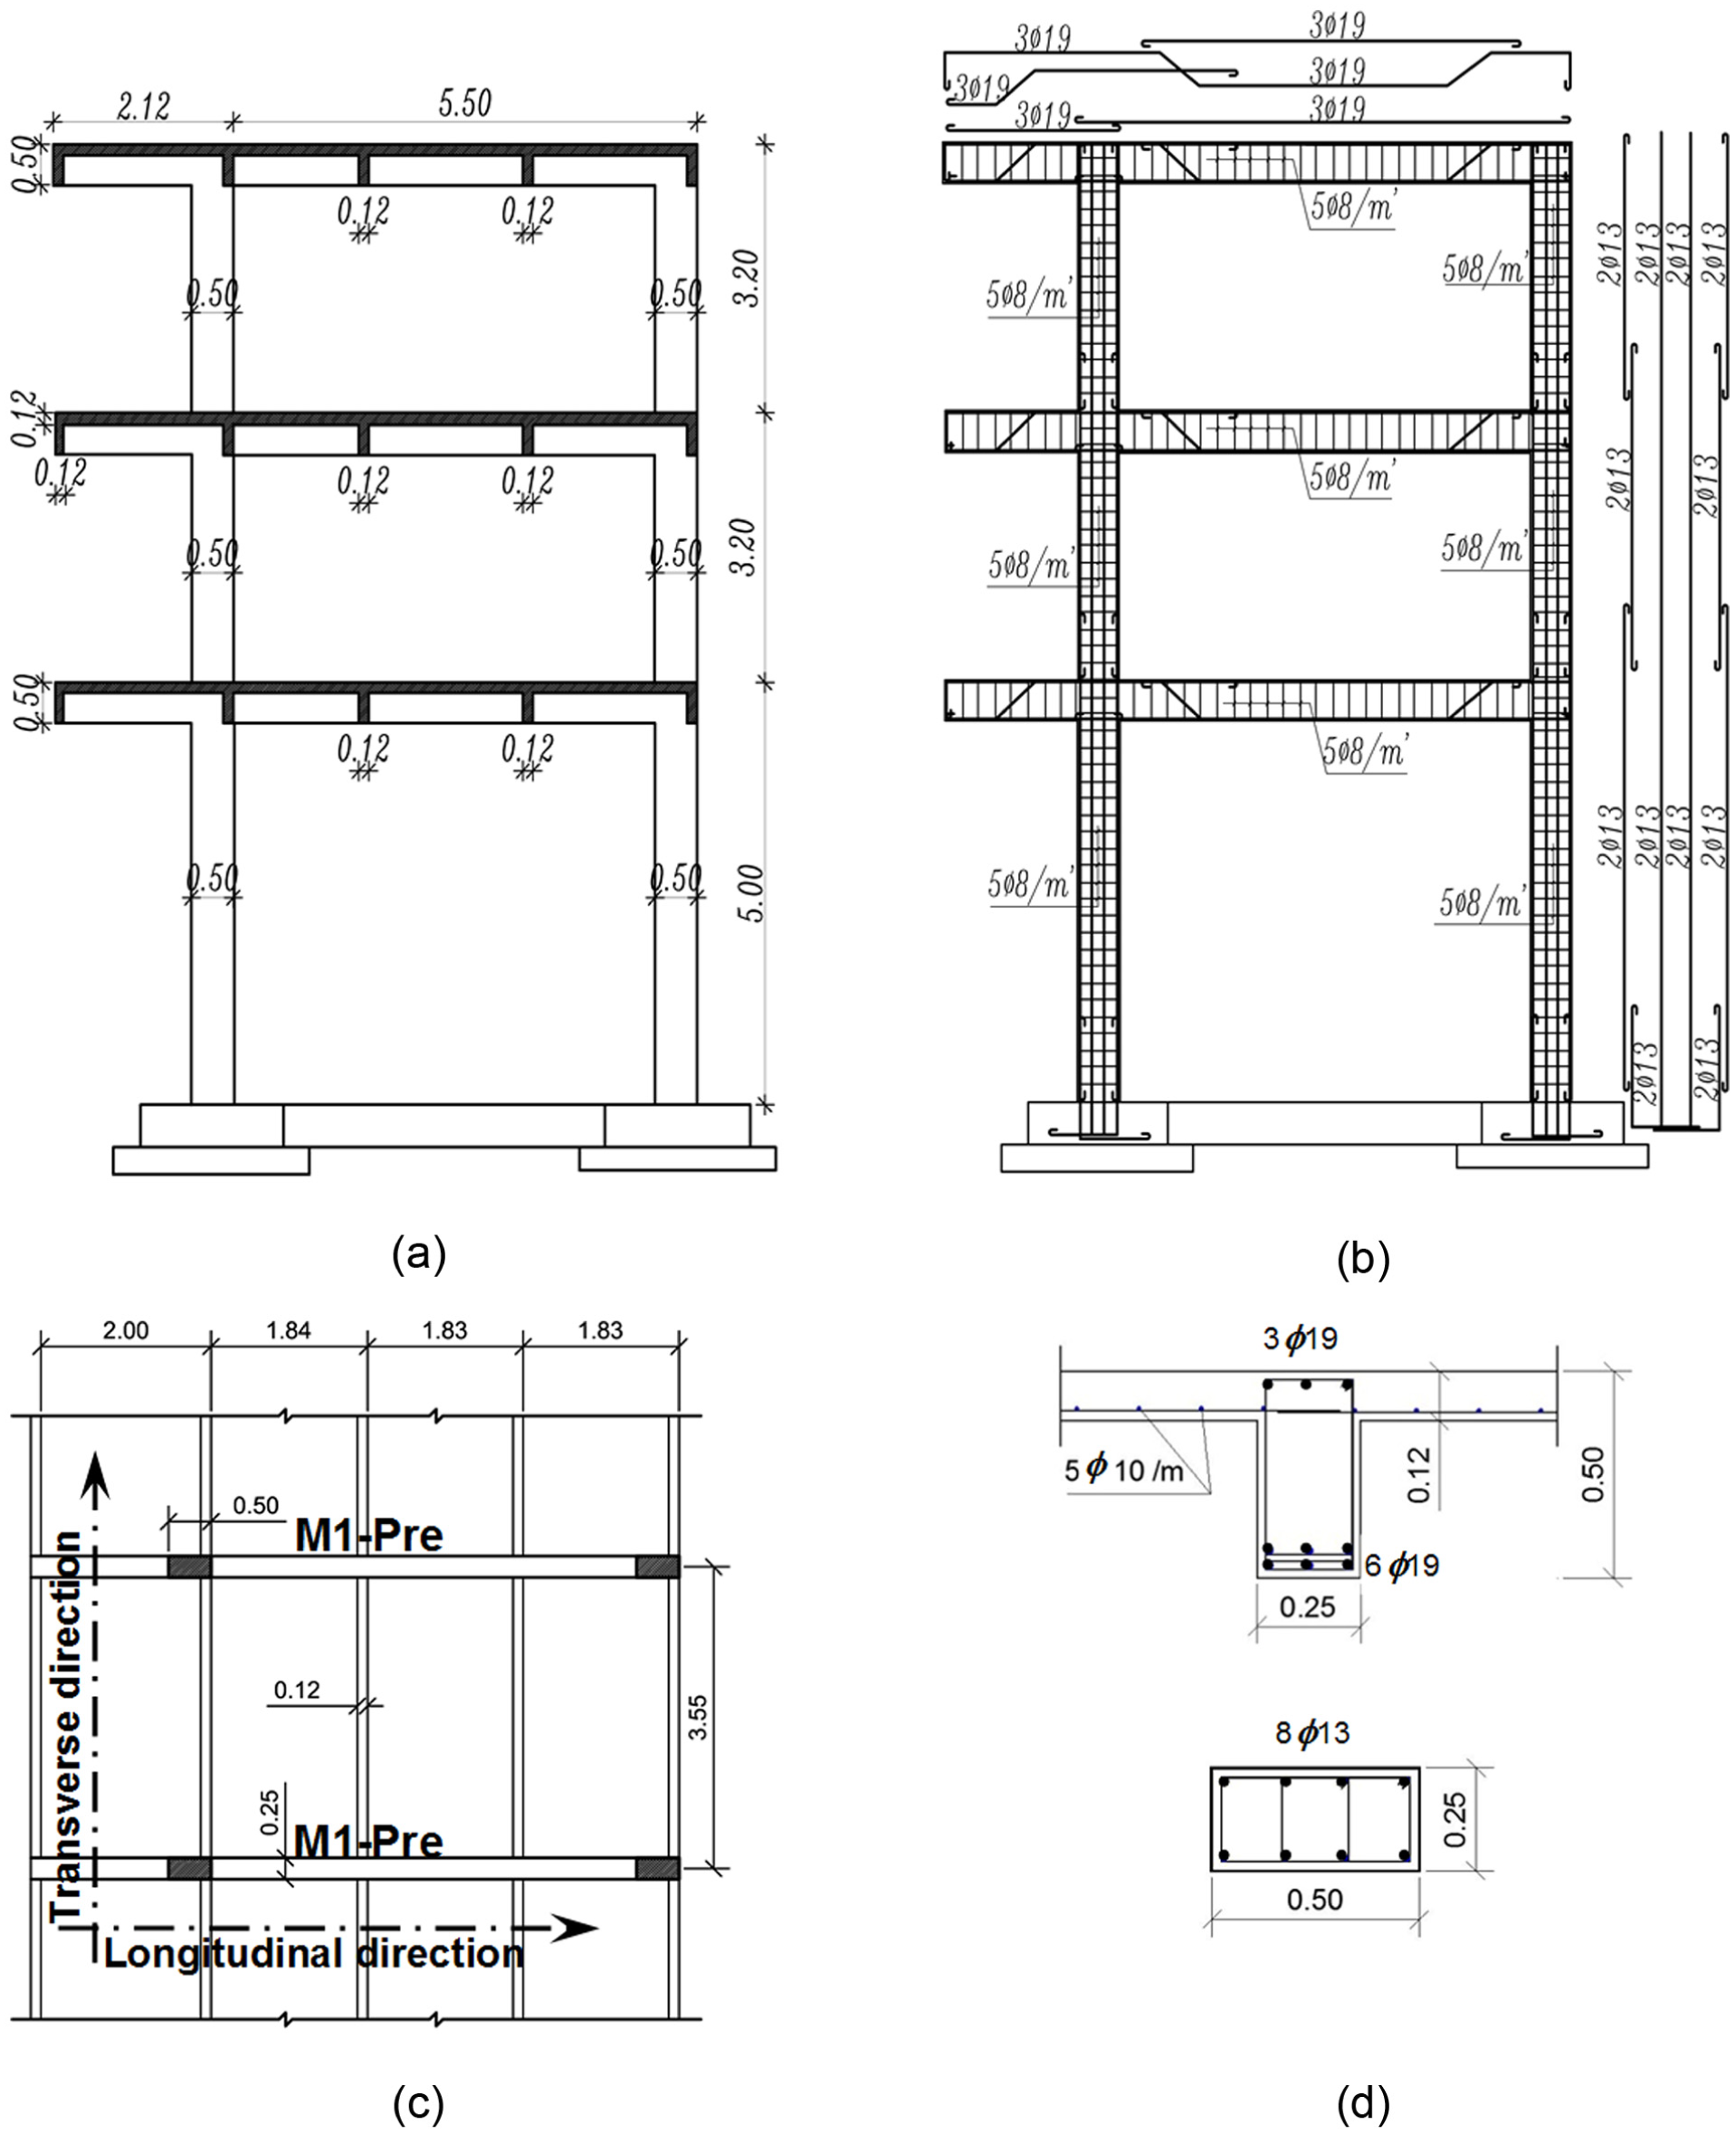
Dimensions and reinforcing steel details of a sample reference structure, M1-Pre (all dimensions are in meters): (a) concrete dimensions, (b) reinforcement details, (c) layout, and (d) beam cross section at mid-span (top) and column cross section (bottom).
Structural idealization for inelastic analysis
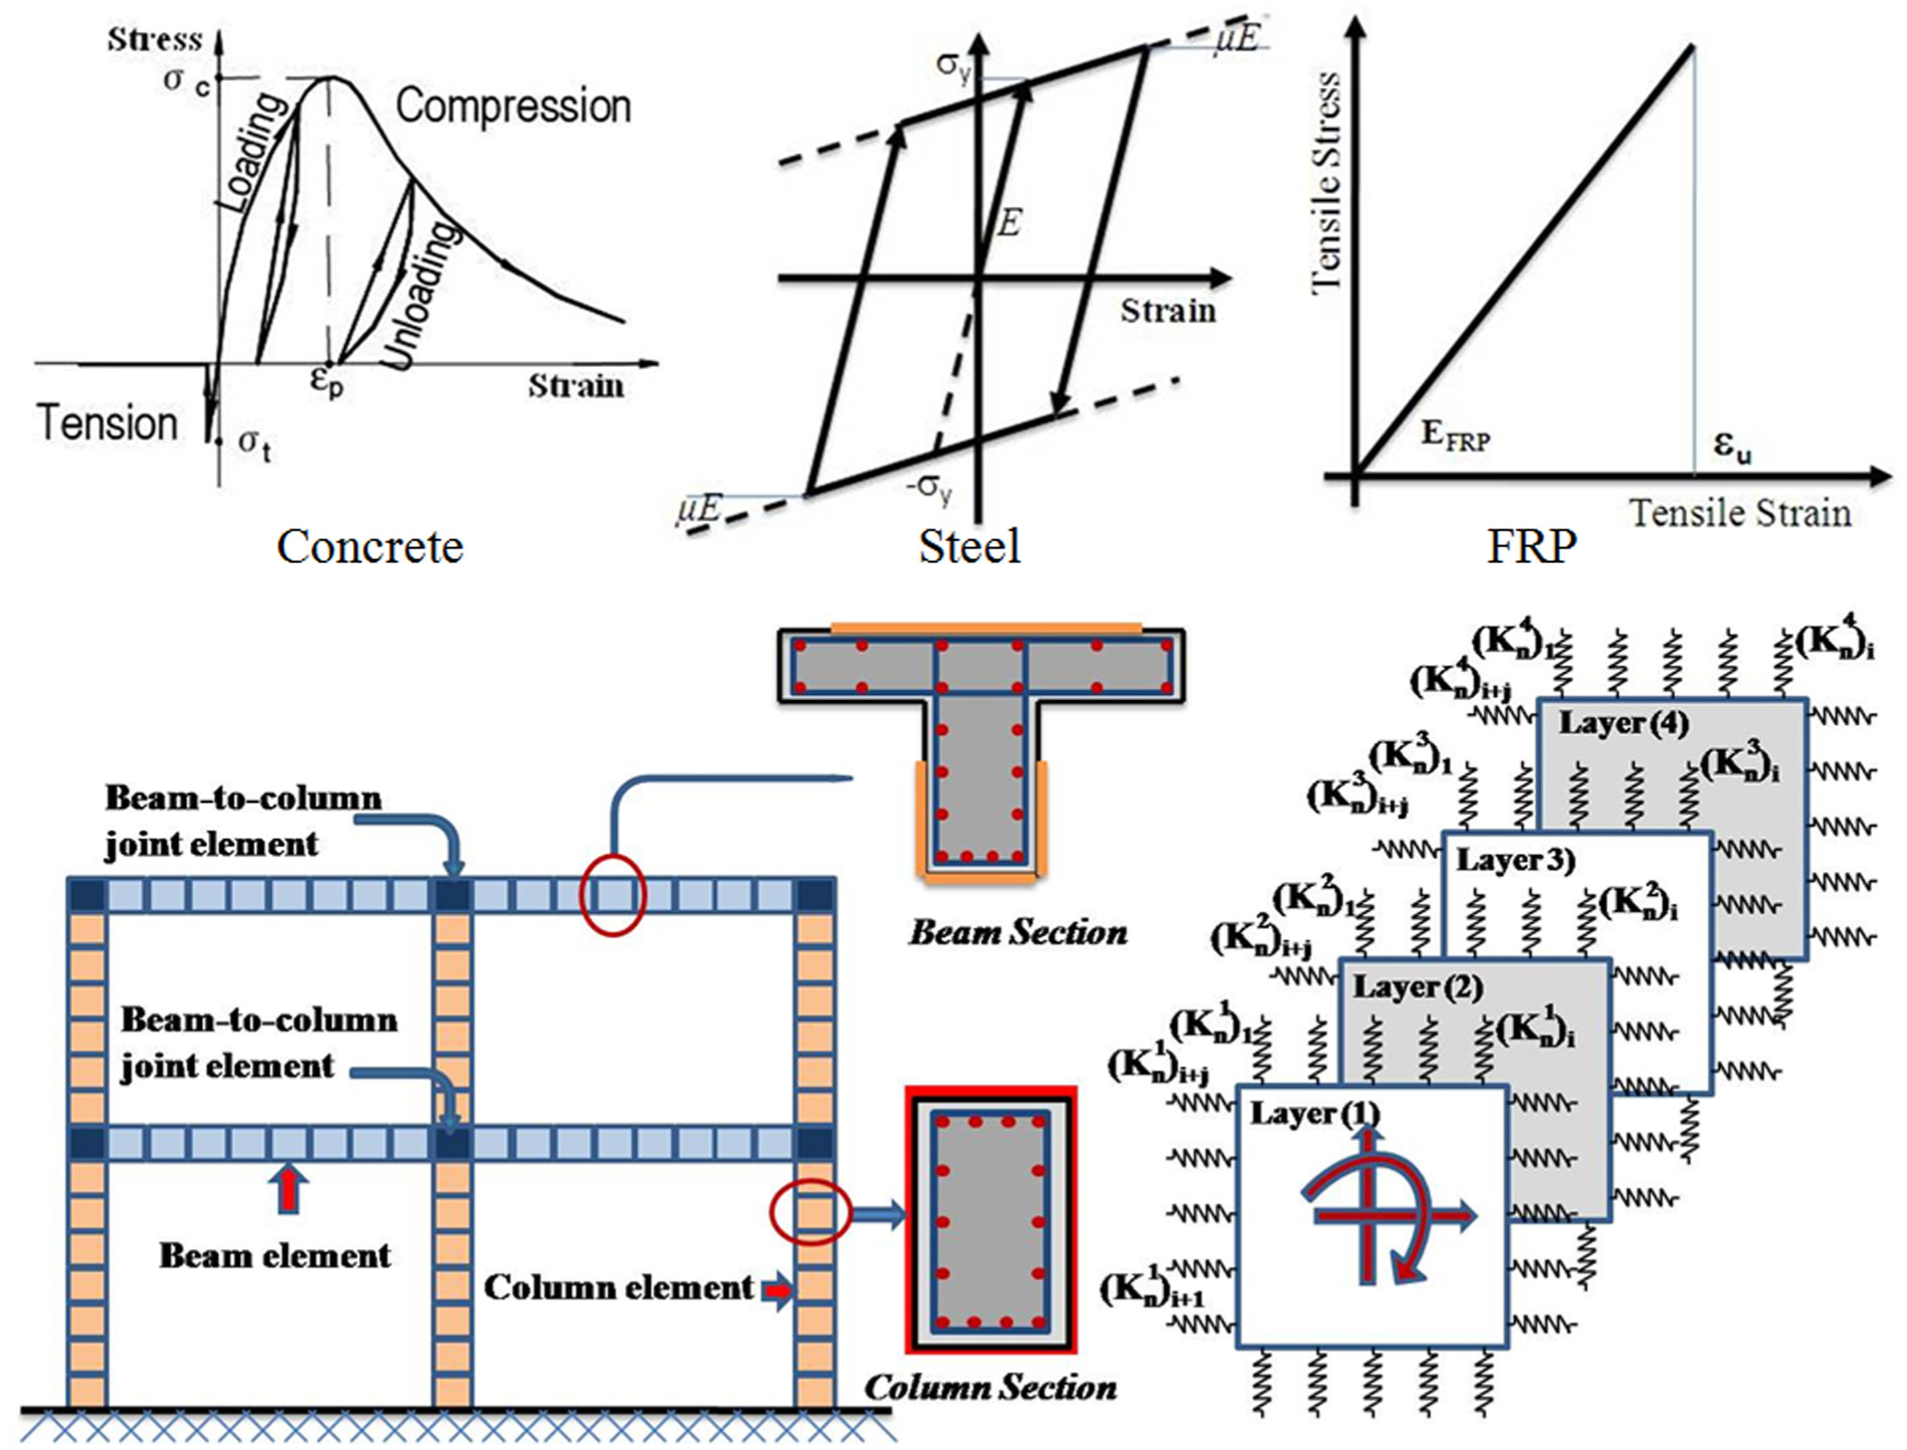
Fiber-based simulation models are developed for the four pre-code benchmark buildings and the 14 retrofit alternatives using the inelastic analysis platform Zeus-NL (Elnashai et al., 2012; Jeong and Elnashai, 2005). Several large research projects covering high-rise buildings and complex bridges have employed this analysis platform (Mwafy, 2013; Mwafy et al., 2010). The spread of yielding and cracking at both the cross section and the member levels is effectively captured in this modeling approach by idealizing each structural member using a number of elasto-plastic elements. A cubic shape formulation is used to calculate the deformations of the elasto-plastic elements, taking into consideration material and geometrical nonlinearities. Large displacements/rotations and P–Δ effects are taken into account in this modeling technique. The reinforcing steel, fiber-reinforced polymer (FRP), confined, and unconfined concrete are fully represented in the cross sections used for idealizing different structural members. The element cross sections are divided into a number of fibers, which enables monitoring the stresses and strains of different materials. The reinforcing steel is idealized using an elasto-plastic model with kinematic hardening. A uniaxial constant confinement concrete model and a uniaxial trilinear fiber-reinforced plastic model are used for modeling concrete and FRP, respectively (Elnashai et al., 2012). The adopted modeling of FRP wrapping provides additional confinement of the column concrete core and hence increases the overall strength. This modeling technique has been adopted in a number of previous studies (e.g. Billah and Alam, 2014; Thermou and Elnashai, 2006). More information regarding the analysis platform capabilities and adopted modeling approach is provided in the above-mentioned references.
Before applying lateral loads in inelastic analysis, the gravity loads are applied. The transient loads consist of accelerations that vary in the real-time domain. In dynamic analysis, the inertia effects are accounted for by applying lumped mass elements in the same manner adopted for gravity loads. The numerically dissipative Hilber–Hughes–Taylor integration algorithm is adopted in order to solve the equations of motion. This integration scheme allows for effective response predictions for highly inelastic structures (Elnashai et al., 2012). The inelastic static and dynamic analyses are conducted in the longitudinal direction of the reference structures, which results in the most critical response, as shown in Figure 4(c). The four framing systems presented in Figure 3 are identical in the extended transverse direction of the building layouts. This strongly supports conducting a two-dimensional vulnerability assessment in the longitudinal direction of the selected reference structures.
In addition to the fiber-based numerical models, additional numerical models are also employed to provide more insights into the collapse mechanisms of the reference structures under earthquake loading. The conventional finite-element method (FEM) has limitations when used to predict collapse. The discrete element techniques such as the distinct-element method (DEM) is based on the assumption that the objective material is composed of individual elements, and it can simulate a behavior of perfectly discrete material (Cundall, 1971). An extension of this method for simulating the large deformation and failure of structures was proposed by Meguro and Hakuno (1989) and termed extended discrete-element method (EDEM). The main disadvantage of the latter approach is that the results depend on the element shape, size, and arrangement. The accuracy of this method in a small deformation range is also less than that of FEM. A more efficient analysis technique which combines the advantages of FEM and EDEM was thus proposed by Meguro and Tagel-Din (2001).
Elkholy and Meguro (2005) introduced the improved applied element method (IAEM) for simulating the dynamic response of structures. In this modeling technique, each structural member is divided into rigid elements connected by normal and shear springs that are distributed on the boundaries between the elements. Additionally, a multi-layered element is recently proposed to model non-homogenous cross sections, as depicted in Figure 5 (Elkholy et al., 2010, 2012). This multi-layered element effectively models RC, steel, and composite sections. A uniaxial constant confinement concrete model and a bilinear stress–strain model with kinematic strain hardening are used to model the concrete and steel behavior, respectively. The geometric nonlinearity under both high static and dynamic loading is accounted for in this modeling approach. The IAEM efficiency for predicting the failure modes of structures was verified by Elkholy et al. (2012) and Elkholy and Meguro (2005).
Description of the modeling approach using the improved applied element method.
Uncertainty of vulnerability analysis
The most important uncertainties in fragility analysis are related to several sources such as input ground motions, material properties, lateral force–resisting system and structural characteristics, modeling approach and analysis method, and performance criteria. Some of the uncertainties are due to the lack of knowledge (epistemic), while others are inherently random (aleatory). Demanding simulations are needed if all the above-mentioned uncertainties are accounted for. This is particularly true when adopting a wide range of reference structures and input ground motions since a large number of inelastic response history analyses are needed. The adopted approach in this study for predicting performance criteria and deriving fragility curves using fiber-based numerical models and IAEM increases the computational effort further. Therefore, focusing on the most significant parameter(s) that control the fragilities is a more practical approach. Several previous studies concluded that the ground motion uncertainty is more important than those related to structural properties and material (Kwon and Elnashai, 2006; Mwafy et al., 2015). The uncertainty in ground motions is therefore accounted for in this study, while the material properties are considered equal to the mean values. The uncertainties related to modeling and analysis technique are assumed deterministic. Compared with other alternatives, the detailed modeling approach and analysis procedures of this study are the most efficient approaches for deriving fragility relationships, and hence, they considerably reduce the related uncertainties.
Although the approach of deriving fragility relationships analytically is one of the best alternatives in regions with scarce damage data from previous earthquakes, this technique requires a reliable definition of structural damage using performance limit states. A deterministic approach was considered in several previous studies (e.g. Jeong et al., 2012; Kwon and Elnashai, 2006; Mwafy et al., 2015), while few other studies employed different approaches such as selecting lower-bound, best-estimate, and upper-bound values for treating the uncertainty associated with mapping the performance criteria with structural damage. In this study, the large results obtained from pushover, incremental dynamic, and IAEM progressive collapse analyses are employed for mapping the limit states with local and global structural damage, including shear response. The statistical analysis of response results obtained from a wide range of input ground motions enables selecting lower-bound, median, and upper-bound values for the performance criteria. The limit states are then compared with those suggested in previous studies and in design guidelines to arrive at realistic definitions of the performance criteria for both the pre-code and retrofitted reference buildings.
Twenty natural earthquake records are selected for the seismic vulnerability assessment of the pre-code and retrofitted reference structures, as shown in Table 1. The earthquake records are selected from the Pacific Earthquake Engineering Research Center database to fit the design code response spectra of the reference region (European Committee for Standardization (CEN), 2004; Housing and Building National Research Center (HBRC), 2012; PEER, 2014). The earthquake records represent two different seismic scenarios: (1) near-source input ground motions, Type I, and (2) far-field records, Type II. The elastic response spectra of the selected natural records for 5% damping along with the design response spectra for 10% probability of exceedance in 50 years are shown in Figure 6. The mean response spectrum of the two seismic scenarios is not less than the design spectrum in the period range 0.2T1–1.5T1, where T1 is the average fundamental period of the benchmark buildings (ASCE/SEI-7, 2010). The acceleration–displacement response spectra (ADRS) presented in Figure 6(b) show that the impacts of earthquake scenario Type II on the seismic demands of the reference structures are expected to be much higher than those of ground motions Type I, as illustrated from the vulnerability assessment results presented in the subsequent sections. It is worth noting that the horizontal components of the selected earthquake records are employed in the current vulnerability assessment study. The impacts of the vertical component of ground motions on the seismic response of RC structures in the vicinity of active faults, which were the focus of other previous studies, are beyond the scope of this study (e.g. Kim and Elnashai, 2009; Kim et al., 2011; Mwafy and Elnashai, 2008).
Characteristics of input ground motions.
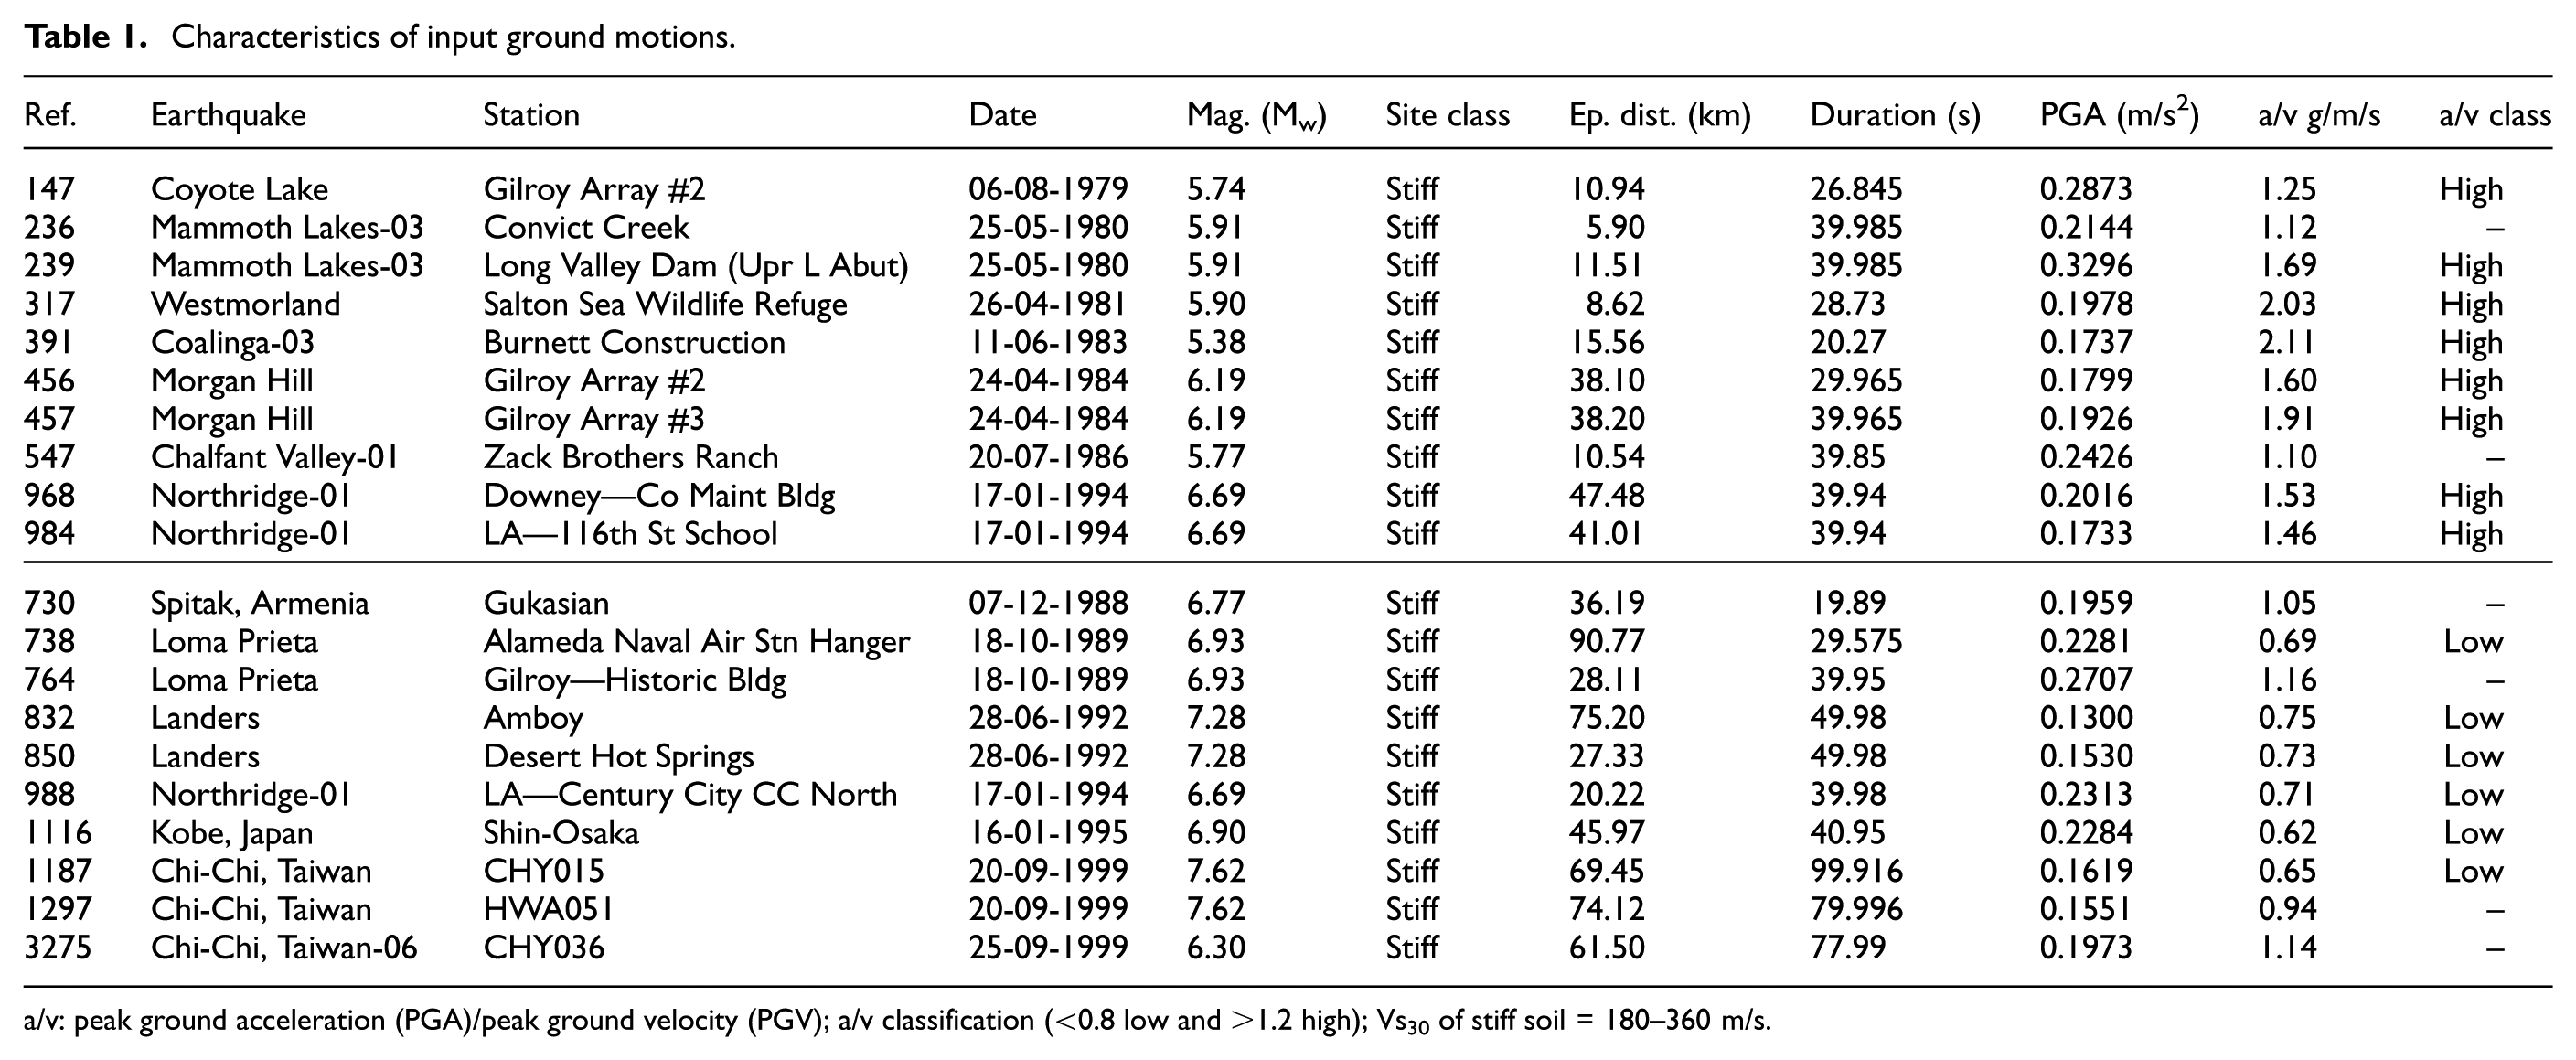
a/v: peak ground acceleration (PGA)/peak ground velocity (PGV); a/v classification (<0.8 low and >1.2 high); Vs30 of stiff soil = 180–360 m/s.
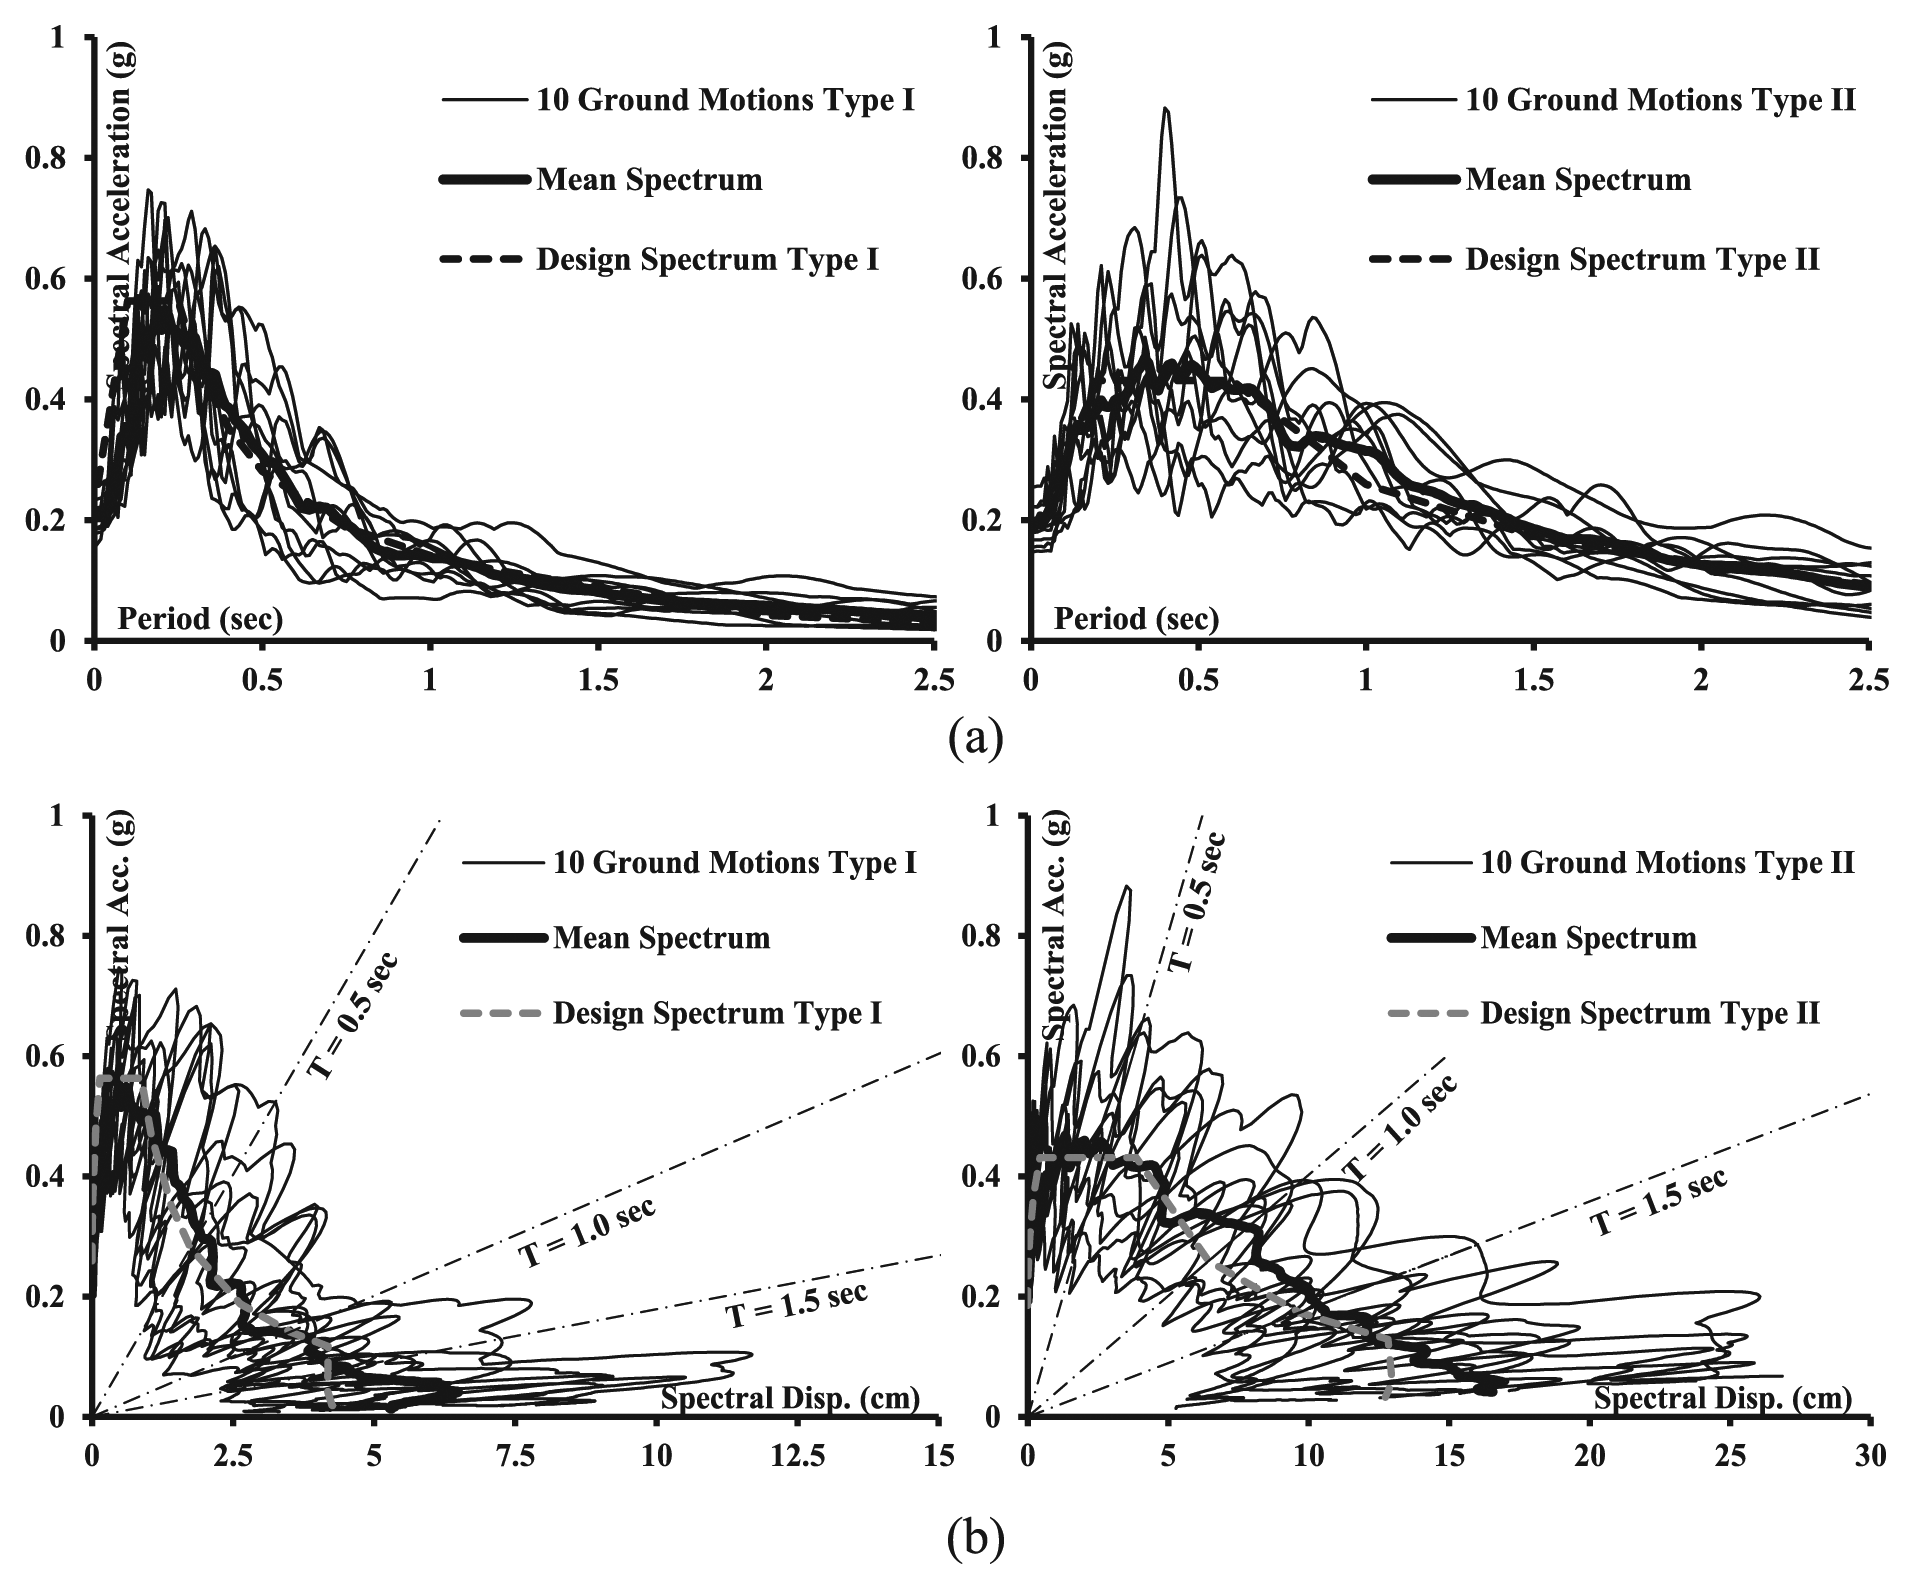
Elastic response spectra (5% damping) of 20 natural ground motions representing near-source (Type I) and far-field (Type II) earthquake scenarios along with the mean and design spectra: (a) acceleration response spectra and (b) acceleration–displacement response spectra (ADRS).
The peak ground acceleration (PGA) over peak ground velocity (a/v) ratio provides a measure for the frequency content of ground motion. The low a/v ratio (<0.8g/m/s) represents earthquakes with low predominant frequencies and broad response spectra, while the high a/v ratio (>1.2g/m/s) represents high predominant frequencies and narrow band spectra. It is shown from Table 1 that most of the selected input ground motions follow the above-mentioned classification. Furthermore, the significant duration of ground motions is defined as the interval between the times at which 5% and 95% of the total integral of the square of acceleration, velocity, and displacement are attained. Since the ground motion could start at very large acceleration, and hence apply high pulse to the structure, the interval between 0.5% and 95% of the integrals is adopted in this study (Kwon and Elnashai, 2006). This approach significantly reduces the computational effort, particularly under the effect of long-duration ground motions.
Retrofit techniques
The inadequate strength of the benchmark school buildings is confirmed from the inelastic analysis results discussed in subsequent sections. The weak columns may cause early yielding in vertical elements, and hence collapse mechanisms. Shear failure may also occur in these columns before the formation of flexural hinges (FEMA, 2006). The primary focus of selecting retrofit techniques in this study is therefore on the vertical structural members. It is important to note that the beam/connection jacketing is more demanding, time-consuming, and usually less important than the retrofit of the vertical structural members. It was reported in the literature that the construction time, and hence total cost, required for jacketing of both beams and columns is several times higher than that required for jacketing columns only (Alcocer, 1993; Alcocer and Jirsa, 1993). This renders beam and connection jacketing unsuitable for low-to-medium seismic regions. The retrofit of columns is typically easier and reduces seismic demands and the plastic hinge formation in the vertical structural members. Hence the potential of hinging mechanisms is reduced, as confirmed from the results presented in the subsequent sections. Two retrofit approaches related to the inadequate strength and stiffness are adopted: (1) RC jacketing of the columns and (2) FRP wrapping of the vertical members. The RC jacketing of the columns is directed toward the inadequate strength and stiffness in addition to the lack of strong column-weak beam detailing. On the other hand, the FRP overlays improve confinement and shear strength (FEMA, 2006). The two retrofit approaches are assessed in this study with different applications.
Two different retrofit alternatives based on the RC jacketing of column are studied: (1) RC-jacketed columns are considered in all stories and (2) only ground story columns are retrofitted to reduce cost, as shown in Figure 7(a) for building B3-JGS. In this retrofit approach, the surface of the existing concrete is roughened and drilled dowels are added to arrive at a satisfactory composite action. The reinforcing steel added around the existing column cross section is shown in Figure 7(a). The main disadvantages of column jacketing are the need for formwork and the difficulties in casting concrete.
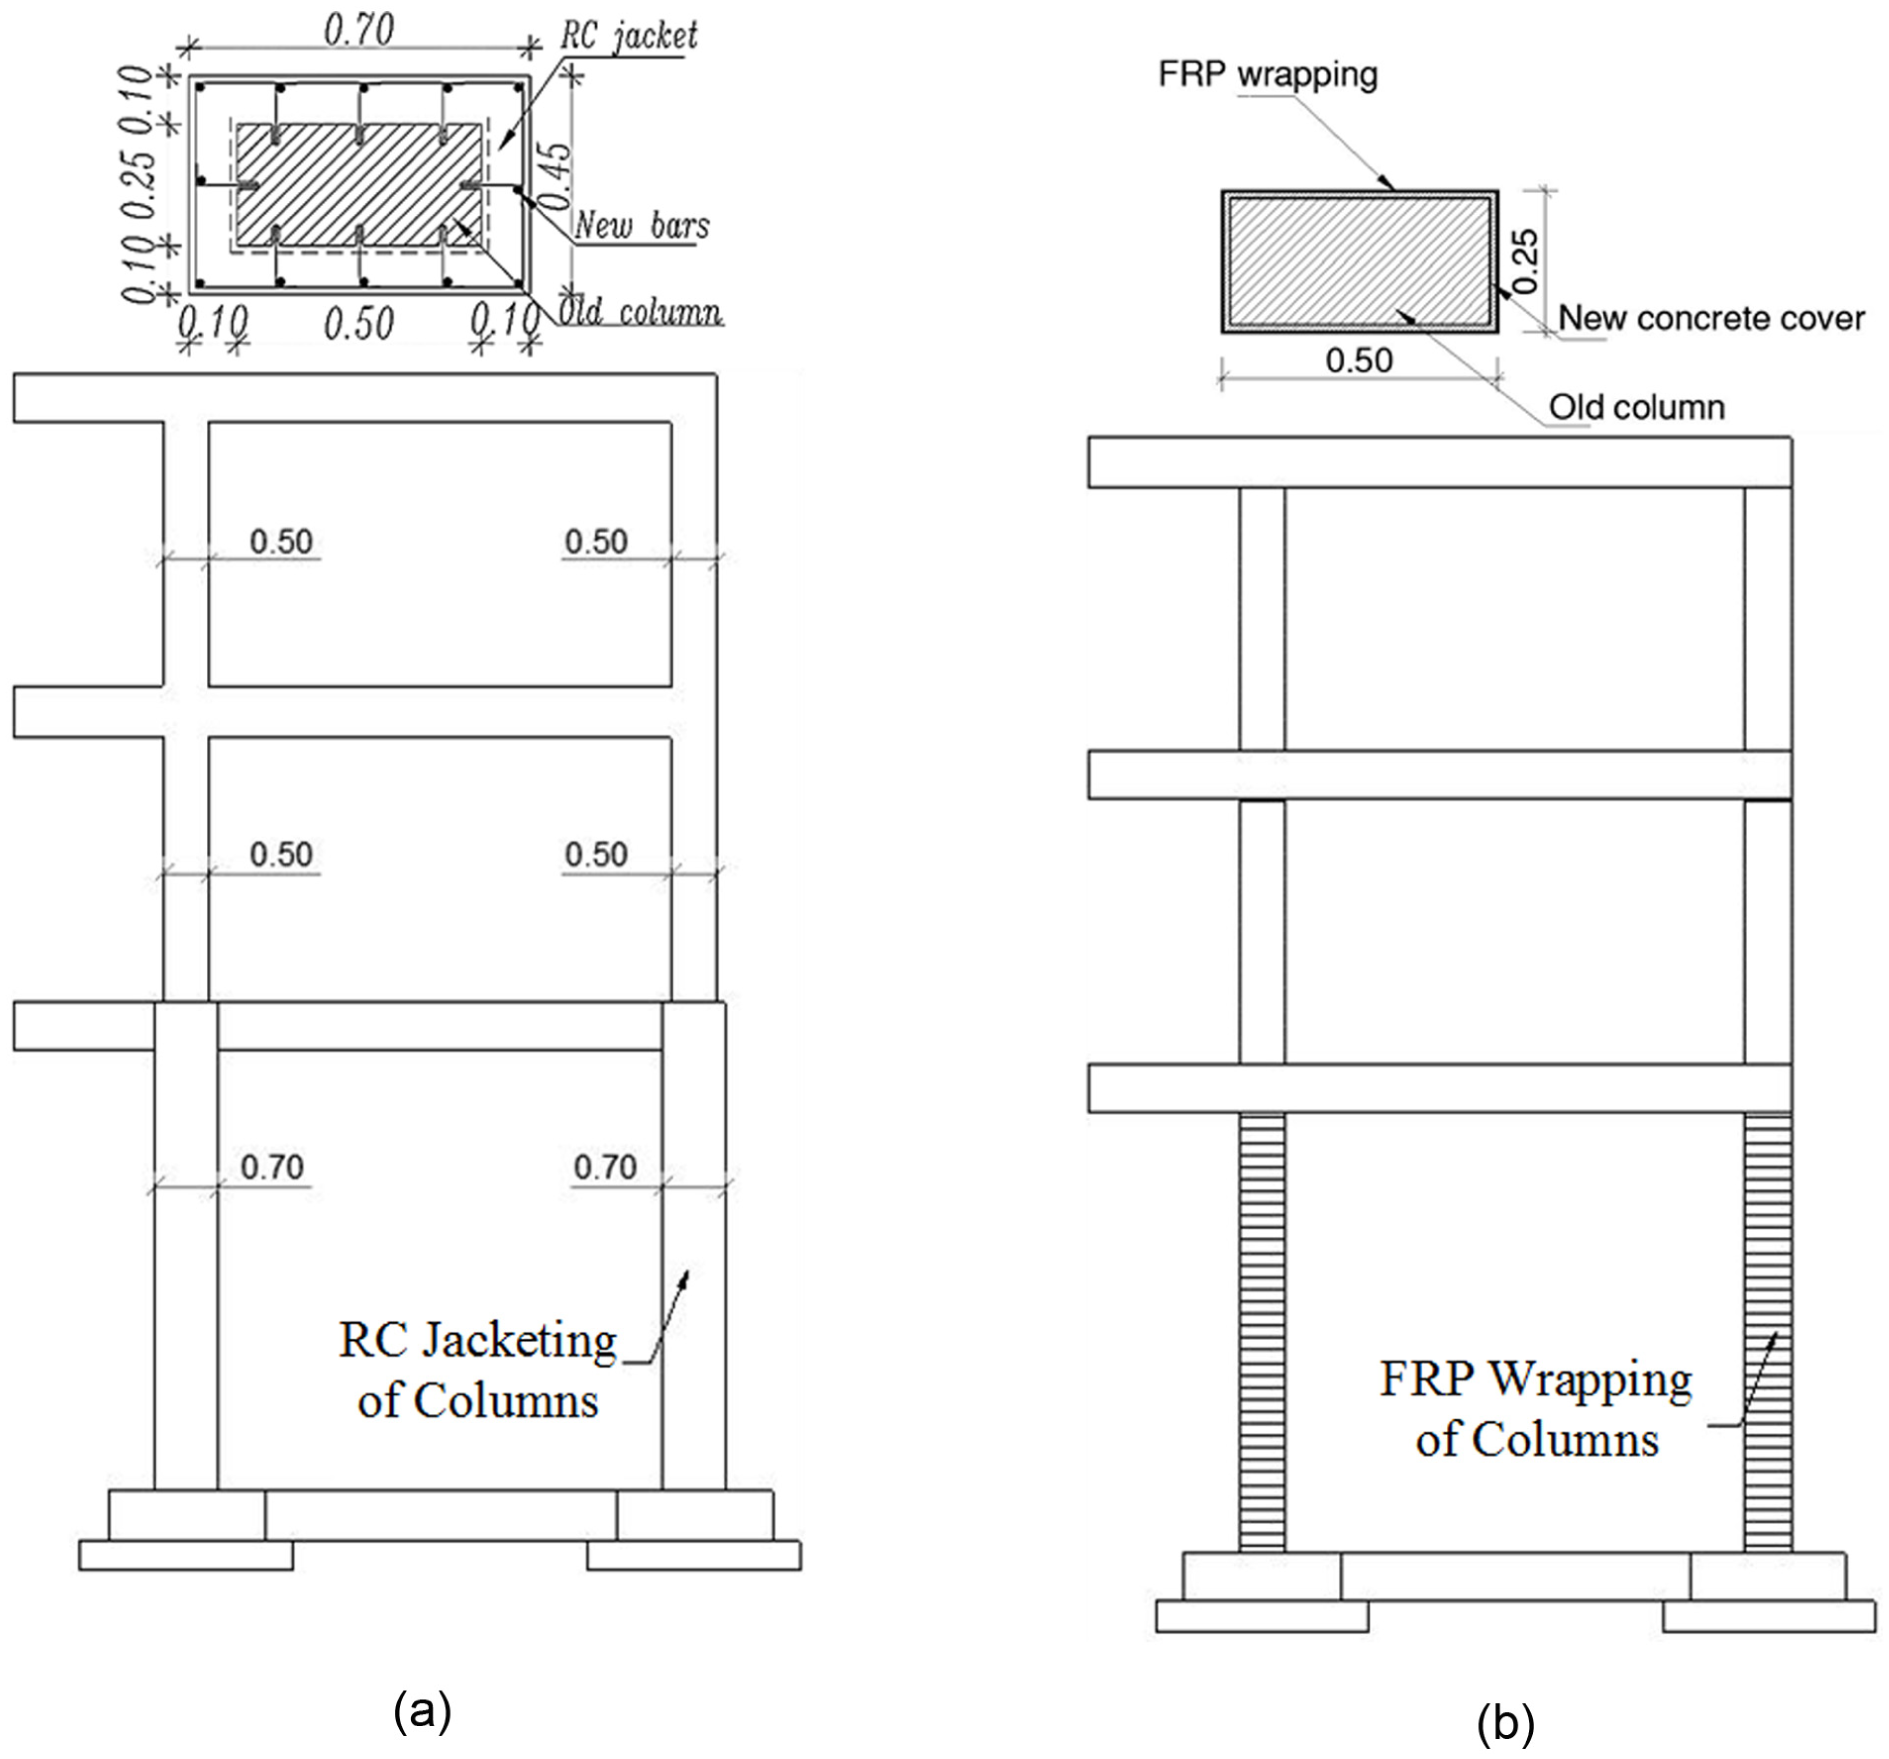
Retrofit of buildings using RC jacketing (left) and FRP overlays (right): (a) RC jacketing of ground story columns (building B3-JGS) and (b) wrapping of ground story columns with FRP overlays (building B5-HS2).
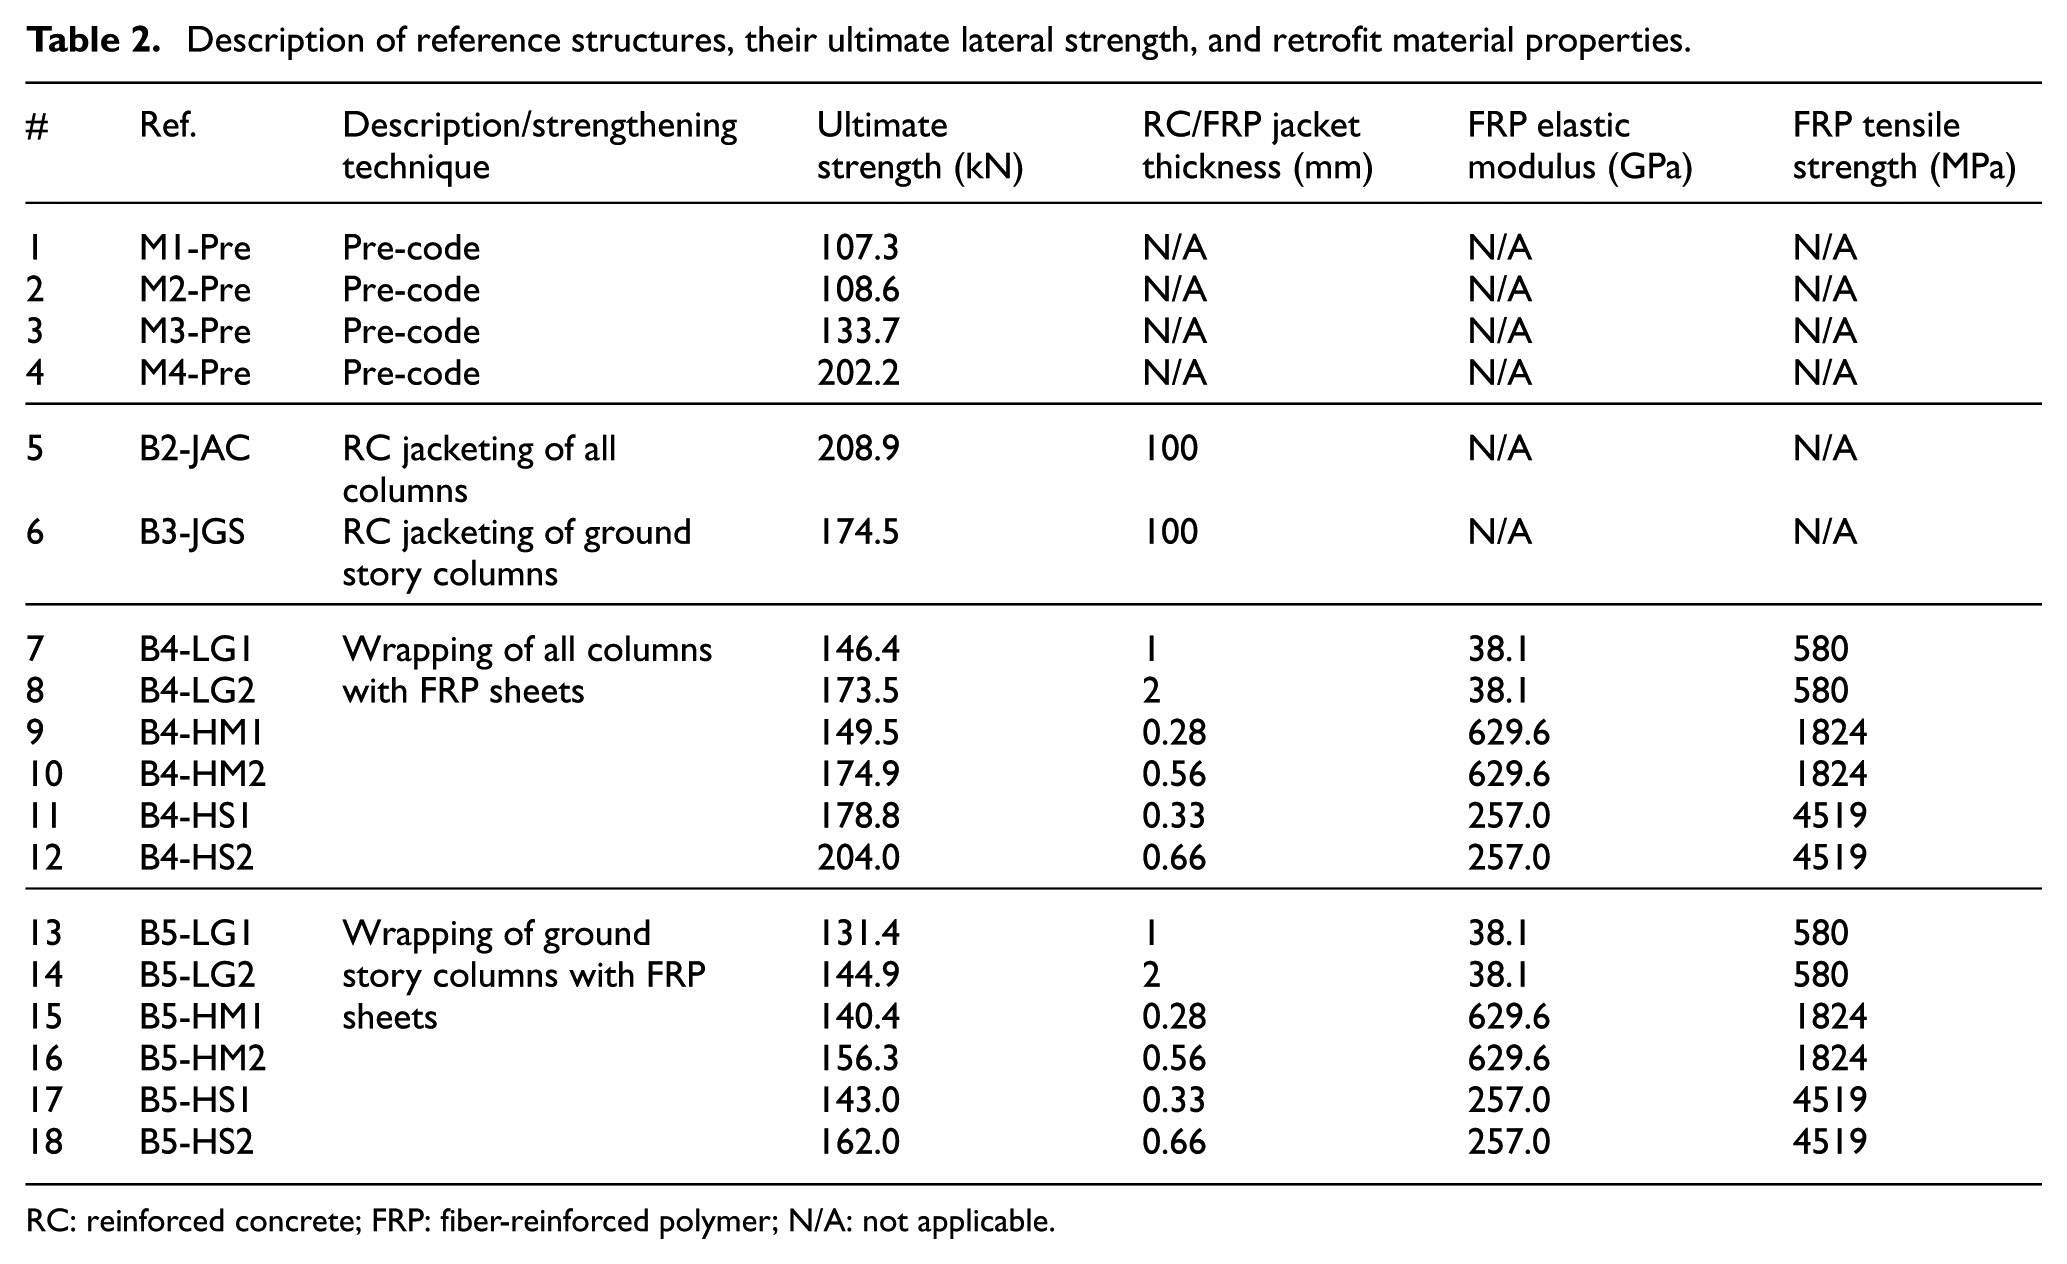
To select the most suitable material for the FRP overlays, three different material properties are compared: (1) low grade (LG), (2) high modulus (HM), and (3) high strength (HS), as shown in Table 2 (e.g. Federation Internationale du Beton (FIB), 2001). Moreover, two different thicknesses and two applications are considered for this retrofit approach, as shown in Table 2. From the 12 FRP retrofit cases shown in Table 2 for building M1-Pre (i.e. cases 7–18) and based on the ultimate strength obtained from inelastic pushover analysis (POA) results, two FRP retrofit alternatives are selected for further examination: (1) B4-HS2 and (2) B5-HS2. To enhance confinement and shear strength, the existing columns are wrapped with unidirectional fibers oriented horizontally, while lap splices are staggered to avoid a weak plane. Increasing the confinement of the columns increases overall strength (FEMA, 2006). A small gap between the FRP composite and boundary elements is used to prevent increasing the initial stiffness of the columns. Figures 8 and 9 and Table 2 show that the lateral strength of the FRP alternatives is equivalent to the strength of the RC jacketing options (i.e. B2-JAC and B3-JGS). This enables rational comparisons between the selected retrofit alternatives.
Description of reference structures, their ultimate lateral strength, and retrofit material properties.
RC: reinforced concrete; FRP: fiber-reinforced polymer; N/A: not applicable.
Comparisons between base shear–interstory drift relationships obtained from pushover analysis of a pre-code building and those with different FRP retrofit options along with the target design strength.
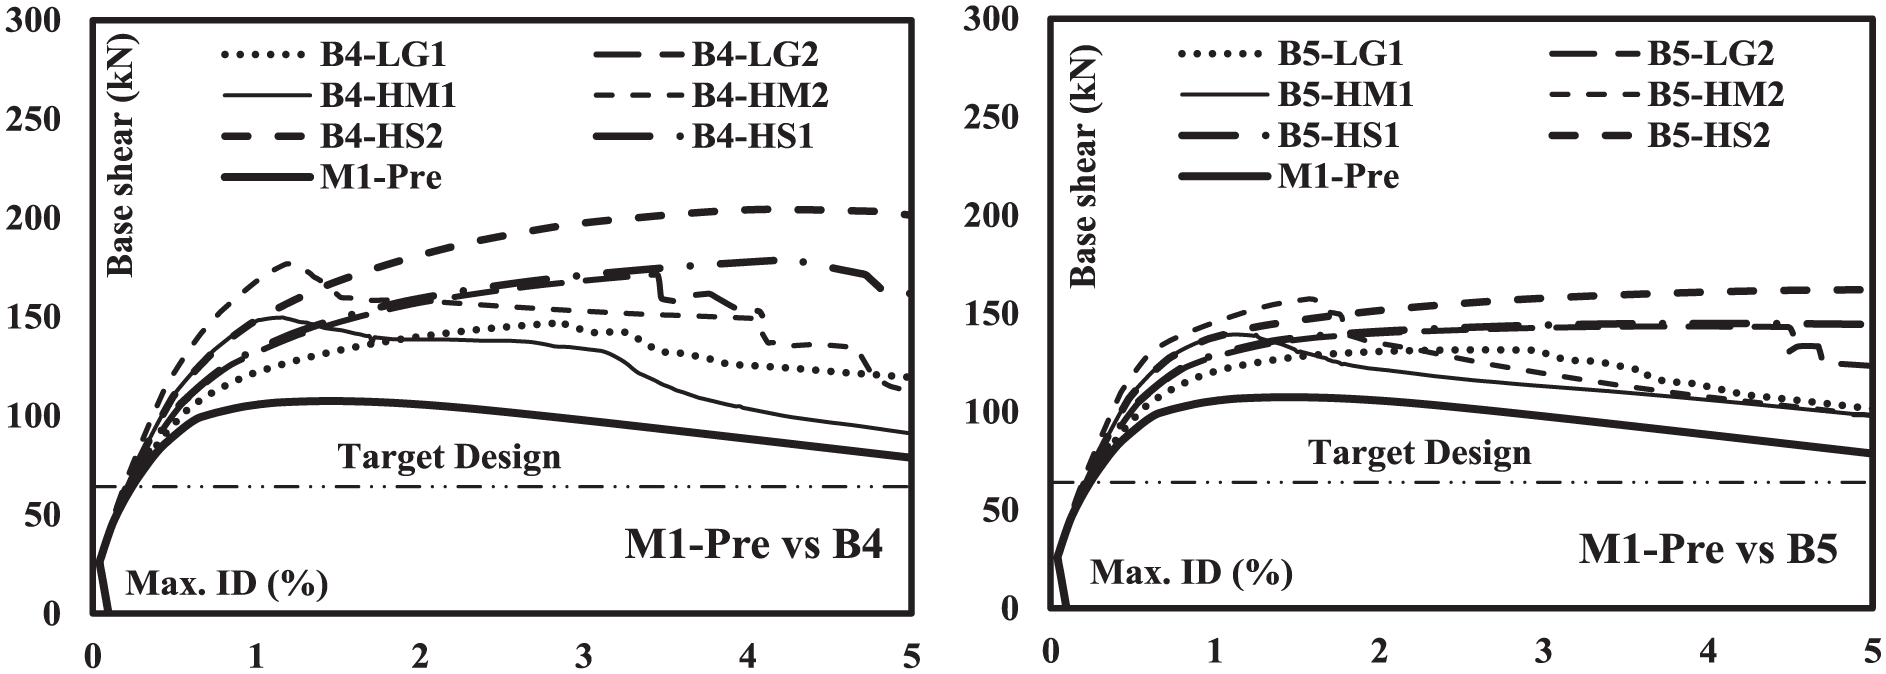
Strength levels and first column yielding of a pre-code building and its retrofit alternatives: (a) target design strength, (b) M1-Pre strength, (c) strength of the retrofit options for ground story columns, and (d) strength of the retrofit alternatives for all columns.
The target seismic design strength for building M1-Pre, which is estimated based on the most recent seismic design provisions of the reference site, is depicted in Figures 8 and 9 (CEN, 2004; HBRC, 2012). Buildings designed to modern codes should possess minimum overstrength (Ω), which is defined as the actual-to-design strength (Elnashai and Mwafy, 2002). For RC frame structures, the overstrength factor ranges from 2.0 to 3.0 (ASCE/SEI-7, 2010; CEN, 2004; Mwafy, 2013). This results in a target lateral strength of 128–192 kN. It is shown that the selected retrofit alternatives achieve the required target strength and improve the seismic performance of pre-code school buildings to that required by modern seismic codes, as shown in Table 2 and Figure 9. The selection of an efficient and cost-effective retrofit technique from the alternatives shown in Figure 9 for pre-code school buildings based on a systematic probabilistic assessment approach is discussed in the subsequent sections.
Definition of performance criteria
The performance limit states adopted in this study are the immediate occupancy “IO,” life safety “LS,” and collapse prevention “CP” (ASCE/SEI-41, 2007). Due to the inadequate reinforcement detailing for ductility and insufficient capacity, lower limit states should be assigned to pre-code RC frame structures when compared with those assigned to well-designed buildings. For the IO, LS, and CP performance levels, the interstory drift ratios (IDRs) recommended by ASCE/SEI (2007) for code conforming concrete frames are 1%, 2%, and 4%, while they are 0.5%, 1%, and 2% for pre-code buildings, respectively. The latter set of the drift values are based on column rotations. Other performance criteria were recommended in the literature based on the analytical and experimental results. For instance, Ghobarah et al. (1999) proposed limit states for ductile and non-ductile MRFs. The IDRs associated with “minor,”“moderate,” and “collapse” were 0.7, 1.3, and 4.8 for ductile MRFs, while they were 0.7, 1.1, and 2.5 for non-ductile MRFs, respectively.
To define the performance criteria of the pre-code buildings and retrofit alternatives, several approaches are followed and their results are compared with those proposed by design guidelines and previous studies. These approaches utilized the results of POAs, incremental dynamic analyses (IDAs), and IAEM progressive collapse analyses, which enable mapping the performance criteria with different levels of damage states at the member and the structure levels. To occupy a building immediately after the earthquake, it should remain in the elastic range so that non-structural components are not considerably damaged. The first yield in the structural members is considered when the strain of the main longitudinal reinforcement goes beyond the steel yield strain. The LS limit state, which falls between the IO and CP, represents a “significant damage” sustained by the structure, while it accounts for a reasonable margin of safety against collapse. This margin is considered 50% of the CP limit state (ASCE/SEI-41, 2007).
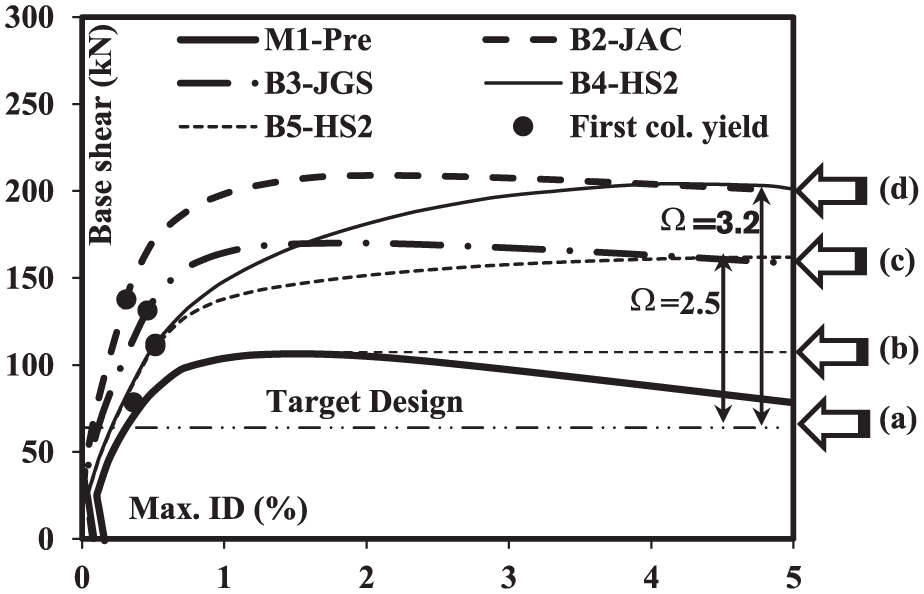
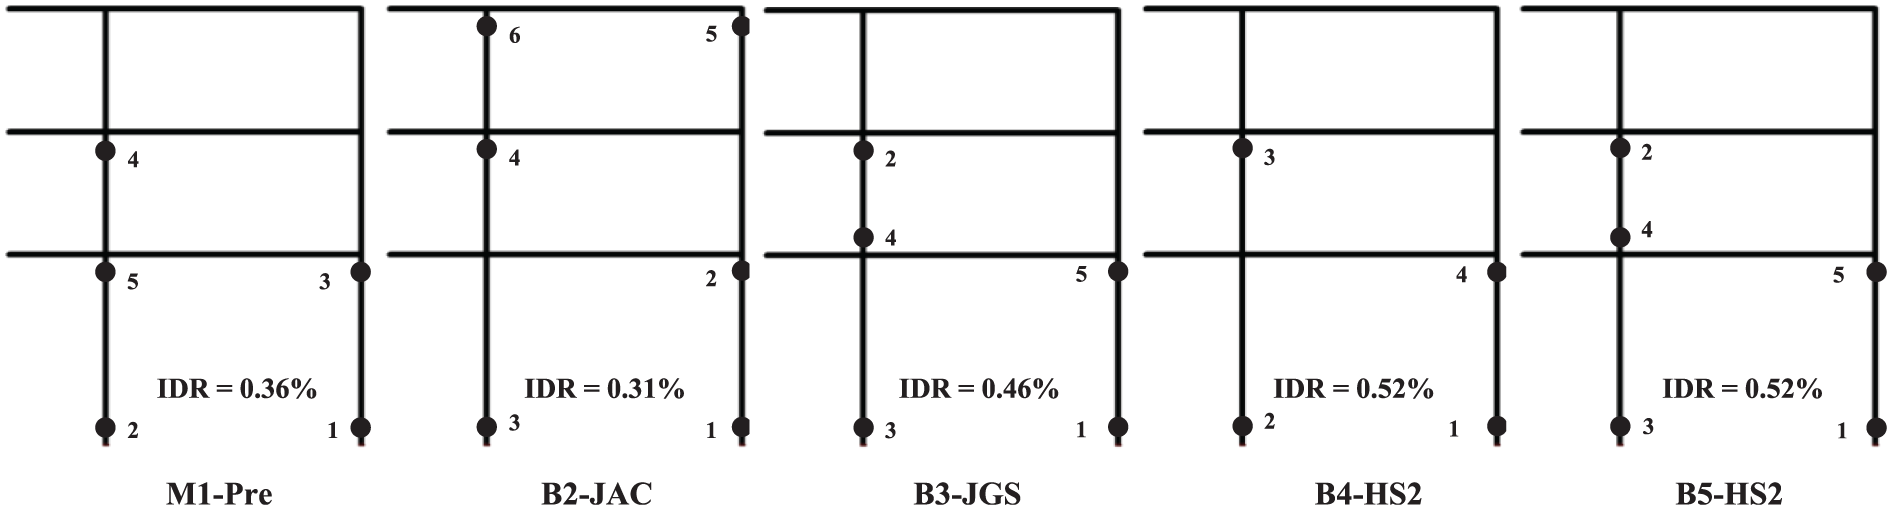
A sample of the lateral capacity envelopes obtained using POA for the benchmark buildings is depicted in Figure 9. The first indication of yielding in the columns is also shown on the capacity curves of Figure 9, while Figure 10 depicts the maximum IDR distributions at the first indication of column yielding for the pre-code building M1-Pre and its retrofit alternatives. Figure 11 maps the sequence of hinge formation with the maximum IDR at first yield in the columns. A plastic hinge is considered once the strain of the main longitudinal tensile reinforcement exceeds the steel yield strain (e.g. Elnashai and Mwafy, 2002). This threshold represents the onset of the plastic branch of a linearized moment–curvature diagram. With the exception of building B2-JAC, the first indication of yielding occurs at higher IDR in the retrofitting structures. RC jacketing of building B2-JAC at all stories significantly increases stiffness, and hence, high lateral forces are attracted and cause slightly early yielding in the columns. However, it is clear from Figure 11 that all retrofit approaches succeed in preventing any hinging mechanism, which is only observed in the pre-code structure (M1-Pre). As per the presented results in Figures 9 and 11, the IDRs corresponding to the IO limit sate are summarized in Table 3.
Comparison between maximum interstory drift distributions of 15 investigated buildings at a top displacement of 2.5%.
Mapping of the sequence of column plastic hinge formation from pushover analysis along with the interstory drift at the first indication of column yield.
Summary of the performance criteria of reference structures.
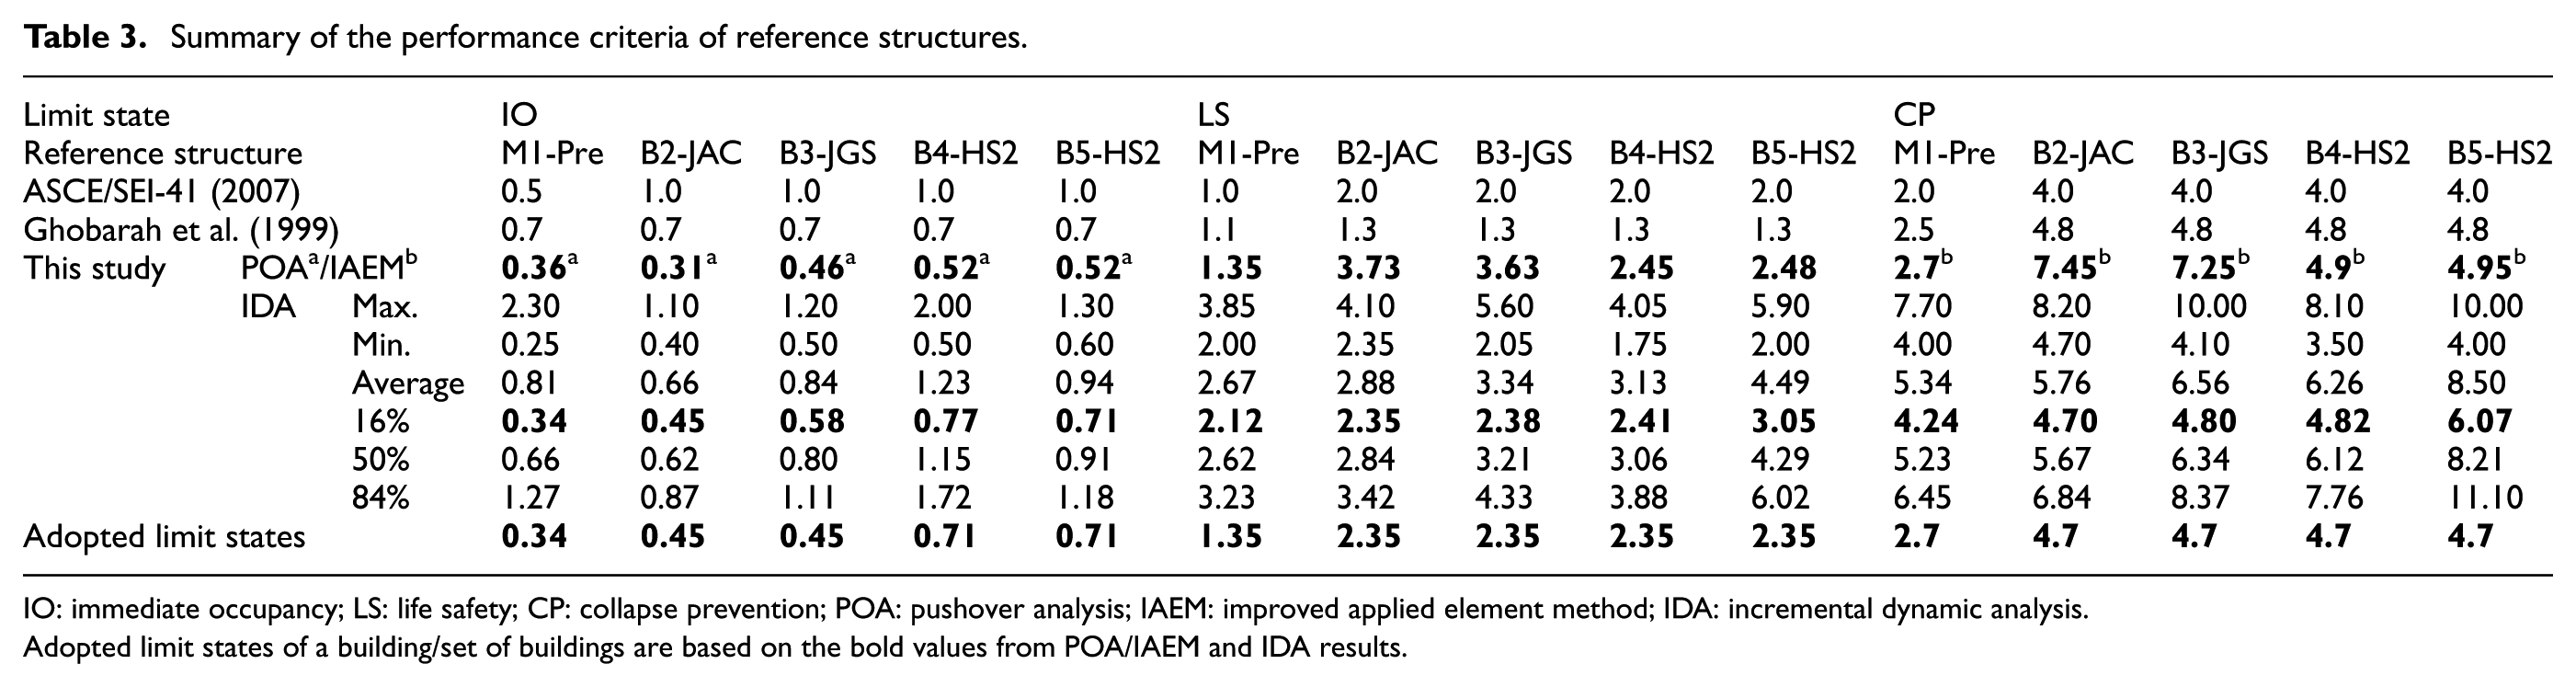
IO: immediate occupancy; LS: life safety; CP: collapse prevention; POA: pushover analysis; IAEM: improved applied element method; IDA: incremental dynamic analysis.
Adopted limit states of a building/set of buildings are based on the bold values from POA/IAEM and IDA results.
The maximum column flexural strength and ultimate confined concrete strain are studied for any possible damage related to the LS and CP performance limit states, respectively. The strain of the confined concrete is estimated based on the confinement effects provided by transverse reinforcement. Figures 12 and 13 depict the sample results for building M1-Pre, indicating that the LS and CP limit states occur at IDRs of 1.6% and 4.0%, respectively. These values, which are attributable to the amount of longitudinal and transverse reinforcing steel in the columns, are much higher than those suggested in previous studies for pre-code buildings. This reflects the need for exploring other approaches for defining the LS and CP limit states of the pre-code and retrofitted buildings.
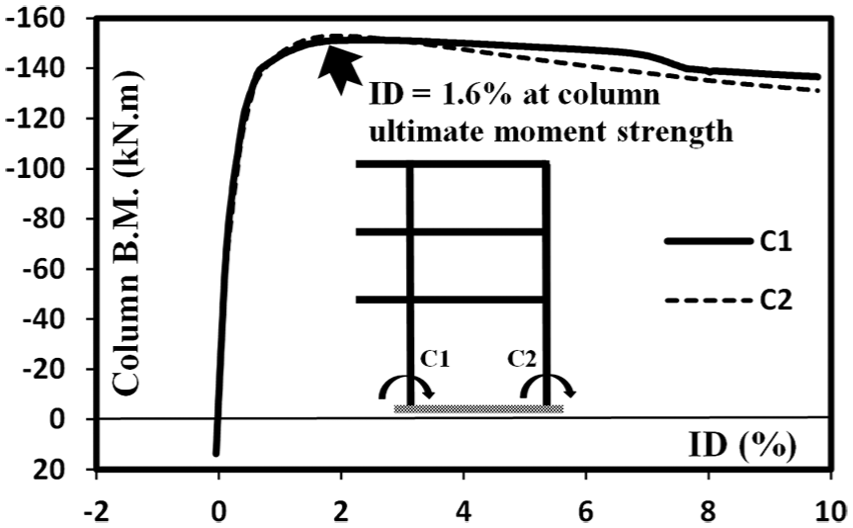
Maximum interstory drift at the maximum moment strength of columns (building M1-Pre).
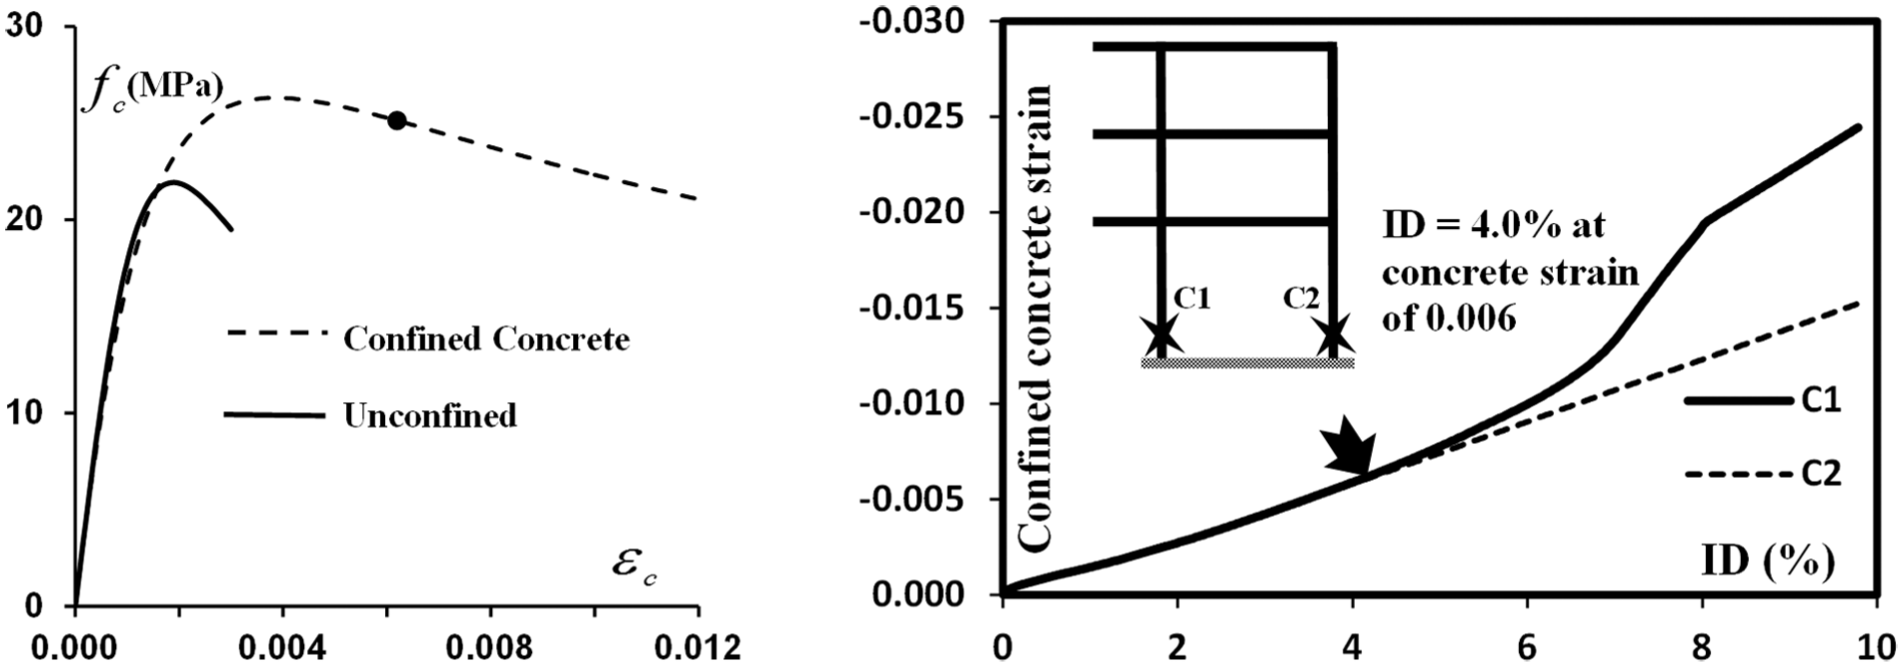
Mapping of ultimate confined concrete strain in columns with maximum interstory drift (building M1-Pre).
Two shear strength approaches are also used for the assessment of shear as a possible CP limit state. The reduction in shear supply with the degradation of the concrete strength is accounted for in the first approach (Priestley et al., 1994). The American Concrete Institute (ACI) shear supply model is also used for comparison with the above-mentioned shear model after excluding the design safety factors (ACI-318, 2011). The monitored shear supply–demand response accounts for the shear–axial interaction and the reduction in shear strength with increasing ductility demands (Mwafy and Elnashai, 2008). Figure 14 depicts the shear demand–supply response obtained from POA and response history analyses for a ground story column in building M1-Pre. The input ground motion no. 738 is scaled to a PGA of 0.5g and used in the time-history analysis. This level of PGA causes significant damage in building M1-Pre (near collapse), as shown from the IDA results presented hereafter. It is noteworthy that the over-conservatism of the design code shear strength model in predicting shear supply was confirmed from previous studies (e.g. Mwafy and Elnashai, 2008; Priestley et al., 1994). Figure 14 clearly shows that shear is not a critical failure criterion for the reference structures since the shear capacity estimated using the realistic shear strength model of Priestley et al. (1994) is much higher than the demand.
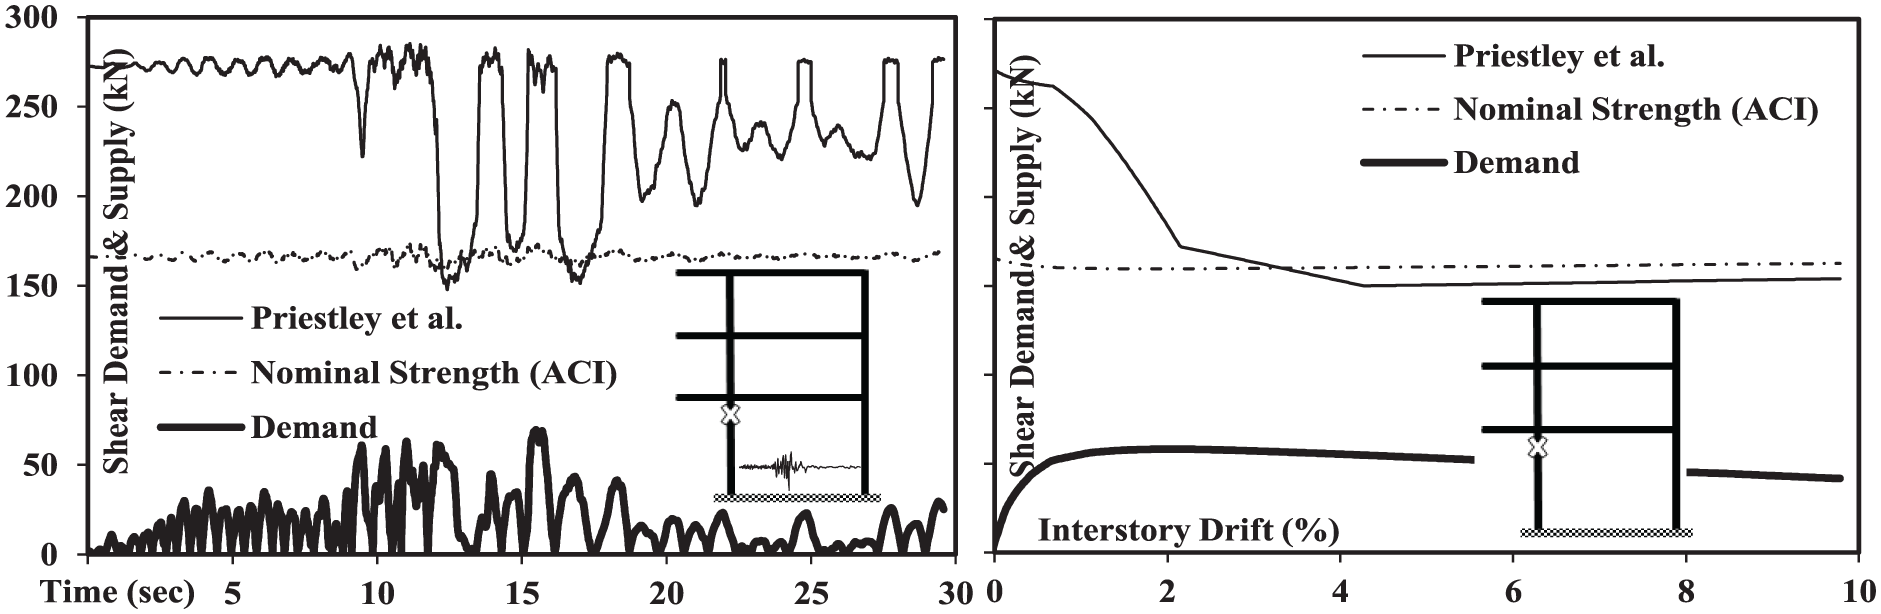
Shear demand versus shear strength of a ground story column obtained from time-history analysis (left) and pushover analysis (right)—building M1-Pre, ground motion 738 at a PGA of 0.5g.
It is noteworthy that under the effect of earthquake loads, actions and deformations are mainly developed in the columns and the beams framing into beam–column joints. Hence, unlike the horizontal cantilever members of buildings M1-Pre and M2-Pre, plastic hinges and failure modes are mainly observed in the columns and beams, as shown from the sample results presented in Figures 11 to 14 and the collapse analysis results presented hereafter. Modern seismic codes impose special design requirements for horizontal cantilever members longer than 5.0 m if the structure is subjected to a high vertical ground motion (CEN, 2004) or for high Seismic Design Categories (ASCE/SEI-7, 2010). These special seismic design provisions for cantilever members are intended to account for the effect of the vertical component of ground motions in the vicinity of active faults (e.g. Kim and Elnashai, 2009; Mwafy, 2012).
The analytical models developed using IAEM are employed in this study to provide insights into the failure modes of the reference structures. Figure 15 shows the sample IAEM collapse analysis results at different time steps and PGA levels (Elkholy et al., 2010). For building M1-Pre, the collapse mode is controlled by the weak ground story, which has lower strength and stiffness than other stories due to its increased height. This failure mechanism was also detected using the fiber-based numerical models and POA (i.e. formation of plastic hinges at the top and bottom of all columns in the ground story), as shown in Figures 10 and 11. RC jacketing and FRP wrapping of the columns shift the failure modes of the retrofitted buildings to be in the beams rather than the columns, as shown in Figures 11 and 15. It is important to note that Figure 11 shows fiber-based POA results for the sequence of plastic hinges in the columns, while plastic hinges in beams were not presented due to the higher impact of hinge formation in the vertical structural members on the structure failure mechanism. In this analysis, a predefined lateral load distribution is applied to the reference structures and monotonically increased with a displacement control at the top of the building until the collapse limit state is reached (Elnashai et al., 2012). Figure 15, on the other hand, presents IAEM time-history analysis results for the deformations and collapse mechanisms. In the latter analysis procedure, the structure is subjected to transient cyclic loads, which consist of accelerations that vary in the real-time domain. Despite the above-mentioned distinctions, and as highlighted earlier, the fiber-based POA and IAEM collapse analysis results presented in Figures 11 and 15 confirm that both idealization/analysis techniques detected the side-sway failure mechanism of M1-Pre at the ground story. The results of the two analysis procedures also confirm that the selected retrofit approaches generally constrain column hinging collapse mechanisms.
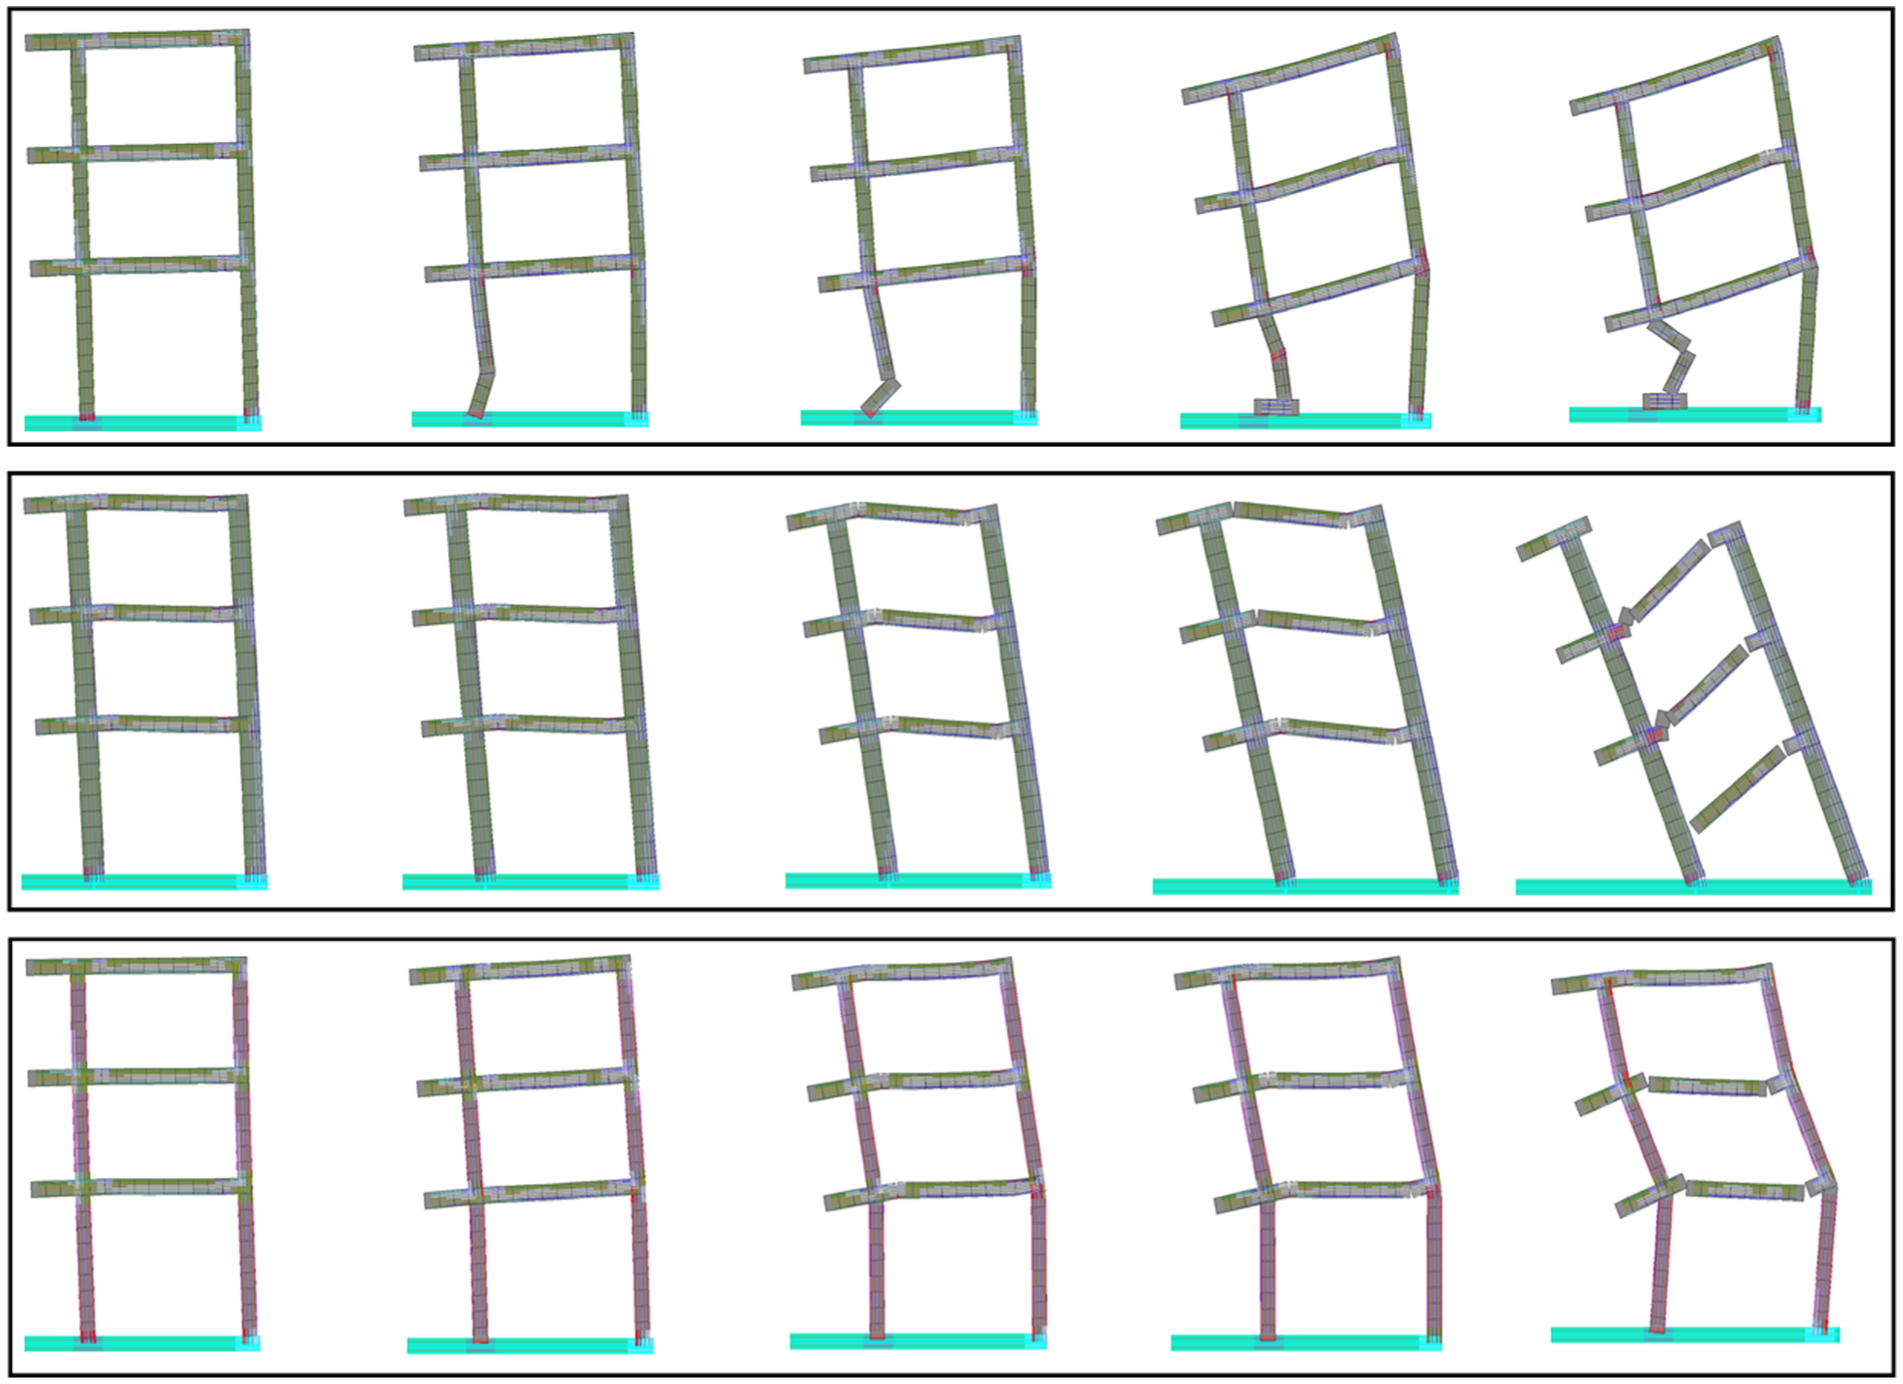
Deformations and collapse mechanisms of buildings M1-Pre (top), B2-JAC (middle), and B4-HS2 (bottom) obtained from IAEM analysis.
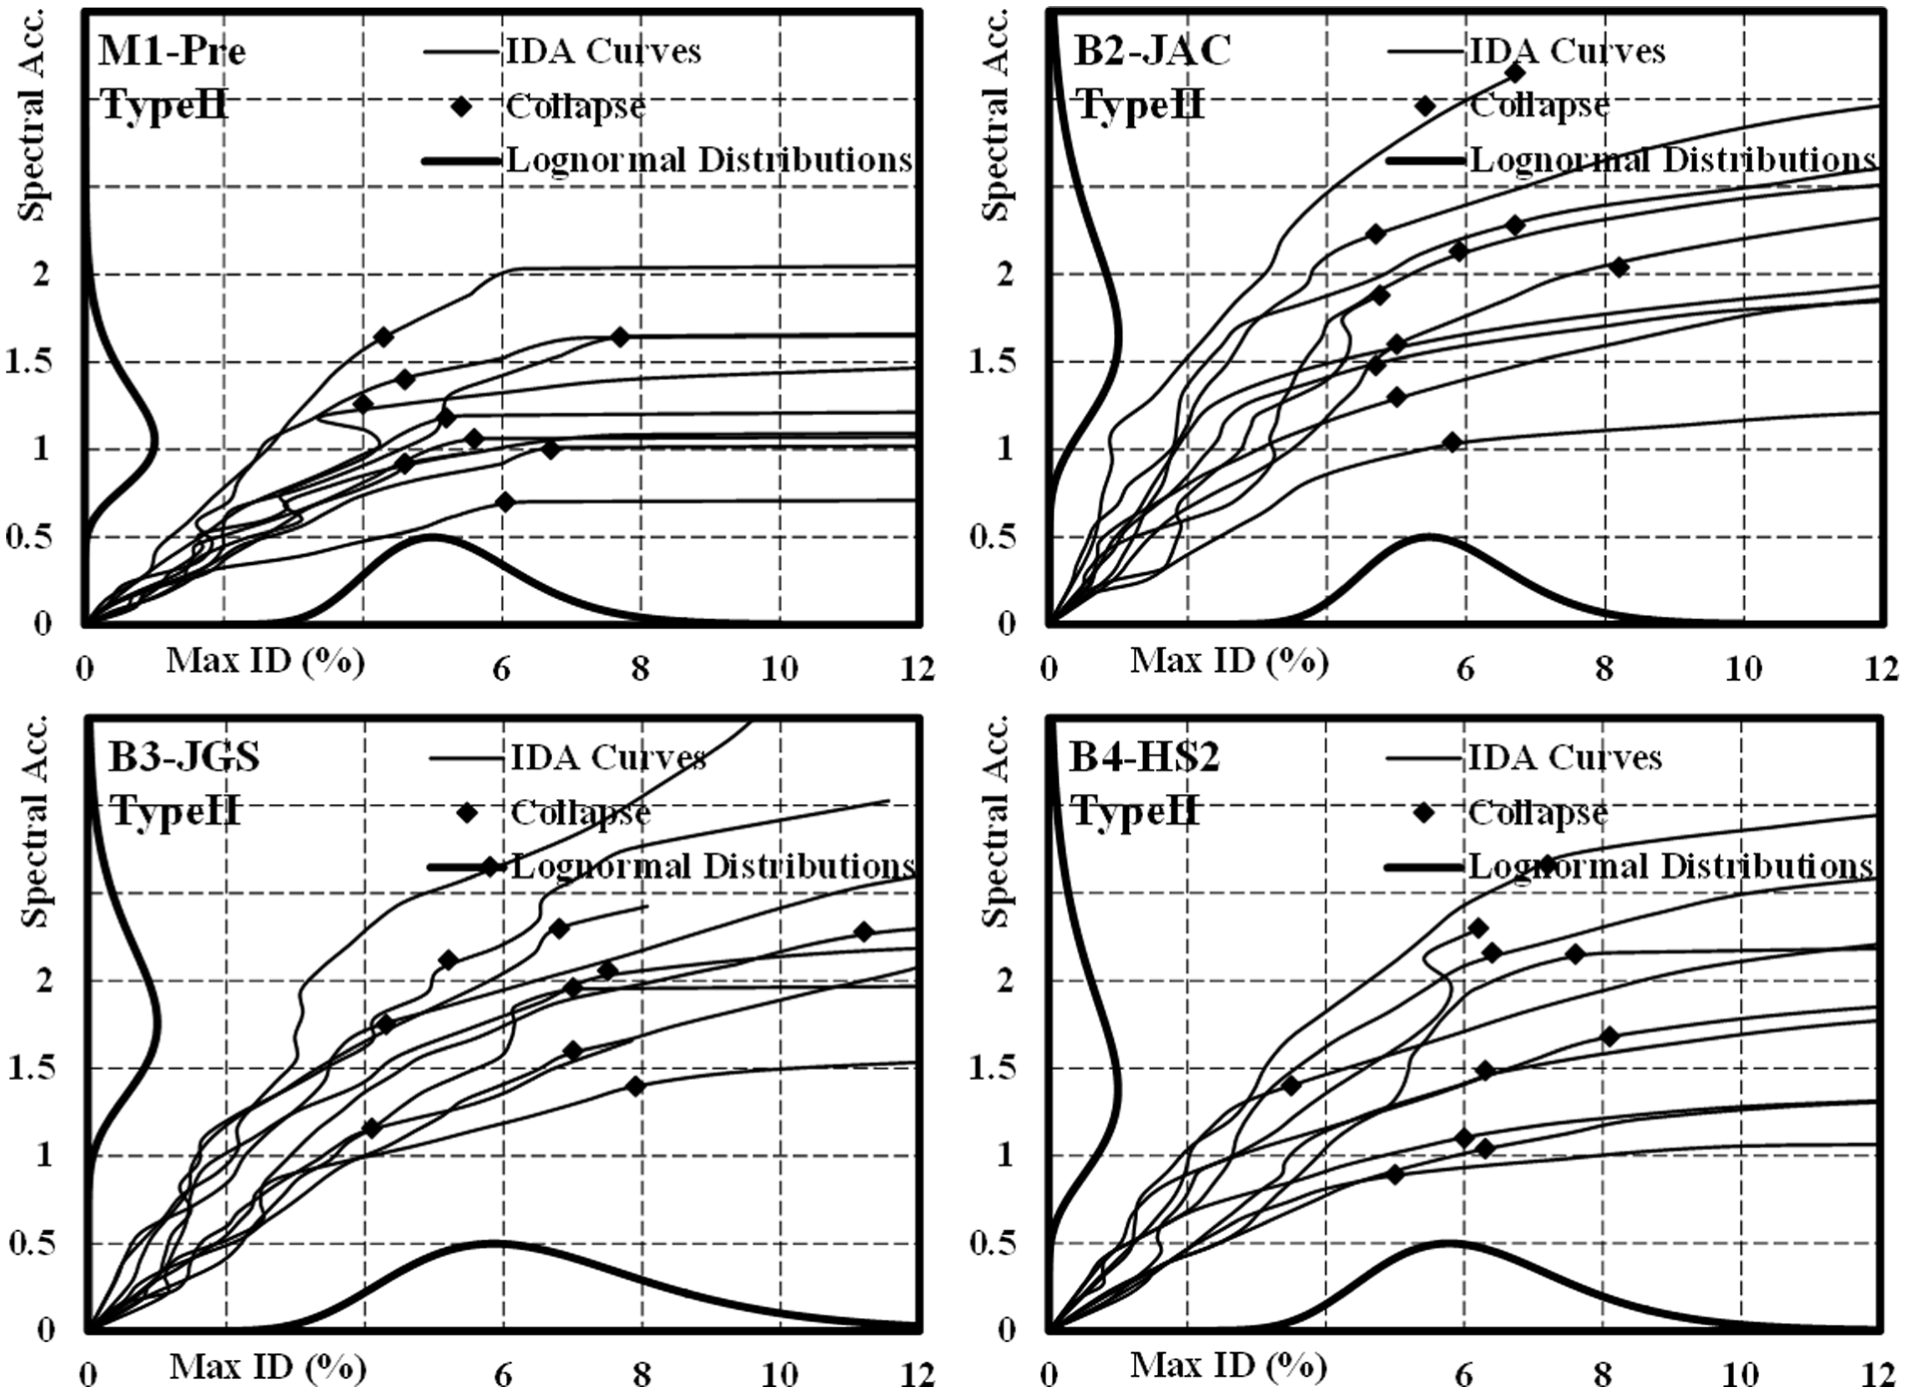
The IDRs near collapse that were obtained from IAEM analysis are considered as the CP limit states of the reference structures, as shown in Table 3. Furthermore, the extensive results obtained from IDA under the effect of 20 input ground motions are processed to predict the IO, LS, and CP performance levels. Figure 16 shows the sample results for the CP limit states obtained from IDAs using Type II records, while Table 3 summarizes all the IDA results. The IO and CP limit states are estimated at yield and collapse, while the LS performance criterion is considered 50% of the CP level (ASCE/SEI-41, 2007). The results of the pre-code and retrofitted buildings shown in Table 3 suggest adopting different performance criteria for the pre-code structure and retrofit alternatives.
Assessment of the CP performance limit state using IDAs (sample results using Type II seismic scenario).
It is noteworthy that the results of POA typically show the range of structural behavior that may include a strength degradation, as presented in Figure 9. On the other hand, the results presented in Figure 16 show that the IDA curves may sharply soften and exhibit large drift demands with minor/no increase in spectral acceleration, such as after the formation of hinging mechanism in building M1-Pre (also refer to Figure 11). The IDA curves of the retrofit alternatives generally exhibit higher initial slops (stiffness) and lower softening. The structural collapse is generally identified by a notable increase in drift demands under the effect of a small increment in ground motion intensity (GMI) (e.g. Jalayer and Cornell, 2009). A reduction in the slope of the IDA curve by 20% of the initial slope in the elastic region is an indication of global instability and hence is considered in this study as the onset of the CP limit state.
The IDA results confirm that the most suitable IDR at the IO performance limit is 0.34% for the pre-code buildings, while it is 0.45% and 0.71% for the retrofitted buildings B2-JAC/B3-JGS and B4-HS2/B5-HS2, respectively. These values are obtained from the 16th percentile IDA curves and are conservative with regard to those proposed by ASCE/SEI-41 (2007) and Ghobarah et al. (1999). These conservative IO values are attributable to the low yield strength steel used in the construction of pre-code buildings, which results in early yielding. Additionally, the adopted CP limit state is 2.7% and 4.7% for the pre-code buildings and retrofitted alternatives, respectively. The IDR related to the pre-code buildings is obtained from the IAEM collapse analysis, which better captures the collapse mode of the pre-code building. The IDR related to the retrofitted structures is obtained from the conservative 16th percentile of the IDA results, as shown in Table 3. The CP limit states of the reference structures are generally consistent with the performance limits proposed by Ghobarah et al. (1999). Finally, the LS limit state is 1.35% and 2.35% for the pre-code buildings and retrofitted structures, respectively, as per the ASCE/SEI-41 (2007) approach. This discussion shows that conservative limit states are adopted based on comprehensive POA and dynamic response simulations, which lend weight to the results of this study.
Vulnerability assessment of pre-code buildings
Fragility functions are initially developed for the four pre-code reference structures shown in Figure 3 using IDA and the two sets of ground motions shown in Figure 6. The fragility function, which follows a lognormal distribution, represents a relationship between the GMI and the probability of reaching a certain limit state (LST). The adopted approach for developing fragility curves accounts for the drift capacity and demand as well as the uncertainties associated with demand, drift capacity, and the imperfection of analytical modeling (Wen et al., 2003). Since the input ground motions selected in this study represent two specific seismic scenarios, the PGA is adopted as an intensity measure for developing the fragility relationships. This scaling method is consistent with the approach employed by design codes and in several previous studies (e.g. Ji et al., 2007; Kwon and Elnashai, 2006).
For the derivation of vulnerability relationships using IDA, the analytical models of the reference structures are analyzed under the effect of the selected two input ground motion sets (refer to Table 1 and Figure 6). Each input ground motion is scaled to different PGA levels. The IDAs are carried out up to the satisfaction of the collapse limit states. A scaling factor of 0.10g is selected for Type I ground motions. To improve the accuracy of the vulnerability curves and attain all limit states, 15 analyses are conducted for each building-input ground motion, starting from a PGA of 0.10g and ending with a PGA of 1.50g. It is shown from Figure 6 that each of the two ground motion sets selected in this study has different spectral amplifications at various periods. Therefore, the above-mentioned scaling approach is inappropriate for /Type II records since a lower level of PGAs is needed to reach the collapse limit states compared with the PGAs used with Type I ground motions. A scaling factor of 0.05g is thus selected for Type II ground motions. Several additional analyses are also carried out to help in deciding the suitable scaling approach as well as to reach the collapse limit state.
The maximum PGA–IDR values obtained from 300 inelastic time-history analyses are plotted for each building (refer to Figure 16). The limit state exceedance probabilities at different GMI levels are calculated for different limit states using the IDA results. Figures 17 and 18(a) compare the fragility relationships derived using the seismic scenarios I and II for the pre-code buildings M1-Pre to M4-Pre. The fragility curves are shown for the IO, LS, and CP limit states. It is shown that the limit state exceedance probabilities are much higher and the slopes are steeper under the effect of Type II seismic scenario than those from Type I ground motions. Figure 17 shows that the fragilities of the four pre-code structures are close to each other, particularly buildings M1-Pre, M2-Pre, and M4-Pre. The vulnerability of building M3-Pre is slightly less than other structures, especially under the effect of low-to-moderate intensity levels. It is noteworthy that buildings M1-Pre to M3-Pre have comparable mass, while M3-Pre is provided with an additional vertical structural member that extends from foundation to roof. This reduces the drift demands and improves the lateral resistance of the latter structural system. Despite the extra columns of M4-Pre, its drift demands, and hence the limit sates exceedance probabilities, are comparable to M1-Pre and M2-Pre as a result of the extra mass of the three-bay framing system which is 70% higher than other structures. Based on the comparison presented in Figure 17, which confirms the comparable vulnerability of the four pre-code reference structures, and due to the large number of inelastic analyses required to assess different retrofit approaches, this study focuses on the vulnerability assessment of retrofit alternatives proposed for building M1-Pre.
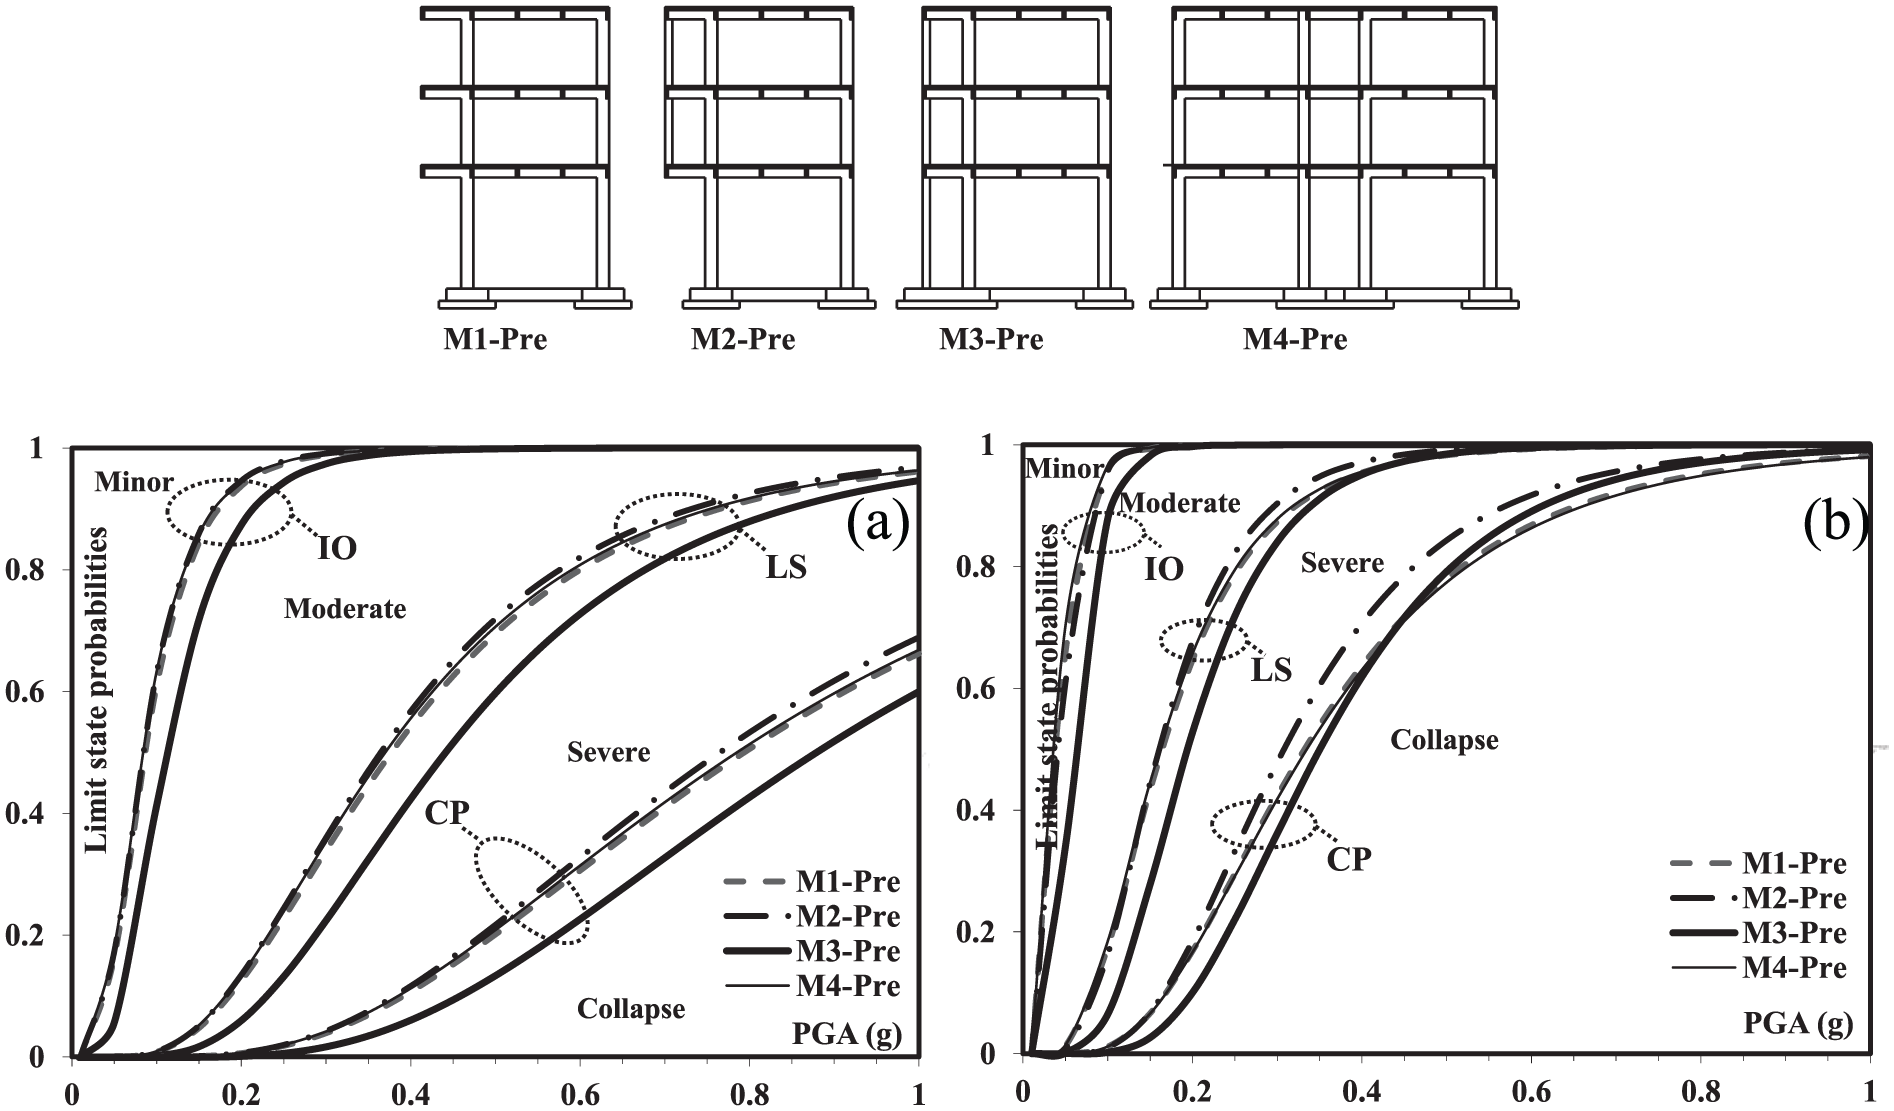
Comparison between the fragility relationships of the pre-code buildings using seismic (a) scenario I and (b) scenario II.
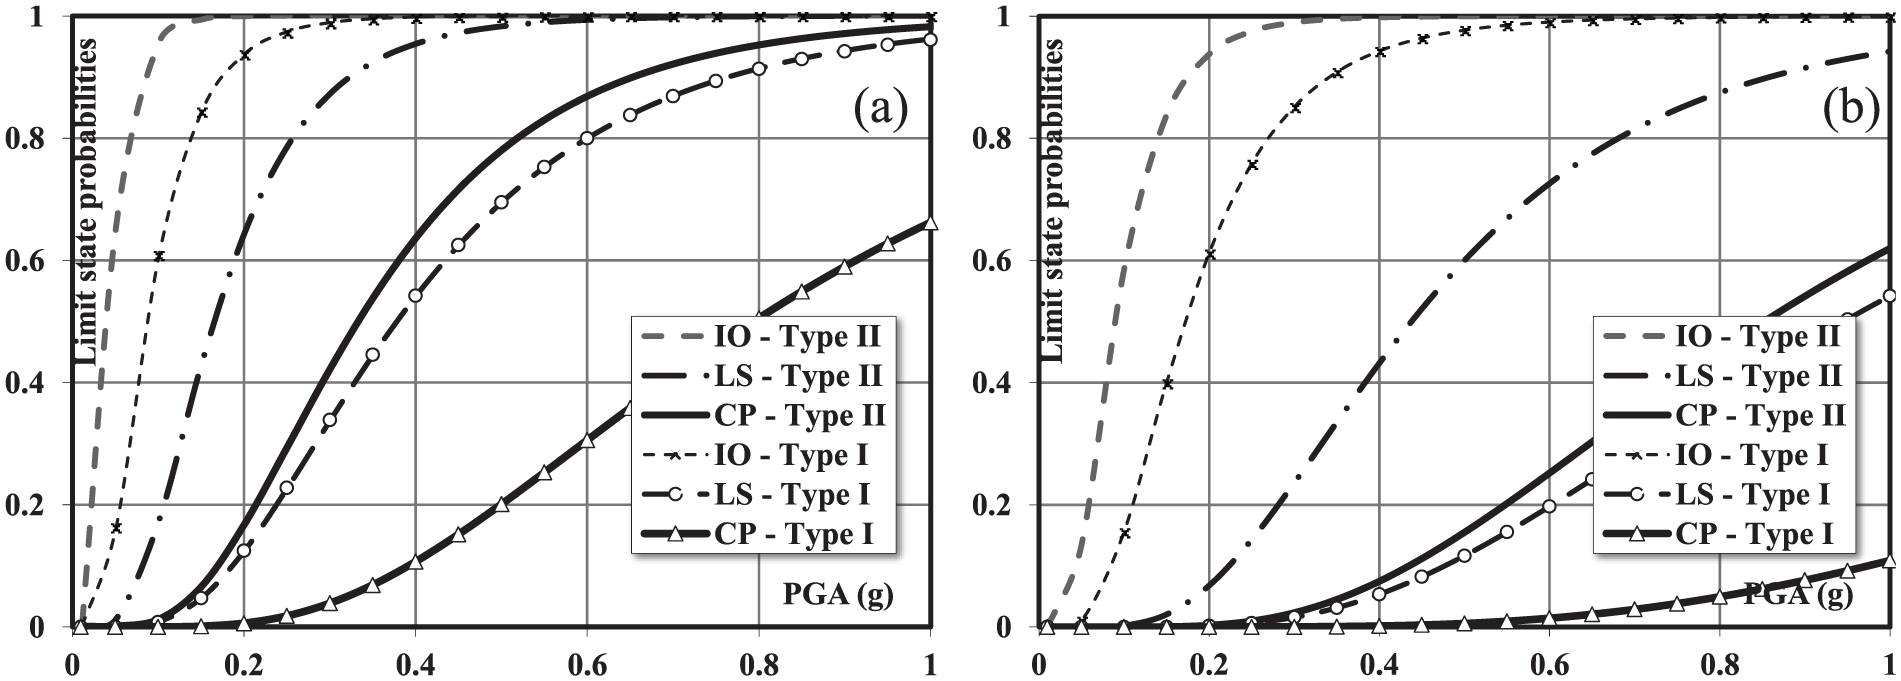
Fragility relationships derived using Type I and Type II seismic scenarios for a pre-code building and a retrofitted alternative: (a) M1-Pre and (b) B2-JAC.
Vulnerability assessment of retrofit approaches
Figure 18(b) compares the fragility relationships of the retrofit alternative B2-JAC using the ground motions Type I and Type II. The fragility curves of the pre-code building M1-Pre are also compared in Figure 19 with different retrofit alternatives for different limit states. It is shown that the limit state exceedance probabilities are much higher under Type II ground motions than Type I earthquake records. The high impacts of Type II earthquake records on the seismic response of the reference structures are due to the high spectral amplifications that cover a wide period range, as shown in Figure 6. The results suggest focusing on this seismic scenario when assessing the effectiveness of retrofit techniques.
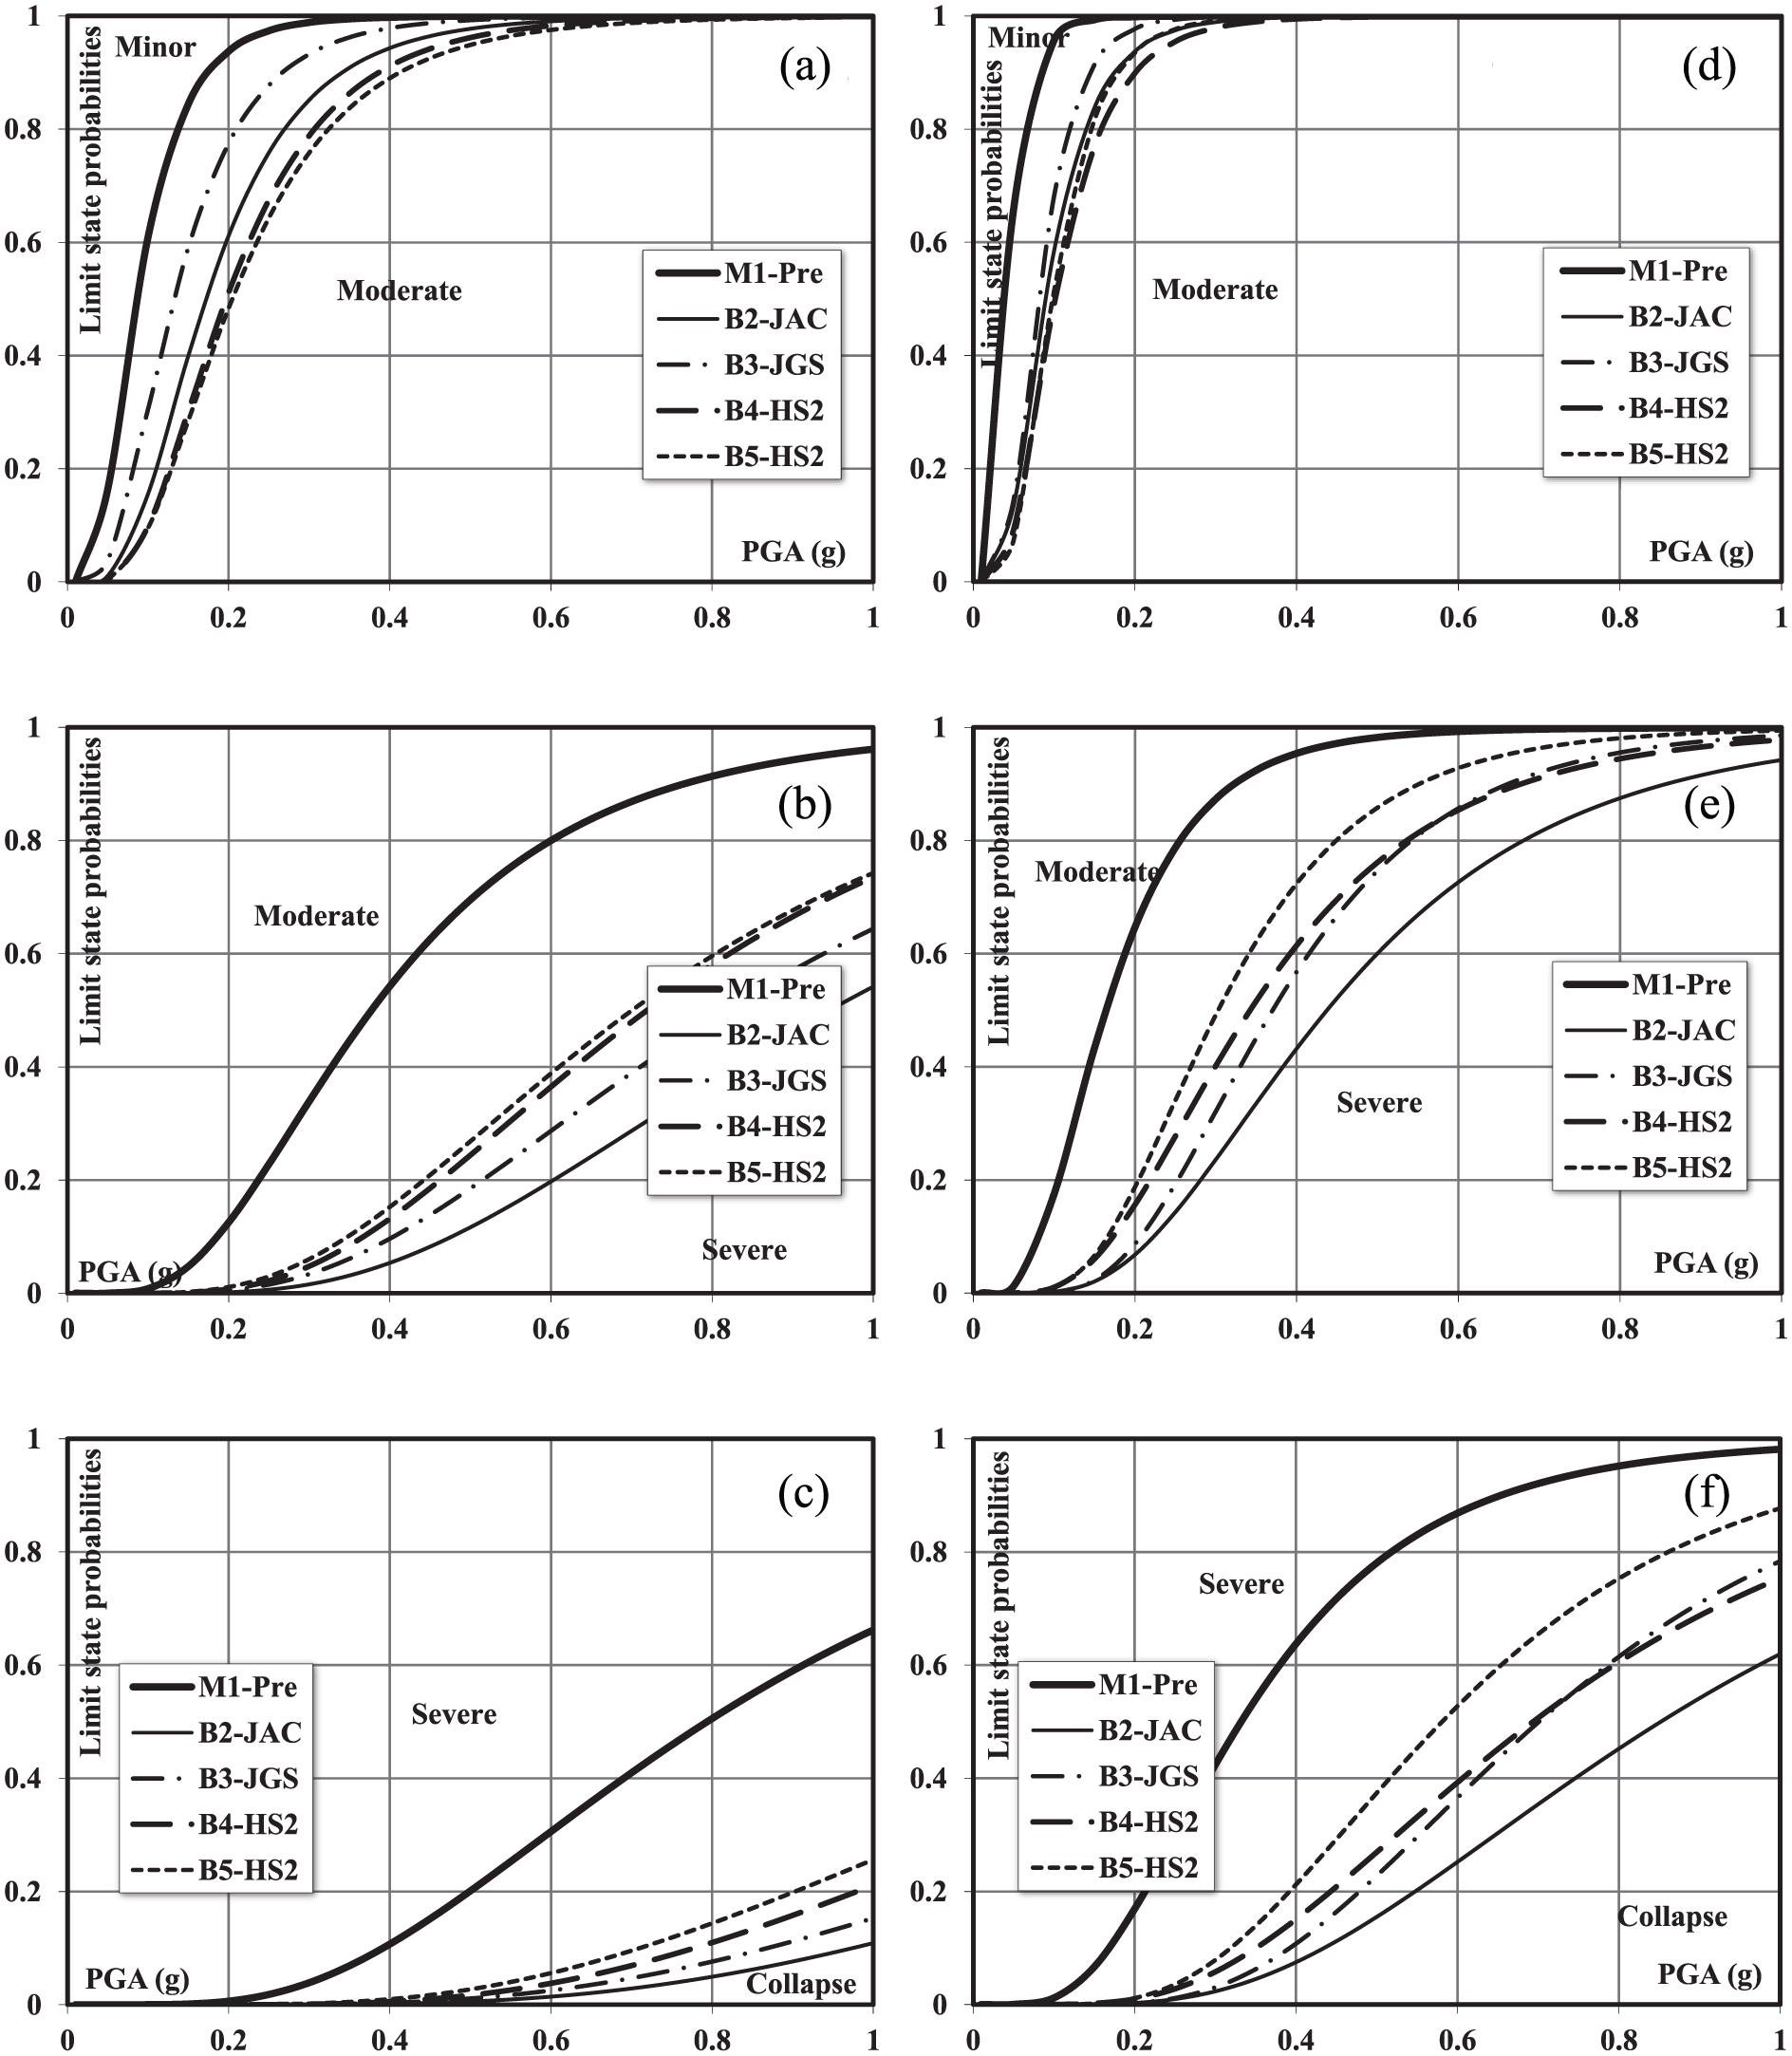
Fragility relationships derived using two seismic scenarios for the pre-code structure M1-Pre and its retrofit alternatives: (a) IO limit state Type I, (b) LS limit state Type I, (c) CP limit state Type I, (d) IO limit state Type II, (e) LS limit state Type II, and (f) CP limit state Type II.
The limit state exceedance probabilities of the benchmark buildings and retrofit alternatives are calculated for ground motions Type I and Type II at two intensity levels: (1) the design PGA and (2) twice the design intensity, as shown in Figure 20. For the pre-code building under the effect of Type II ground motions, the limit state probabilities exceed 40% for the LS and CP limit states at the design and at twice the design PGA, respectively. The weak column–strong beam deficiency of the gravity load designed building is the main cause of these unacceptable values. The significant improvements in the seismic performance of different retrofit alternatives when compared with the pre-code counterpart are shown in Figures 19 and 20. The LS and CP limit state exceedance probabilities consistently increase for the retrofit alternatives B2-JAC, B3-JGS, B4-HS2, and B5-HS2, respectively. This confirms that the RC jacketing, which enhances the overall strength and increases the column-to-beam strength ratios, is more effective in controlling lateral deformations than the FRP wrapping of the columns. The latter retrofit technique principally enhances confinement and shear strength, which did not control the seismic response of the benchmark buildings, and hence, it is less effective in controlling drift demands, as shown in Figures 13 and 14 (FEMA, 2006). School buildings should sustain lower levels of damage since they are designed to a higher risk category than the standard structures. Therefore, the reduced limit state exceedance probabilities of the retrofit approaches using RC jacketing (i.e. B2-JAC and B3-JGS) support their selection over other alternatives.
Limit state exceedance probabilities from the seismic scenarios Type I and Type II at two earthquakes intensities for the pre-code structure M1-Pre and its retrofit alternatives: (a) Type I—design, (b) Type II—design, (c) Type I-Twice the Design, and (d) Type II—twice the design.
Ranking of seismic retrofit measures
A fragility relationship incorporates two important parameters for each damage state: (1) λ, the median GMI, and (2) β, the lognormal dispersion parameter, which determines the probability of exceeding the damage state at any GMI level. It is important to note that the following issues arise when adopting fragility functions in loss assessment applications:
The structural performance may change from one limit state to another. This is clear from the fragilities of retrofit alternative B5-HS2, which are among the lowest fragilities at the IO limit state, while they result in the highest limit state exceedance probabilities at other limit states (refer to Figure 19).
The uncertainty of the fragility curve increases with increasing the limit state (i.e. from the IO to the CP limit states).
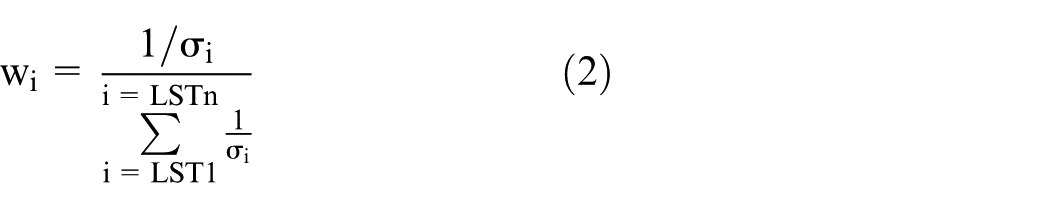
In order to overcome the above-mentioned issues and arrive at a more realistic comparison between different retrofit techniques relative to the pre-code structure, the following measure, which is termed the overall performance factor (OPF), is proposed in this study
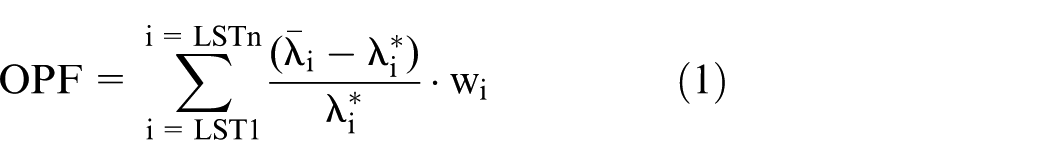
where
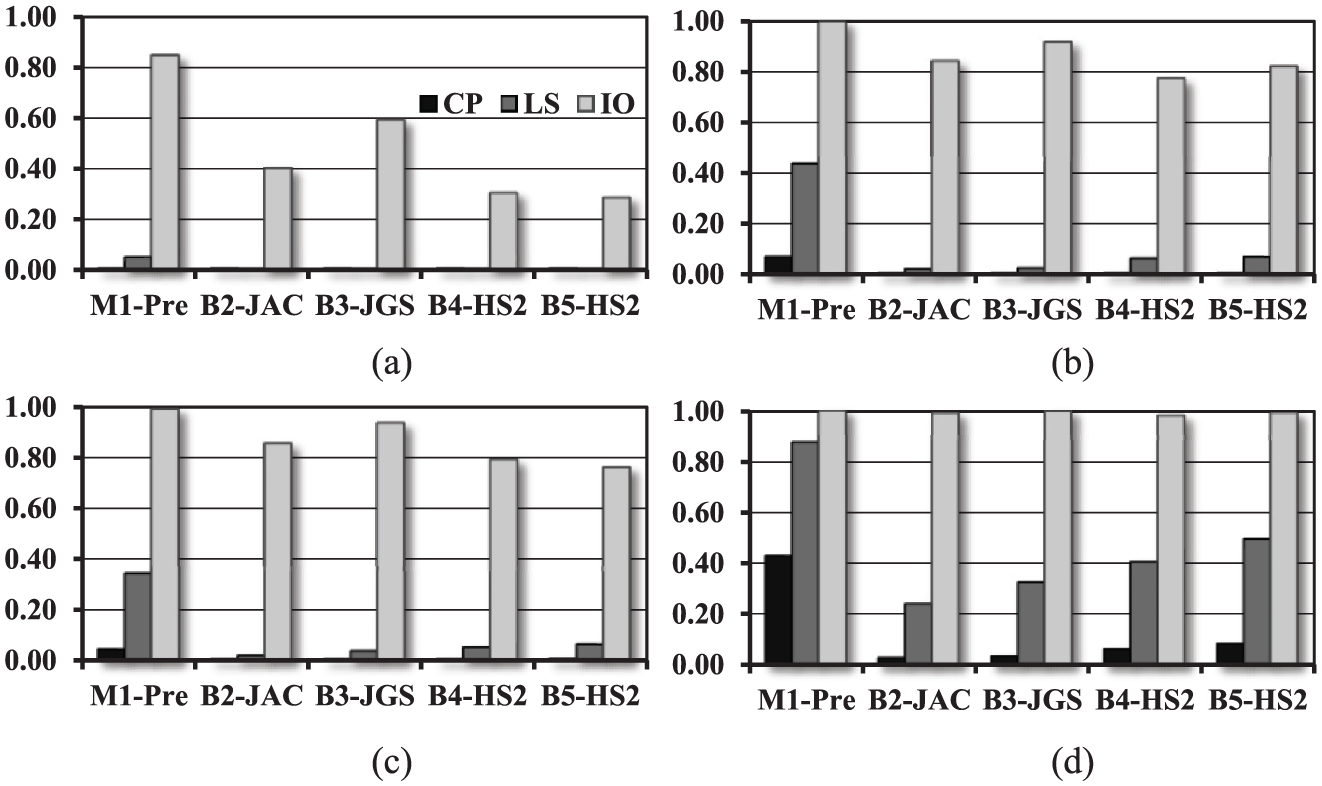
This approach results in reducing the limit state weighting factor with increasing uncertainty. Figure 21(a) compares between the OPF of different retrofit alternatives. It is shown that the highest improvement in performance is achieved when RC jacketing is implemented in all stories (i.e. building B2-JAC). It is also clear that the difference in seismic performance between B4-HS2 and B5-HS2 is marginal, which does not support FRP wrapping of the columns in all stories. It is important to note that the cost of the retrofit approach B5-HS2 is almost one-third of that for B4-HS2.
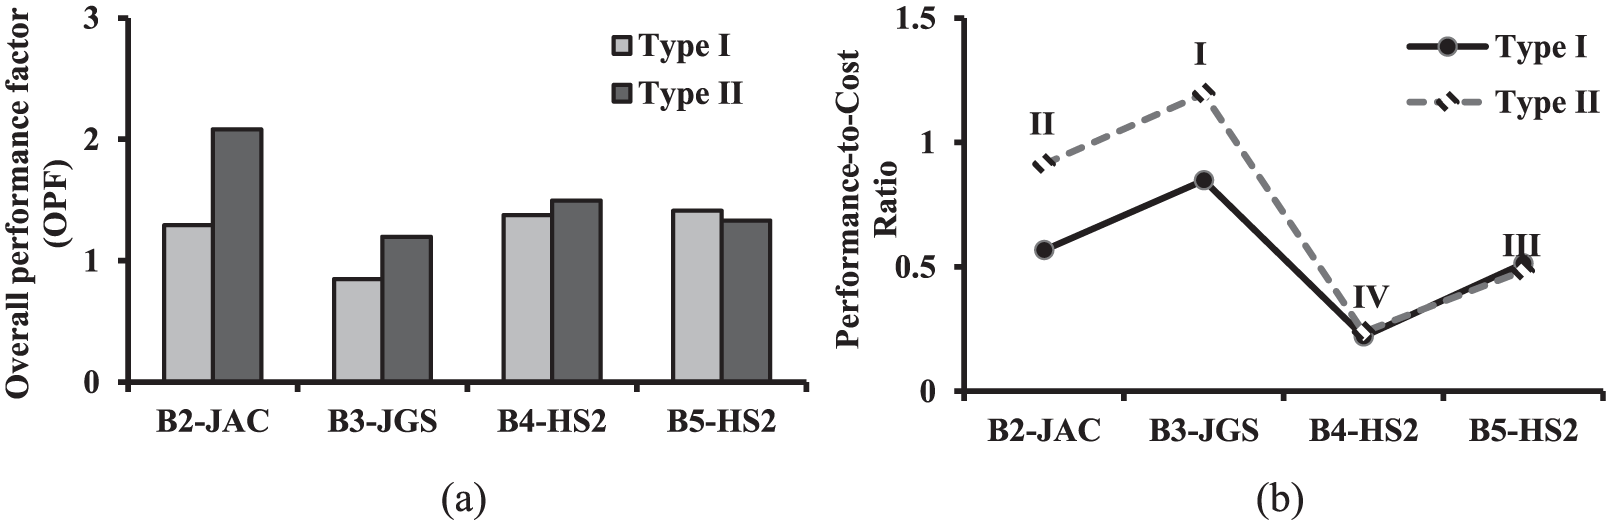
Ranking of different retrofit alternatives according to (a) overall performance factor (OPF) and (b) performance-to-cost ratios.
To arrive at a rational ranking for selecting the most efficient and cost-effective retrofit technique, the cost of different retrofit alternatives is integrated with OPF. Based on the data collected from local construction firms, the average retrofit cost of a typical column per meter length using FRP wrapping and RC jacketing is US$550 and US$200, respectively. It is shown from Figure 21(b), which depicts the relative performance-to-cost ratio of the reference structures, that alternative B3-JGS (RC jacketing of the ground story columns) has the highest performance-to-cost ratio. Although the B3-JGS alternative has the lowest OPF, it is the most economic retrofit option, and hence it results in the highest performance-to-cost ratio. On the other hand, the B4-HS2 alternative has the lowest performance-to-cost ratio due to the high cost of FRP wrapping of all the columns.
Compared with other techniques, the retrofit of RC structures using FRP composites is easier to implement and adds virtually no weight to the existing structure. However, the results of this study confirm that the RC jacketing retrofit alternatives are the most efficient and cost-effective options. The differences in the performance-to-cost ratio between the retrofit techniques using RC jacketing and FRP wrapping are more pronounced under the effect of earthquake scenario Type II, which provide more support to the former retrofit approach. Since school buildings are designed to a higher risk category than the standard structures, the higher OPF factors and lower damage probabilities of the B2-JAC retrofit approach also support selecting it over other alternatives. The presented results illustrate the significance of the detailed seismic assessment of different retrofit alternatives under the effect of various seismic scenarios to arrive at an efficient and cost-effective solution for the application at the urban scale.
Conclusion
This study summarized a methodology for prioritizing a number of retrofit techniques for mitigating the seismic risk of substandard school buildings. An on-ground survey of the school building inventory in a large study area that extends for 6000 km2 enabled collecting the construction typologies of 1416 school buildings. The building’s database was classified and four reference structures were selected for representing pre-code school structures. The benchmark buildings were retrofitted using two main approaches that are applicable to inadequate strength and stiffness: (1) RC jacketing and (2) FRP wrapping of columns. Two alternatives were investigated for the applications of these two retrofit approaches. Three types of FRP material properties and two different FRP overlays were also compared. Fourteen different retrofit alternatives were therefore assessed. Detailed simulation models were developed for the pre-code buildings and retrofit alternatives using the fiber modeling approach and the IAEM to realistically assess the performance limit states. The relative seismic response of pre-school buildings and different mitigation measures from a large number of IDAs using 20 natural ground motions was described in terms of fragility curves along with a proposed measure of performance termed the OPF. It should be noted, however, that the conclusion of this study is based on ideal reference structures, that is, neglecting deterioration of structural members and assuming quality workmanship.
Higher limit state exceedance probabilities were observed under the effect of far-field input ground motions than those from other earthquake records, which suggest focusing on this seismic scenario for the assessment of mitigation measures. Different levels of improvements were observed in the seismic performance of the retrofitted buildings. RC jacketing of the columns enhanced both strength and stiffness in addition to increasing the column-to-beam strength ratios. FRP wrapping of the columns mainly enhanced confinement and shear strength, which did not control the seismic response of the pre-code structure in the study area. The retrofit alternatives using RC jacketing were the most efficient and cost-effective options based on the relative performance-to-cost ratios. The lower damage probabilities and higher OPF factors observed for the retrofit techniques using RC jacketing in all stories supported its selection due to the high design risk category of school buildings. This study illustrated the importance of a systematic seismic assessment for different retrofit alternatives to arrive at an efficient and cost-effective mitigation strategy for the implementation at the regional scale.
Footnotes
Declaration of Conflicting Interests
The author(s) declared no potential conflicts of interest with respect to the research, authorship, and/or publication of this article.
Funding
The author(s) disclosed receipt of the following financial support for the research, authorship, and/or publication of this article: This work was supported by the United Arab Emirates University under research grants No. 31N227 and 31N132.