
Abstract
A total of four full-scale low-rise recycled aggregate concrete shear wall specimens were tested adopting a quasi-static loading method to analyze the seismic performance. The low-rise shear walls consisted of recycled aggregate concrete, single-layer reinforcements, concealed special-shaped columns, and expanded polystyrene thermal insulation modules. Based on the experimental results, the seismic performance and failure characteristic of the specimens were comparatively analyzed. The factors affecting the seismic performance of the low-rise shear wall were also analyzed. The shear bearing capacity calculation model and formula of the walls were proposed based on the softened strut-and-tie model. A comparison of the calculated results and the experimental results shows that they are in good agreement. The results show that the load bearing capacity and deformation capacity can be significantly improved by expanded polystyrene thermal insulation modules, and that the shear wall specimens with higher recycled aggregate concrete strength and larger reinforcement ratio of the shear wall exhibit better seismic performance.
Keywords
Introduction
The seismic performance of a traditional multistory masonry structure is always worse than that of a reinforced concrete (RC) or steel structure. The wall thickness limitations and reinforcement details for the high-rise shear wall structure specified by the regulations are not suitable for the multistory structures. There is therefore an urgent need to study and develop new types of multistory residential structure with simplified reinforcement and construction procedures that demonstrate good seismic performance, and energy-saving characteristics. Because of rapid economic development many old buildings are being demolished and new buildings erected in their place. Concrete is the most consumable building materials in the newly built construction. The mass consumption of natural aggregate (NA), which is the component in concrete, is constantly and rapidly increasing with expanding production utilization demands. Simultaneously, a significant amount of construction waste is produced during the demolition processes, which has an undesirable effect on society and environment. Recycling this construction waste can reduce the burden on landfills and preserve natural resources. This potential renewable resources can be even more advantageous if aggregates obtained from this recycling is used not only in lower quality product applications but also in structural concrete applications. Hence, the use of construction waste and green building materials has become a strategic research goal in the development of sustainable building materials.
In recent years, some researchers have developed a number of technologies to achieve anti-seismic energy-saving integration. Filho et al. (1994) developed a new precast concrete sandwich panel (PCSP) system with a high thermal resistance and optimum structural performance. Insulated concrete sandwich wall panels (SWPs) generally consist of the inner/outer concrete wythes and the insulation between the concrete wythes, which is a good alternative that can satisfy the levels of both structural and insulation performance required for buildings. In line with the increasingly growing demand for energy-efficient buildings throughout the world, insulated concrete SWP systems have been drawing more attention (Choi et al., 2015; Kim and You, 2015). Lateral load tests were performed on four full-scale precast concrete SWPs. Results showed that the solid concrete regions provide most of the strength and stiffness that contribute to composite behavior. Steel M-tie connectors and bond between the insulation and concrete contribute relatively little to composite behavior (Pessik and Mlynarczyk, 2003). Einea et al. (1994) investigated the connection of a new PCSP system, which had a high thermal resistance. Pantelides et al. (2008) studied the structural performance of hybrid glass fiber–reinforced polymer (GFRP)/steel concrete sandwich panels. Qian (2008) tested the seismic performance of cast-in-site RC grillage shear walls formed with insulation hollow blocks. The results showed that the concrete grillage wall system can satisfy the requirements for residential buildings of less than nine stories with fortification intensity of 8. Zhou et al. (2010) developed the “concrete lattice wall” structure system and tested its seismic performance. Tomlinson and Fam (2014) conducted nine full-scale tests on 2400 × 1500 × 260-mm panels. The results showed that despite the small embedment lengths of the sand-coated GFRP straight connectors in the wythes, no pullout failure occurred, and all the connectors fractured during the tests. Wang and Liu (1999) introduced the basic structure, working principle, advantages, basic performance, and technical economic indexes of the Dipy architecture in detail. Ren et al. (2011, 2012) tested and analyzed the seismic performance of the squat concrete walls with construction formwork. Bush and Stine (1994) tested the flexure performance of composite PCSP systems containing various connector reinforcement and construction details. Cao et al. (2009, 2010) developed a new shear wall structure system with single-row reinforcement. They conducted the seismic performance test and theory analysis of the system. The results showed that the seismic performance of the single-row RC shear wall was better than that of brick masonry wall.
To make use of construction waste, there is a new type of environment-friendly material using waste concrete as recycled aggregates to substitute for NAs. It is called recycled aggregate concrete (RAC), which is partly or totally manufactured through the processes of washing, crushing, grading, and proportional mixing (Hansen, 1986; Xiao, 2008). Researchers (Evangelista and De Brito, 2007; González-Fonteboa et al., 2012; Tabsh and Abdelfatah, 2009; Tam et al., 2007; Xiao et al., 2005, 2012) have carried out many studies on the use of RAC. However, most of the studies focused on the material performance. Over the past few years, study has been carried out to investigate the structural performance, and the structures and components were made using RAC. Lü et al. (2014) analyzed the seismic performance of a semi-recycled concrete frame. Cao et al. (2009) investigated the seismic performance of low-rise concrete shear wall with different recycled coarse aggregate (RCA) replacements. Corinaldesi and Moriconi (2006) investigated the behavior of beam–column joints made of sustainable concrete under cyclic loading. From experimental results, they found that the RAC is suitable for structural use.
Based on the current research, a new RAC shear wall structure, consisting of expanded polystyrene (EPS) thermal insulation modules, single-row reinforcement RAC shear wall, and special-shaped concealed column system, has been developed. It has the advantages of simplified reinforcement, easy to be constructed, energy-saving, and anti-seismic characteristics. A total of four full-scale low-rise RAC shear wall specimens were tested adopting a quasi-static loading method to analyze the seismic performance. Seismic performance and failure characteristics of the specimens were comparatively analyzed. The factors affecting the seismic performance of the low-rise shear wall were also analyzed based on the experimental results. The shear bearing capacity calculation model and formula of the walls were proposed based on the softened strut-and-tie model. A comparison between the calculated results and the experimental results shows that they are in good agreement. The results showed that the load bearing capacity and deformation capacity can be improved significantly by EPS insulation modules, and that the specimens with higher RAC strength and larger reinforcement ratio of the shear wall exhibit better seismic performance.
New RAC shear wall system
The new RAC shear wall system consists of EPS module, single-row reinforcement RC shear wall, concealed columns, and mortar layer (Figure 1). The EPS module is produced by Harbin Hongsheng Group, which consists of modules of different shapes, such as L-shape, T-shape, and rectangular shape, as shown in Figure 2.
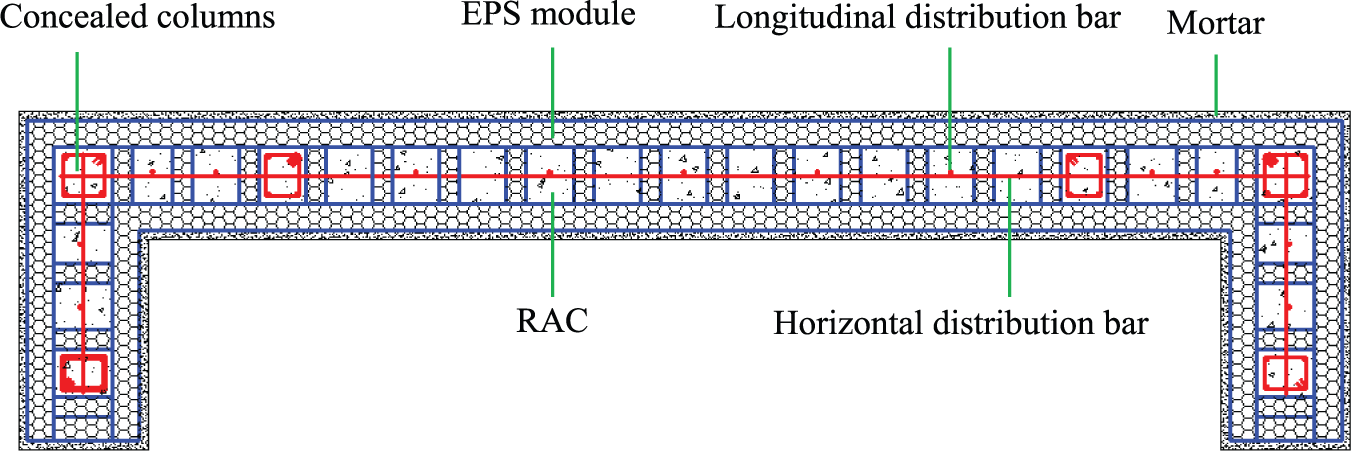
New recycled aggregate concrete shear wall system.
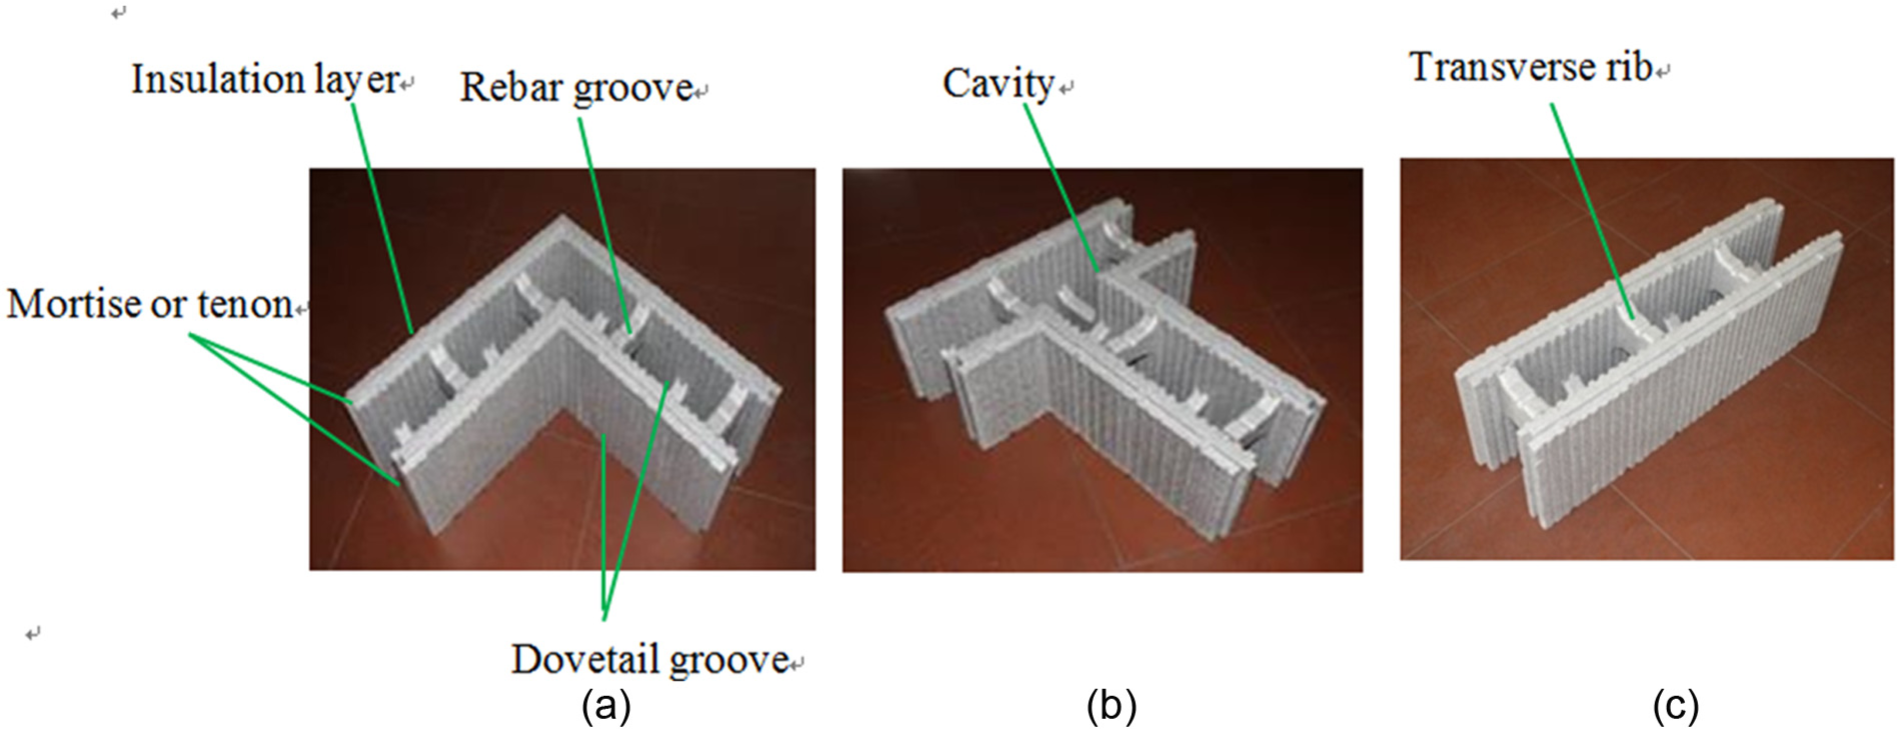
EPS module of (a) L-shape, (b) T-shape, and (c) rectangular shape.
The EPS module is mainly composed of insulation layer, cavity, rib, tenon, mortise, transverse rib, rebar groove, and dovetail groove. The different modules are connected closely by the mortise and tenon. The two thermal insulation layers in the EPS thermal insulation module system are connected to the RAC shear wall, using the transverse rib and dovetail groove. This is to ensure the insulation layer and the shear wall act as one unit. The EPS panel is constructed layer by layer with different shapes of EPS module. The vertical reinforcements can be anchored into the foundation through the center of the module cavity. The horizontal reinforcements was located at the rebar groves of every layer and was to the vertical reinforcement with bar tie wire. The height of the layer is 300mm, which is also equal to that of the EPS modules. By pouring concrete into the cavity, the vertical reinforcements, horizontal reinforcements, concrete, and the EPS module form a new RAC shear wall system. The construction process is shown in Figure 3.
Construction process of a new RAC shear wall structure.
Testing details
Testing design
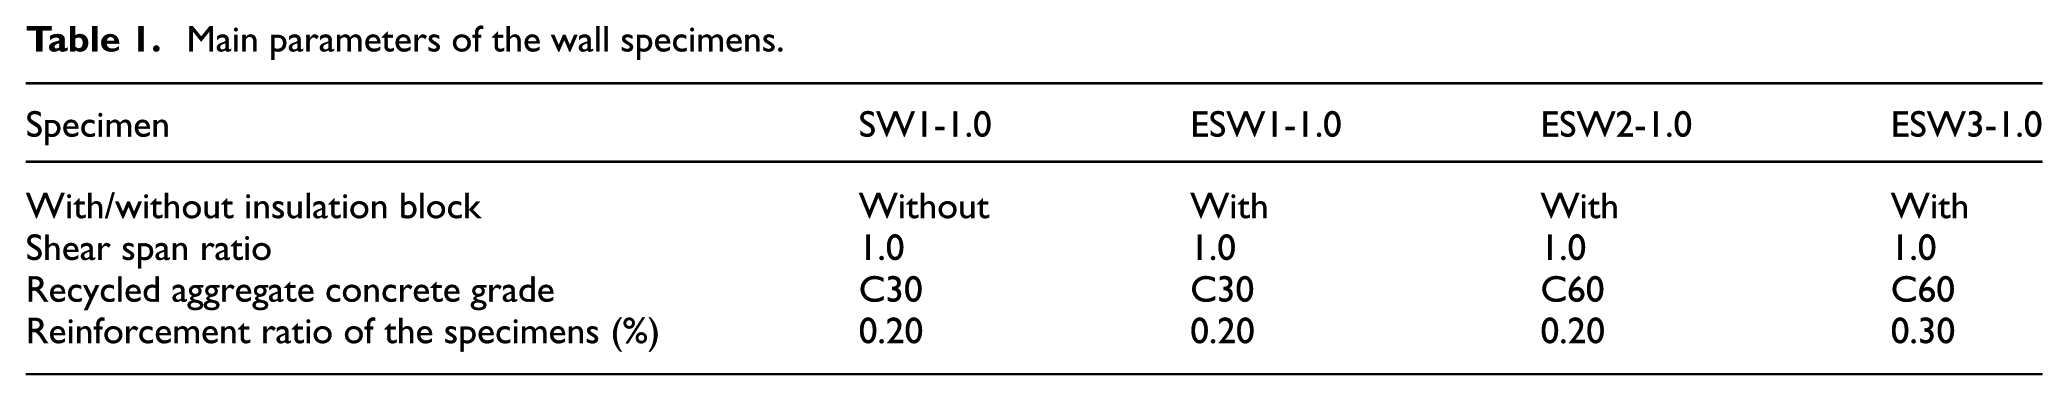
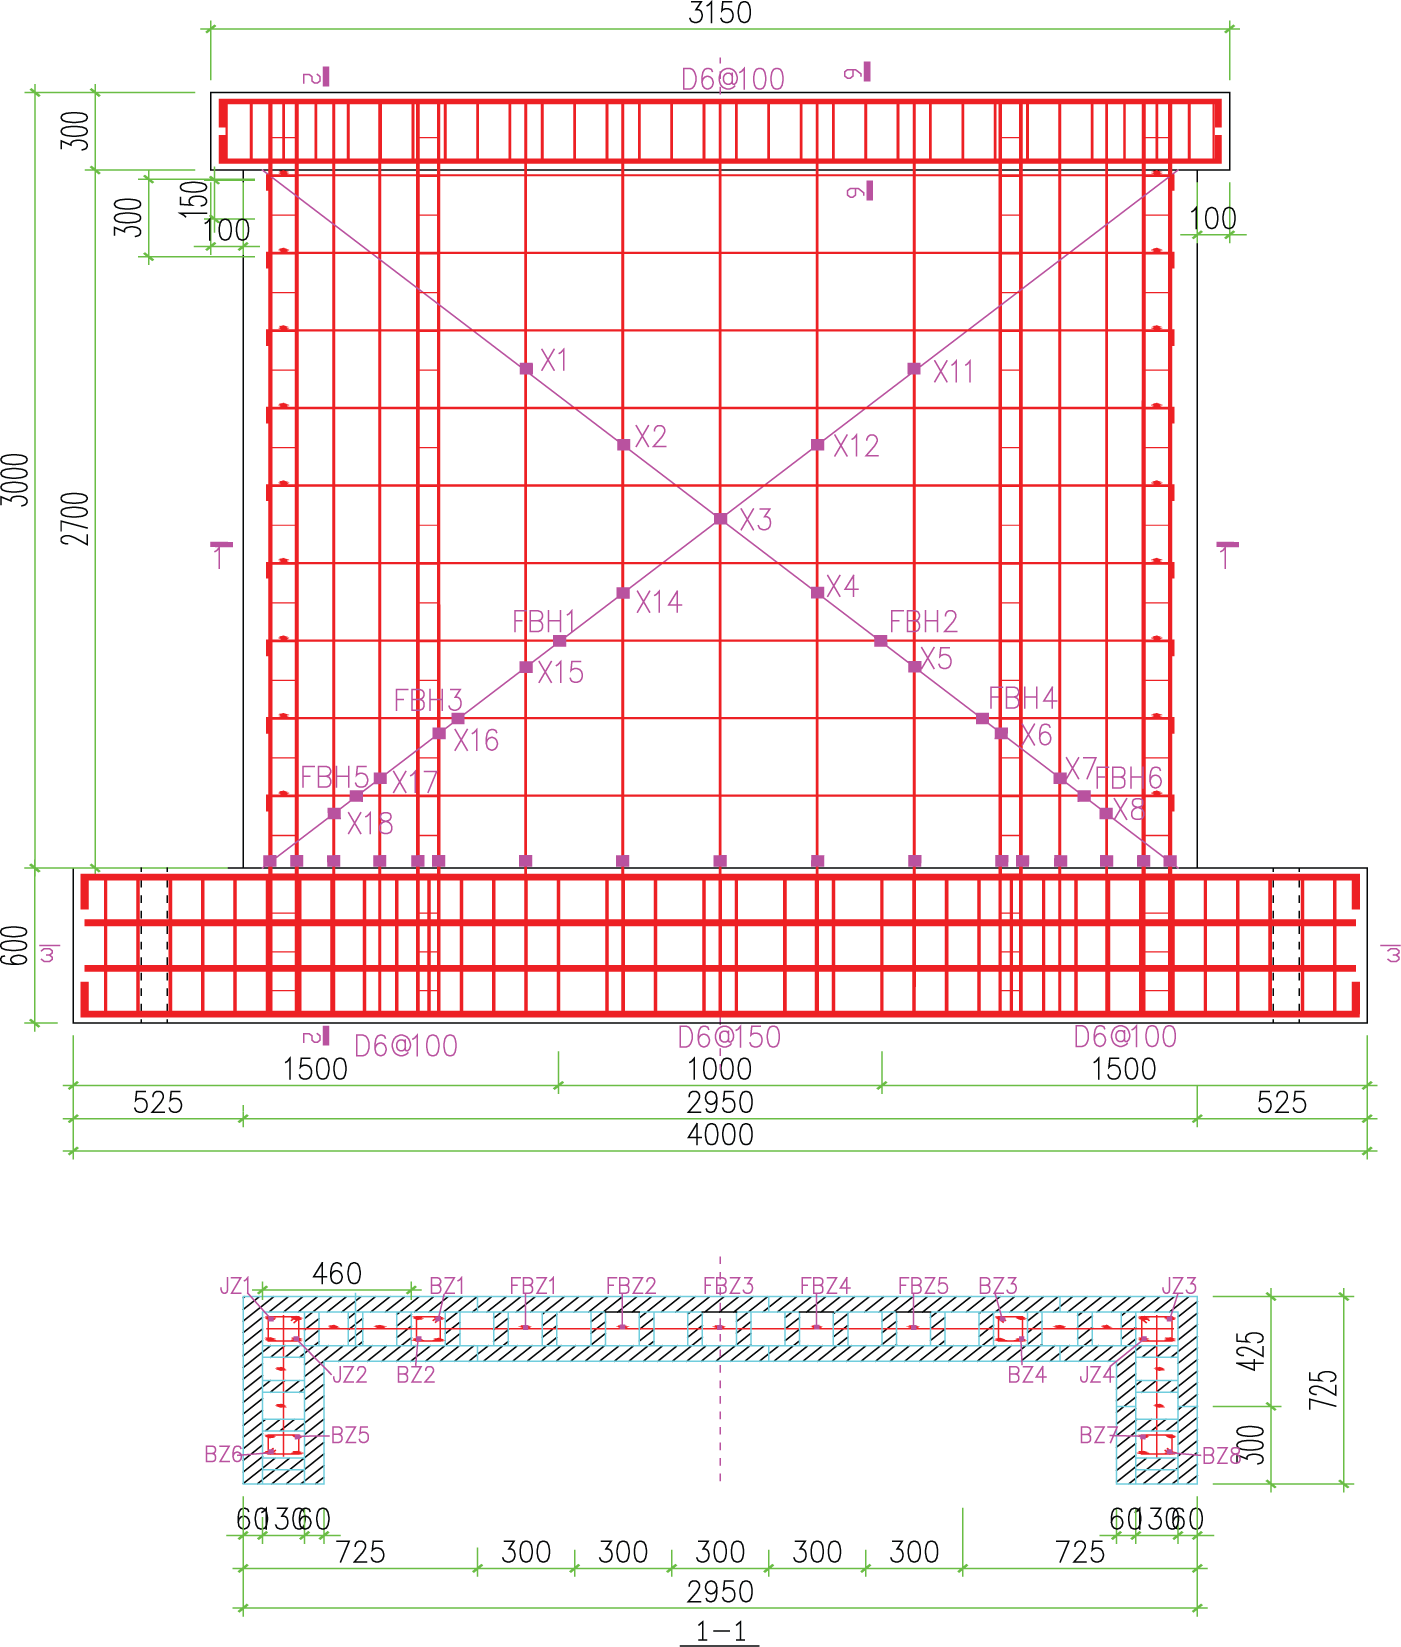
A total of four full-scale RAC shear wall specimens were designed and constructed with 100% RCA replacement. All specimens have the same shear span ratio of 1.0, and the boundary element consisted of three concealed columns. One was located at the corner of the L-shaped section, and the other two were located at the ends of the L-shaped section (see Figure 1). The four specimens were denoted as SW1-1.0, ESW1-1.0, ESW2-1.0, and ESW3-1.0, respectively. Specimens ESW1-1.0, ESW2-1.0, and ESW3-1.0 were low-rise RAC shear walls with single-row reinforcement, L-shaped section concealed columns, and EPS insulation blocks. Specimen SW1-1.0 was the same as ESW1-1.0–ESW3-1.0 except without the EPS thermal insulation module. The thickness of ESW1-1.0, ESW2-1.0, and ESW3-1.0 was 290 mm, which included 130-mm single-row reinforcement concrete shear wall (RCSW), 60-mm EPS insulation layer on both sides of the RCSW, and 20-mm mortar surface layer on both sides of the EPS insulation layer connected by the dovetail groove. The wall thickness of SW1-1.0 was 130 mm. The circular hole in SW1-1.0 was used to simulate the transverse rib of the EPS thermal insulation module in ESW1-1.0. The area of the circular hole equals to that of the transverse rib cross section. The detailed parameters of the specimens are shown in Table 1. The detailed geometric dimension and reinforcements of the specimens are shown in Figure 4.
Main parameters of the wall specimens.
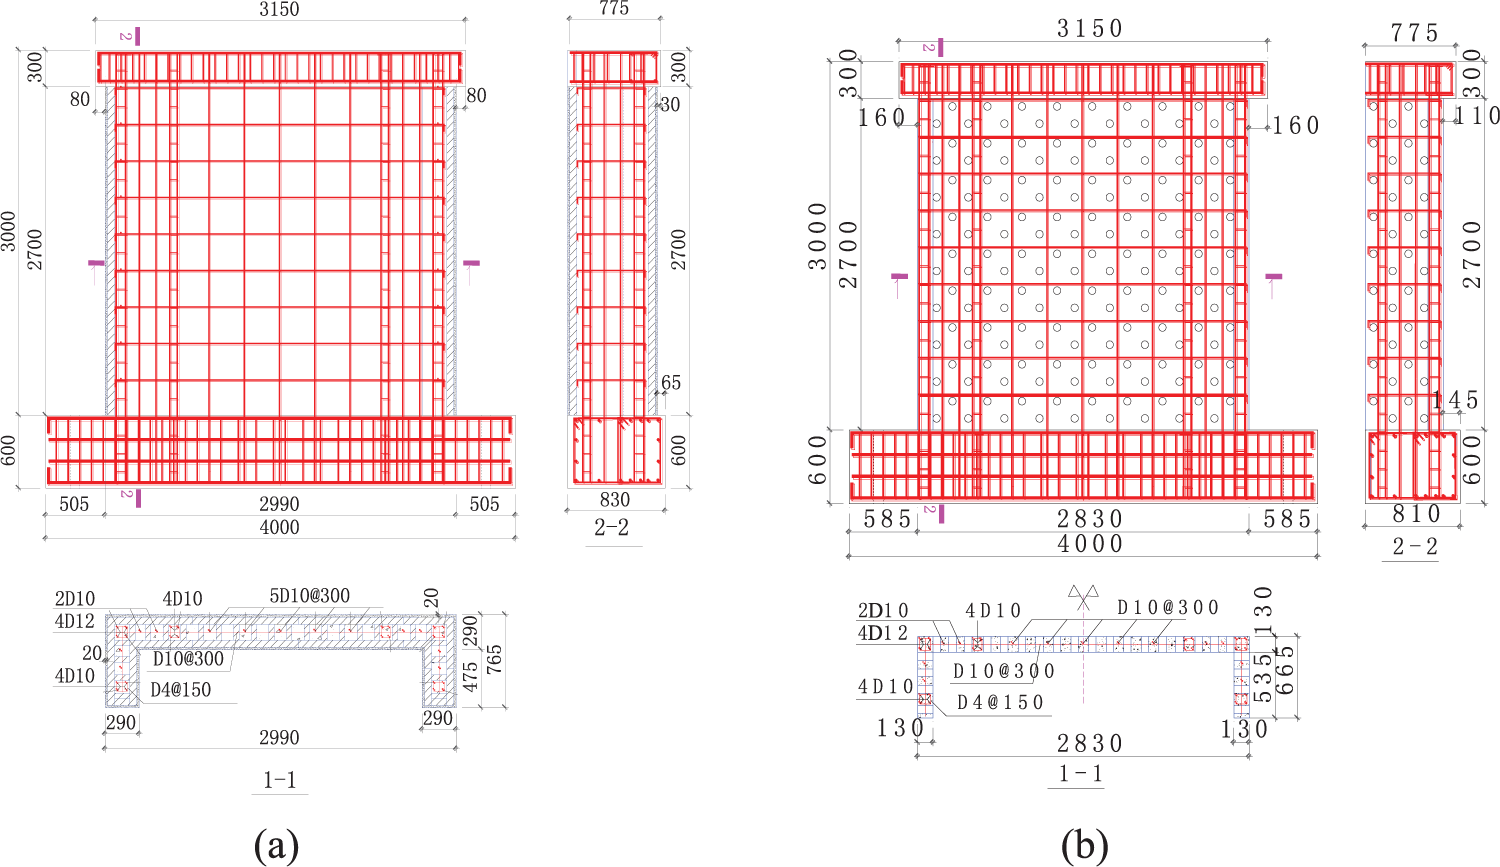
Details of reinforcements and geometry dimensions (mm): (a) ESW1-1.0–ESW3-1.0 and (b) SW1-1.0.
Mechanical properties of aggregates and concrete mix
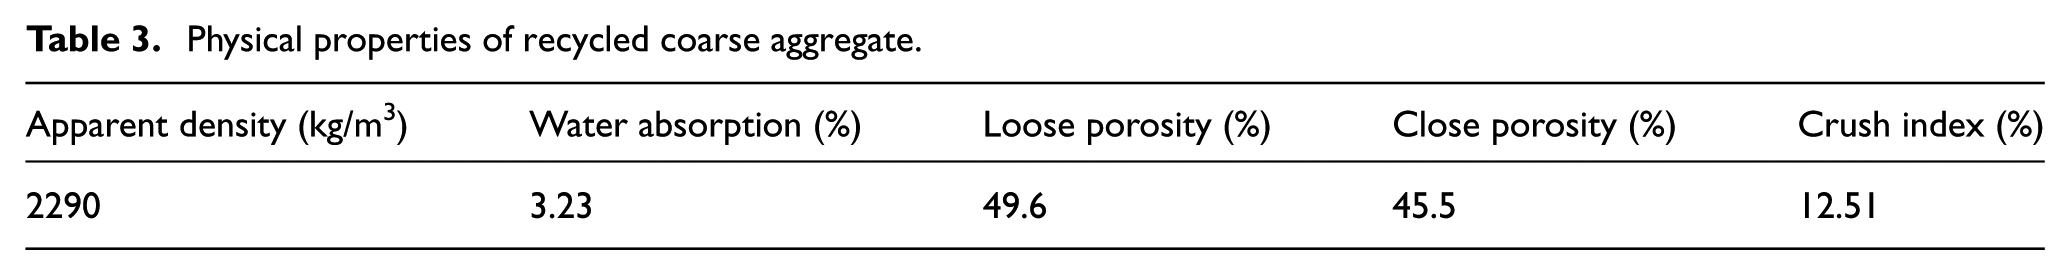
The RCA used in the study came from a local construction and demolition recycling plant. It originated from the columns and beams of a demolished old building at Guangqumen, Beijing, China. Since the RCA came from a demolition site, they contain many components, and the main ones are shown in Table 2. The test average cubic compressive strength of RCA was 32.43 MPa. The basic physical characteristics of the RCAs are shown in Table 3.
Main component of recycled aggregate concrete (RCA).
Physical properties of recycled coarse aggregate.
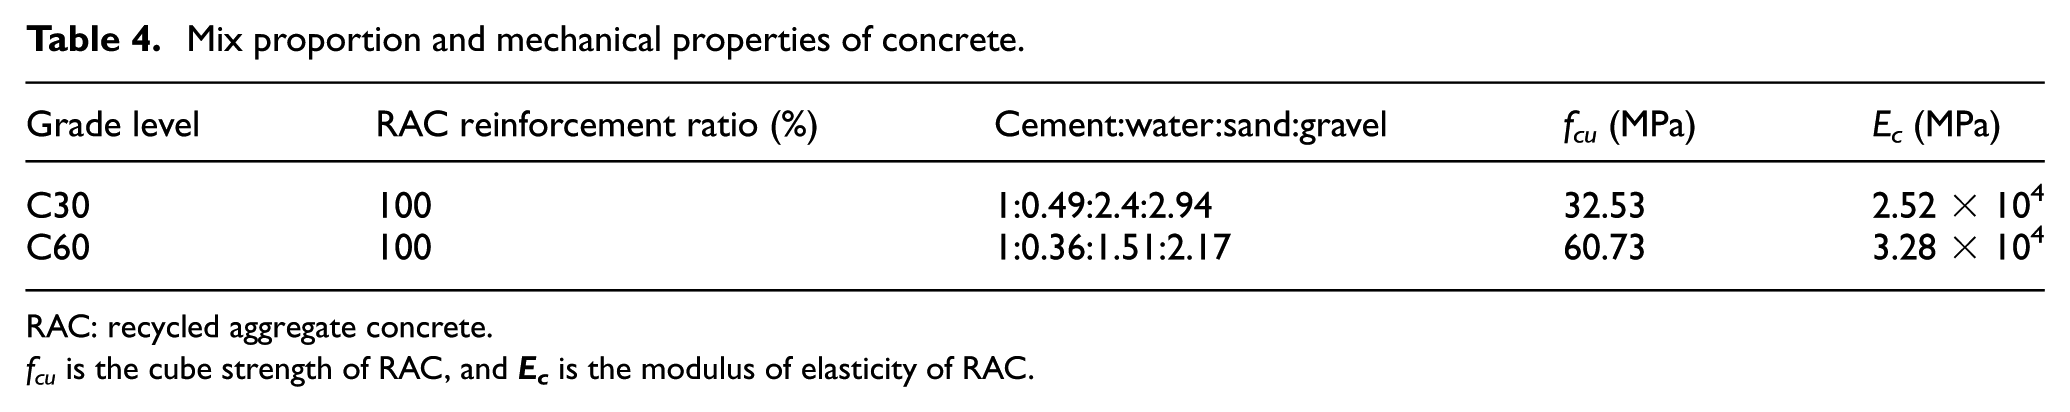
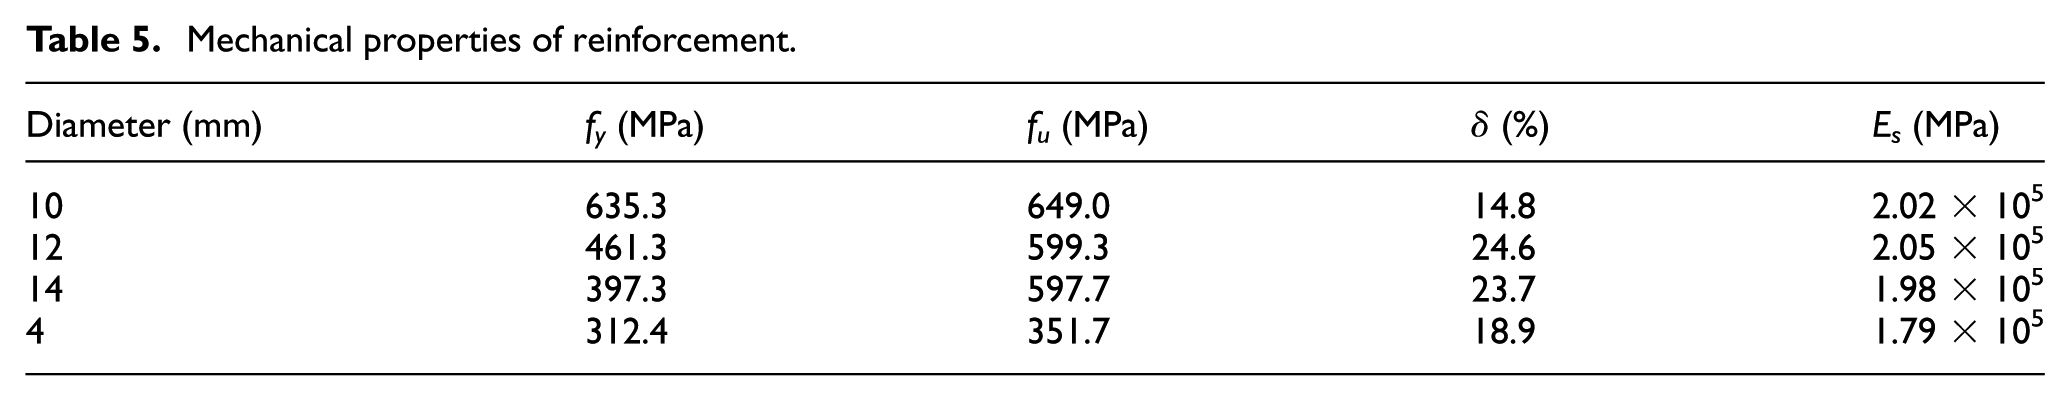
The direct mass replacement method was used to replace NA with RCA. The RAC was mixed on-site. Table 4 shows the mix proportion and mechanical properties of the RAC. The mechanical properties of the reinforcements are listed in Table 5.
Mix proportion and mechanical properties of concrete.
RAC: recycled aggregate concrete.
fcu is the cube strength of RAC, and
Mechanical properties of reinforcement.
The mechanical performance index of the mortar surface layer is as follows: the design strength of the surface layer mortar used in the study is M10, the mass mix proportion of the mortar is cement:sand = 1:5, the measured compression strength of the mortar cubic is 10.57 MPa, and the modulus of elasticity of the mortar is 0.78 × 10⁴ MPa.
The technical performance index of the EPS insulation modules is as follows: apparent density is 19–21 kg/m3, compressive strength is >0.14 MPa, the thermal conductivity is ≤0.037, and the tensile strength perpendicular to the surface is >0.2 MPa.
Making of specimens
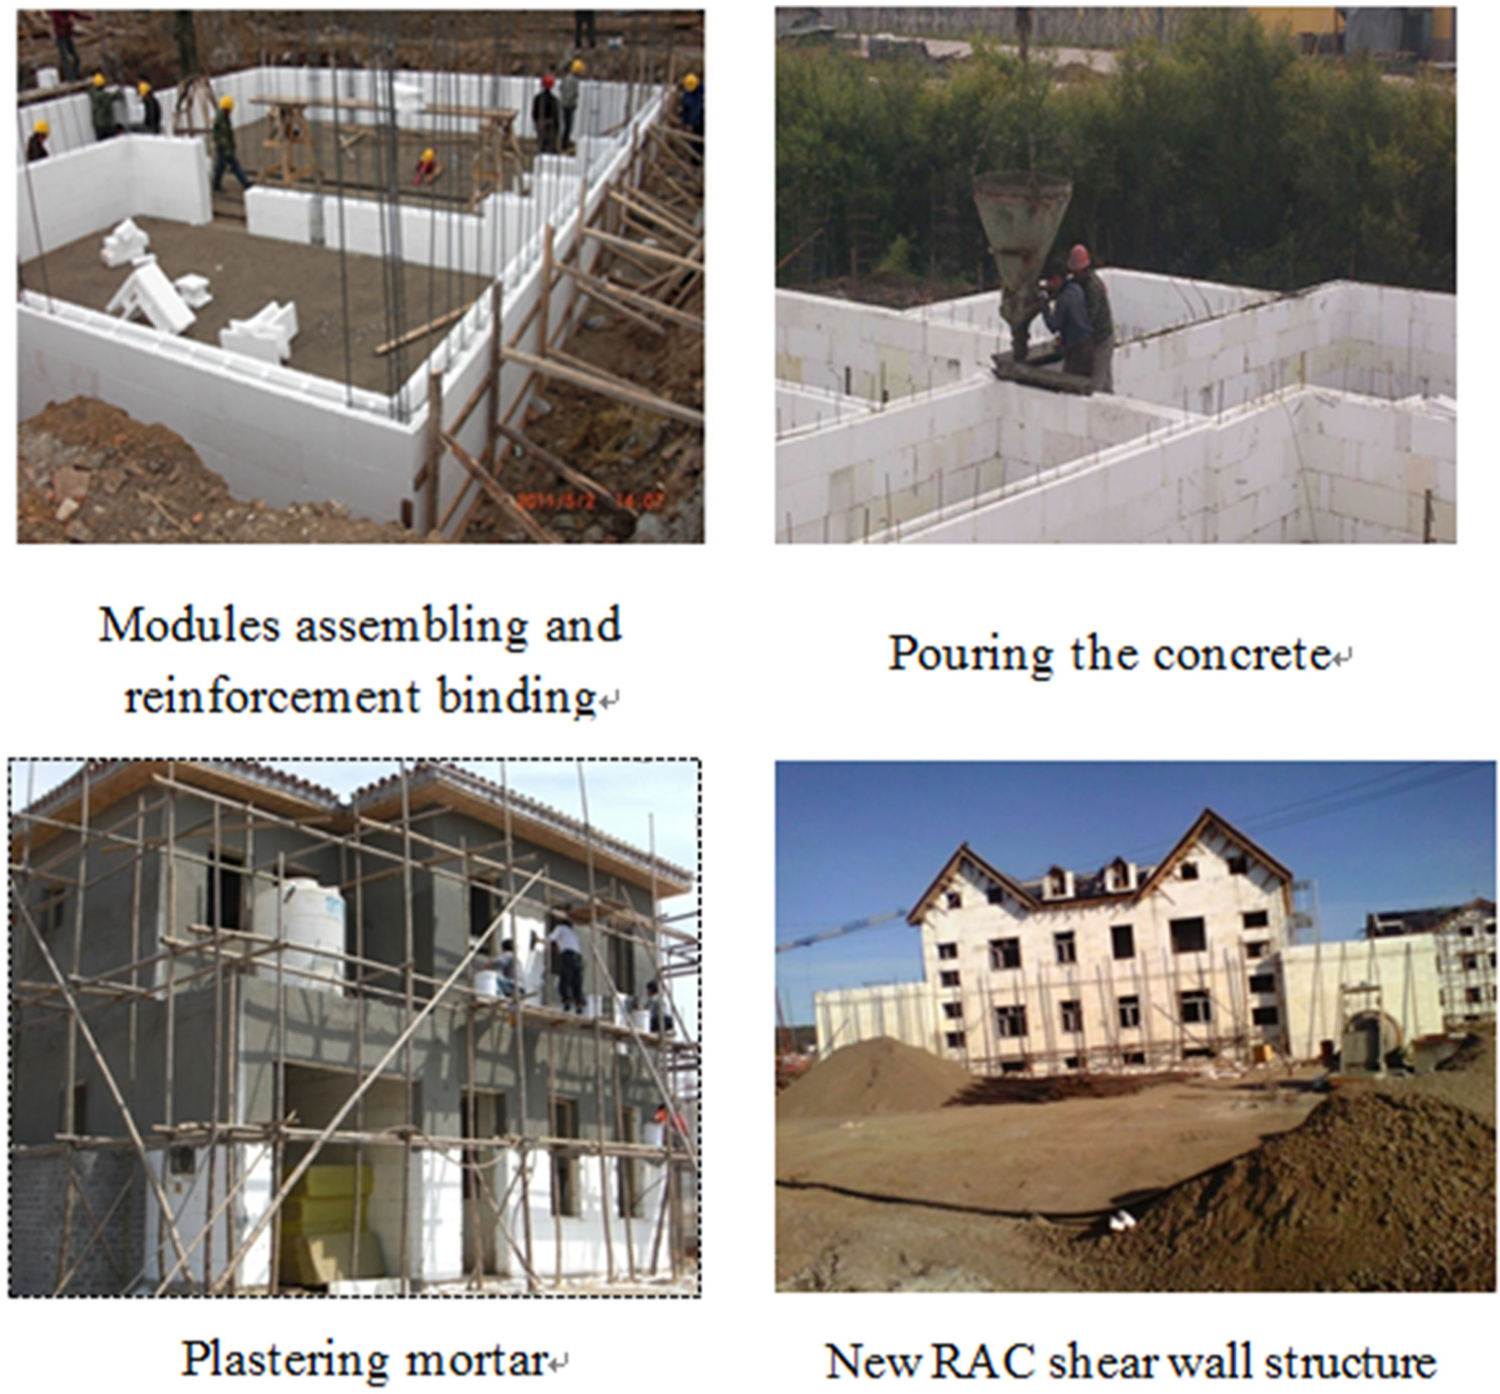
The making process of the specimens included the following: (1) reinforcement binding of foundation beam, (2) vertical reinforcement of the wall positioning, (3) pouring the foundation beam concrete, (4) EPS insulation module assembling, (5) horizontal reinforcement and stirrups of the wall binding, (6) pouring recycled concrete of the wall, and (7) specimens curing and mortar surface layer construction (see Figure 5).
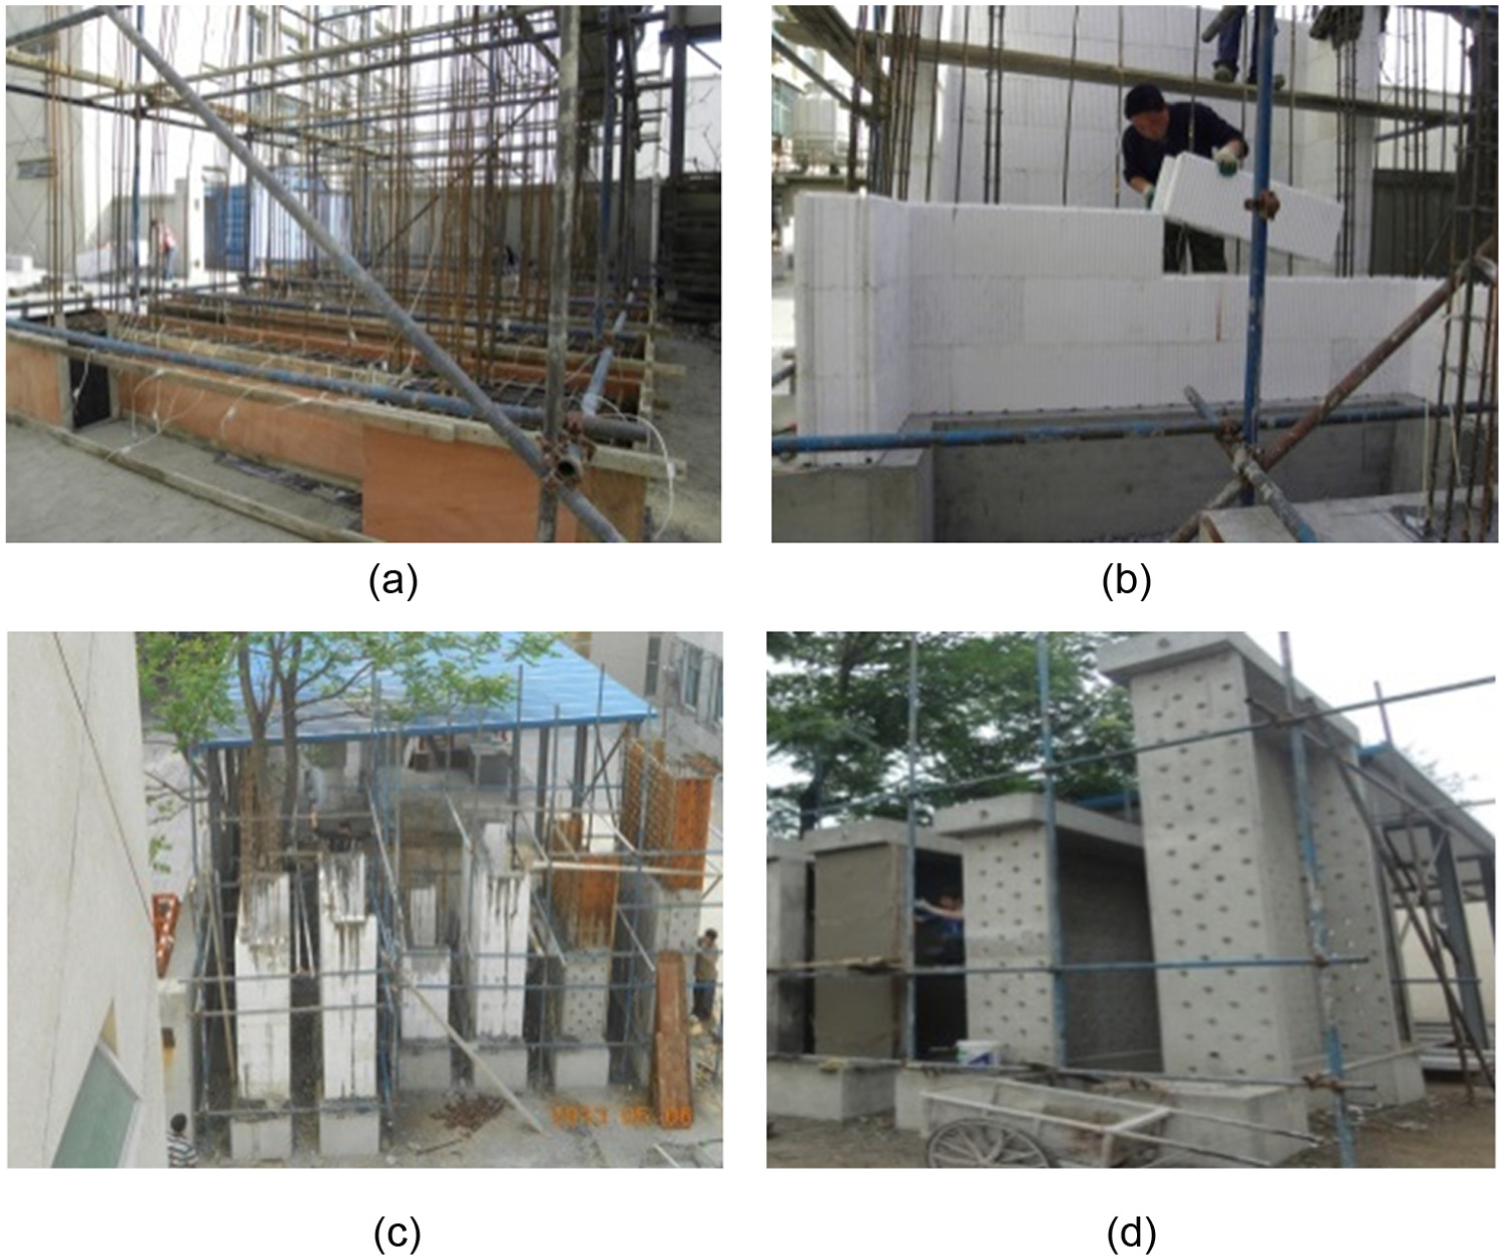
Construction of specimens: (a) reinforcement binding, (b) EPS insulation modules assembling, (c) concrete pouring and curing, and (d) mortar surface layer construction.
Experimental configuration and measurements
The experiment configuration consisted of four main parts: one reaction wall, one reaction steel frame, three hydraulic jacks, and two spreader beams, as shown in Figure 6. Using anchor bolts and steel beams, the base of the specimens was fixed to the laboratory floor with anchor bolts and steel beams. Using two hydraulic jacks to push the two spreader beams on the top of the experimental wall, the axial load was applied uniformly on the wall. The lateral load was applied to the experimental wall using a hydraulic jack to pull and push the top reinforcement beam. Two I-shaped steel beams were installed on the columns of the reaction steel frame along the experimental specimen with direction to avoid the torsion effect of the shear wall during the loading process.
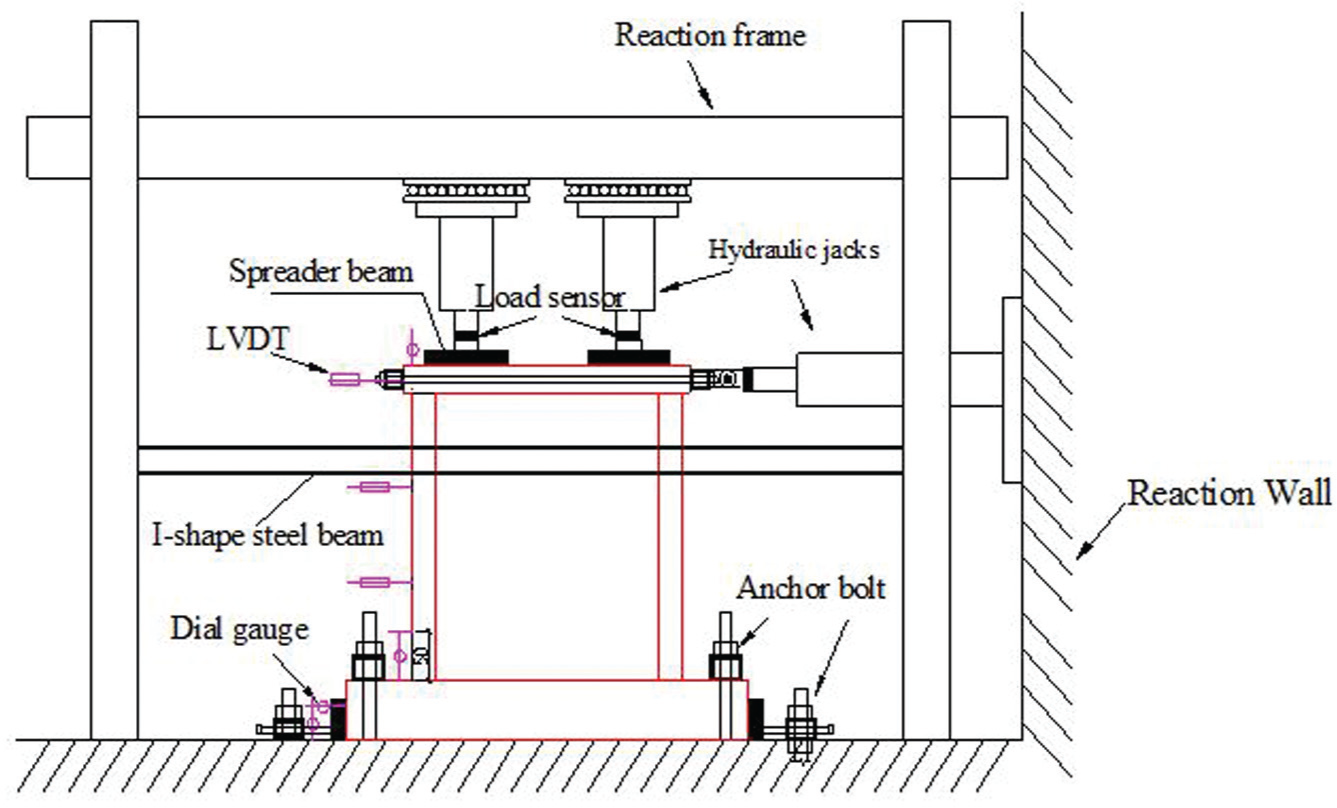
Diagrammatic sketch of the test setup.
During the experiment, a 1600-kN axial load was first applied to the experimental wall. The testing then continued under load-control mode prior to the yielding of the wall. After the yielding, the test was conducted under displacement-control mode.
As shown in Figure 6, the lateral displacements of the experimental wall were measured by linear variable displacement transducers (LVDTs). The lateral slide displacement of the base beam was measured by dial gauges. The axial and the lateral loads were measured using load sensors. The strain gauges were installed at the bottom of the vertical and horizontal reinforcements located at the diagonals of the experimental wall. Figure 7 shows the location of the strain gauges, and they are the same for the four walls.
Locations of strain gauges in experimental wall.
Results
Failure characteristic
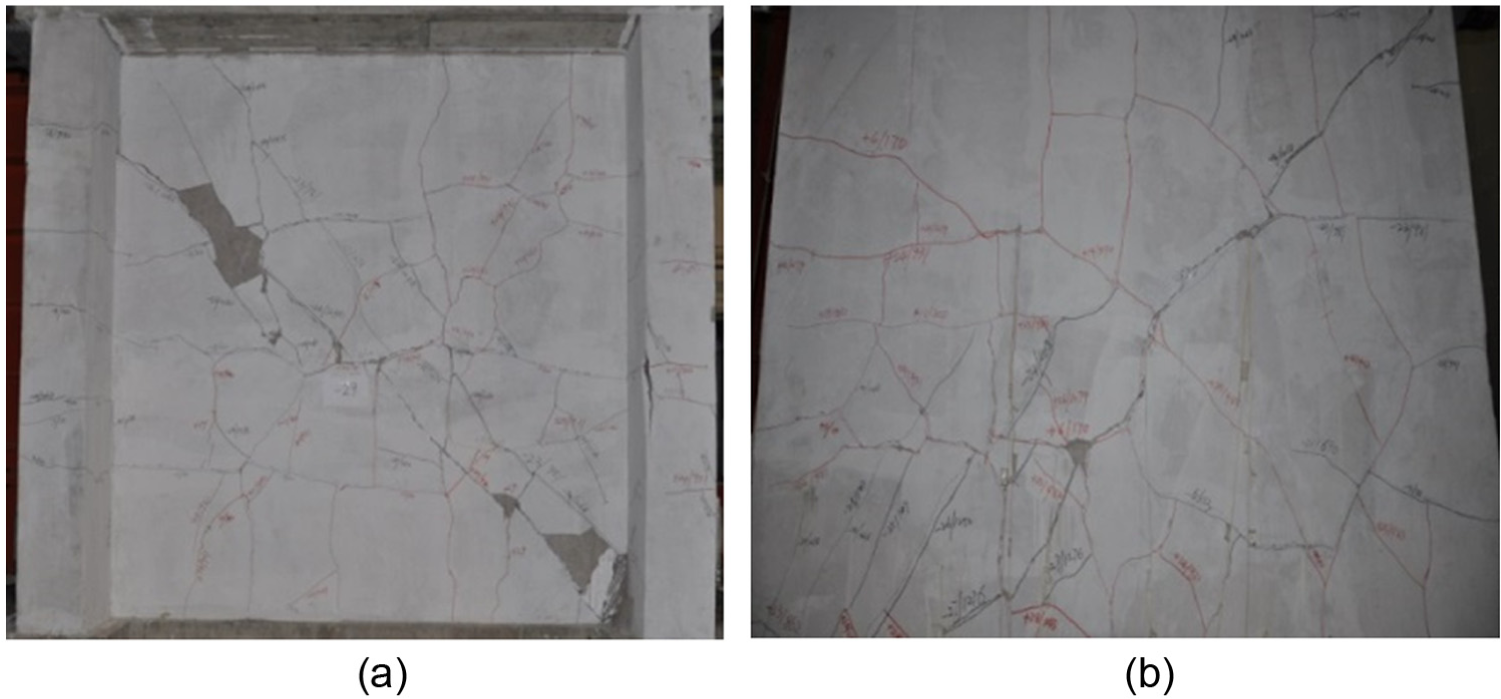
In SW1-1.0, major diagonal cracks were observed on the web of the shear wall, whereas horizontal cracks appeared at the bottom of the shear wall flange. The first horizontal cracks appeared at the bottom of the shear wall flange, when the horizontal load reached 109.41 kN. When the loading reached 131.11 kN, horizontal cracks were observed near the hole, which was 660 mm away from the bottom of the flange. With the load increasing, the horizontal cracks added gradually, when the displacement angle reached 1/1278, diagonal cracks appeared between the first rows of holes and second holes in the corner of the wall. The diagonal cracks developed gradually as the horizontal increased. The stiffness degradation of the specimen was clearly discernable. When the displacement angle reached 1/400, inclined cracks appeared on the wall along the diagonal line; as the loading increased, X-shaped cracks could be observed on the wall. When the displacement angle reached 1/135, the connected oblique cracks along the diagonal line were clearly visible, and the steel bars were pulled off at the middle of the wall. Figure 8 shows the failure modes and crack distributions of SW1-1.0.
Typical failure modes of specimen SW1-1.0: (a) front of the shear wall web, (b) back of the shear wall web, and (c) bottom of the shear wall flange.
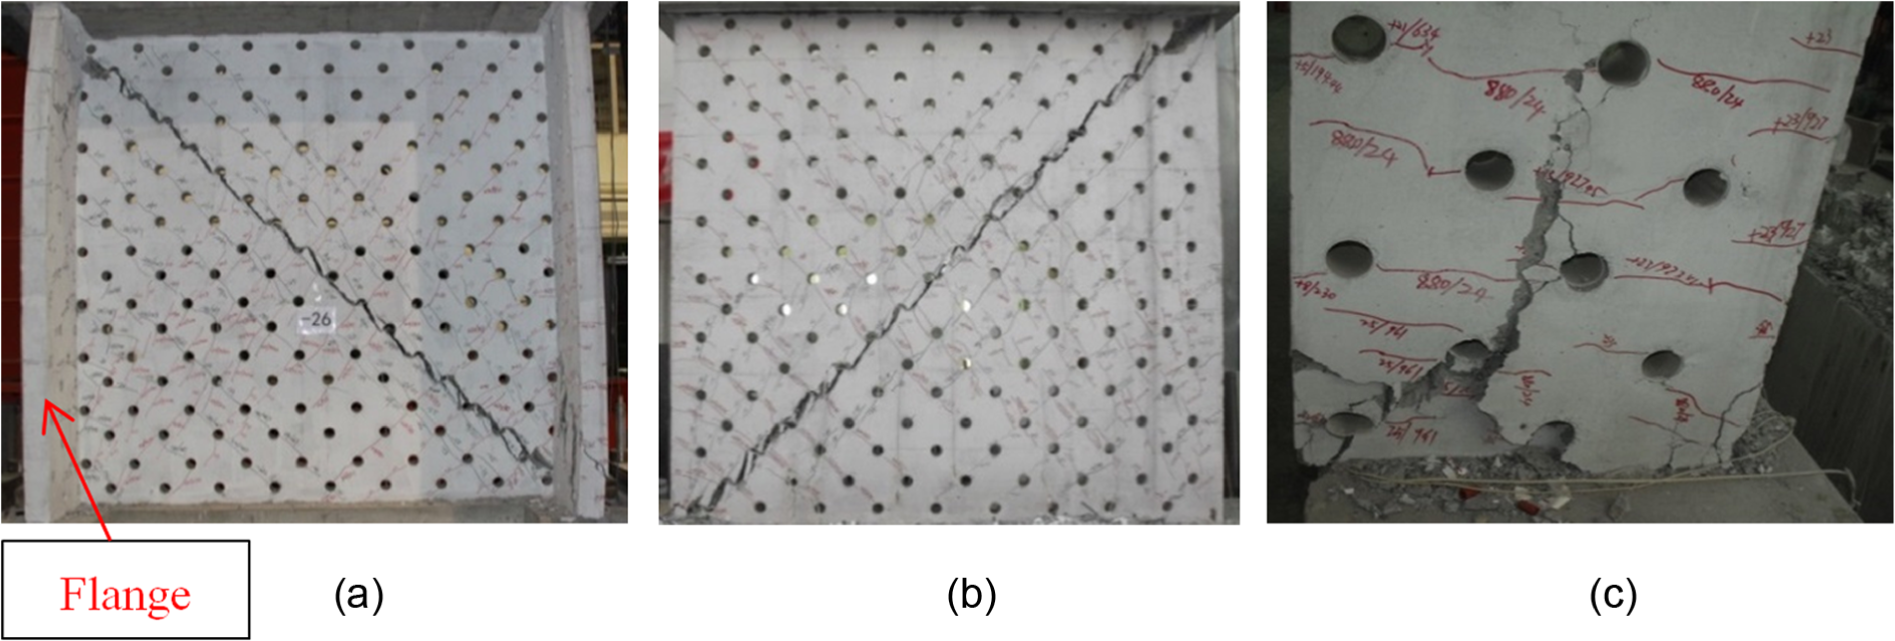
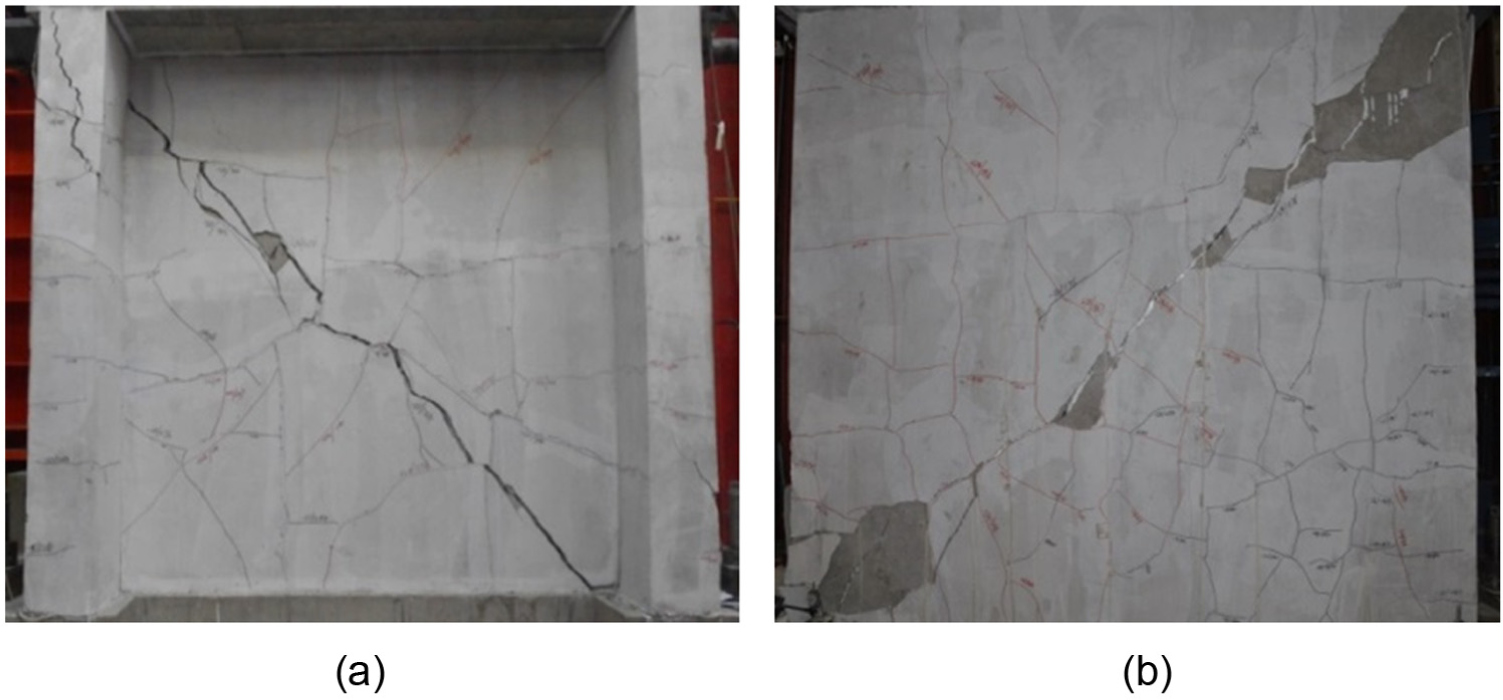
In ESW1-1.0, the cracking processes of mortar were the same as those that of SW1-1.0, and the cracking distribution was closely related to the joint cracking of insulation module; when the displacement angle reached 1/900, the oblique cracks could be observed in the mortar, and the displacement angle at the oblique cracks were greater than that of SW1-1.0. When the displacement angle reached 1/450, the cracks along the diagonal line of mortar widened slightly, and the displacement angle at this point was close to that of SW1-1.0. When the displacement angle reached 1/126, the cracks along the diagonal line of mortar were visible, and mortar was peeled off partly. Figure 9 shows the failure modes and crack distribution of ESW1-1.0. Figure 10 shows that recycled concrete shear wall, EPS insulation module, and mortar connected by the transverse rib and dovetail groove perform well in conjunction.
Typical failure modes of specimen ESW1-1.0: (a) front of the shear wall web and (b) back of the shear wall web.
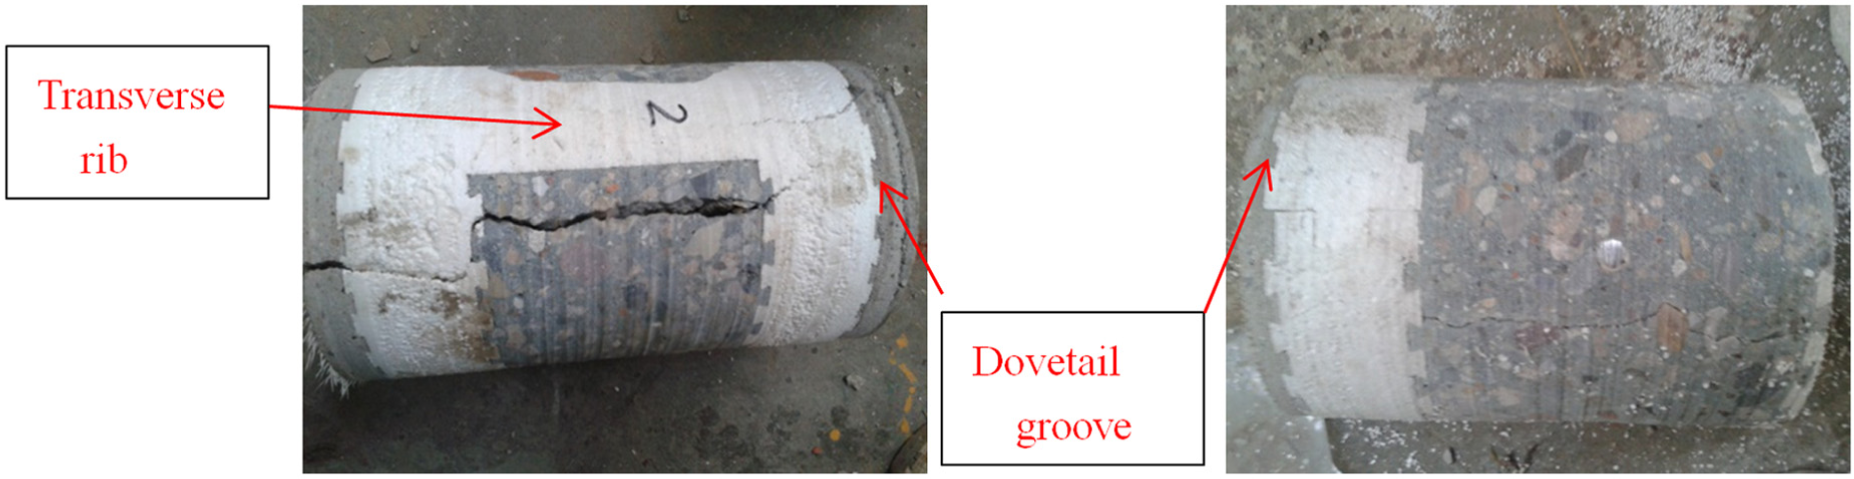
Coring sample of ESW1-1.0.
In ESW2-1.0, the failure process of specimen ESW2-1.0 was similar to that of specimen ESW1-1.0. Prior to the mortar surface layer cracking, the specimen was in the elastic stage, and the load–displacement curve was linear. When the horizontal load reached 130 kN, horizontal cracks appeared on the bottom of the specimen flange and propagated as the load increased. Then, new horizontal cracks connected with the old ones. When the horizontal load reached 390 kN, the vertical cracks appeared on the web of the specimen. Vertical cracks connected with the horizontal cracks, which divided the specimen web into many irregular square blocks. When the horizontal load reached 787 kN, the diagonal cracks appeared on the middle of the specimen web. The displacement angle of the specimen was 1/464. The diagonal cracks on the specimen web added with the increase in the horizontal load, and the inclined cracks appeared on the wall along the diagonal line; afterward, numerous X-shaped cracks were found at the wall web as the loading increased. The diagonal cracks became more and more wide. When the displacement angle was 1/112, the diagonal crack of the wall was more obvious, and the cracks gradually widened until the test stopped. Figure 11 shows the failure modes and crack distribution of ESW2-1.0.
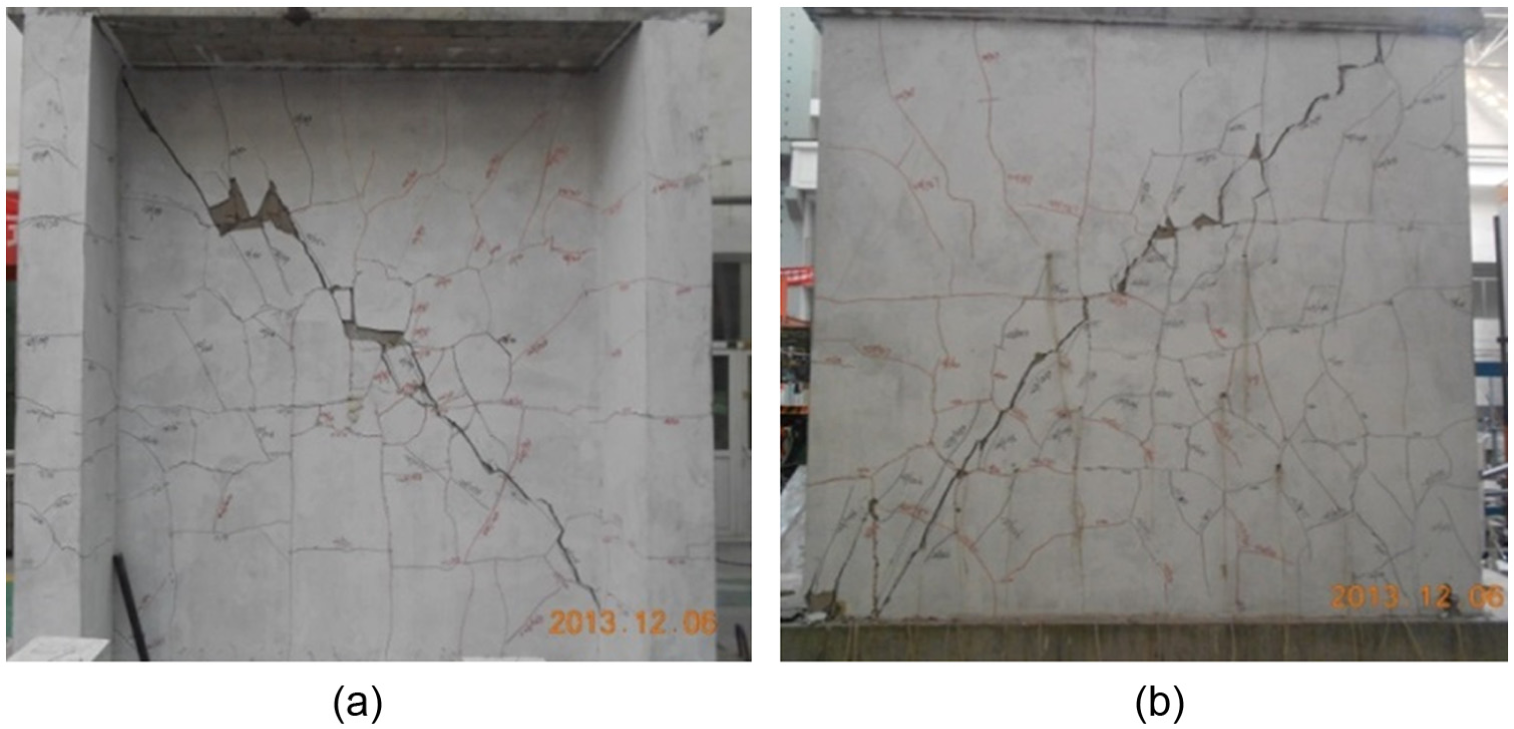
Typical failure modes of specimen ESW2-1.0: (a) front of the shear wall web and (b) back of the shear wall web.
In ESW3-1.0, the damage process of ESW3-1.0 was similar to those that of specimen ESW2-1.0, most diagonal cracks distributed on the web of specimen and the horizontal cracks distributed on the flange of the specimen. The distribution of the cracks in the surface layer is closely related to the insulation module. The failure mode of specimen ESW3-1.0 was tension–shear failure due to the widening diagonal cracks on the web of the specimen with the increasing horizontal load. Figure 12 shows the failure modes and crack distribution of ESW3-1.0. The crack distribution pattern of the specimens is shown in Figure 13. Figure 13 shows that the cracks of specimen SW1-1.0 were primarily distributed along the holes of the shear wall, demonstrating that the holes were the source of weakness in the shear wall. The concrete between the holes was easily damaged under a horizontal load. The crack distribution pattern of the specimens with EPS panels was different from that of SW1-1.0. The cracks were primarily distributed along the mortar surface, indicating that the mortar surface shared a portion of the horizontal load.
Typical failure modes of specimen ESW3-1.0: (a) front of the shear wall web and (b) back of the shear wall web.
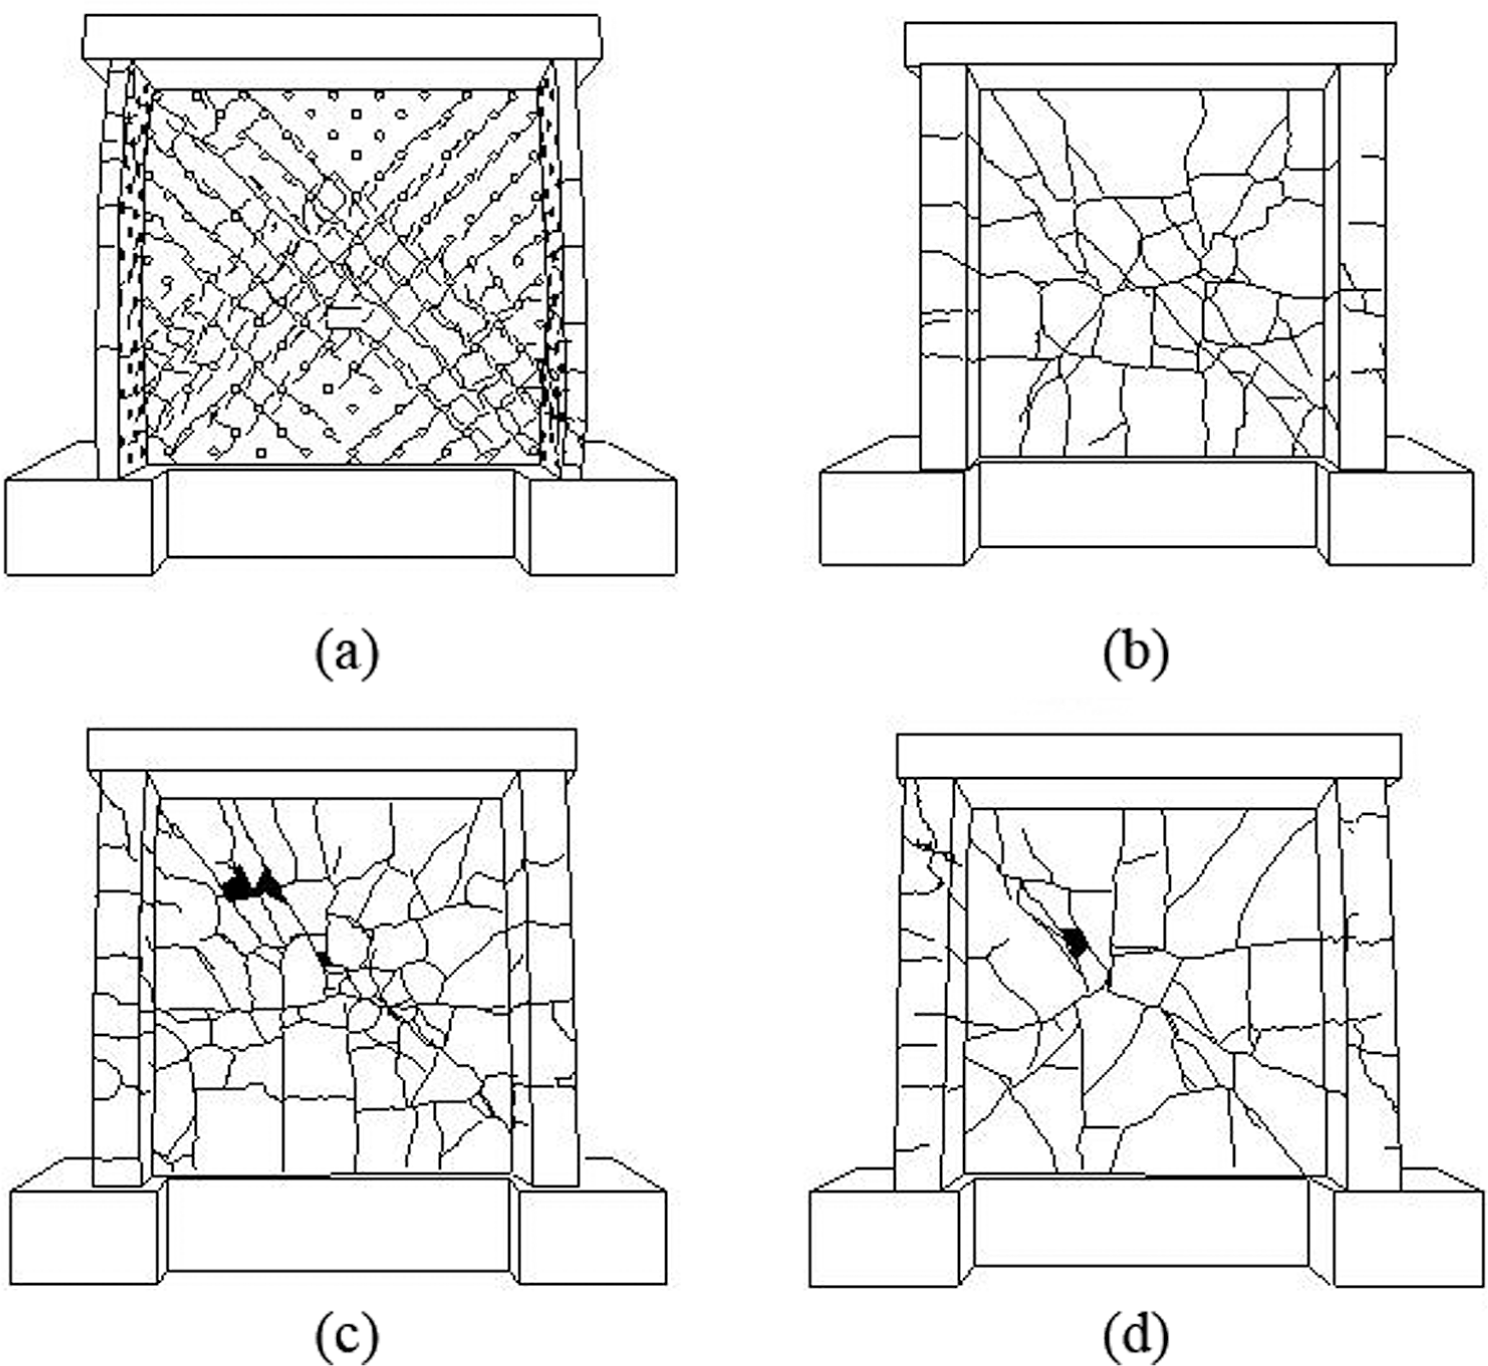
Crack distribution pattern of specimens: (a) SW1-1.0; (b) ESW1-1.0; (c) ESW2-1.0; (d) ESW3-1.0.
Hysteretic performance
The “load–displacement” hysteretic curves of SW1-1.0 and ESW1-1.0 are shown in Figure 14(a), and the skeleton curves of the two walls are shown in Figure 14(b).
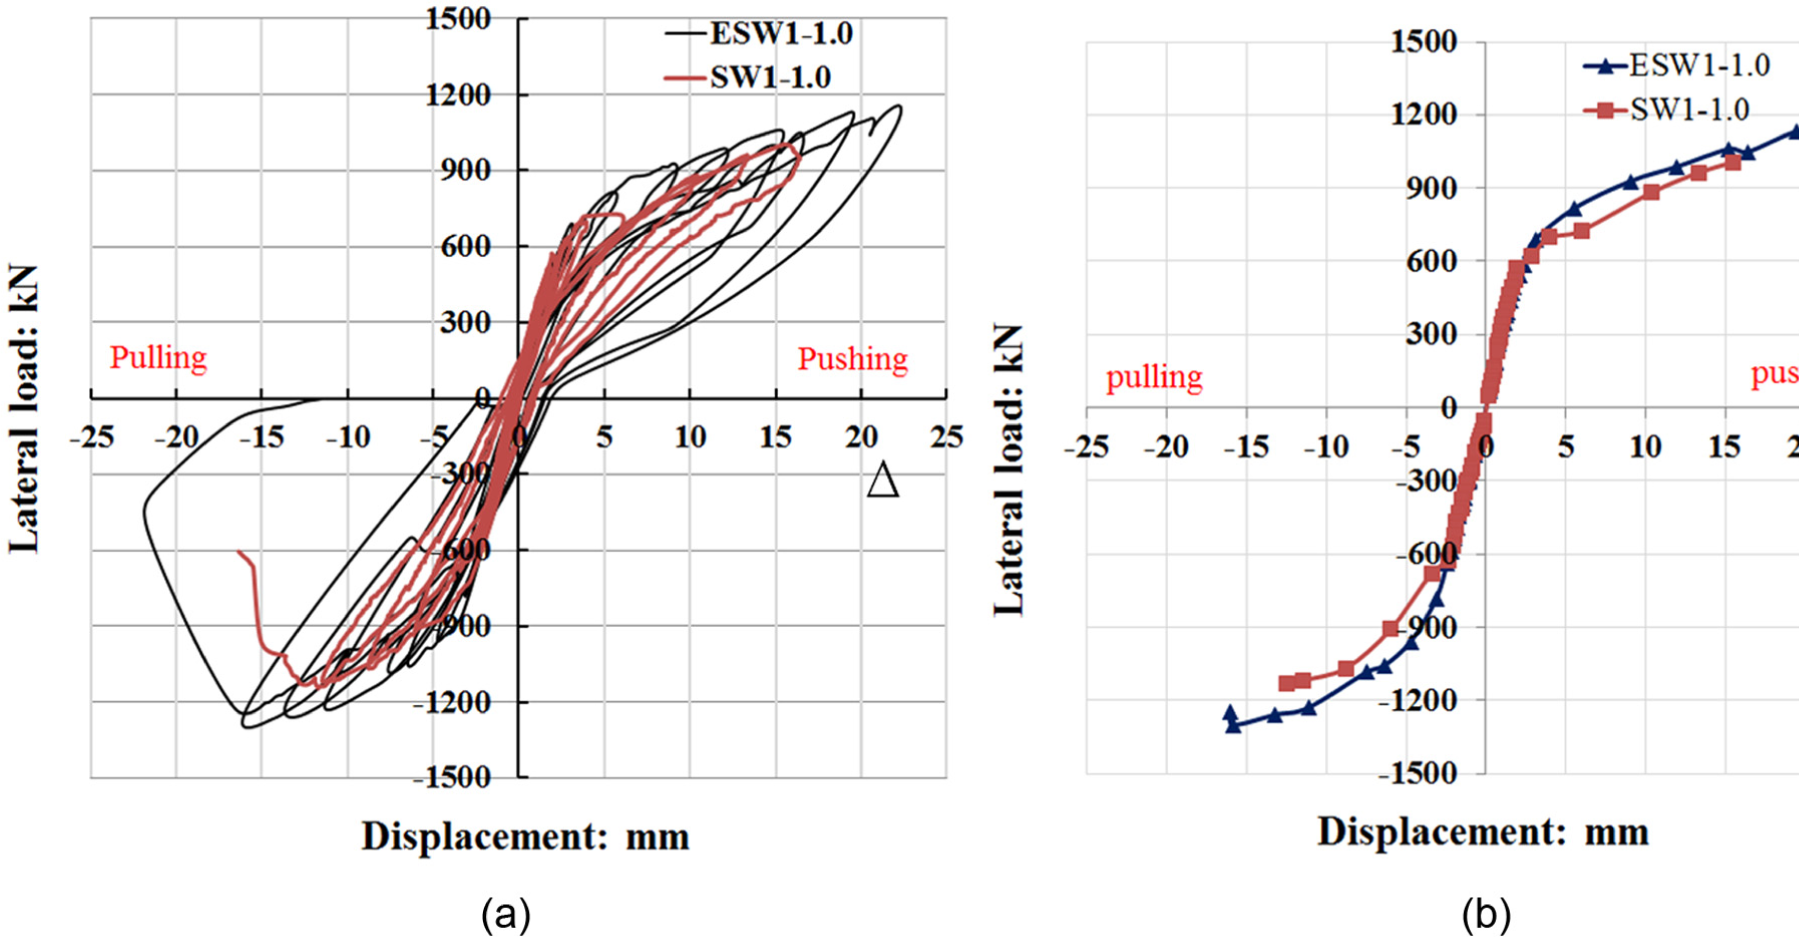
(a) Hysteretic curve of walls SW1-1.0 and ESW1-1.0 and (b) skeleton curve of walls SW1-1.0 and ESW1-1.0.
Figure 14 shows that the displacement increased linearly with force at the initial loading stage, the displacement increased linearly with the force, and that the residual deformations after unloading were negligible. With the increasing repeated cyclic loading, the peak displacement and the residual displacement increased gradually, and the stiffness degradation increased in severity until failure. Compared with specimen SW1-1.0, the hysteretic curve of ESW1-1.0 was broader and the residual displacement after unloading became larger with a higher loading capacity. During the failure process, the deformation capacity, seismic resistance, and energy dissipation capacity of the shear walls were improved by the combined effect of the EPS thermal insulation modules, RAC shear wall, and mortar surface layer. The “load–displacement” hysteretic curves of ESW1-1.0 and ESW2-1.0 are shown in Figure 15(a), and the skeleton curves of the two walls are shown in Figure 15(b).
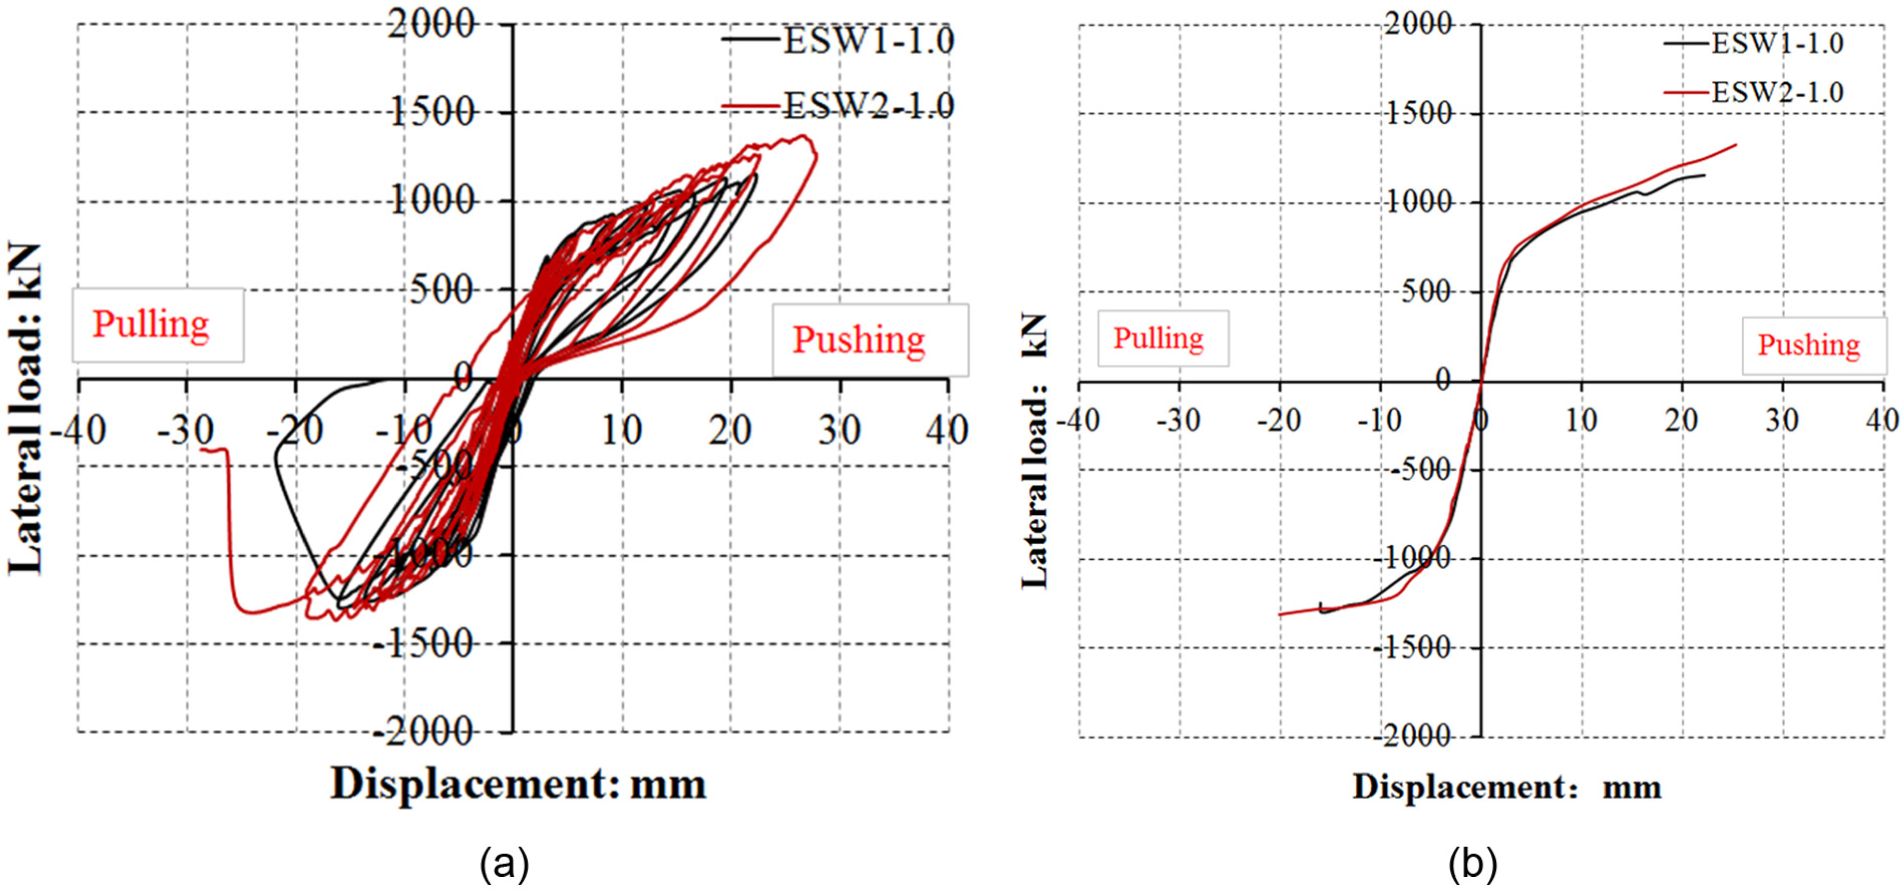
(a) Hysteretic curve of walls ESW1-1.0 and ESW2-1.0 and (b) skeleton curve of walls ESW1-1.0 and ESW2-1.0.
Figure 15 shows that the deformation capacity, seismic resistance, and energy dissipation capacity of the specimen ESW2-1.0 were improved significantly, when compared with the specimen ESW1-10. The results also show that the seismic performance of the new RAC shear wall system can be improved by increasing the RAC strength.
The “load F–displacement Δ” hysteretic curves of ESW2-1.0 and ESW3-1.0 are shown in Figure 16(a), and the skeleton curves of the two walls are shown in Figure 16(b). Because the end portion contacting the horizontal hydraulic jacks of the top concrete beam of specimen ESW3-1.0 was crushed in the pushing direction during the late loading process, only the pulling direction loading was applied to specimen ESW3-1.0.
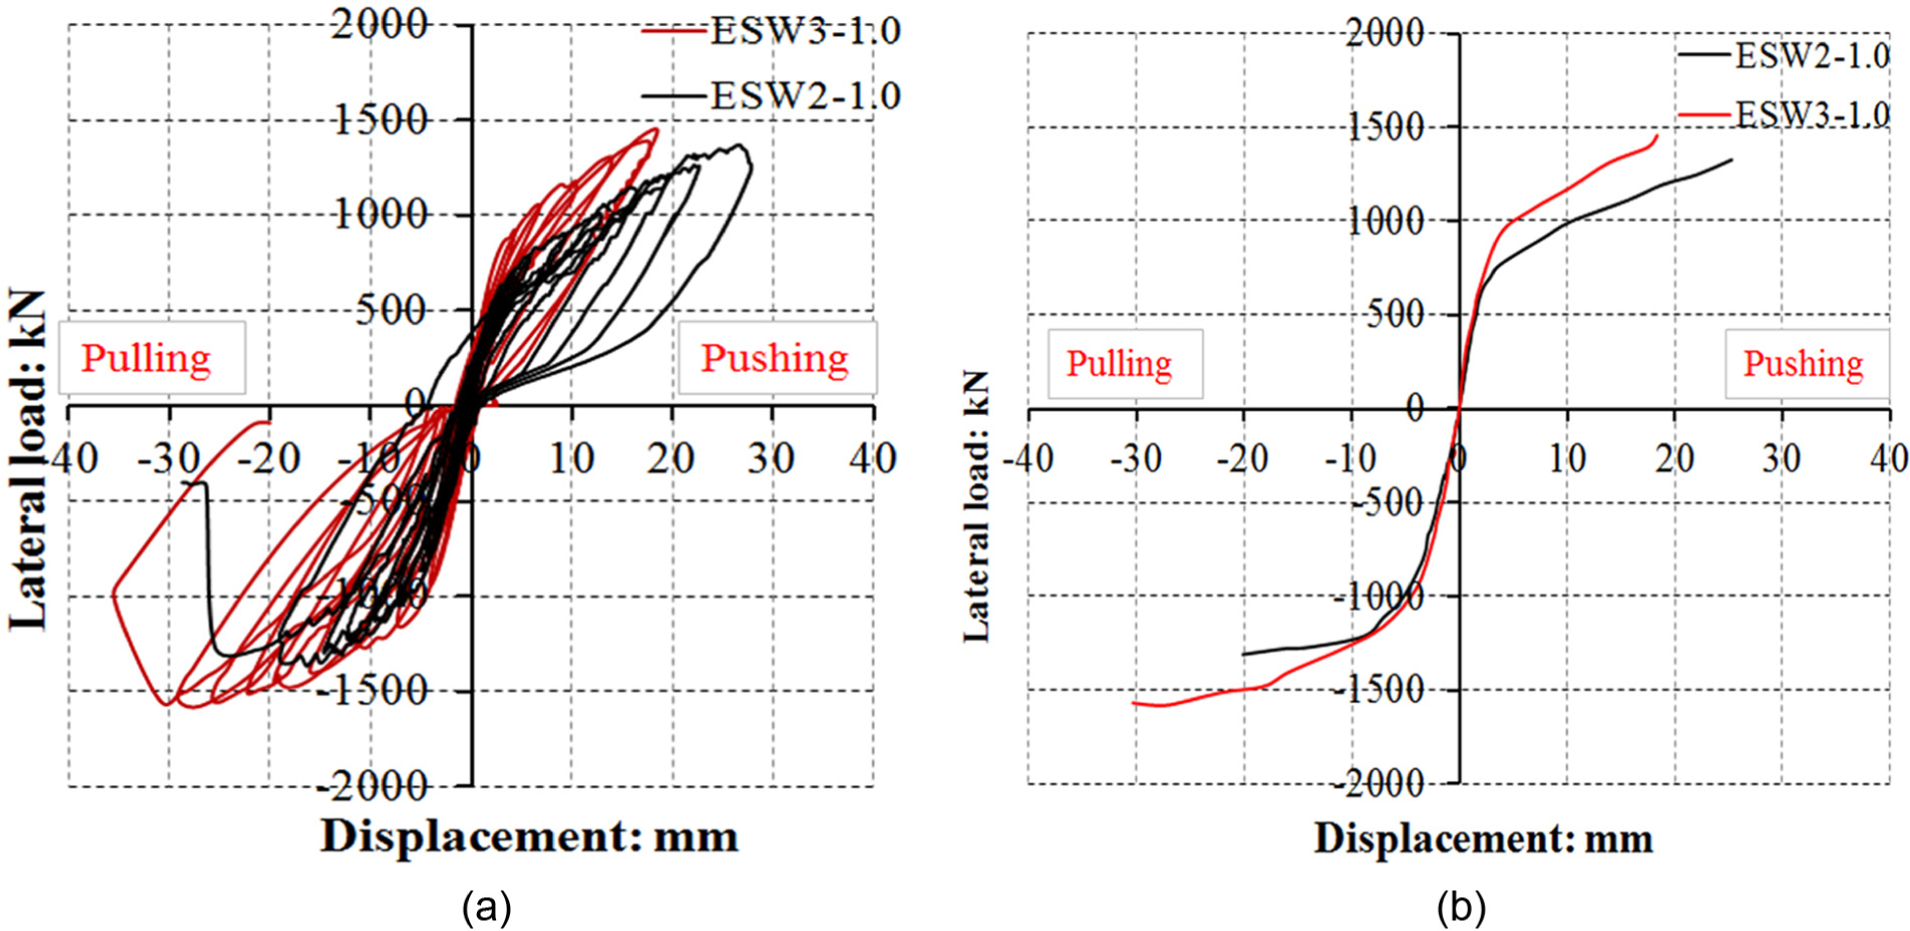
(a) Hysteretic curve of walls ESW1-1.0 and ESW2-1.0 and (b) skeleton curve of walls ESW1-1.0 and ESW2-1.0.
Figure 16 shows that the hysteretic curve of ESW3-1.0 is broader than that of ESW2-1.0. ESW3-1.0 also has a higher loading capacity, greater deformation capacity, and stronger seismic dissipation ability than those of wall ESW2-1.0. The results indicate that the seismic performance of the new RAC shear wall can be improved significantly by increasing the reinforcement ratio.
Displacement and ductility
The yield displacement and ultimate displacement were determined by the energy equivalence method (Guo and Shi, 2003), as shown in Figure 17. However, the skeleton curve of the specimens tested in this paper lacked a descending part, and the displacement (Δ m ) corresponding to the peak load (Fmax) was therefore defined as the ultimate displacement (Δ u ).
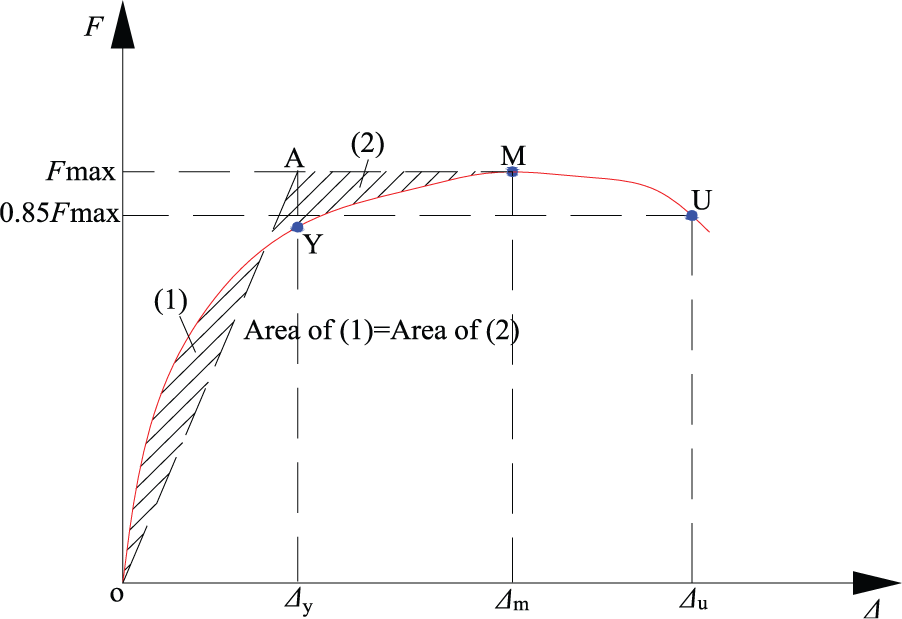
Determination of the yield point.
Table 6 shows the measured yield displacement (Δ y ), ultimate displacement (Δ u ) and their ratio. Table 6 shows that the yield displacement (Δ y ) and the maximum ultimate displacement (Δ u ) of ESW1-1.0 are 9.89% and 36.45%, respectively, greater than those of SW1-1.0. This results indicate that the recycled concrete shear wall, the EPS insulation module, and the mortar layer can work together to improve the deformation capacity. Table 7 shows the experiment results of the displacement and the displacement angle of walls ESW1-1.0 and ESW2-1.0.
Experiment results of displacement and displacement angle.
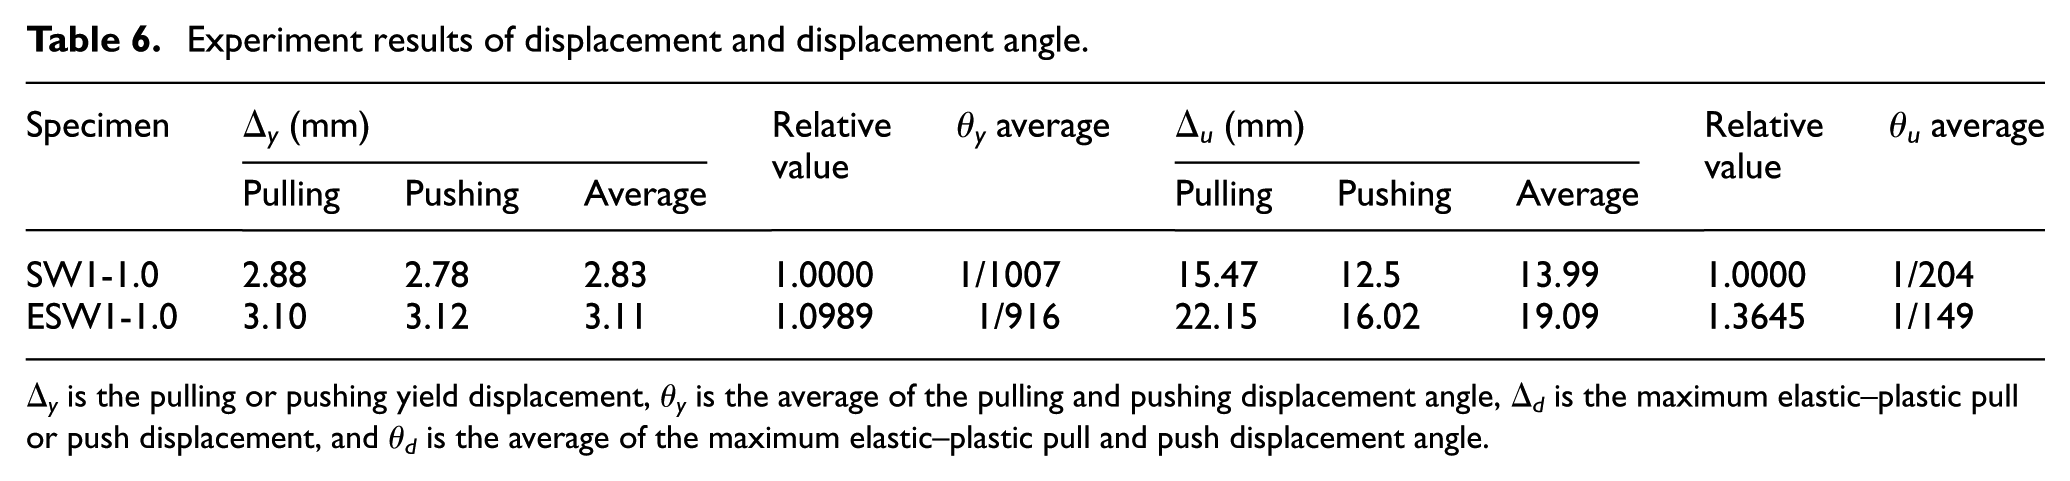
Δ y is the pulling or pushing yield displacement, θy is the average of the pulling and pushing displacement angle, Δ d is the maximum elastic–plastic pull or push displacement, and θd is the average of the maximum elastic–plastic pull and push displacement angle.
Experiment results of displacement and displacement angle.
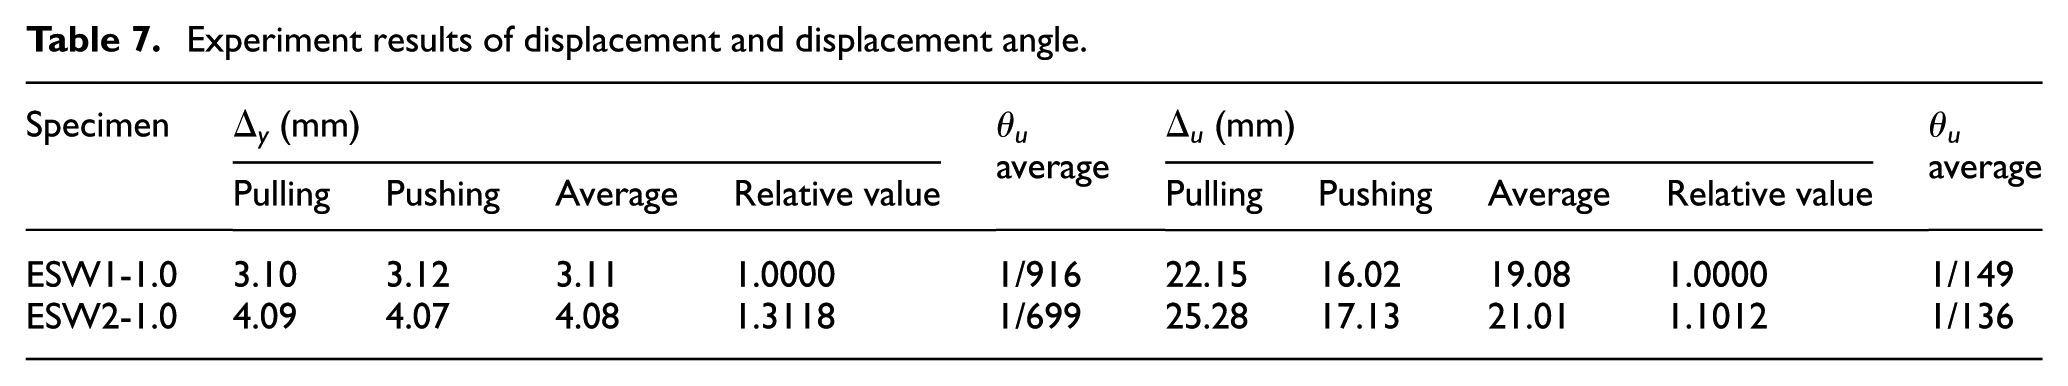
Table 7 shows that the yield displacement (Δ y ) and the ultimate displacement (Δ u ) of ESW2-1.0 are 31.18% and 10.12%, respectively, greater than those of ESW1-1.0. This indicates that deformation capacity of the new RAC shear wall system can be improved by increasing the RAC strength. Table 8 shows the experiment results of the displacement and the displacement angle of ESW2-1.0 and ESW3-1.0.
Experiment results of displacement and displacement angle.
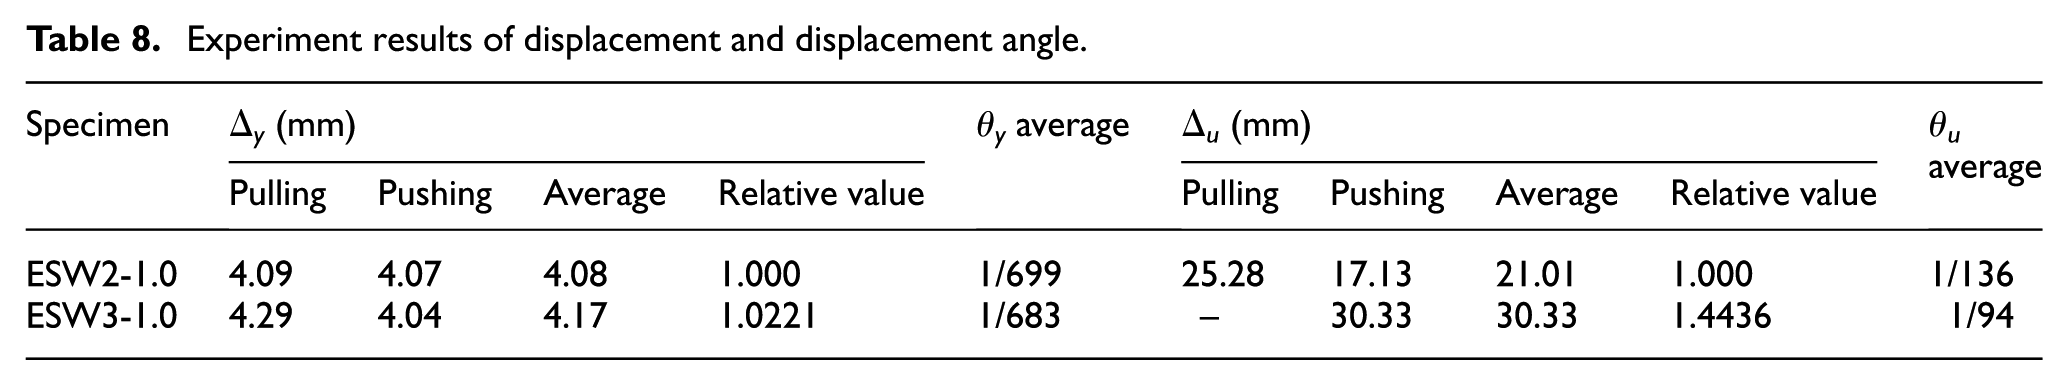
Table 8 shows that the yield displacement (Δ y ) and the maximum elastic–plastic displacement (Δ u ) of ESW3-1.0 are 2.21% and 44.36%, respectively, greater than those of ESW2-1.0. These results indicate that the reinforcement ratio is beneficial for improving elastic–plastic deformation capacity and the ductility of RAC shear wall.
Energy dissipation capacity
The area under the hysteresis curve when the specimen is subjected to the action of low reversed cyclic loading can reflect the magnitude of seismic energy dissipated by the structure. In this work, the area surrounded by the skeleton curve (which was connected by the peak points of the hysteresis curve) of the specimen when the horizontal load 85% peak load (Fmax) was adopted as the representative value of the energy dissipation of the shear wall. However, there was no obvious decline curve segment in the skeleton curves of the experimental specimens studied in this paper. The area surrounded by the skeleton curve was adopted as the representative value of the energy dissipation of the new shear walls. Table 9 lists the energy dissipation of each specimen.
Experimental results of energy dissipation.
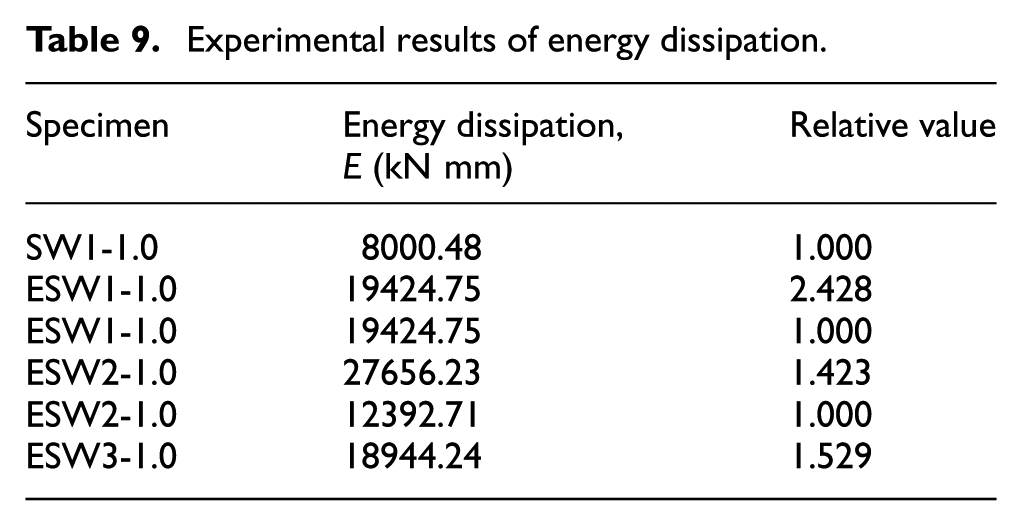
Table 9 shows that the energy dissipation of ESW1-1.0 is 142.8% higher than that of SW1-1.0. This indicates that the EPS modules and outer mortar layers participate in a satisfactory manner in the seismic resistance and energy dissipation process and accordingly enhanced the energy dissipation capacity of the walls significantly. The energy dissipation of ESW2-1.0 is 42.3% more than that of ESW1-1.0, which indicates that the concrete strength is higher, and the energy dissipation capacity is greater. The energy dissipation of ESW3-1.0 is 52.9% more than that of ESW2-1.0, which indicates that the ratio of the reinforcement has significant effects on the seismic resistance and energy dissipation of RAC shear walls.
Stiffness degradation
The secant stiffness of each specimen was calculated from the skeleton curve of the hysteresis plot using Eq. (1) (Ministry of Housing and Urban, Rural Development (MHURD), 1996)
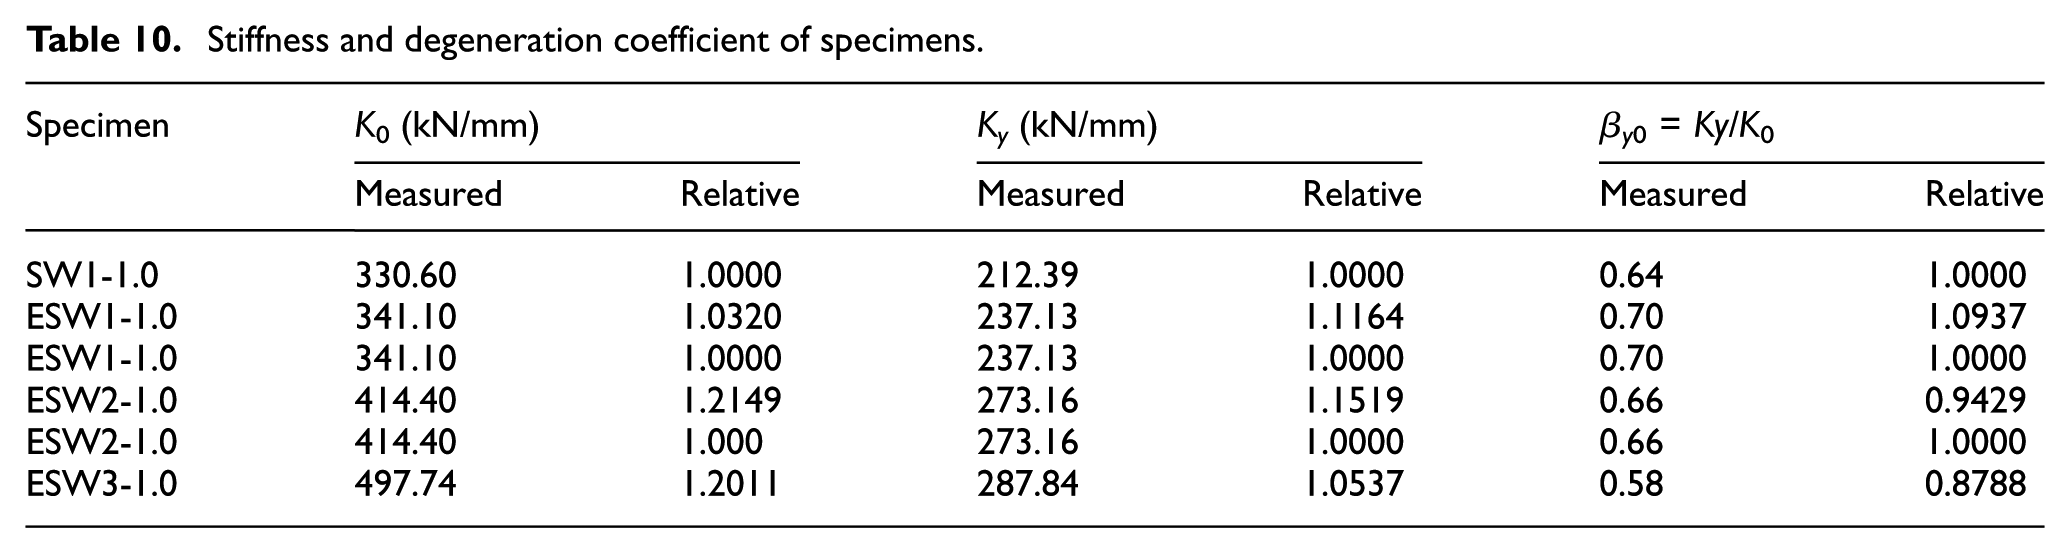
The measured stiffness and the stiffness degradation coefficient of the specimens are listed in Table 10. K0 represents the initial elastic stiffness of the specimens under pulling or pushing load; Ky represents the yield stiffness of the specimens under pulling or pushing load; and βy0 = Ky/K0 represents the ratio of the yield stiffness to the initial elastic stiffness, which indicates the stiffness degradation characteristic of the specimens. The “stiffness–displacement angle K–θ” curves are shown in Figure 18.
Stiffness and degeneration coefficient of specimens.
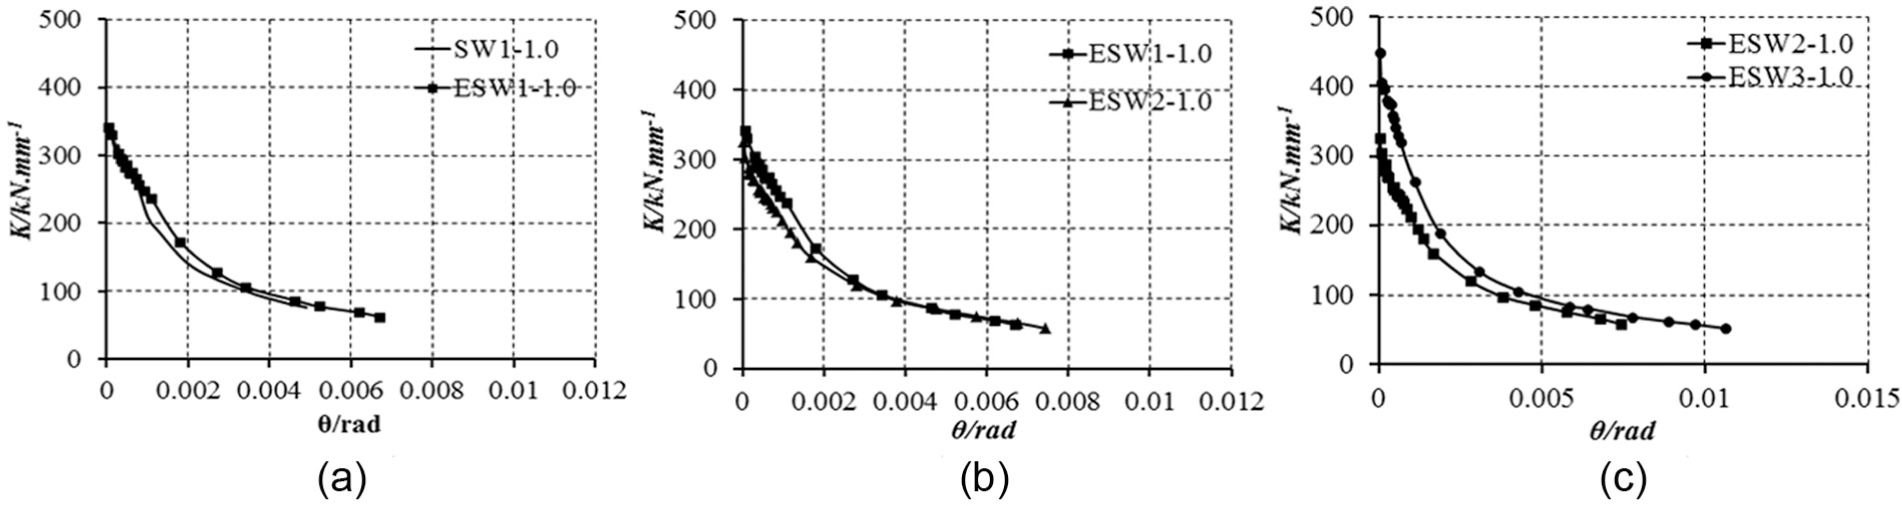
K–θ curves of specimens.
Table 10 and Figure 18(a) show that in the initial stage, the stiffness of the specimens ESW1-1.0 and SW1-1.0 is relatively close, which indicates that the initial stiffness of the specimens is mainly determined by the concrete wall. The stiffness of the specimen ESW1-1.0 does not equal to the sum of the concrete wall stiffness and the mortar layer stiffness, as the deformation of the mortar layer is slower than the core concrete wall. Therefore, when the core concrete wall was damaged to some extent, the surface mortar layer deforms slower, which begins to play an important role in delaying the destruction of the composite wall and improving the ductility. The yield stiffness of specimen ESW1-1.0 is increased by 11.64% compared to specimen SW1-1.0, due to the contribution of the mortar layer and the insulation module. The proportion of the increase is improving with the enlargement of the displacement angle. The stiffness degradation speed of the specimens is basically same, when the displacement angle changes from 0 to 0.0005; the stiffness degradation became significantly slower than SW1-1.0, when the displacement angle changes from 0.0005 to 0.0034; and then the stiffness degradation curves of ESW1-1.0 and SW1-1.0 show a parallel trend, when the displacement angle changes from 0.0034 to 0.0049. Figure 9 also shows that the degradation process curve of specimen ESW1-1.0 is relatively flat, which indicates that specimen ESW1-1.0 has better seismic performance and has more stable working performance than SW1-1.0.
Table 10 and Figure 18(b) shows that the stiffness degradation trend of ESW2-1.0 is similar to that of ESW1-1.0, which degenerated rapidly at the initial loading stage and then slowly at the later stage. The initial stiffness and yield stiffness of specimen ESW2-1.0 are increased by 21.49% and 15.19%, respectively, compared to specimen ESW1-1.0 due to the increase in RAC strength. The stiffness degradation speed of the ESW2-1.0 is slightly faster than ESW1-1.0 at the initial loading stage, when the displacement angle changes from 0.001 to 0.003. The stiffness degradation speed of ESW1-1.0 is basically same as ESW2-1.0. The stiffness degradation curves of ESW1-1.0 coincide with that of ESW1-1.0. When the displacement angle changes from 0.003 to 0.006, the stiffness degradation speed of the ESW1-1.0 is slightly faster than ESW2-1.0, which indicates that increasing the RAC strength is useful for slowing the post-yield stiffness degradation of the new RAC shear wall system.
Table 10 and Figure 18(c) shows that the initial stiffness and yield stiffness of specimen ESW3-1.0 are increased by 20.11% and 5.37%, respectively, compared to specimen ESW2-1.0 due to the increase in reinforcement ratio of RAC shear wall. The stiffness degradation speed of the ESW3-1.0 is basically same as ESW2-1.0 when the displacement angle is <0.0045. The stiffness degradation speed of the ESW2-1.0 is faster than that of ESW3-1.0 when the displacement angle is >0.0045, which indicates that improving the RAC strength is useful for slowing the post-yield stiffness degradation of the new RAC shear wall system.
Loading capacity
Provided in Table 11 are the yield load Fy, peak load Fmax, and their ratios. The yield load Fy was determined by the energy equivalence method (Guo and Shi, 2003), as shown in Figure 17. The loads were expressed as the average of the pushing and pulling values.
Experiment results of cracking load, yield load, and ultimate load.
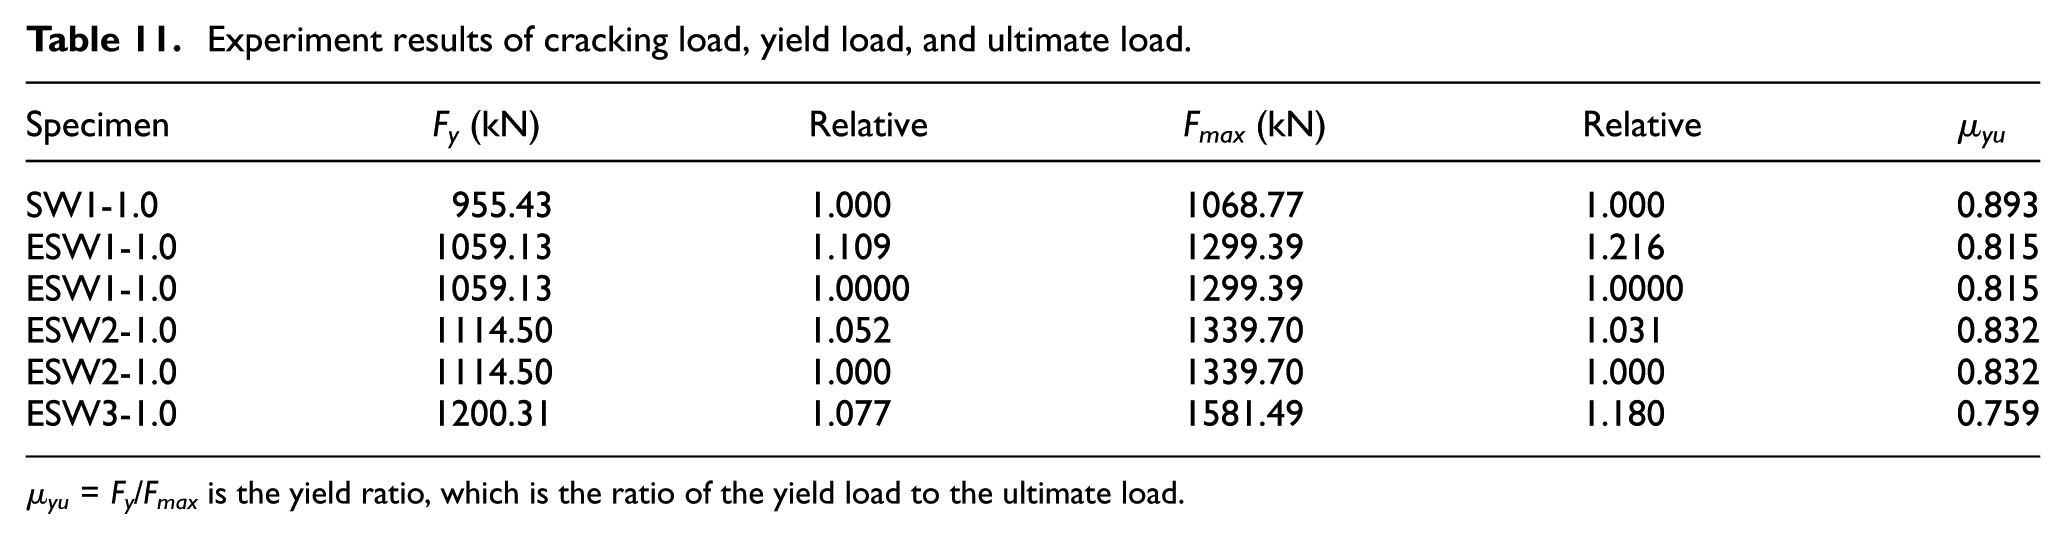
µyu = Fy/Fmax is the yield ratio, which is the ratio of the yield load to the ultimate load.
Table 11 shows that the yield load and the peak load of ESW1-1.0 are 10.9% and 21.6%, respectively, higher than those of wall SW1-1.0. The yield load and the ultimate load of ESW2-1.0 were 5.2% and 3.1%, respectively, higher than those of ESW1-1.0. The yield load and the ultimate load of ESW3-1.0 were 7.7% and 18%, respectively, higher than those of ESW2-1.0 respectively. These findings indicate that the EPS insulation module and the surface mortar layer can improve the loading capacity of the shear wall. The ratio of the yield load to peak load of ESW1-1.0 is slightly smaller than SW1-.10, which is beneficial to the stability of new RAC shear wall structure undergoing earthquake. The strength of RAC has a little effect on improving the loading capacity of the RAC shear wall. However the effect of reinforcement ratio on improving the loading capacity of RAC shear wall is noticeable.
Determination of bearing capacity
Determination of bending bearing capacity
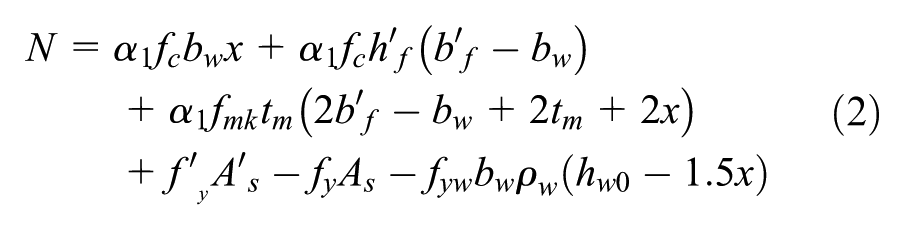
To determine bending bearing capacity, the following assumptions are made: (1) since the vertical distribution reinforcement ratio is low, the contributions of the vertical reinforcements located at the compression zone and near the neutral axial are ignored. (2) When considering the tensile effect of the vertical distribution reinforcement distributing in the hw0 − 1.5x range, the effects of the concrete and the surface layer mortar are not included. (3) The section deformation is consistent with the assumption of plane cross section (Bao and Zhang, 2005). Figure 19 shows the bending bearing capacity calculation model. The bending bearing capacity can be determined using equations (2) to (4)
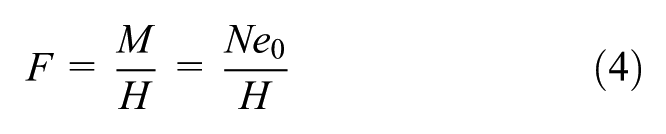
Mechanical model of bending bearing capacity.
In equations (2) and (3), for
Methods for determining shear capacity
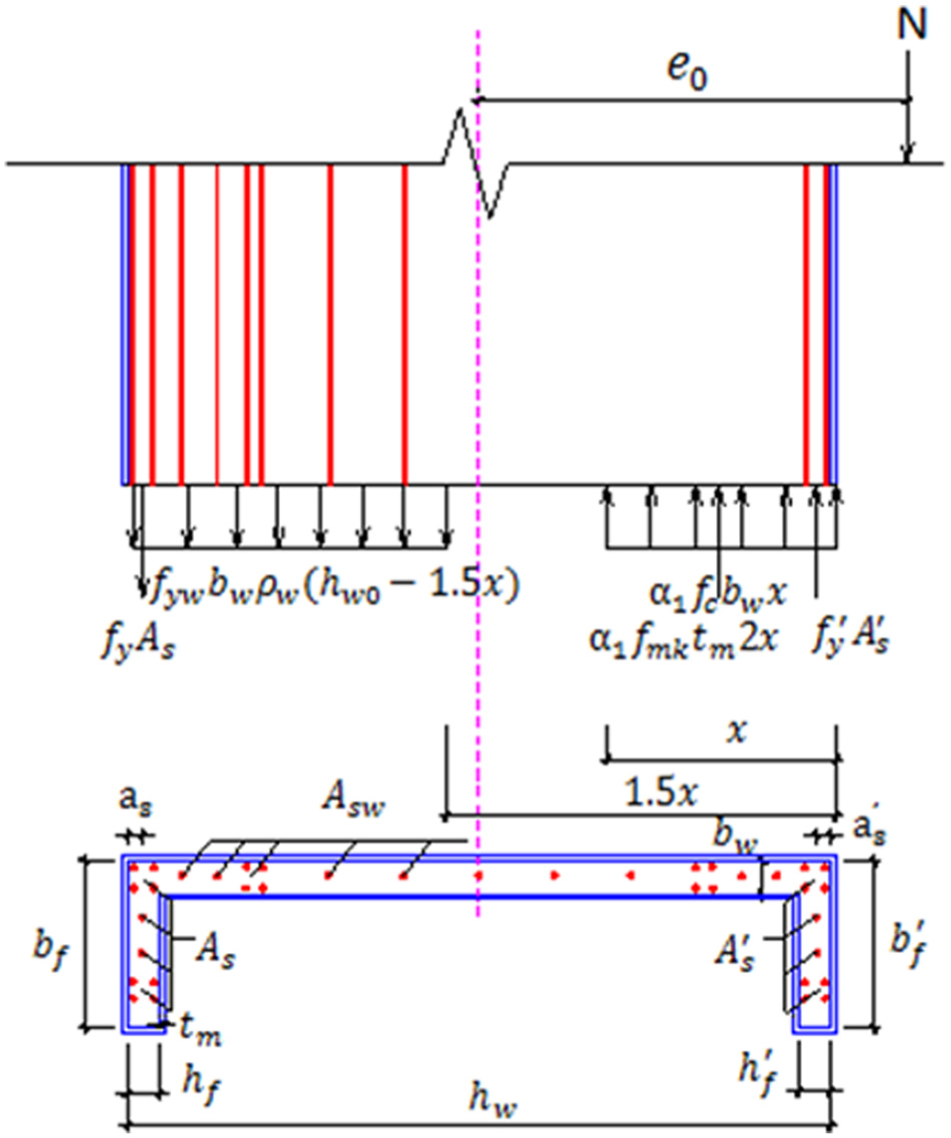
Hwang et al. (2001) and Hwang and Lee (2002) proposed a softened strut-and-tie model for determining the shear strength of squat walls. Figure 20 shows the shear bearing capacity calculation model. The shear bearing capacity can be determined using equation (5)
where
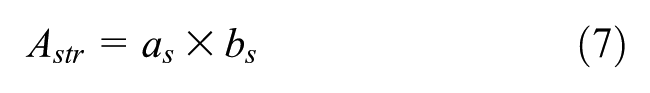
where K is the coefficients of strut-and-tie model; Kh and Kv are coefficients of the horizontal and vertical tie–strut, respectively; fc = 0.8fcu,k is the axial compressive strength of concrete cylinder; fcu,k is the cube compressive strength of the recycled concrete; Astr is the effective area of the diagonal strut; bs is the width of the diagonal strut that can be taken as the width of the wall web tw; and as is the depth of the diagonal strut.
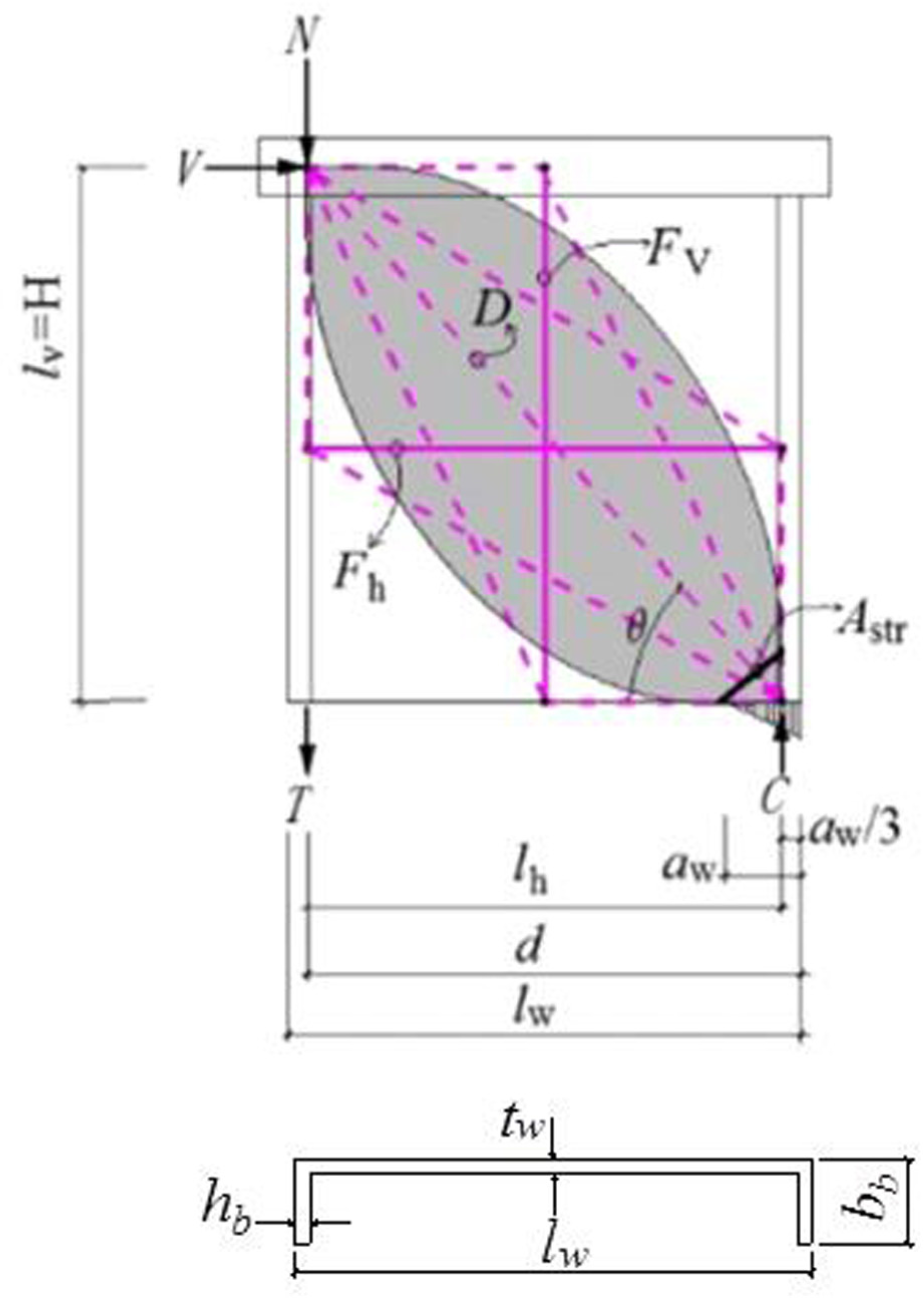
Mechanical model of shear bearing capacity.
The depth of the diagonal strut (as) depends on its end condition provided by the compression zone at the base of the wall. It is intuitively assumed that
where aw is the depth of the compression zone at the base of the wall.
For general purposes, aw can be determined by the section analysis for the stage during the extreme tensile steel yielding. For simplicity, aw can be calculated with equation (9)
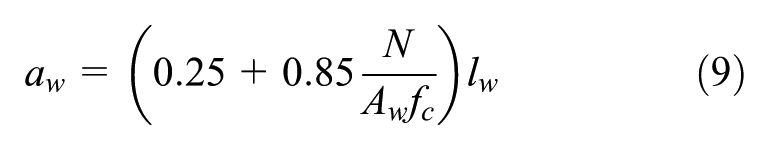
where Aw is the net area of the concrete section bounded by the web thickness tw and the length of the section in the direction of the shear force
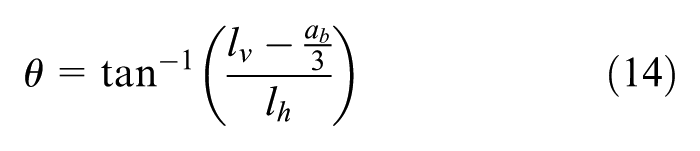
where lv is the height (width) of the diagonal shear strut, respectively; lh = d − aw/3 is the height (width) of the diagonal shear strut, respectively, d = 0.8lw; lw is the whole length of the wall along the shear direction.
Tu (2005) proposed semi-empirical analysis model used for calculating the shear bearing capacity of the shear wall, which mainly considered about the effect of the boundary element (Figure 21).
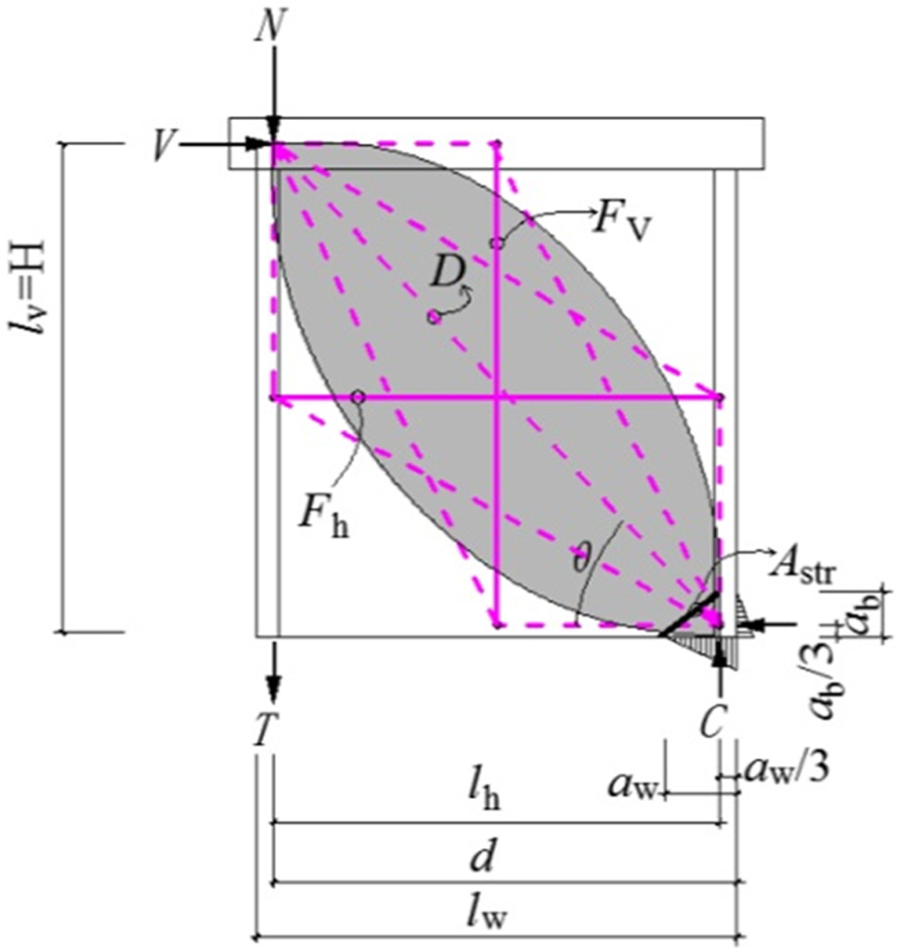
Softened strut-and-tie model proposed by Tu (2005).
The effective area of the diagonal strut Astr is defined as
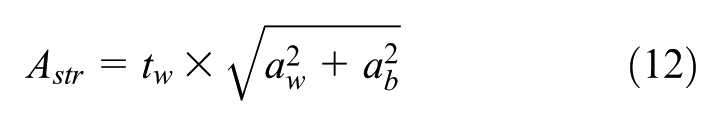
where tw is the thickness of the shear wall; aw is the horizontal height of the compression zone at the bottom of the shear wall; and ab is the vertical height of the compression zone at the bottom of the shear wall, which is defined as
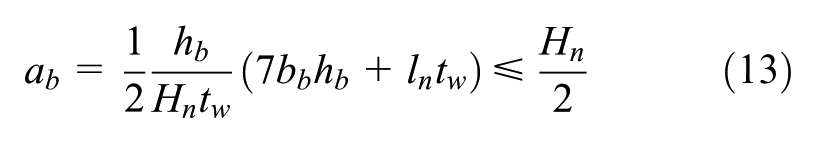
where bb is the length of the boundary element along the width of the wall; hb is the length of the boundary element along the length of the shear wall; ln is the width of the web of the shear wall; and Hn is the net height of the shear wall.
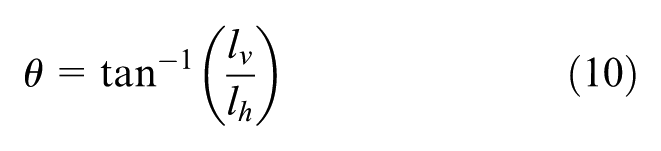
The inclination angle of the diagonal compression strut
However, in this study, the single-row reinforcement recycled concrete shear wall consisted of the mortar layer, the insulation module, and the core concrete shear wall. The three parts can work together to improve the seismic performance of the structure significantly. Hence, the contribution of the “EPS insulation module–mortar layer” to the shear capacity of the composite shear wall system Vm is calculated by equation (15) according to ACI 318-11(American Concrete Institute (ACI), 2011)
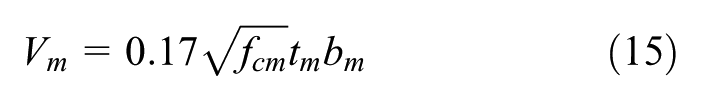
where fcm = 0.8fcu,k is the axial compressive strength of mortar cylinder; fcm,k is the cube compressive strength of the mortar; tm is the total thickness of the mortar; bm = 0.8lw is the effective height of mortar section; and lw is the length of the shear wall along the direction of V.
The contribution of single-row steel bars in shear capacity Vc is calculated by the semi-empirical analysis model proposed by Tu (2005).
Calculation results
Table 12 shows the calculated bending bearing capacity and shear capacity of RAC shear wall specimens, according to equations (2) to (15). Taking the strength stand value of reinforcement, concrete, and mortar layer to calculate the load capacity of the specimens. F is the calculated bending bearing capacity, Vc is the calculated shear capacity of the specimen, and Fmax is the maximum bearing capacity of the experimental results of the four RAC shear wall specimens.
Experimental and calculated results of loading capacity.
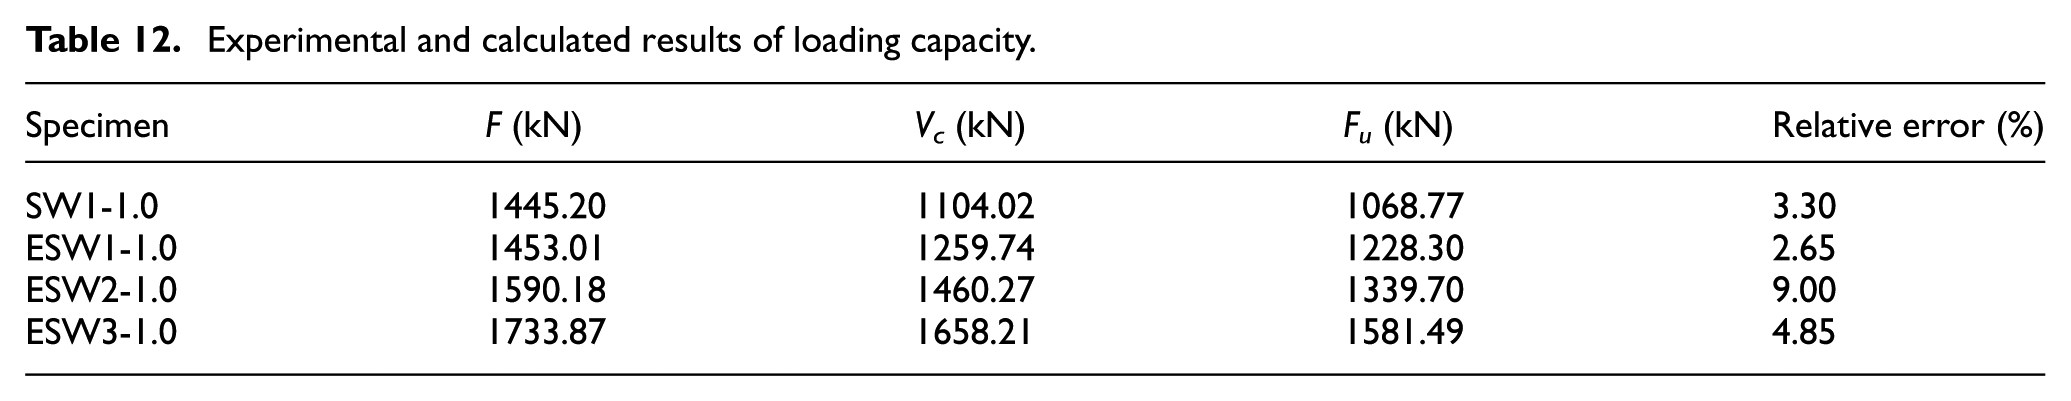
Table 12 shows that the bending bearing capacities are greater than the shear capacities. This is an indication that the walls were mainly failed by shear, which has been verified by the experiment. The calculated shear capacity of four RAC shear wall specimens is in good agreement with the experimental result, which indicates that the methods for determining shear capacity are suitable for predicting the shear bearing capacity of RAC low-rise shear wall with single-row reinforcements and concealed special-shaped columns.
Conclusion
An RAC shear wall with the single-layer reinforcement, special-shaped concealed column, and EPS thermal insulation module has greater load capacity, slower stiffness degradation, better ductility, and significantly higher energy dissipation capacity than an RAC shear wall without the EPS thermal insulation module.
A formula for determining the load capacity of the RAC shear wall is presented. Comparisons of the calculated results with the experimental results show that they are in good agreement.
The strength of RAC has a little effect on the loading capacity of the RAC shear wall. The effect of reinforcement ratio on the loading capacity of RAC shear wall is noticeable. But the seismic performance of the RAC shear wall, such as deformation capacity, ductility, and energy dissipation capacity, can be improved by the RAC strength and the reinforcement of the RAC shear wall.
A single-layer reinforcement RAC shear wall with the EPS thermal insulation module has good earthquake-resistant and energy-saving performance. It is, therefore, suitable for use in low-rise, multistory residential structures in the rural areas. But the ductility of the single-layer reinforcement RAC shear wall is worse than that of the common shear wall with double layer reinforcement.
Footnotes
Declaration of Conflicting Interests
The author(s) declared no potential conflicts of interest with respect to the research, authorship, and/or publication of this article.
Funding
The author(s) disclosed receipt of the following financial support for the research, authorship, and/or publication of this article: This research work reported herein was supported by the National Natural Science Foundation of China (51308011) and Heilong Jiang Postdoctoral Funds for Scientific Research Initiation (LBH-Q15146).