
Abstract
This article focuses on the experimental and analytical investigations of masonry walls surrounded by tie-elements under in-plane loads. The experimental results of an unconfined and a confined masonry wall, tested under reversed cyclic lateral loads, are presented. For numerical study, a micro-modeling strategy, using smeared-crack-based approach, is adopted. In order to validate the numerical approach, experimental test results and data obtained from the literature are used, and through a systematic parametric study, the influence of adjoining walls and number of tie-columns on the seismic behavior of confined masonry panels is numerically assessed and a simple but rational method for predicting the nonlinear behavior of these structures is proposed.
Introduction
Confined masonry (CM) consists of load-bearing walls surrounded by small cast-in-place reinforced concrete (RC) tie-columns and bond beams. It is expected to demonstrate a seismic behavior, similar to RC frames with masonry infill, similar to RC frames with masonry infill; although in CM structures, tie-columns are not load-bearing members and the seismic resistance is not due to frame action.
Since masonry structures are low cost and easy to construct buildings, they have been widely utilized, within the Europe, Asia, and Latin America. However, these structures, in case of improper application or lack of usage of the tie-elements, can be so vulnerable to violent natural forces, such as earthquakes. As witnessed, Iran’s Bam earthquake (occurred in 2003) was a remarkable example of such vulnerability.
Based on local customary construction practices, details of the CM walls were subjected to development over time. Thus, consecutive procedures of design and construction, in addition to empirical, experimental, and analytical studies, led to a comprehensive understanding of the seismic behavior of CM walls. All these progressions paved the way for introduction of the regulations required to overcome the seismic deficiencies which make the load-bearing walls vulnerable.
Seismic behavior of masonry buildings has been evaluated both experimentally and numerically during the past years. A group of masonry walls subjected to dynamically imposed sinusoidal displacement was tested by Umek (1971). The results showed that the vertical tie elements can improve the ductility while they have little effect on lateral resistance. Based on theoretical study of test results of 50 CM wall specimens, Moroni et al. (1994) proposed a nonlinear behavioral curve for CM walls to predict their inelastic behavior. The results of test on five masonry specimens which were confined and reinforced, using different methods, were reported by Alcocer and Meli (1995). This report indicates that confining the masonry panels improves both energy dissipation capacity and ductility. Furthermore, reinforcing the masonry panel with horizontal bars enhances the lateral resistance. Based on experimental results obtained from tests performed on full-scale specimens, Flores and Alcocer (1996) developed a mathematical model to illustrate the nonlinear behavior of CM walls. Furthermore, the effect of horizontal reinforcement was investigated and the results indicated that the structure strength and deformation at lower stories augmented due to horizontal reinforcement. The analytical prediction of the seismic behavior of CM walls was proposed by Tomazevic and Klemenc (1997). In this method, shear capacity of CM walls is calculated by evaluating the interaction forces between tie-element and masonry wall, by considering the dowel action of vertical tie-elements. Bourzam et al. (2008) used the same approach as Tomazevic, but the shear resistance of the lateral reinforcements (stirrups) composed of the tie-column was not neglected in the analytical studies. Nine full-scale CM walls, subjected to alternating and increasing horizontal loads, were tested by Castilla and Marinilli (2003), in order to evaluate the variables such as aspect ratio and gravity load on behavior of CM walls. Based on the available experimental results and a statistical analysis, Riahi et al. (2009) proposed a backbone model for CM walls under lateral in-plane loading. The macro-modeling procedure was adopted by Pourazin and Eshghi (2009), for the evaluation of two experimental CM walls. Moreover, the effect of the vertical stress was analytically investigated.
In this article, in order to investigate the seismic response of CM wall, the experimental results of an unconfined and a CM wall, tested under reversed cyclic lateral loads, are presented. These experimental test results and also other data obtained from the literature are used to validate the adopted numerical approach. The micro-modeling strategy is adopted for the numerical simulation of unreinforced masonry walls (URMWs) confined by RC tie-columns and tie-beams. A nonlinear finite element analysis program called “WCOMD_SJ” was used for this purpose. A modified version of general path-dependent contact density model (Ghiassi et al., 2011) was used to simulate the complicated response of brick–mortar interaction in the mixed mode of shear and axial deformations.
Previous studies mainly focused on the evaluation of the seismic behavior of single CM walls. However, during an earthquake, in-plane resisting force of masonry walls is due to the collaboration of several adjacent walls. In the following, the capacity curves of this kind of structures are numerically investigated and through a parametric study, the influence of adjoining walls and number of tie-columns on the seismic behavior of CM panels are numerically evaluated.
Experimental evaluation
In order to assess the precision of the adopted finite element method and better understanding of the seismic behavior of CM walls, an experimental program was defined. The testing program was composed of a masonry wall without confining elements (URMW) and a CM wall (CMW1). This study is part of a comprehensive program underway to further evaluate the in-plane behavior of the CM walls.
In accordance with Standard No. 2800-14 (2014), CM wall considered for the experimental study consists of masonry wall surrounded by 225 × 200 mm RC tie-columns in each side, together with a top tie-beam, measuring 215 × 230 mm (Figure 1), and also a large 275 × 300 mm cross-section foundation beam. Bricks were nominally 208 mm long, 103 mm wide, and 42 mm high and were solid with no holes. The mix of the mortar used in the wall consisted of cement and sand in the ratio of 1:6. Mean compressive strength of masonry, obtained by testing unreinforced masonry prisms, was 2.82 MPa (with coefficient of variation (COV) = 9%). The concrete used had average compressive strengths of 38 MPa (COV = 3%) and 27.5 MPa (COV = 5%) for the foundation beam and the other confining elements, respectively. As shown in Figure 1, the longitudinal reinforcement of the tie columns and beams consisted of 4 steel bars of 8 mm diameter with yield strength (F y ) of 300 MPa. The foundation was restrained against the horizontal and vertical displacement and the upper beam transfers reversed cyclic lateral loads.
Reinforcement in the RC tie-columns and tie-beams.
The fabrication procedure was started by assembling steel segments and fixing them on a strong base under the specimens. After performing the foundation beams, masonry walls were constructed on RC foundation. In the final step, the RC tie-beams/columns were constructed. Lateral loads were applied using hydraulic jacks on both sides of the wall along the axis of the top beam. The typical cyclic loading sequence adopted for the tests is illustrated in Figure 2. Before the first cracks, the loading procedure was force-controlled and consists of incrementally increasing fully reversed cycles. After cracking, the test was controlled in a displacement control. Each stage of loading consisted of three fully reversed cycles to the selected ductility level.
Loading history.
In addition, gravity loading was statically applied by putting some lead pieces on top of the specimens. Gravity load for all specimens was equal to 2.4 ton. The testing setup is shown in Figure 3.
View of the tests assembly.
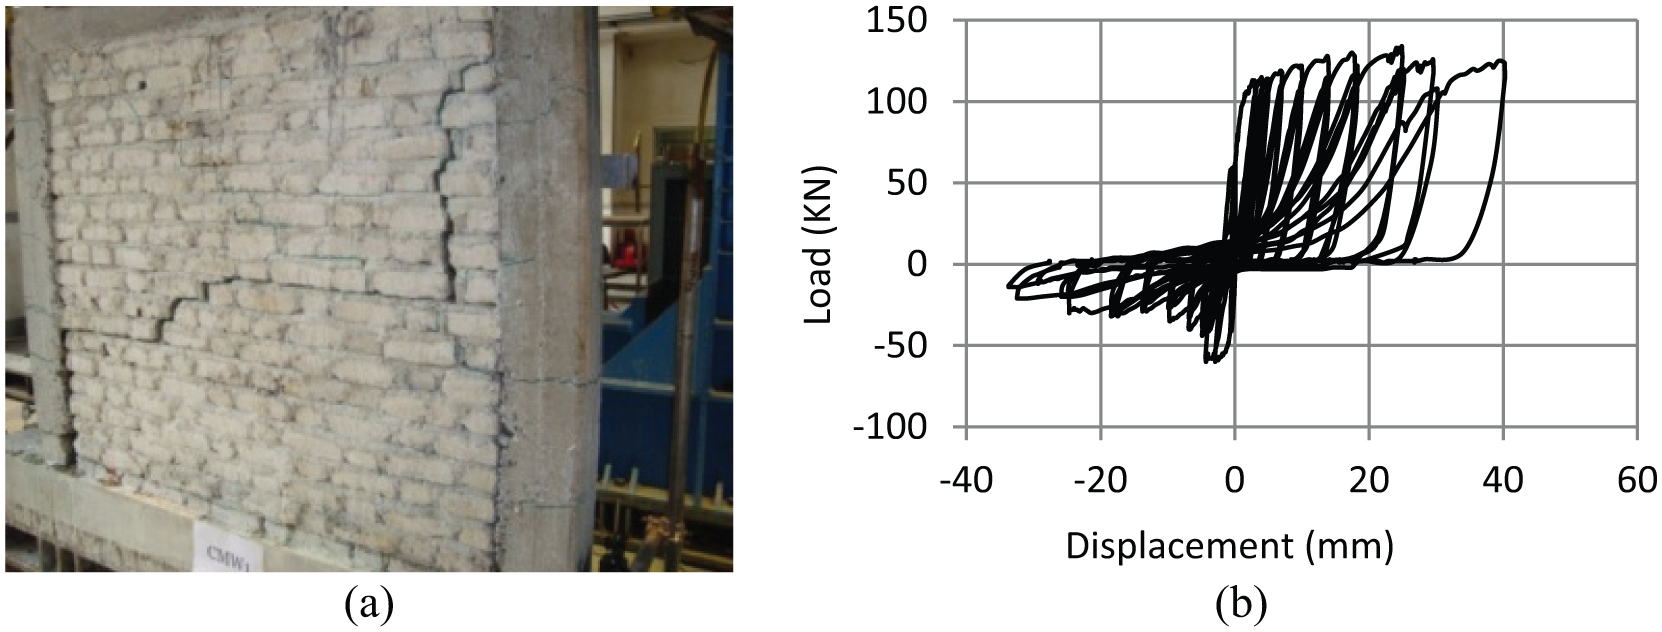
The first experiment was performed on the unconfined sample (URMW) to investigate the effect of confining on the behavior of the masonry walls. In displacement of 0.5 mm, horizontal cracks along the bed joint, immediately above the bottom course, were observed (Figure 4(a)). After initial cracking, while the displacement was increasing, cracks propagated to the second course of bricks above the foundation. No changes in wall resistance were observed after the displacement value reached to 1.2 mm. The behavior mode for specimen URMW was mainly governed by flexural deformations. The hysteresis loops showing the relationship between the lateral load and horizontal displacement for URMW are represented in Figure 4(b). The hysteretic behavior of the specimen is similar to those provided by Magenes and Calvi (1997) and Parisi et al. (2014). The narrow hysteresis loops which led to low energy dissipation were indicated. Another feature is that at the same peak displacement, very limited strength degradation was observed in the subsequent cycles.
(a) Final crack patterns of URMW and (b) measured relations between lateral force and displacement.
The second wall (CMW1) cracked initially in flexure. The first crack was observed in one of the tie-columns, where it was connected to the foundation and the crack propagated rapidly (Figure 5).
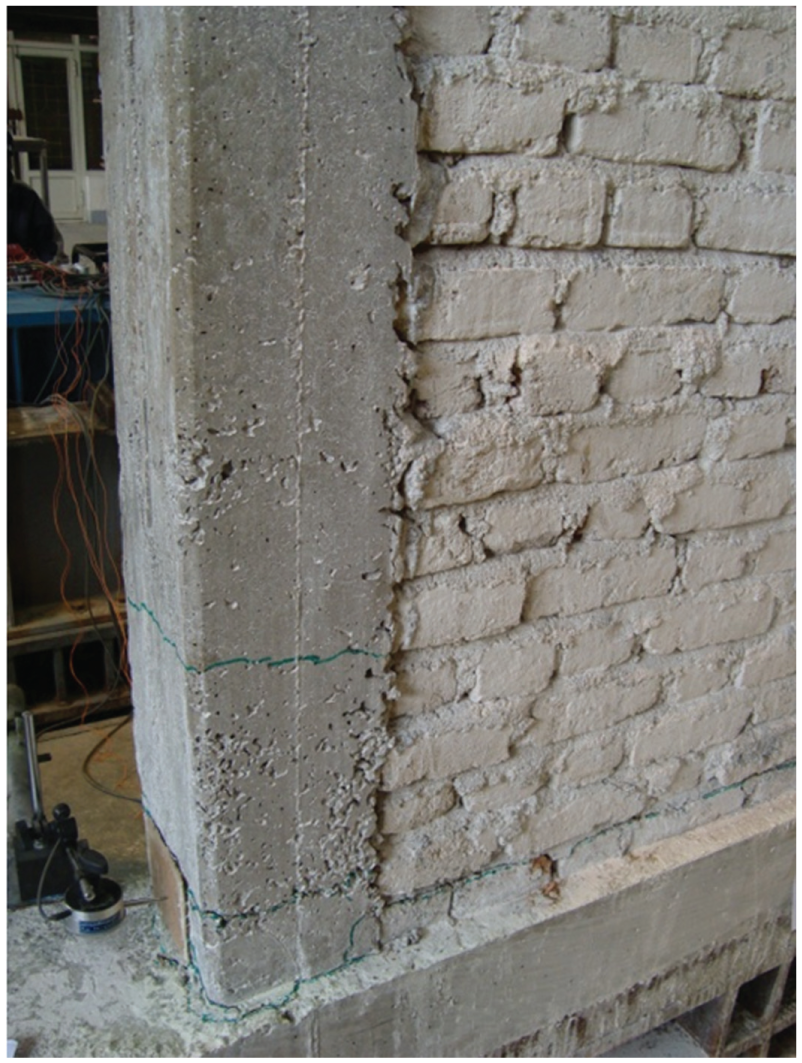
Initial cracks in CMW1.
On the other side of the wall, only small cracks were observed on tie-column. One of the bars failed when the tie-column was being separated from the foundation beam. As a result, during the loading cycles, a severe strength downfall occurred along the direction in which the damaged side of the specimen was stretched. In the next step, several cracks expanded in the first course of the bricks and extended toward the other side of the wall. By augmenting the load, diagonal cracks developed to the intersection of tie-columns/beams. Crack patterns and hysteresis loops are shown in Figure 6.
(a) Final crack patterns of CMW1 and (b) measured relations between lateral force and displacement.
The backbone of hysteresis loops of the tested walls was compared as shown in Figure 7.
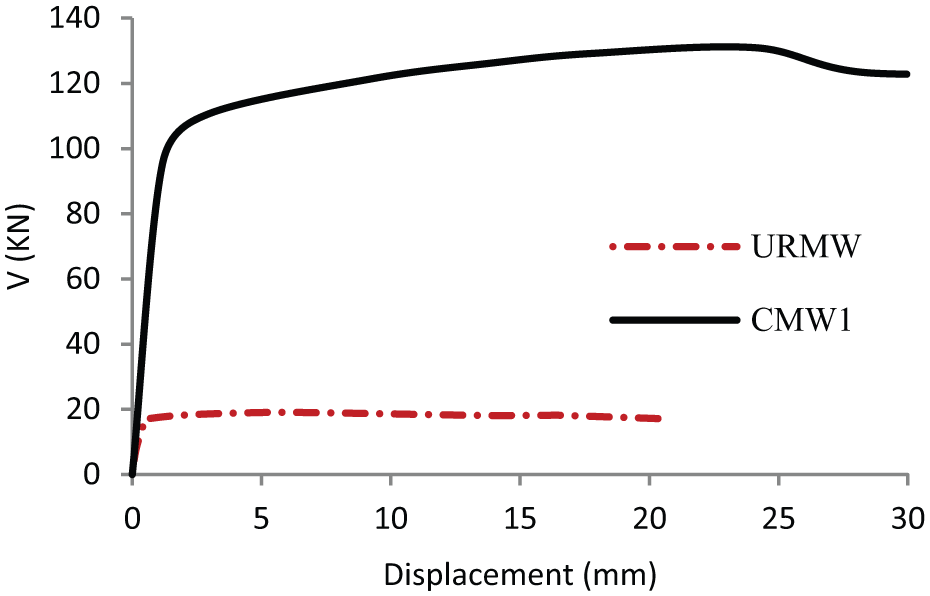
Experimental capacity curves.
Based on the results of the experiments, although confining element has little effect on initial stiffness of masonry wall, it increased both the ductility and maximum strength. In the next phase, a modified triplet specimen, designed for examining pure shear strength, was used in order to obtain the mortar shear strength and friction coefficient. The average values of angle of friction (ϕ) and coefficient of cohesion (c) from eight samples were obtained when they were loaded up to failure using various constant compression forces together with increasing shear forces. Based on the results derived from experimental data, the average value of cohesion coefficient and angle of friction was equal to 0.23 MPa and 36.4°, respectively (Figure 8).
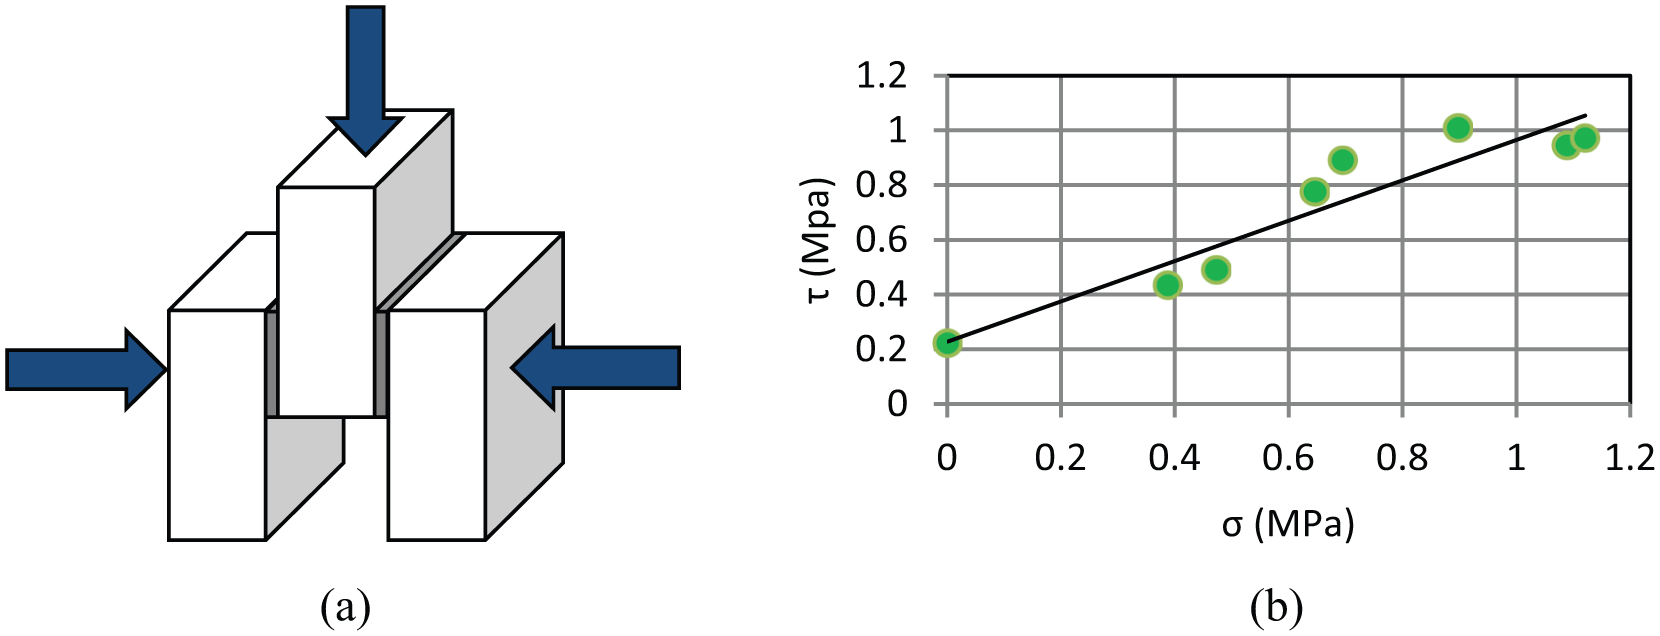
(a) Shear test setup and (b) relation between shear and vertical compressive stress.
Numerical modeling approach
In general, two main approaches known as micro-modeling and macro-modeling are usually used for simulating the nonlinear behavior of masonry structures. Micro-modeling includes the representation of bricks, mortar, and brick/mortar interfaces and is used in detailed or simplified form (Ghiassi et al., 2011). Despite the adopted modeling approach, suitable material constitutive models capable of capturing all the possible failure modes in masonry such as tensile cracking, shear sliding, and diagonal tension cracking should be used.
In this article, the micro-modeling strategy has been adopted for numerical study. It includes planar elements for continuum modeling of masonry blocks and RC members and also joint elements for modeling of bed and head mortar joints and interfaces between RC members and masonry wall (Figure 9).
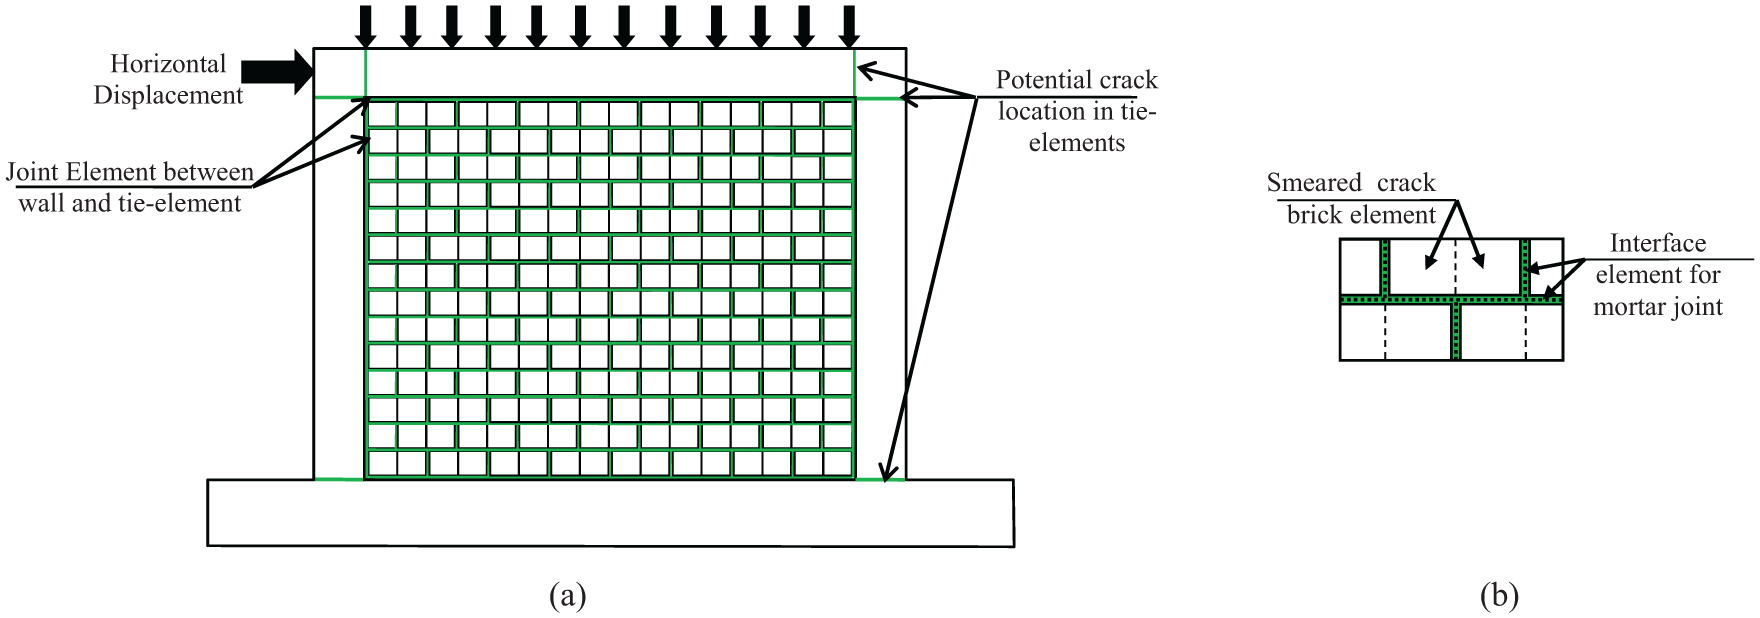
(a) Finite element model of confined masonry wall and (b) micro-modeling of masonry.
For planar elements, the smeared crack approach was used for modeling the post-cracking behavior, considering masonry and RC as orthotropic homogenous materials and taking into account all stress transfer mechanisms in average state. The smeared crack approach was successfully used by several researchers in the case of unreinforced masonry structures (Magenes and Calvi, 1997; Parisi et al., 2013; Yi et al., 2006). Using this approach, the complex crack propagation in RC elements and masonry units and also yielding of reinforcing bars are precisely simulated. The possible failure modes have been considered in the analysis by adopting suitable material constitutive models and failure criteria in biaxial stress states. In order to take into account the shear sliding and opening of the joints between masonry units and also along with interface of masonry wall and RC tie-elements, discrete crack modeling has been adopted using joint elements.
The finite element program “WCOMD_SJ,” which has originally been developed at the University of Tokyo for modeling and analyzing the RC, is used as the basis for modeling and analyzing in this article. Local bond stress transfer along reinforcing bars, shear and dilatancy stresses transfer through aggregate interlock on crack planes, bridging stress (softened tension) transfer across rough crack, dowel action and kinking of reinforcement at a crack location, stress transfer of concrete parallel to cracks (compressive stress in struts), softened compression of concrete due to coexisting transverse tensile deformation, and compressive damage localization between cracks, are some stress transfer mechanisms which control the structural nonlinearity of RC structures. To numerically simulate such a complex nonlinearity, the multi-directional fixed smeared crack approach, implemented in the program, is used (Figure 10) (Maekawa et al., 2003; Soltani et al., 2005).
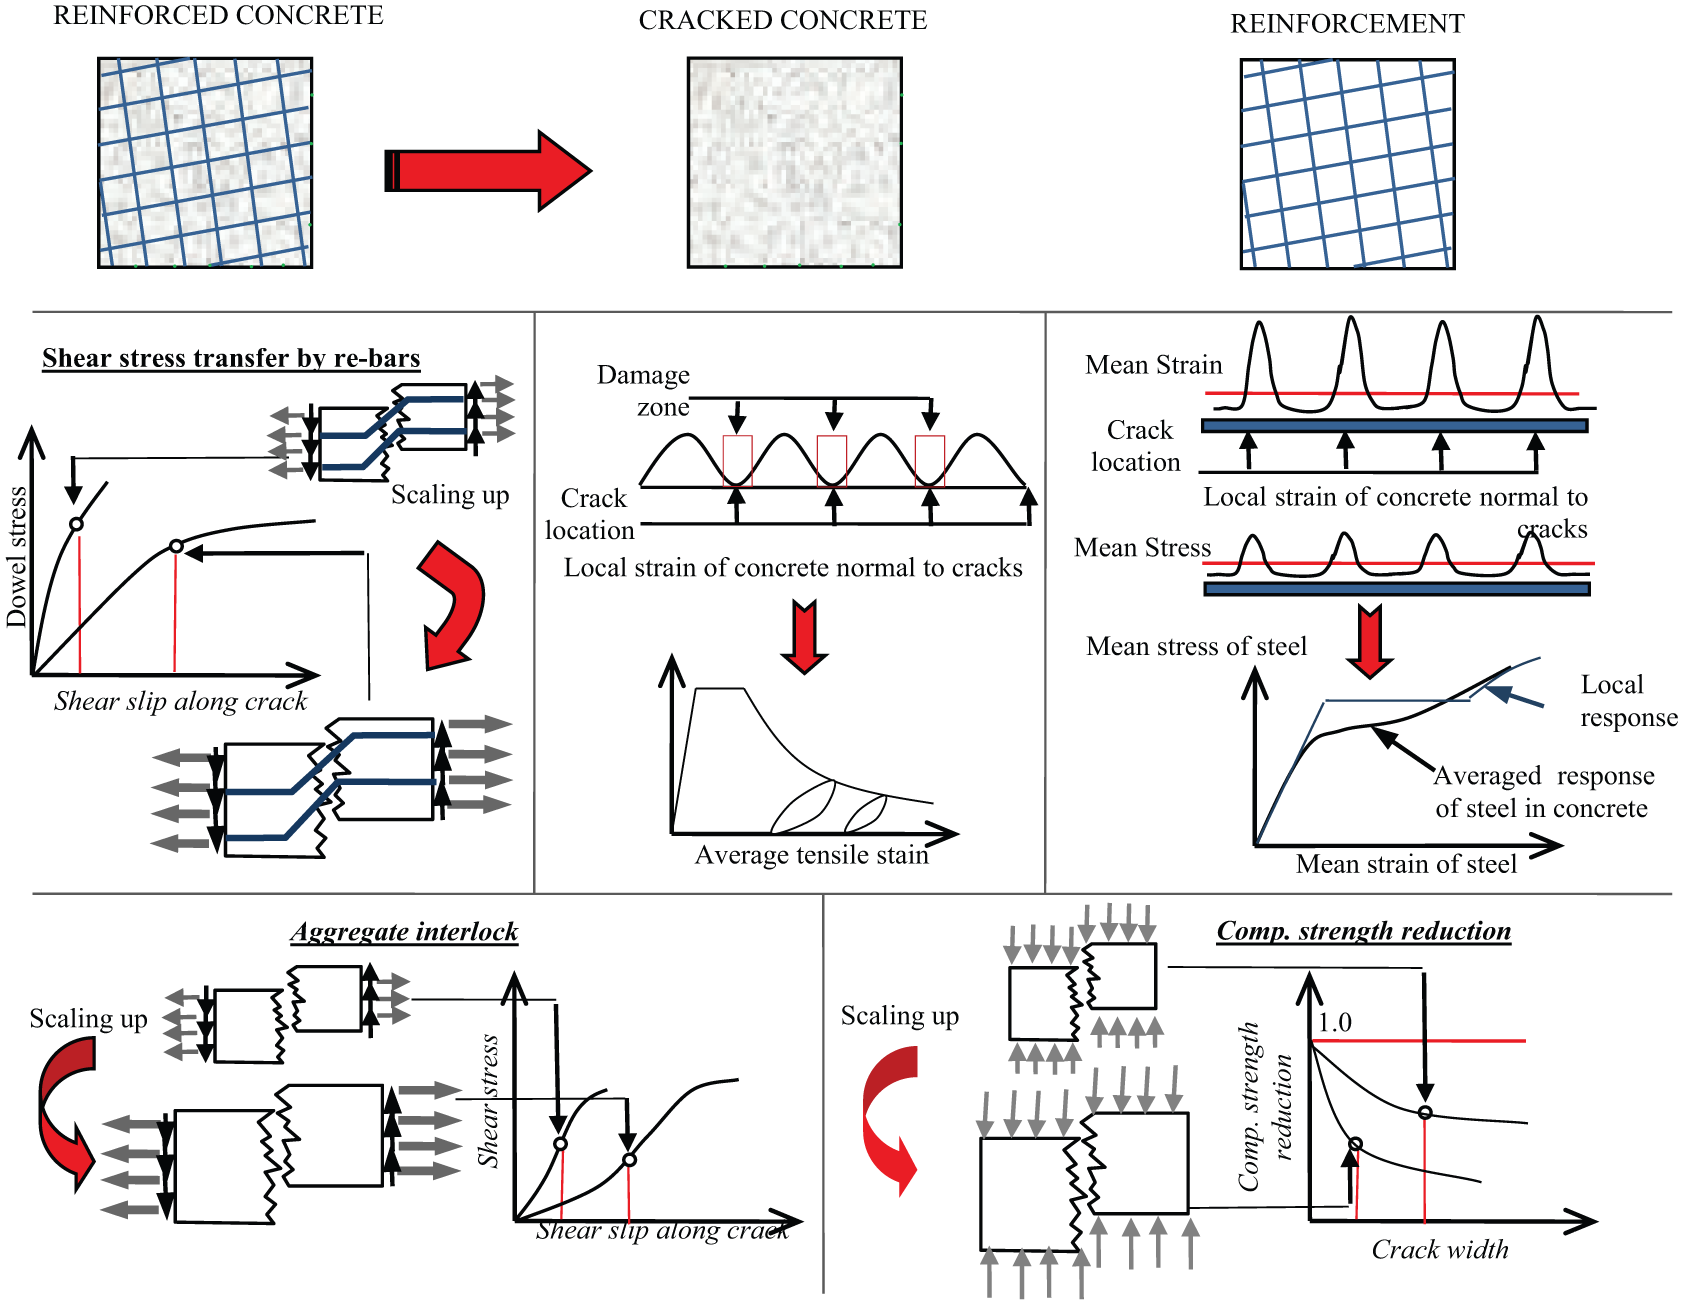
In-plane stress transfer mechanism in RC domain and its size dependency (Soltani et al., 2005).
For numerical modeling of masonry structures, some modifications, proposed by Salehi (2006) and Ghiassi et al. (2011), have been implemented into general path-dependent contact density model to simulate the complicated response of brick–mortar interaction in a mixed mode of shear and axial deformations. Interested readers are referred to Ghiassi et al. (2011) for more information.
For modeling the masonry walls and RC elements, eight-node quadrilateral plane stress elements, along with six-node interface elements with zero width, were employed in places with the most probable detachment. The specifications of these elements are determined based on the material of the area where the elements are used. With the observed damage in past earthquakes, it can be said that the connection of tie-columns with foundation and tie-beams and also the junction of the border of the masonry wall with tie-elements are the most susceptible locations that may be cracked during the earthquake. To simulate the applied forces to experimental specimens, the wall in addition of its self-weight was subjected to a vertical uniform horizontal distributed load and also a monotonically augmenting horizontal force was being applied to the top flange, under displacement control (Figure 9).
Comparison between the numerical and experimental results
For verification of the presented numerical approach, the experimental results of previous section and also experimental results of other researches were numerically simulated. The comparison between the load–displacement curves and failure modes obtained from finite element models and the experiments is presented in this section.
The numerical load versus displacement curve and the graphical results for two experiments tested in this study are presented in Figure 11. The comparison between experimental and analytical results demonstrates a good correspondence between the findings of the two methods.
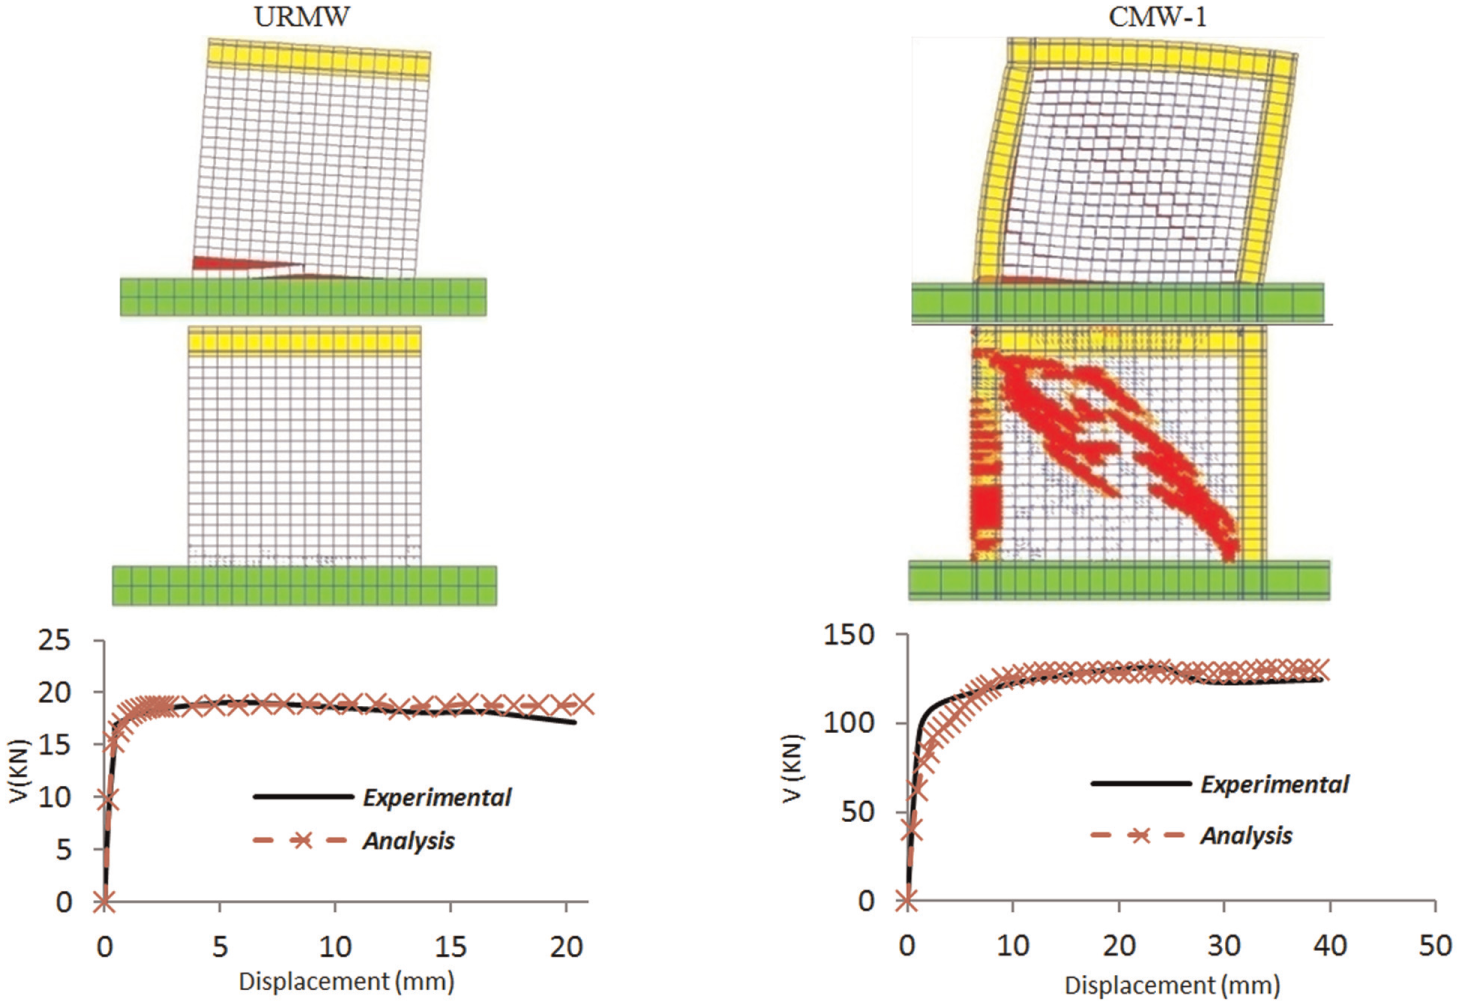
Deformation shape and crack pattern of analytical models and comparison between capacity curves.
The numerical model of URMW cracked mainly in flexure. Increase in displacement causes the wall to separate right from the above of the bottom course. In CMW1, initially, due to small vertical loads, the cracks occurred at the bottom of the wall and then stepped diagonal ones appeared in the middle of it. By augmenting the displacement, the crack propagated to the corner of the tie-elements (Figure 11). As shown in Figure 11, the same behavior of experimental samples was observed in the analytical models.
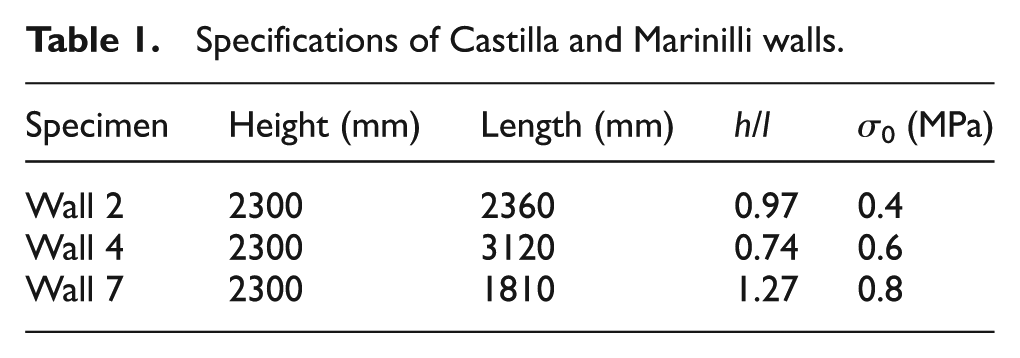
For further investigation and gathering of more information for parametric study, some other experimental studies are represented in the next part. In order to confirm the accuracy of the results, some laboratory specimens of Castilla and Marinilli (2003) were studied. The average strength of the concrete used in tie-elements was equal to fc = 36 MPa, and yield point of employed steel bars in the walls was fy = 420 MPa. Also, the average compressive strength of bricks was fp = 13.5 MPa. The dimensions of confining tie columns and beams were equal to 150 × 150 mm and 150 × 200 mm, respectively. The confining columns and the top beam were reinforced with four (4) No. 4 bars. Specifications of the walls are summarized in Table 1. The capacity curves obtained from numerical studies are compared with experimental results in Figure 12.
Specifications of Castilla and Marinilli walls.
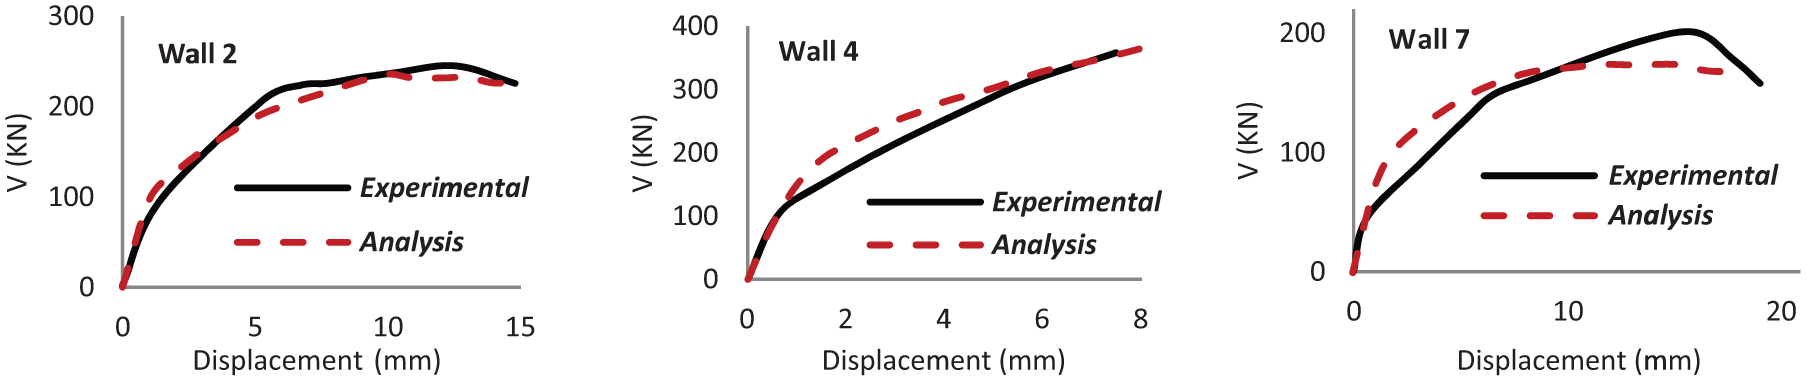
Comparison between experimental and numerical backbones for conforming specimens (Castilla and Marinilli, 2003).
Influence of adjoining walls on in-plane seismic behavior
In the past studies, mostly, seismic behavior of single CM walls was assessed. But, during an earthquake, in-plane resisting force of masonry walls is due to the collaboration of several adjacent walls. Therefore, in this part of study, the influence of adjoining walls on the behavior curve was investigated. For fulfilling this purpose, analytical model of Castilla and Marinilli (2003) experiments, which has been mentioned in previous section, was utilized. The current investigation is composed of two groups of models: first, those which were generated from two numerically modeled walls and second, models produced from three numerically modeled walls. At first, specimens Wall 2 and Wall 4 were joined together (model a) and next, in the other model, the intermediate tie-column was eliminated (models b and c). All specimens were subjected to a vertical stress equal to σ = 0.4 MPa and lateral loading was applied to top tie-beam. Crack pattern and pushover curve of each model are presented in Figure 13. In model “a” due to a better confinement, cracks propagated in a wider area of the wall than model “b.”
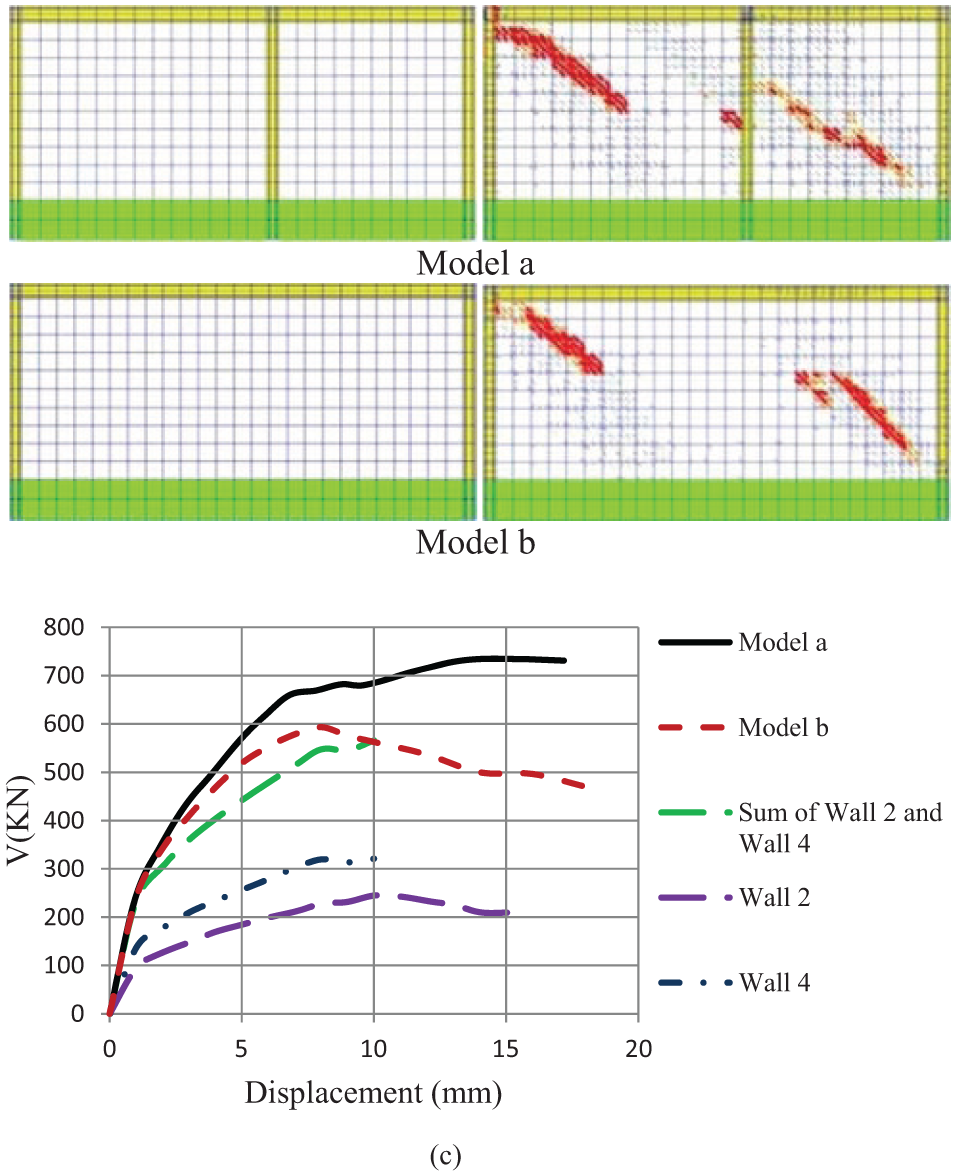
Analytical models generate from Wall 2, Wall 4 and comparison between pushover curves of numerical models. Model a: with intermediate tie-column and model b: without intermediate tie-column (σ = 0.4 MPa for all models).
In the second group of models, first, three consecutive walls (Wall 2, Wall 4, and Wall 7) were joined to each other using intermediate tie-columns. Then in three different models, one or both of the tie-columns were omitted. In all three models, the same vertical stress equal to σ = 0.4 MPa was applied. As shown in Figure 14, by increasing the number of tie-columns, the cracks spread in a considerably wider area of the surface of the walls.
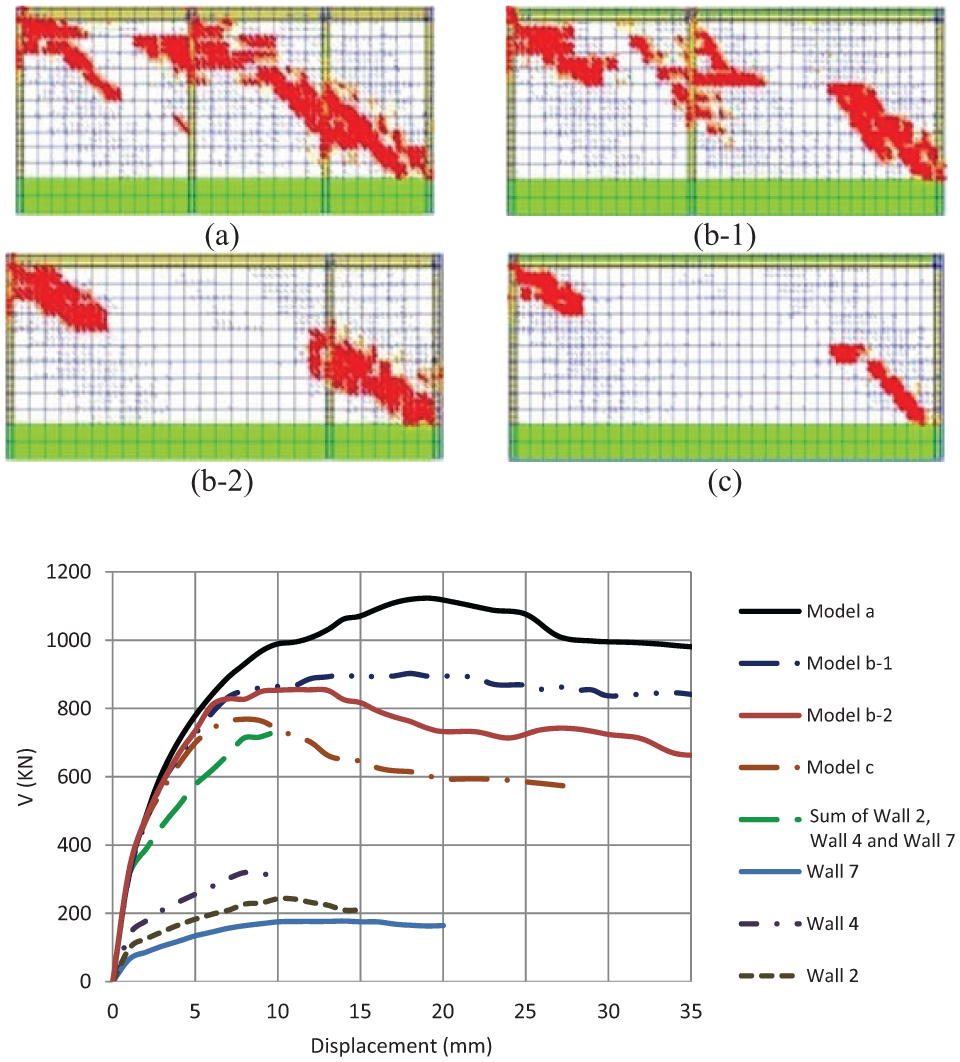
Cracks pattern and comparison of pushover curves in analytical models made of Wall 2, Wall 4, and Wall 7 (σ = 0.4 MPa for all models).
As shown, the numbers of confined elements greatly influence both strength and ductility of the specimens. Limited strength degradation (due to more crack propagation) in Model b-1 as compared to Model b-2 indicates that the location of the intermediate column has a great effect on the behavior curve of the CM wall; however, it has no effect on the behavior curve before reaching the ultimate strength. The strength of the specimen before crack initiation can be predicated by summation of strength in crack point of each separate wall; in other words, confining elements had no effect on behavior curve before the first crack is observed. Also, it is evident from the experimental and analytical results that ductility can be significantly improved by confining the masonry walls.
Based on the obtained results from different analytical models, a simple rational model for the behavior curve of adjoining walls is proposed. In URMWs, compressive stress is mainly due to gravity loads, whereas in CM additional compressive stress would be developed due to interaction forces between tie-elements and masonry panel. By considering the effect of these interaction forces, Tomazevic and Klemenc (1997) proposed following equation to predict the maximum shear capacity of CM walls
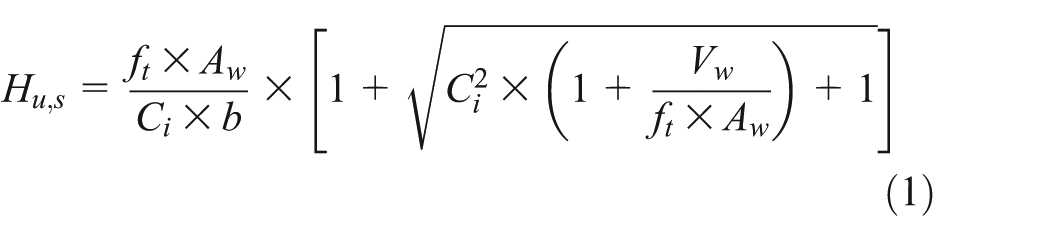
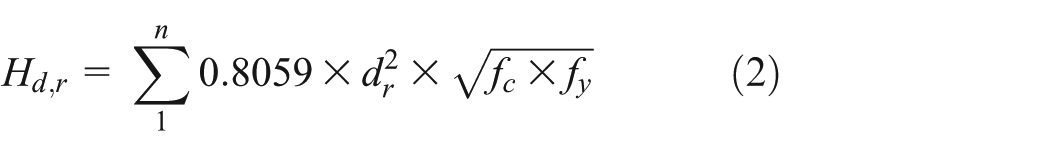

where Hmax is the maximum shear resistance of the wall, ft is the tensile strength of masonry, b is the shear stress distribution coefficient, Aw is the area of the horizontal cross section of wall, Ci is the interaction coefficient, Vw is the compression force due to imposed vertical load, dr is the diameter of reinforcing bar, fc is the compressive strength of concrete, fy is the yield stress of reinforcing steel, Hus is the lateral resistance of CM wall, and Hdr is the resistance due to dowel action of vertical tie-elements bars.
As illustrated in Figure 15, these equations are capable of predicting the behavior curve of CMW1 wall reasonably well.
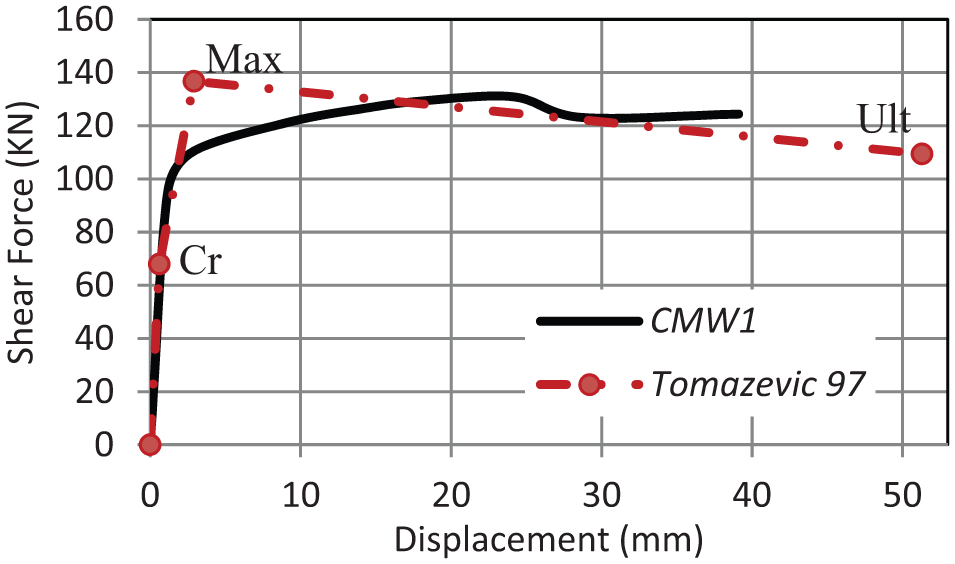
Comparison between trilinear model proposed by Tomazevic and experimental result of CMW1.
According to the results, adjacent walls increase the interaction effect between tie-columns and masonry panel. To consider this effect, both vertical and horizontal interaction forces in abovementioned formula are simply modified, by a factor which is indicated as β. By rewriting equation (1), the following statement for shear resistance of wall is achieved
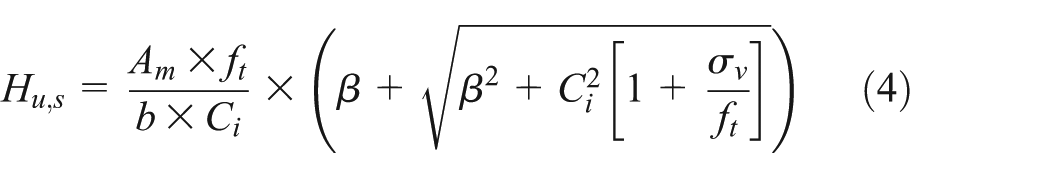
In order to achieve a reliable relation for β, different analytical models with adjoining several masonry walls were numerically simulated and the effects of some parameters such as the length of adjacent walls along with applied compressive stress were studied. Some examples of these investigations are represented in Figure 16. The proposed model for β has been developed on the basis of obtained results of extensive numerical models and through an iterative linear regression analysis. In Tables 2 and 3, the validity of proposed model for β in calculating the maximum shear resistance of walls is evaluated for two numerical models
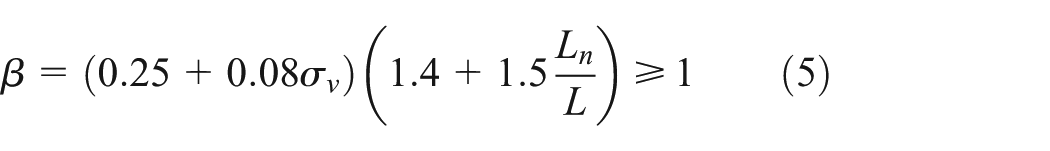
where Ln is the total length of adjacent masonry walls, L is the length of the wall for which the shear resistance is calculated, and σv (kg/cm2) is the compressive stress due to gravity loads.
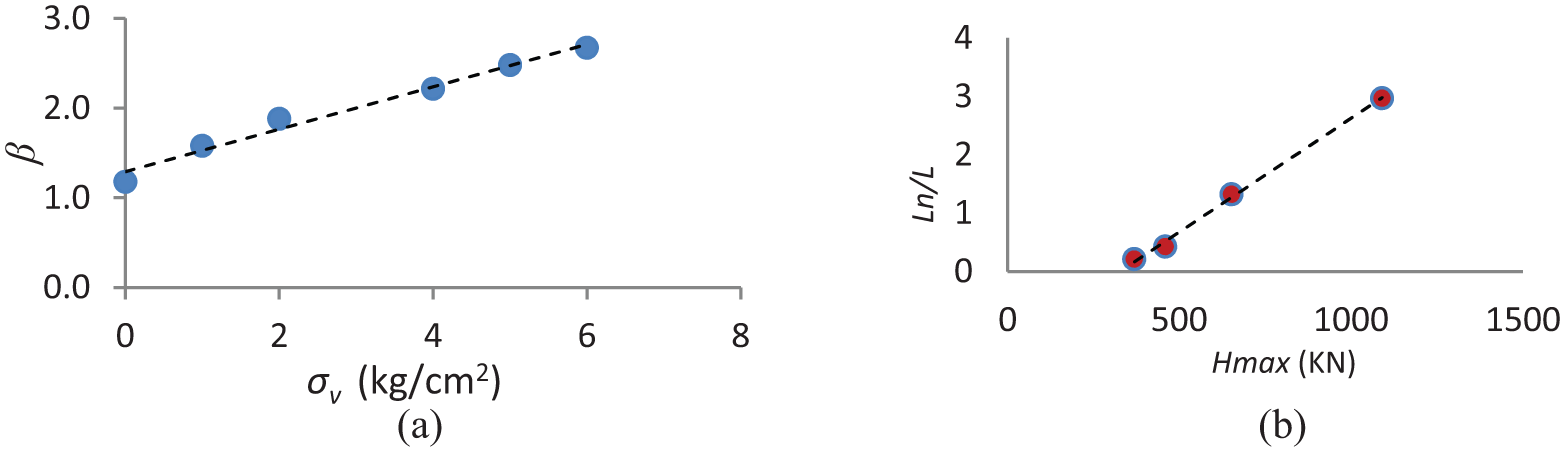
(a) The correlation between compressive stress and β (calculated from model a in Figure 13) and (b) investigating the effect of adjacent walls (calculated from models constructed with several walls with different lengths adjoined to specimen Wall 2 from Castilla and Marinilli).
Comparison of behavioral between analytical model and proposed trilinear model for two adjoining walls.
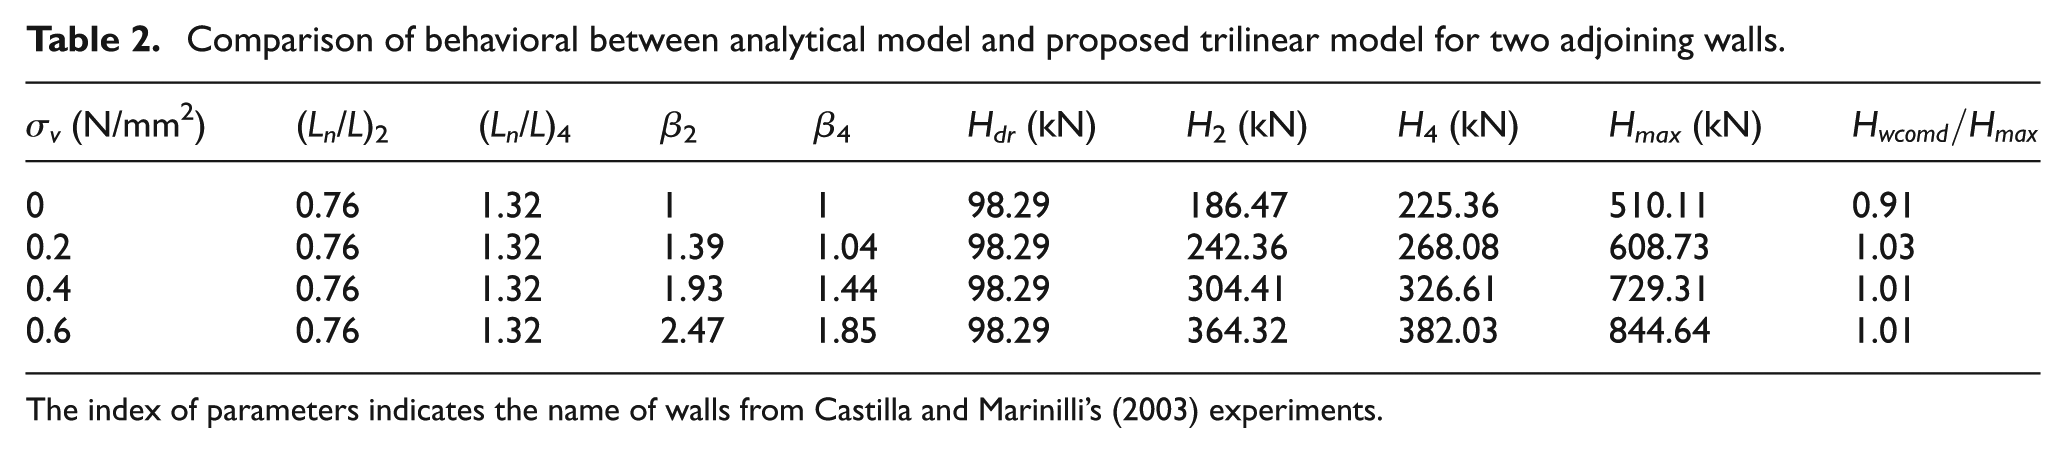
The index of parameters indicates the name of walls from Castilla and Marinilli’s (2003) experiments.
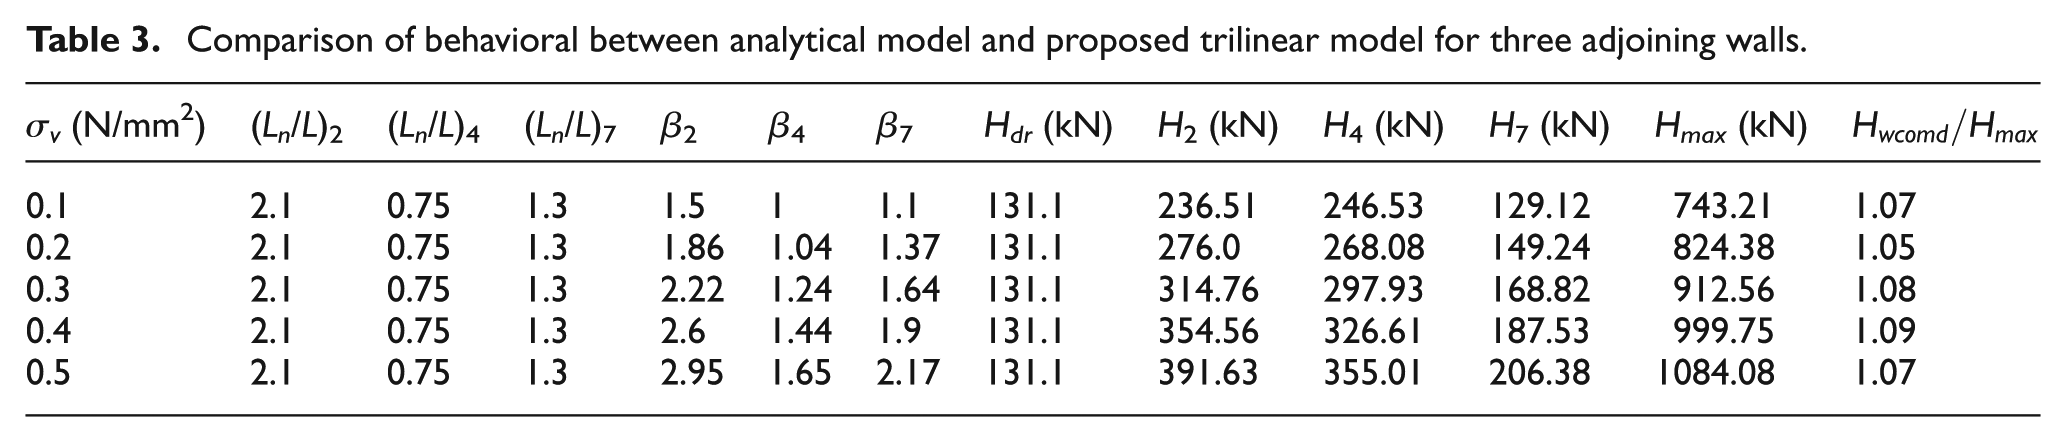
Comparison of behavioral between analytical model and proposed trilinear model for three adjoining walls.
The resistances of the CM wall before occurring crack (Hcr), ultimate limit of resistance (Hdmax), and the second stiffness (K) are defined as follows


Based on a work by Tomazevic and Klemenc (1997), Ccr is between 0.7 and 0.8 and Id (damage index) is considered 0.25, 0.5, and 1 for crack limit, maximum resistance, and ultimate state, respectively. Csr is assumed equal to 0.8 according to Riahi et al. (2009). In Figure 17, the required parameters to draw trilinear model are presented.
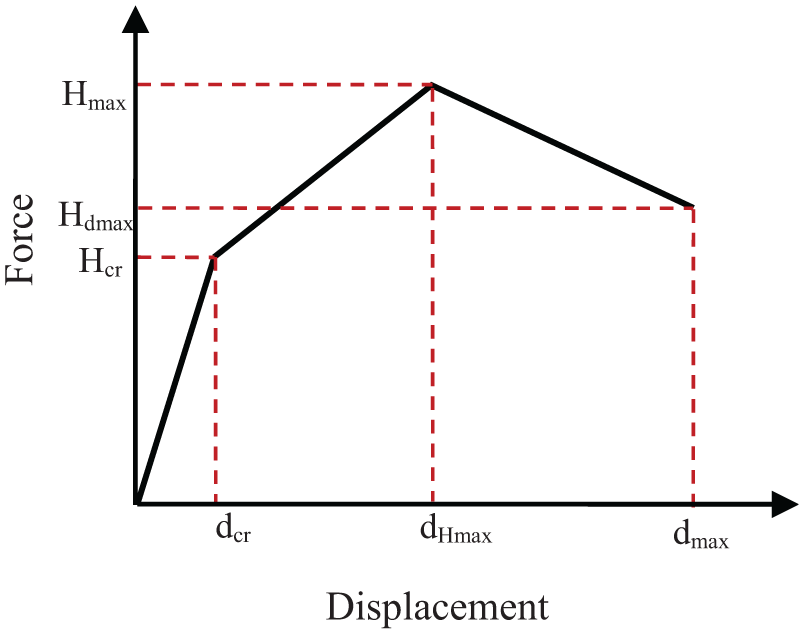
Trilinear model for adjoining CM walls.
For achieving maximum resistance of adjoining walls, the resistance of each wall is calculated with these equations and then added together. In order to assess the proposed model, two adjoining walls mentioned in the first part of this section are taken into consideration. First, the behavior curve of two adjoining walls, with different values of gravity loads is investigated. In Table 2, results of both numerical and calculated values are compared. Comparison between analytical model and proposed trilinear model is shown in Figure 18, where Hwcomd is calculated from finite element approach and Hmax is calculated from proposed model.
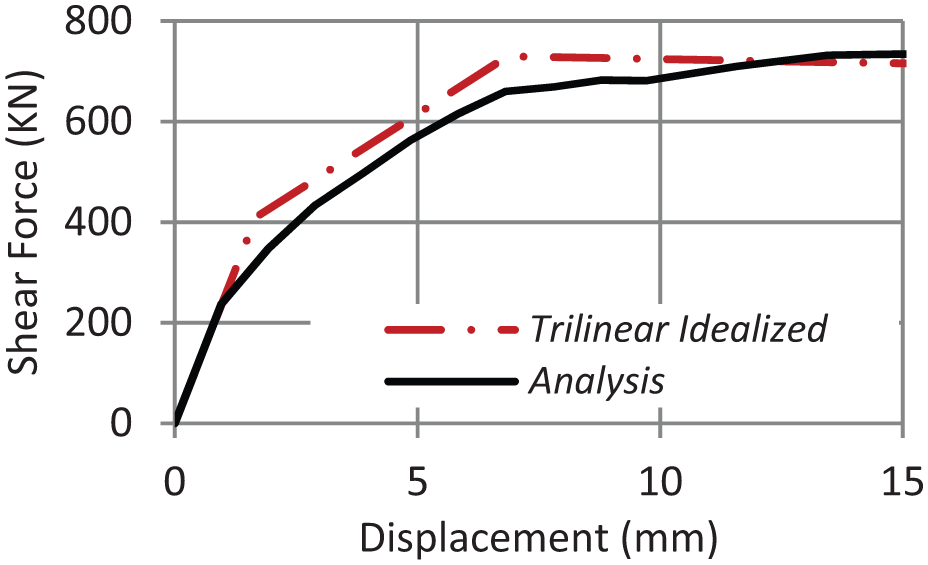
Trilinear model for adjoining two walls (for σv = 0.4 MPa).
Same calculation is done for three adjoining walls; the trilinear idealized model is compared with the numerical model in Table 3. Figure 19 shows the comparison between analytical model and proposed trilinear model.
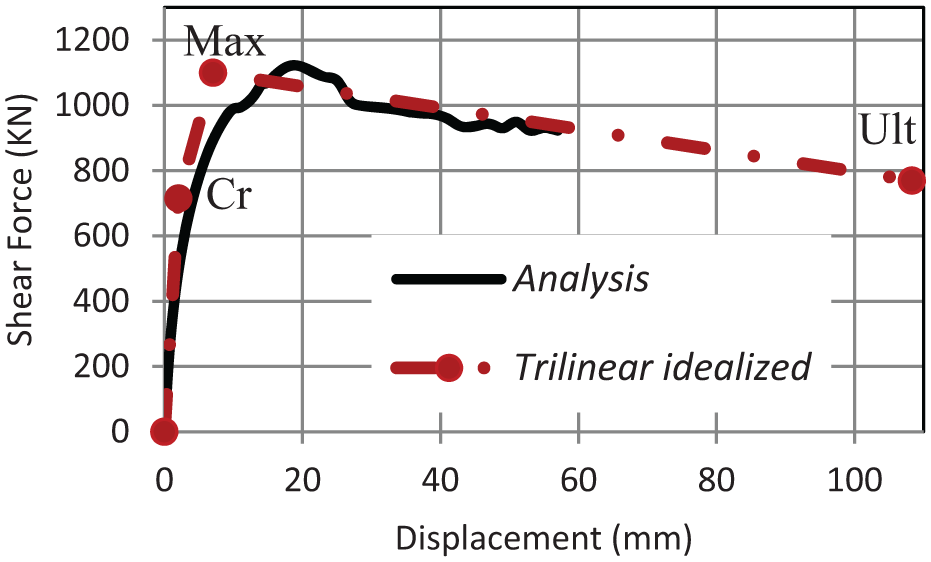
Trilinear model for three adjoining walls (for σv = 0.5 MPa).
Conclusion
This study was carried out in order to evaluate the seismic behavior of CM walls, by testing a number of confined and unconfined masonry walls, under seismic loading conditions. Moreover, the micro-modeling strategy was adopted for the numerical simulation of URMWs confined by RC tie-columns and tie-beams. In order to validate the analytical approach, experimental test results and data obtained from the literature were used. The comparison between experimental and analytical results showed good agreement between them. Then, through a parametric study, the interaction effect of adjacent walls on the lateral response and strength of CM walls were numerically investigated. Based on the analytical study, it can be outlined that
Before initiation of the first crack, the behavior curve of adjoining walls can be predicted by summation of each separate walls and the effect of intermediate columns is negligible.
After crack occurs, additional compressive stresses are developed between masonry walls and tie-elements. Interaction between adjacent walls causes an increase in confining force on masonry panel and this in turn leads to increase in the amount of both maximum and ultimate resistance of CM walls.
The obtained results indicate that intermediate tie-columns greatly increase the strength and ductility of the specimens.
Finally, a simple rational method was proposed in order to predict the backbone model of adjoining walls.
Footnotes
Acknowledgements
The writers greatly acknowledge Professor Koichi Maekawa at Civil Engineering Department of The University of Tokyo for supporting this study by providing the WCOMD software.
Declaration of Conflicting Interests
The author(s) declared no potential conflicts of interest with respect to the research, authorship, and/or publication of this article.
Funding
The author(s) received no financial support for the research, authorship, and/or publication of this article.