
Abstract
Spliced joints are used widely in retrofitting traditional timber structures, especially in heritage conservation applications where as much original material as possible needs to be retained. However, in practice this method is mainly applied based on experience, and there is a lack of understanding and quantification of the mechanical behaviour of retrofitted timber members. This article presents an experimental study on the axial compression behaviour of splice-jointed timber columns. The splice joints are reinforced by steel jackets, steel jacket with adhesive, ear hoops and carbon fibre–reinforced polymer wrapping, respectively. The performances and effect among these enhancement methods have been compared based on the failure modes and deformation, stiffness and strength measurements. The results show that the load-bearing capacity of the spliced columns reinforced with steel jacket and further enhanced by epoxy adhesive could recover about the full capacity of the reference columns. The load-bearing capacity of the retrofitted columns reinforced by ear hoops could reach 91% of the reference specimens. The weaker rigidity of the carbon fibre–reinforced polymer joints tends to affect negatively the loading capacity of the retrofitted columns.
Keywords
Introduction
In historical timber buildings, components such as columns and beams often suffer from damages near the end of the members due to various reasons related to ageing, such as material decay, biological corrosion, to name a few (Figure 1(a)). As a retrofitting option, the damaged portion can be removed and splice joints are sometimes used to connect new replacement part to the original part while keeping as much the original material and elements as possible (Figure 1(b)). This method together with circular steel bands/hoops is widely used to repair timber columns in China (GB50165-92, 1992; Xie, 2007; Xu, 2012). However, this method is generally considered to be suitable only for the axial compression part of a damaged column, and the maximum height to which the lower part may be replaced and spliced is strictly limited; the Chinese code (GB50165-92, 1992) specifies the maximum height for splice retrofit as one-fourth of the column length. If the damaged lower part is beyond this length, the entire column member would unfortunately have to be replaced with a new column member. The possibility of any relaxation to the above restriction would obviously depend on more reliable splice techniques and their demonstrated performance under a combined axial load and bending conditions.
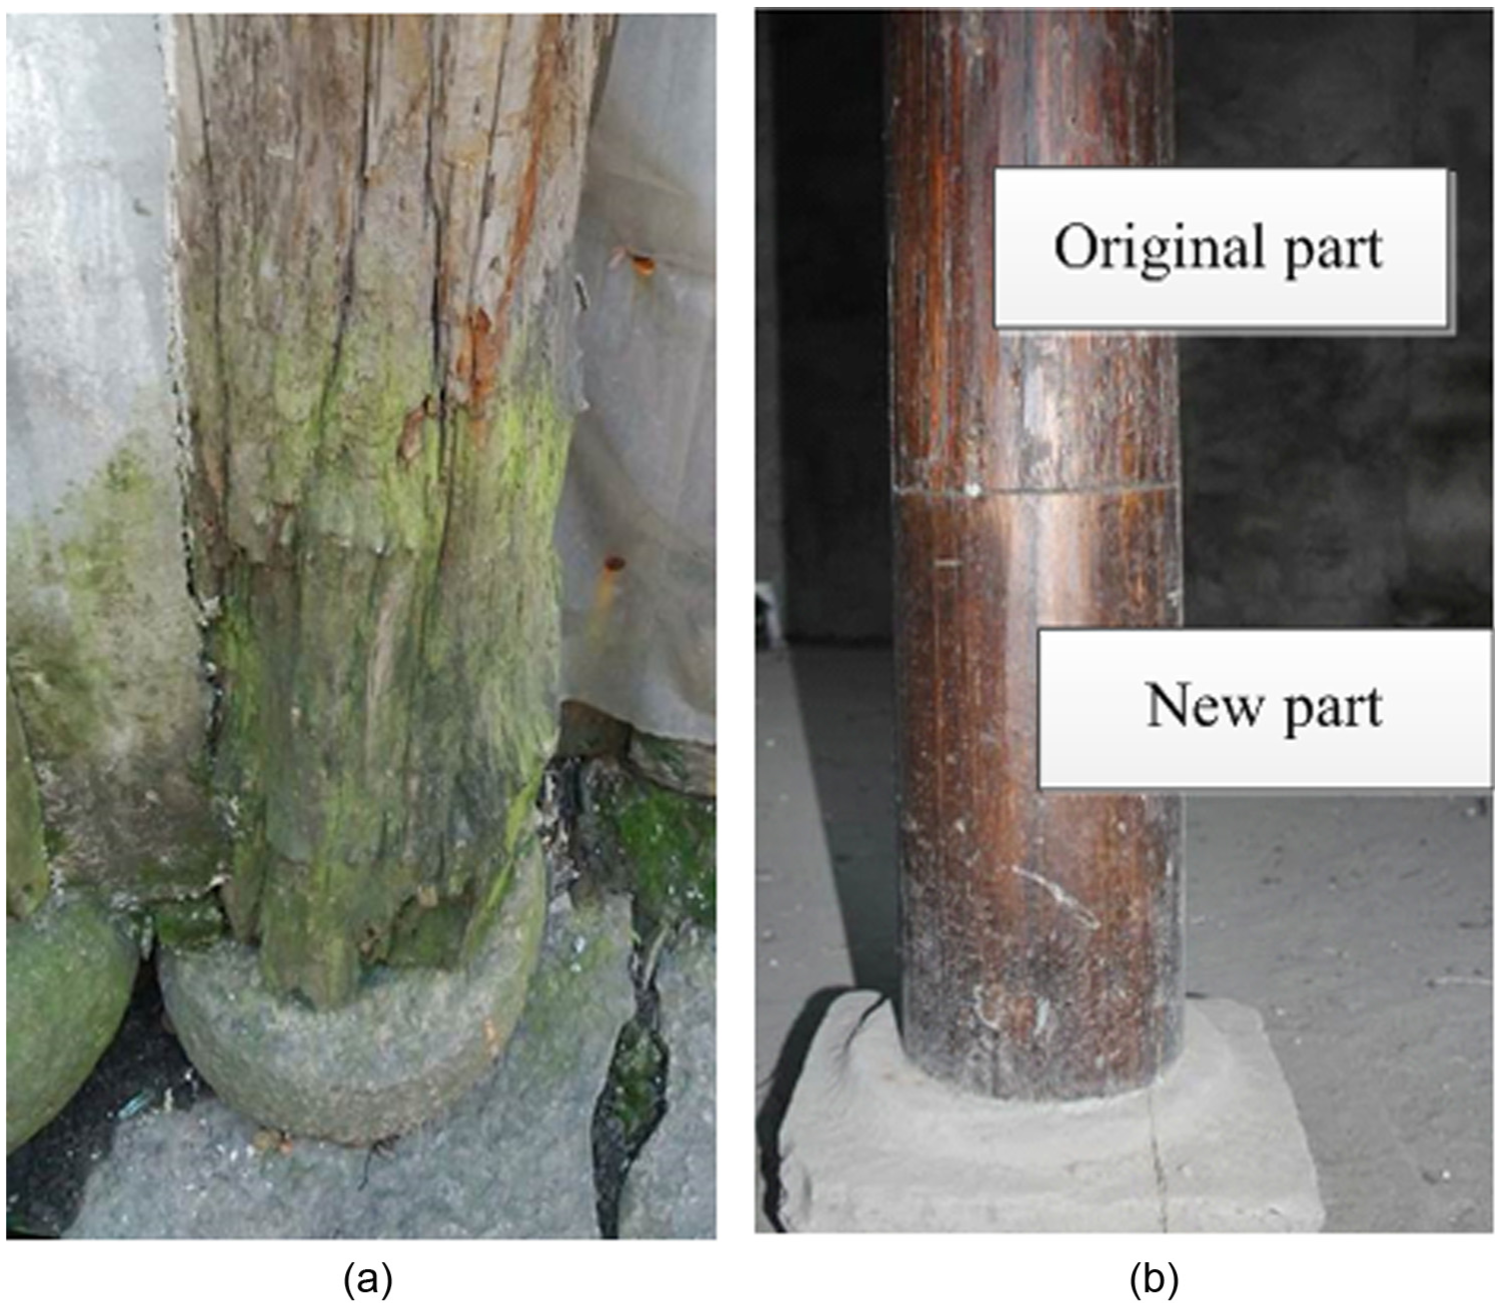
A timber column with a damaged bottom part before and after retrofitting: (a) corrosion and cracks at bottom of column and (b) retrofitted condition.
The spliced joint is also limited to be placed up to one-third of the beam span from the support (Arciszewska-Kędzior et al., 2015). The flexural performance of different spliced joints was investigated by many scholars for retrofitting applications in beams. Sangree and Schafer (2009a, 2009b) took experimental and numerical analysis on bending mechanics of a halved and tabled traditional timber scarf joint, while Arciszewska-Kędzior et al. (2015) focused on the lapped scarf joint with inclined faces and wooden dowels. Caldeira et al. (2014), Dorn et al. (2013), Santos et al. (2009), Schoenmakers and Jorissen (2011) and Xu et al. (2009) studied the mechanics and failure mode of dowel-type timber connections. Xu et al. (2012, 2013) analysed the bending performance of timber connections with glued-in rods and rounded dovetail connection. Koch et al. (2013) discussed the multi-mode failure of form-fitting timber connections. For the aforementioned reasons, the splicing method in columns has attracted more research attention in more recent years. Xie (2007) proposed an equation of maximum splice height for spliced column reinforced by steel nail. Xu (2012) studied the load-bearing capacity of spliced short columns reinforced by steel hoop and fibre-reinforced plastic (FRP) and found that these retrofitted columns could recover the capacities of the intact columns. However, in historical building structures, columns are usually long and slender, and timber frame columns are under both compression and bending moment effects. Moreover, columns will be subjected to moment when they reach a stability limit state. There has been little experimental research on the effect of splice joints on the strength, stiffness and stability of retrofitted long columns. There has also been a lack of design method for the retrofitting of timber columns using such joints. Therefore, it is necessary to study the performance of spliced long columns.
This article presents an experimental study on the comparative performances of splice-jointed long columns under axial compression. Different joint strengthening methods, including (a) using steel jackets, (b) using steel jackets with injection of adhesives between the steel jacket and the column, (c) using ear hoops and (d) using FRP wrapping, are compared with the reference intact columns. The specimens were tested for the full range of responses so as to demonstrate the real behaviour of the connections until failure. The experimental results are reported in terms of failure modes, load versus lateral deflection curves, load versus vertical deflection curves, ultimate strength capacity, stiffness behaviour and strain distribution in the splice joints. In addition, the stress distributions within the joint, which are inferred from the distributed strain gauges, are also examined to assist in the analysis of the performance of the joint connections. Finally, the results are used to evaluate the effectiveness and feasibility of these types of connection, providing theoretical basis for application.
Experimental programme
Column specimen configurations
Several groups of column specimens were prepared and tested to investigate the effectiveness and behaviour of the splice joints reinforced by different techniques for retrofitting of column members. Since the main focus of the investigation is on the behaviour of the joints, and considering the limited availability of the original timber materials from historical timber structures, the column specimens were made of new timber.
All timber column specimens had a finished length of 1.8 m and a nominal diameter of 100 mm, giving a length-to-diameter ratio of 18. It should be mentioned that for traditional timber buildings of residential style, such slenderness is quite common in timber columns according to a survey of dimensions conducted by the authors in a historic district in Nanjing, China. For the jointed specimens, all joints were made at the mid-height of the column. Figure 2 shows the configurations of the column specimens and details of the joints. Three main types of joint reinforcement were investigated, namely, (a) joint reinforced by the traditional ear hoops (referred as Joint-I), (b) joint reinforced by steel jacket, without the injection of epoxy (Joint-II) or with injection of epoxy (Joint-III) and (c) joint reinforced by carbon fibre–reinforced polymer (CFRP) wrapping (Joint-IV). For the joints with the steel jacket (similarly for the CFRP joints), Ls denotes the length of the steel jacket, Lt is the splice length, Le = (Ls–Lt)/2 is the extended length of the steel jacket beyond the splice. A summary of groupings and the joint dimensions is given in Table 1.
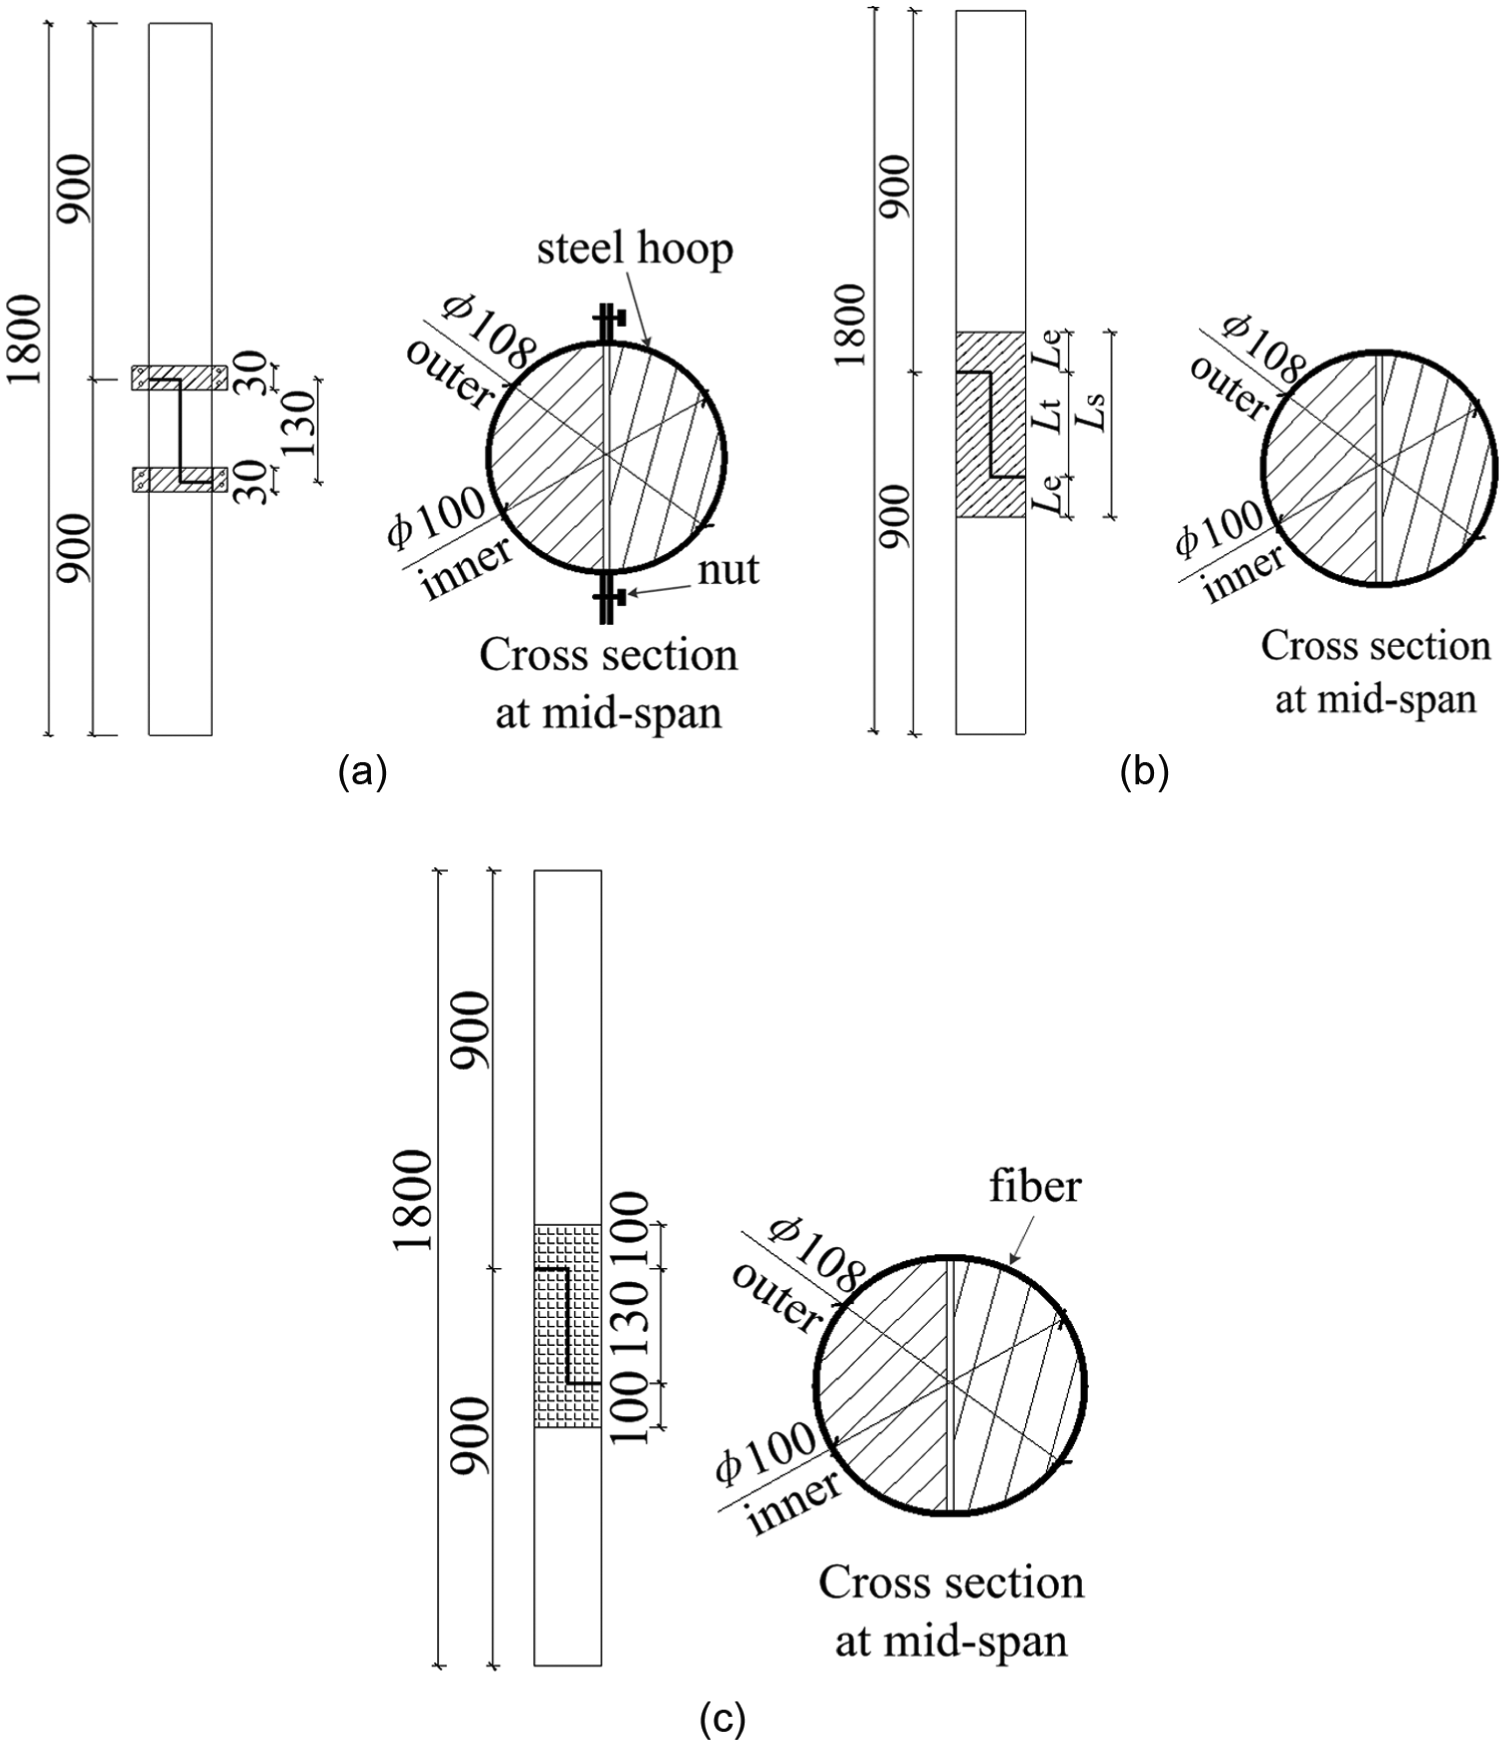
Configuration of column specimens and cross section: (a) specimens with ear hoops (Joint-I), (b) specimens with steel jacket (Joint-II and Joint-III) and (c) specimens with CFRP joints (Joint-IV).
Summary of 15 tested columns.
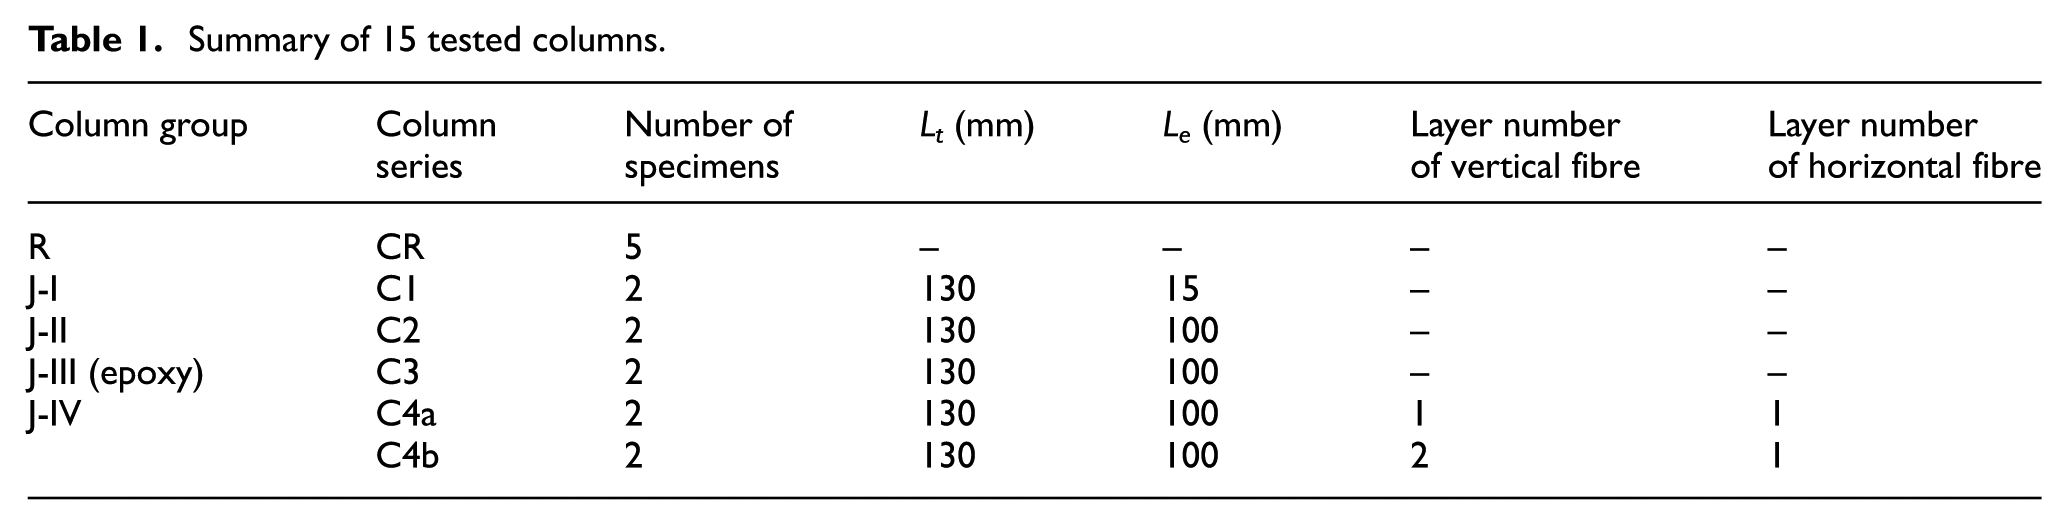
Totally, 15 column specimens were tested, and as shown in Table 1, they were divided into five groups. Group R consisted of five reference columns of a single segment to determine the reference load-bearing capacity and stiffness of the intact columns. Groups J-I, J-II, J-III each consisted of two column specimens. Group J-IV, that is, the CFRP joints, consisted of four columns, and these were further divided into two series with different numbers of layers in the vertical fibres to examine its influences on the retrofitting effects. Thus, there were six test column series, as listed in Table 1.
Material properties
The Chinese fir (Cunninghamia lanceolata), one of the most significant timber species used widely in Chinese ancient building, was used in this study. The age of the wood to prepare the test column specimens was estimated to be 10–12 years. The timber material was selected randomly in terms of natural grain and knot patterns. Material tests included the determination of the moisture content (MC) and density of the timber, as well as the mechanical properties. The MC was found to be 10.8%, and the density (q) was 380 kg/m3.
Because of the variation of the material properties in natural timber, material samples were taken from each column specimen and tested to determine the material properties. These properties were later used for normalisation to minimise the influence of material property variation on results of the columns test.
A total of 150 compressive tests of timber material were performed. Samples with cross sections of 20 mm × 20 mm were used. The gauge section of the sample specimens used in compression tests was designed according to the relevant standards (Chen, 2011; GB/T 1935-2009, 2009; GB/T 1936.2-2009, 2009; Wang et al., 2004), with a total length of 60 mm for modulus of elasticity. Compression was applied at the two ends of the samples via rigid steel plates. Bi-axial strain gauges were used in these tests to measure the longitudinal and transverse strains. All mechanical tests of the samples were carried out on a CMT 5015 testing machine, rated to 10 kN, under a crosshead displacement control. The experimentally determined properties of the timber materials are shown in Table 2, in which fc and E denote the compressive strength and compressive modulus of elasticity, respectively.
Material properties of columns parallel to wood grains.
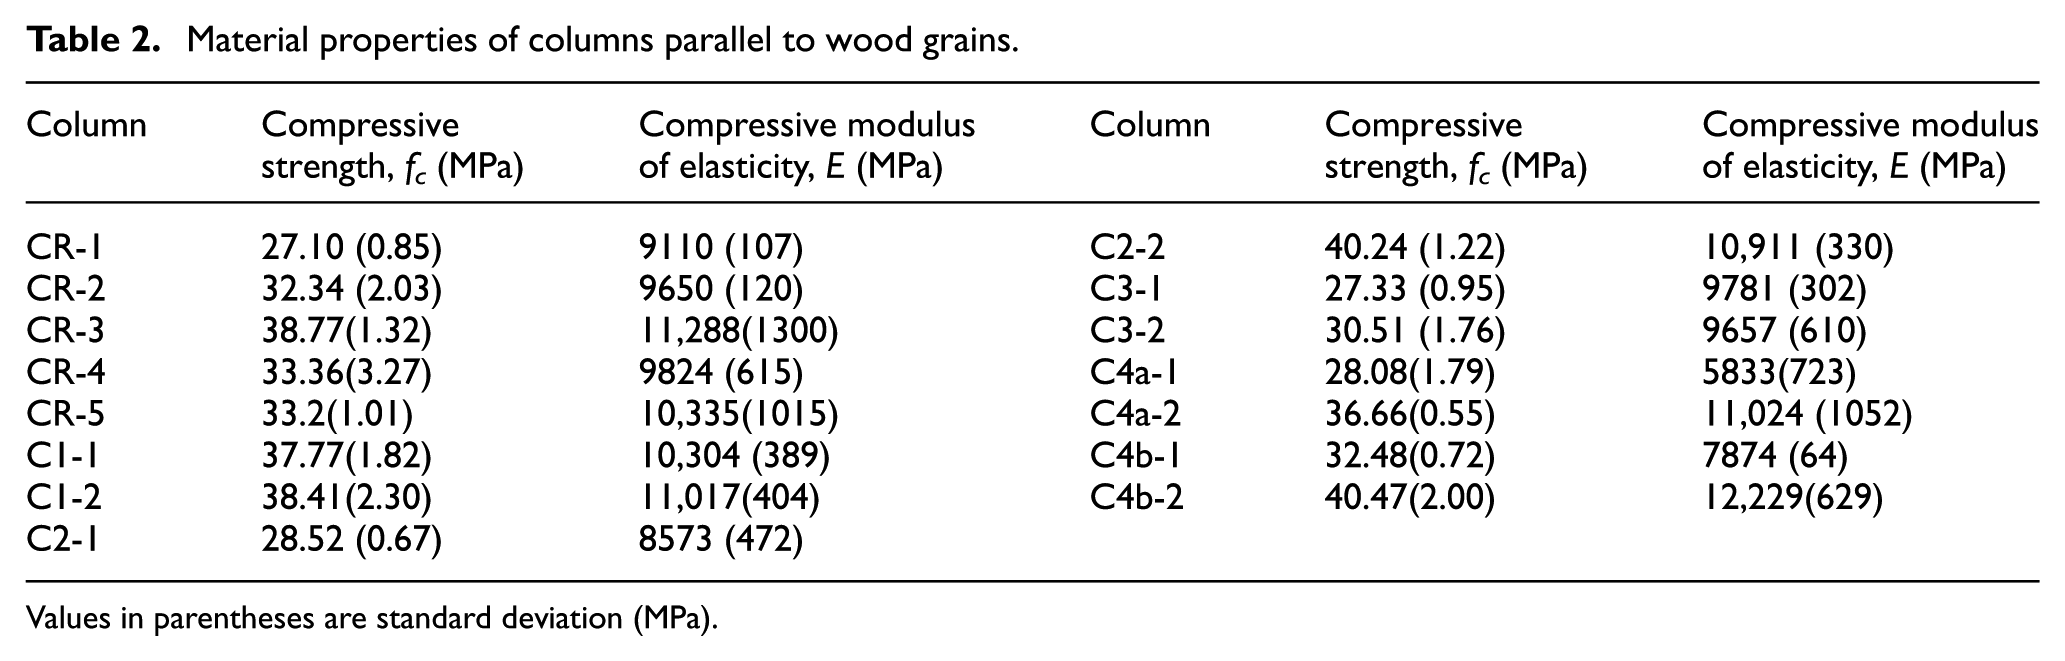
Values in parentheses are standard deviation (MPa).
For the steel jackets and the ear hoops, use was made of seamless steel tubes of outer diameter 108 mm and thickness of 4 mm. The properties of the steel tubes were determined from the tests of five samples (GB/T 228-2002, 2002). The properties of the epoxy, which was used as adhesive in the bonded steel jacketed joints as well as for the CFRP, were determined in accordance with the standard GB50367-2006 (2006). A summary of the material test results is given in Table 3.
Material properties of steel, epoxy adhesive and CFRP.
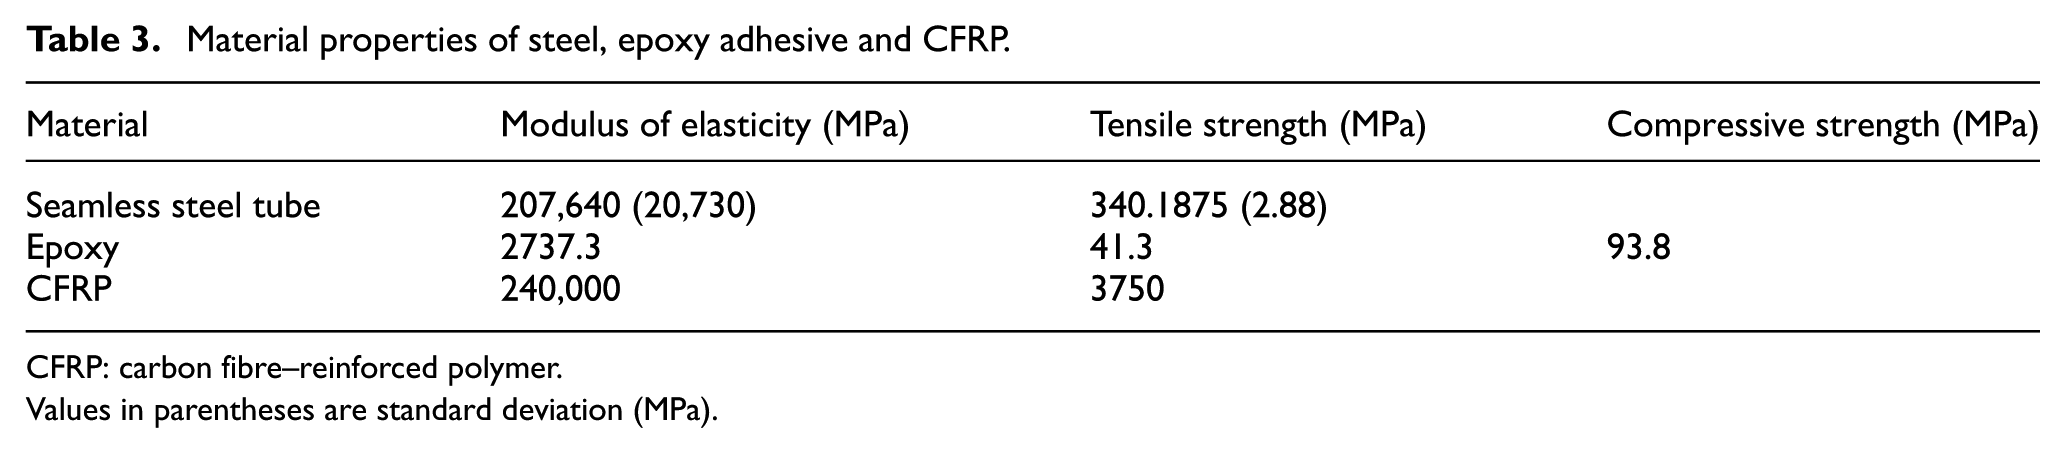
CFRP: carbon fibre–reinforced polymer.
Values in parentheses are standard deviation (MPa).
For those specimens where the steel jacket was bonded to the timber joint, the internal surfaces of the steel tubes were polished by steel brush and then carefully degreased with acetone before bonding.
Test programme for column specimens
The column specimens were tested under axial compression loading by an MTS testing machine. The columns were supported at both ends by a spherical hinge (pinned end), which was then connected to a support base at the bottom and to the loading head at the top, as shown in Figure 3. It should be noted that hoop clamps were applied near the column ends to prevent end splitting due to local pressure.
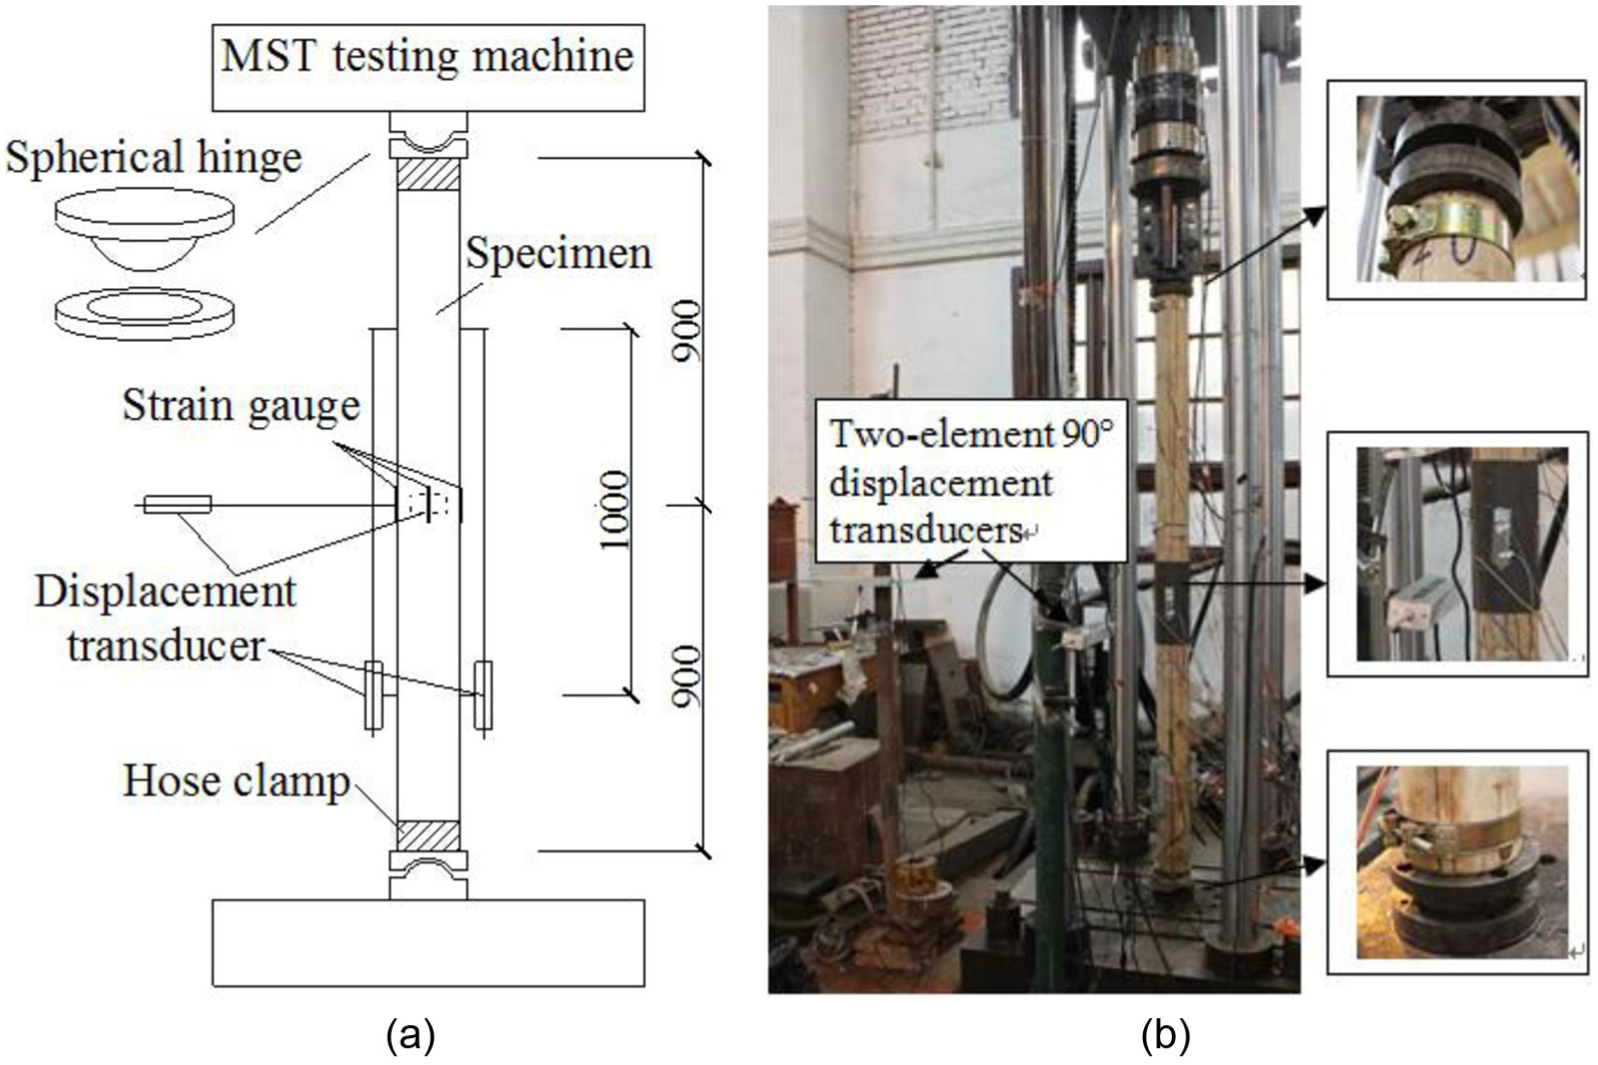
Test setup and instrumentation (unit: mm): (a) schematic of setup and (b) column specimen under testing.
Loading was controlled by an electro-hydraulic servo machine with a crosshead movement rate of 0.3 mm/min. Measurement instrumentation included load cells measuring the axial load, displacement transducers measuring the deformation in both longitudinal and lateral directions and strain gauges. Near the mid-height of the column, four strain gauges were arranged symmetrically around the circumference, and the readings from these strain gauges at the setup stage provided reference for the alignment of the test column. Other strain gauges were installed through embedded grooves to measure the distributions of strains within the splice joint and on the steel jacket to measure the vertical strains in the steel jacket (Figure 4).
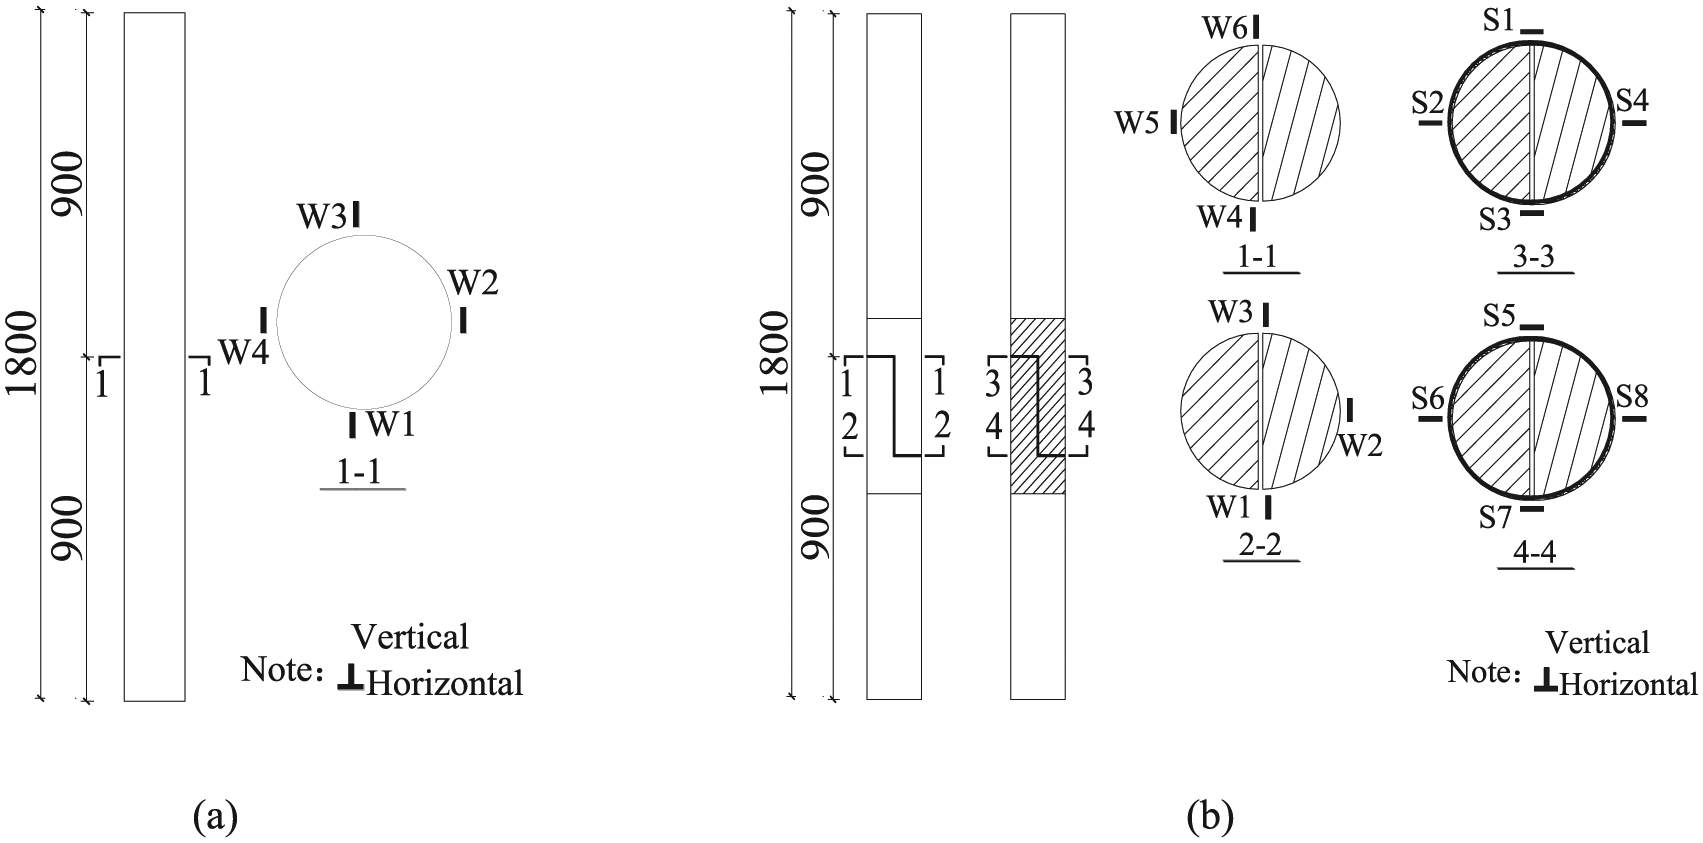
Layout of strain gauges (unit: mm): (a) Group R and (b) Groups J-I to J-IV.
The lateral deflection was obtained from a combination of two horizontal displacement transducers in the mid-span arranged at a 90° angle to each other (Figure 5).
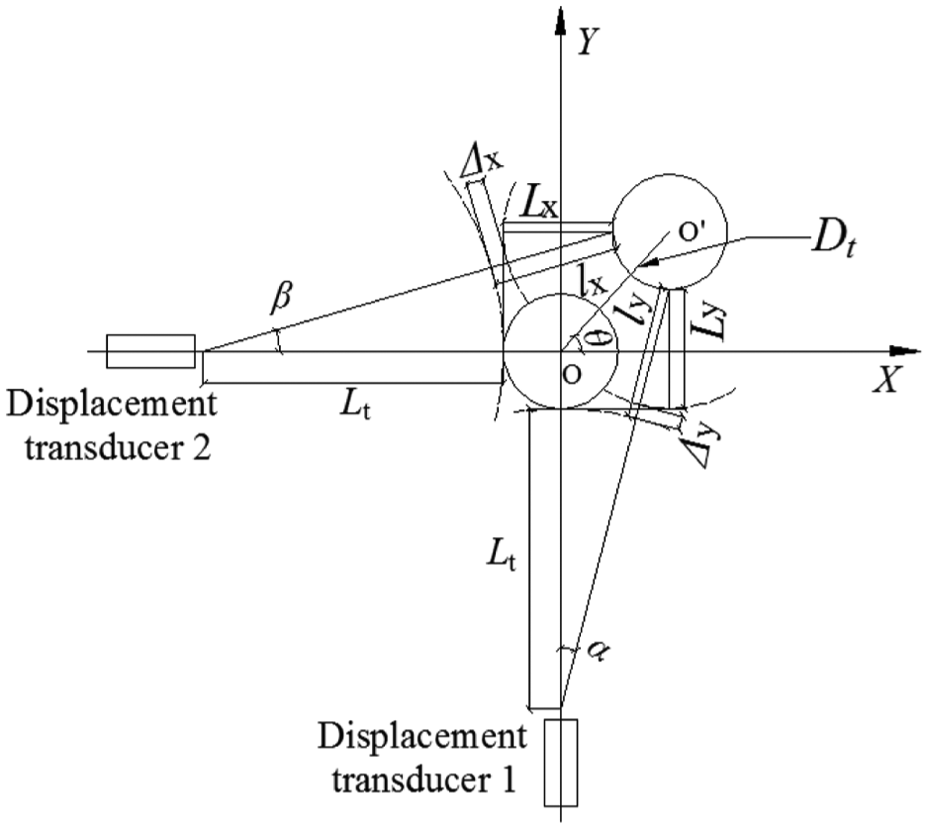
Resultant of lateral deflection at mid-span.
The relative error (Er) between the combined value and the true value relates to the length of transducer line, lateral deflection and deflection angle. MATLAB was used to calculate the Er on equations (1) to (5). The results showed that Er is inversely proportional to the length of transducer line, while it is proportional to the lateral deformation of the column. When the length of transducer line and the lateral deformation of the column is fixed, the relative error takes the maximum in the deflection angle (θ) of 45°. In this experiment with a column length of 1.8 m, the deflection is within 20 cm, so the relative error is less than 1.37% within the calculation
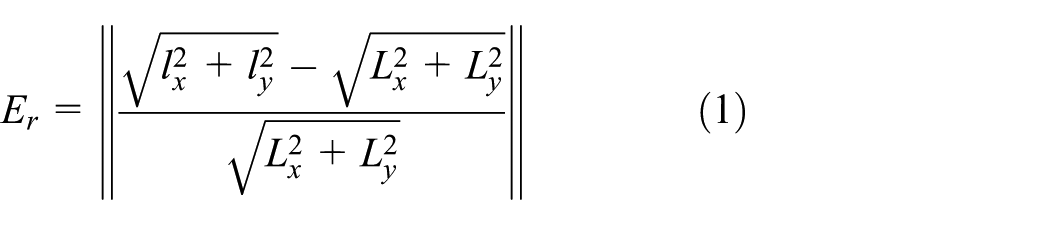
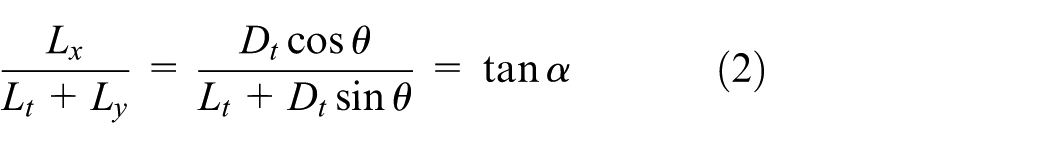
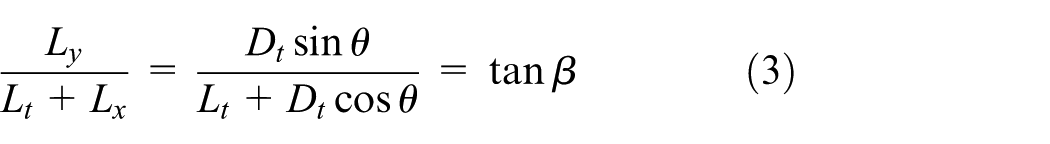
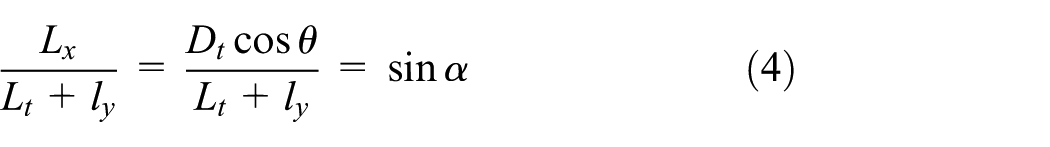
where Er represents the relative error between the combined value and the true value of lateral deflection of column in mid-span, Dt is the true value of lateral deflection, θ is the deflection angle between the lateral deflection direction and the transducer 2 line, and α and β are the transducer line angle between original direction and new direction for displacement transducer 1 and displacement transducer 2, respectively. Lt is the length of displacement transducer, lx and ly are the readings from the two-element (as 90°) displacement transducers, and Lx and Ly are the components of the coordinate axes of the true value of lateral deflection.
As part of the measurement system, and considering that the circular columns are axis-symmetrical and so the bending direction was uncertain, three-dimensional (3D) digital image correlation (3D-DIC) was used to assist in the measurement of the displacements and the surface strains in the mid-span of columns as has been used in some previous studies (Hild and Roux, 2012; Sutton et al., 2009; Yuntong et al., 2015). The DIC setup comprises eight digital cameras constituting four sets of 3D-DIC systems and is controlled by a signal triggering device for synchronous acquisition. A schematic diagram of 3D-DIC setup is shown in Figure 6. Due to the restriction of the camera resolution and the distance from the cameras to the test structure, only the mid-span segment of 60-cm length was covered by the DIC measurement.
Layout of DIC system.
General response and failure modes
For the reference Group R, the column specimens exhibited typical axial compression response until the load reached about 80%–90% of the peak load. At this stage, notable compression damage started to occur which was associated with audible sound from the compressed wood fibres, and the lateral deformation in mid-span became pronounced, showing marked bending effect. After the peak load, the vertical wood fibres on the concave side showed clear compressed marks, and the upper and lower spherical hinge exhibited apparent rotations in the bending direction. The bending deformation increased rapidly and eventually the wood fibres of the convex (tension) side fractured. The fracture patterns were similar among the specimens, as shown in Figure 7(a). The failure mode has a character of compression-bending failure.
Failure modes of tested columns: (a) reference columns (Group R, specimens CR-1, CR-2 and CR-3, respectively), (b) Group J-I (traditional ear hoop joint), (c) Groups J-II and J-III (jacketed joints without and with adhesive injection) and (d) Group J-IV (CFRP joints, one and two vertical layers of fibre sheets, respectively).
The behaviour of Groups J-I, II, III is similar to Group R before the peak load. For Group J-I with traditional ear-hooped splice joints, at the peak load, noticeable relative displacement occurred between the splice joint and the ear hoop on the convex side of the column. The failure occurred soon after passing the peak load (at about 90% of the load peak), and it was featured by the fracture of the wood fibres at the top edge of the narrow ear hoop, as shown in Figure 7(b).
For Group J-II, with steel jacketed splice joints but without adhesive injection, at the loading peak, a noticeable gap appeared between the steel jacket edge and the wood in the convex side of the column due to differential deformations between the timber and the steel jacket. This was followed by a gradual pullout of the splice joint from the steel jacket on the convex side, while on the concave side, the steel jacket cut into the wood in the horizontal direction (Figure 7(c)). The load decreased with the degree of the pullout and cut-in deformations at the joint.
The behaviour of Group J-III, with steel jacketed splice joints and adhesive injection, is similar to Group J-II, but the adhesive injection avoided the appearance of a gap in the steel jacket edge on the convex side of the column at the peak load and thus enhanced the joint rigidity. During the post-peak-load response, the steel jacket and the wood debonded on the convex side.
For Group J-IV with CFRP joints, 65% of the peak load bending around the joint region appeared to be significant, and consequently, the CFRP exhibited apparent pressing deformation on the compressive side due to the small compressive stiffness of the CFRP layer. Meanwhile, the loading declined sharply, and the lateral deformation in the mid-span increased suddenly. After the peak load, the lateral deflection increased quickly. The final failure of the joint was due to rupture of the CFRP layer on the tension side of the joint (Figure 7(d)). An increase from one to two layers of the vertical CFRP delayed the rupture of the CFRP at the joint, and this will be discussed in more detail later.
Detailed test results and discussion
Axial stiffness
Figure 8 shows the load–axial deformation curves for the reference (Group R) and jointed column specimens (Groups I–IV). To eliminate the influence of the differences in the material properties, particularly the elastic modulus along the column direction, a normalised axial deformation u = uo(E/Er) is adopted, where uo is the measured axial deformation, E and Er are the compressive modulus of elasticity parallel to the grain for the current column and the reference column, RC1, respectively.
Load–axial deformation curves for specimens: (a) Group R, (b) Groups J-I to J-III and (c) Group IV.
As can be seen in Figure 8, the curves of the Group R and Groups J-I to J-III are similar and maintain almost straight lines before the peak loads, indicating that the columns primarily underwent axial deformation and that the whole cross sections remained in elastic stage (Figure 8(a) and (b)). Beyond the peak loads, there was a sudden decrease in the load resistance, showing a characteristic of instability failure. In contrast, Group J-IV exhibited an overall decrease in the loading capacity as compared to the reference and other jointed columns, and there appeared to be a stiffness reduction at about 65% of the peak loads (Figure 8(c)).
For a comparison of the axial stiffness in the elastic stage, a nominal slope on the axial load versus axial displacement curves, taken from 20 to 60 kN, is employed to represent the axial stiffness Ka. The values of Ka for individual specimens, and the average stiffness recovery rate a for each group of jointed columns with respect to the reference columns, are shown in Table 4. It is worth noting that in some groups, the stiffness values between the two specimens exbihit marked difference, and this is deemed to be a reflection of variation in the properties of the natural wood and the workmanship in the retrofitting process. Herein, the average value for each group is employed for a characteristic comparison.
Axial stiffness, ultimate moment resistance and lateral flexural stiffness.
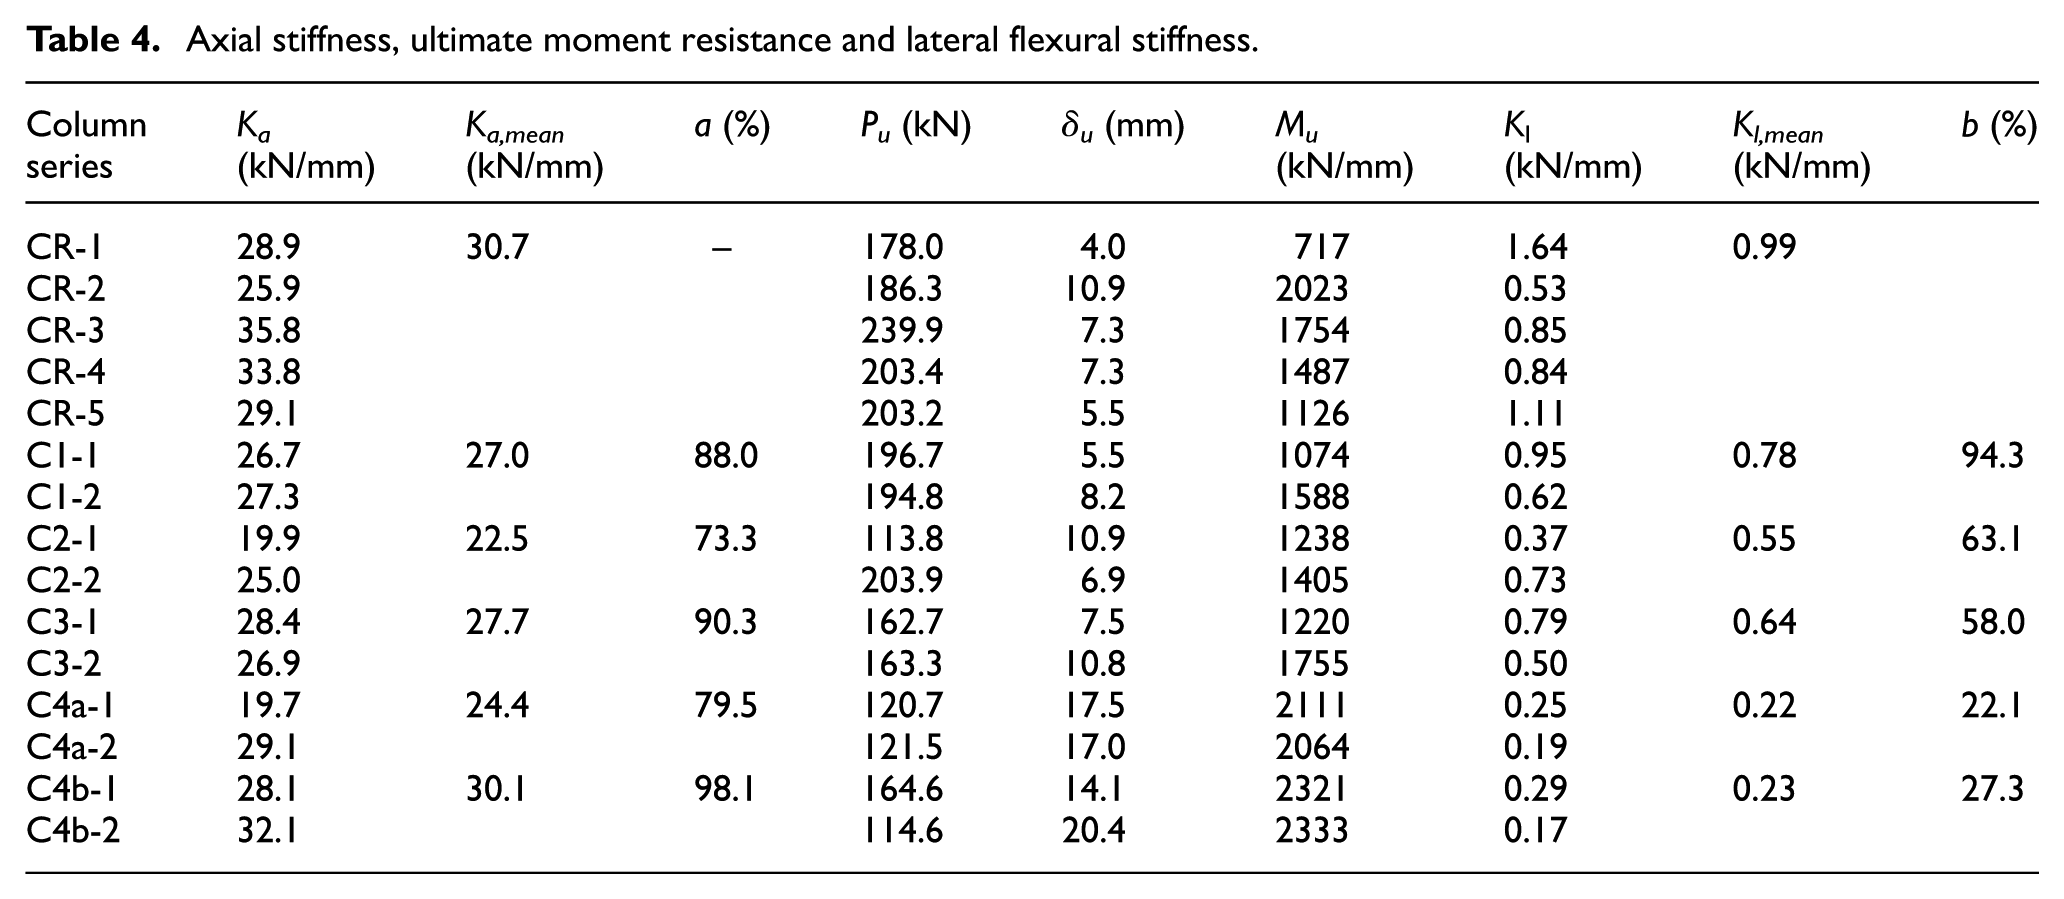
It can be seen that the axial stiffness in all jointed specimens achieved a recovery ratio (relative to the reference columns) of more than 70%. The steel jacket spliced columns (Group J-II) had the lowest axial stiffness with a recovery ratio of 73.3%, and this could be attributed to the deformations within the jacketed joint without the presence of adhesive. The axial stiffness recovery ratio in Group J-III increased to 90.3% owing to the effect of the adhesive. It is also interesting to note that the axial stiffness in the CFRP jointed Group J-IV specimens was the highest, reaching 98.1% of the reference group, although the axial load capacity in this group was relatively low. This was likely because in these specimens, it was easier to ensure a firm contact between the two half-columns while the CFRP joint was installed.
Resistance to bending (P–δ effect)
As can be observed from Figure 7, failure of all the columns had the same characteristic of losing stability after the peak axial load, due apparently to the P–δ effect. There are two key parameters to this behaviour which are closely related to the mechanical behaviour of the joints: (a) the flexural rigidity (stiffness) of the joint; a lower flexural stiffness at the joint tends to promote the lateral deflection which would act back to increase the P–δ effect and (b) the ultimate moment resistance of the joint.
Figure 9 shows the P–δ curves for all the specimens. The ratio of the peak load to the corresponding lateral deflection at the mid-span, P/δ, is defined as a P–δ stiffness factor Kl. The ratio of Kl in a jointed column to that in the reference columns is called the specimen P–δ stiffness recovery rate b. The results of Kl and b in all specimens are given in Table 4.
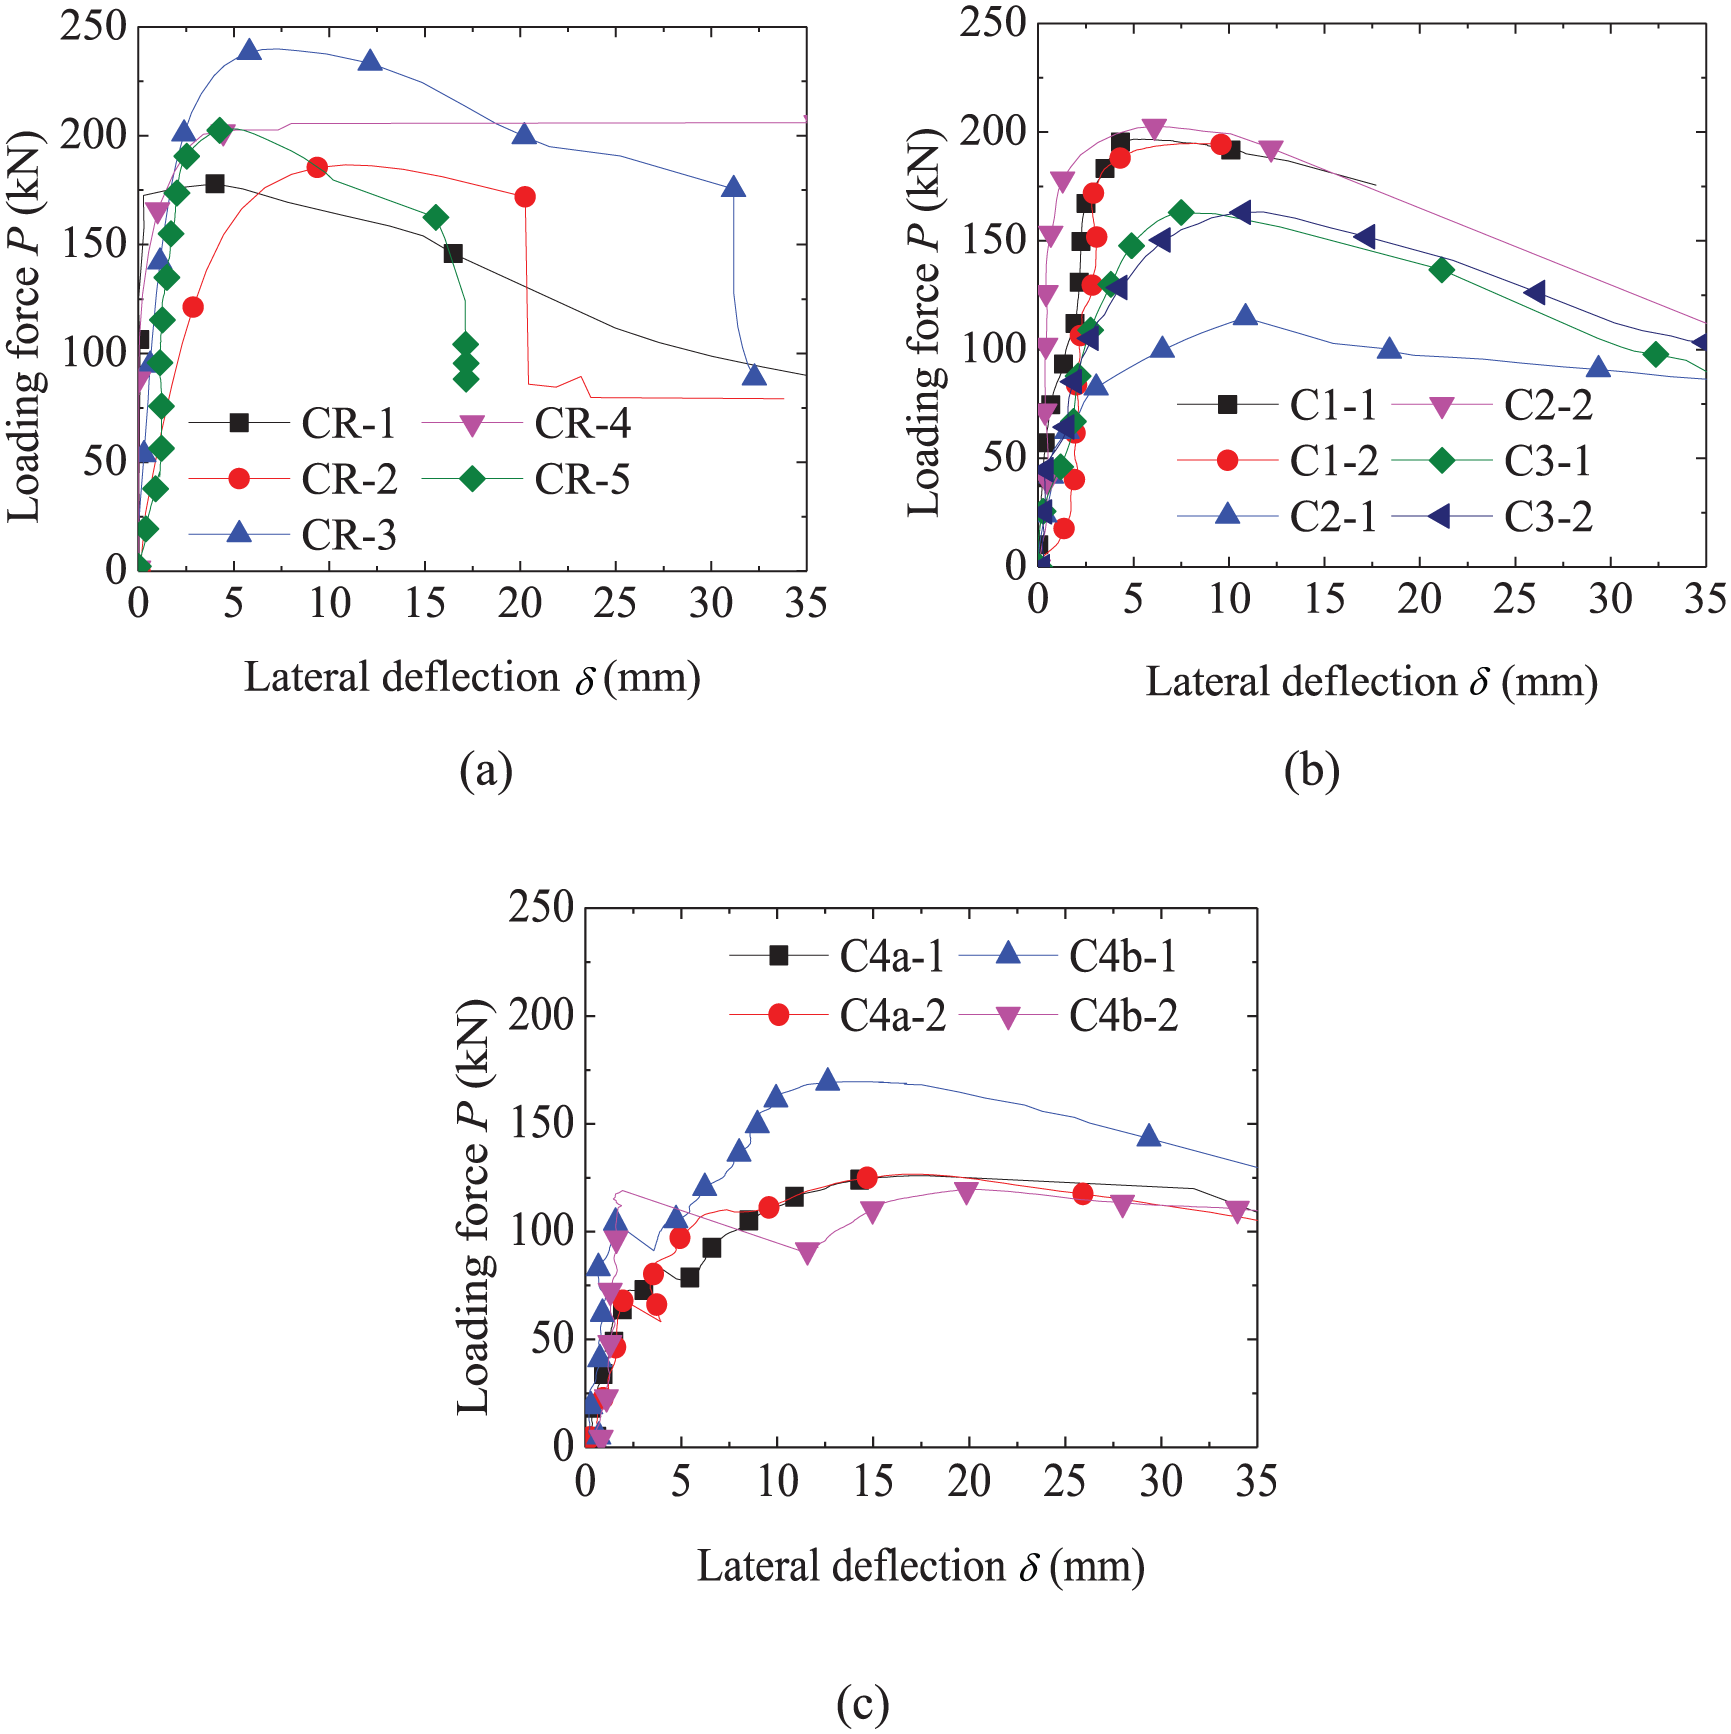
Lateral deflection at mid-span of columns: (a) Group R, (b) Groups I–III and (c) Group IV.
As can be observed from Figure 9(a), most of the reference columns experienced a small lateral deflection before the peak load was reached, and the increase in the lateral deformation was abrupt after the peak load showing a typical characteristic of axially loaded members. The P–δ curves of Groups J-I to J-III are similar to that of Group R (Figure 9(b)), but they exhibit a generally reduced slope in the ‘elastic’ range and increased deflections towards reaching the peak loads. For Group J-I, the P–delta stiffness was almost the same (98.3%) as the reference group R. The P–δ stiffness in Group J-II and III was on the order of 60% of that in the reference group. For Group J-IV, the P–δ stiffness is the lowest, and it reached only about 22%–35% of Group R.
The P–δ bending resistance (M) can be evaluated as the product of the axial force P and the lateral displacement δ at the mid-span of the columns. Because the post-peak displacements developed very quickly and could not be recorded in a stable manner with the axial load, only the first peak axial force and the corresponding displacement are employed herein to provide an indication of the P–δ a bending resistance. The results are shown in Table 4. The CFRP splicing columns (Group J-IV) had the highest P–δ bending resistance, even much more than the referenced columns. This was likely because flexible CFRP ensured the coordination of the jointed deflection and a firm contact between the two half-columns again. The average bending resistance of Group J-III is higher than the jointed columns (Group J-II) without adhesive. This shows that the adhesive increased the integrity of the joint, which was verified earlier in the axial stiffness as well.
Ultimate axial load capacity
Based on the above analysis of the test data, the failure was due to the loss of stability in the column, and this could be attributed primarily to the P–δ effect. The resistance to the P–δ effect has a direct relationship to the bending strength of the joints.
For a comparison of the strength of the columns, the measured ultimate axial load is normalised with respect to the compressive capacity of the cross section, that is, pu = Pu/fcA. Table 5 shows the bearing capacity factor pu = Pu/fcA of each column specimen and the capacity recovery rate c relative to the reference column in equation (6)
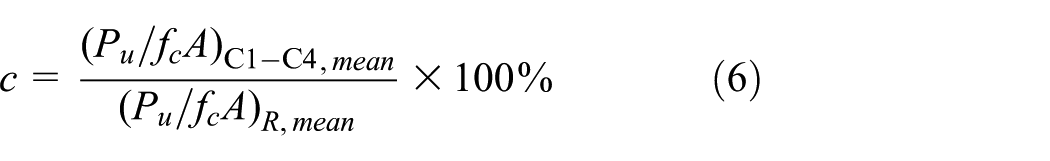
where Pu denotes ultimate load-bearing capacity of a specimen, l is the length of the specimen, E is compressive modulus of elasticity parallel to the wood grain, (Pu/fcA) R,mean and (Pu/fcA)C1–C4,mean are the average bearing capacity factor for reference columns and the splice columns (series C1–C4), respectively, A is the section area in the mid-span and fc is the compressive strength parallel to the wood grain.
Measured axial strength capacity and restoration rate.
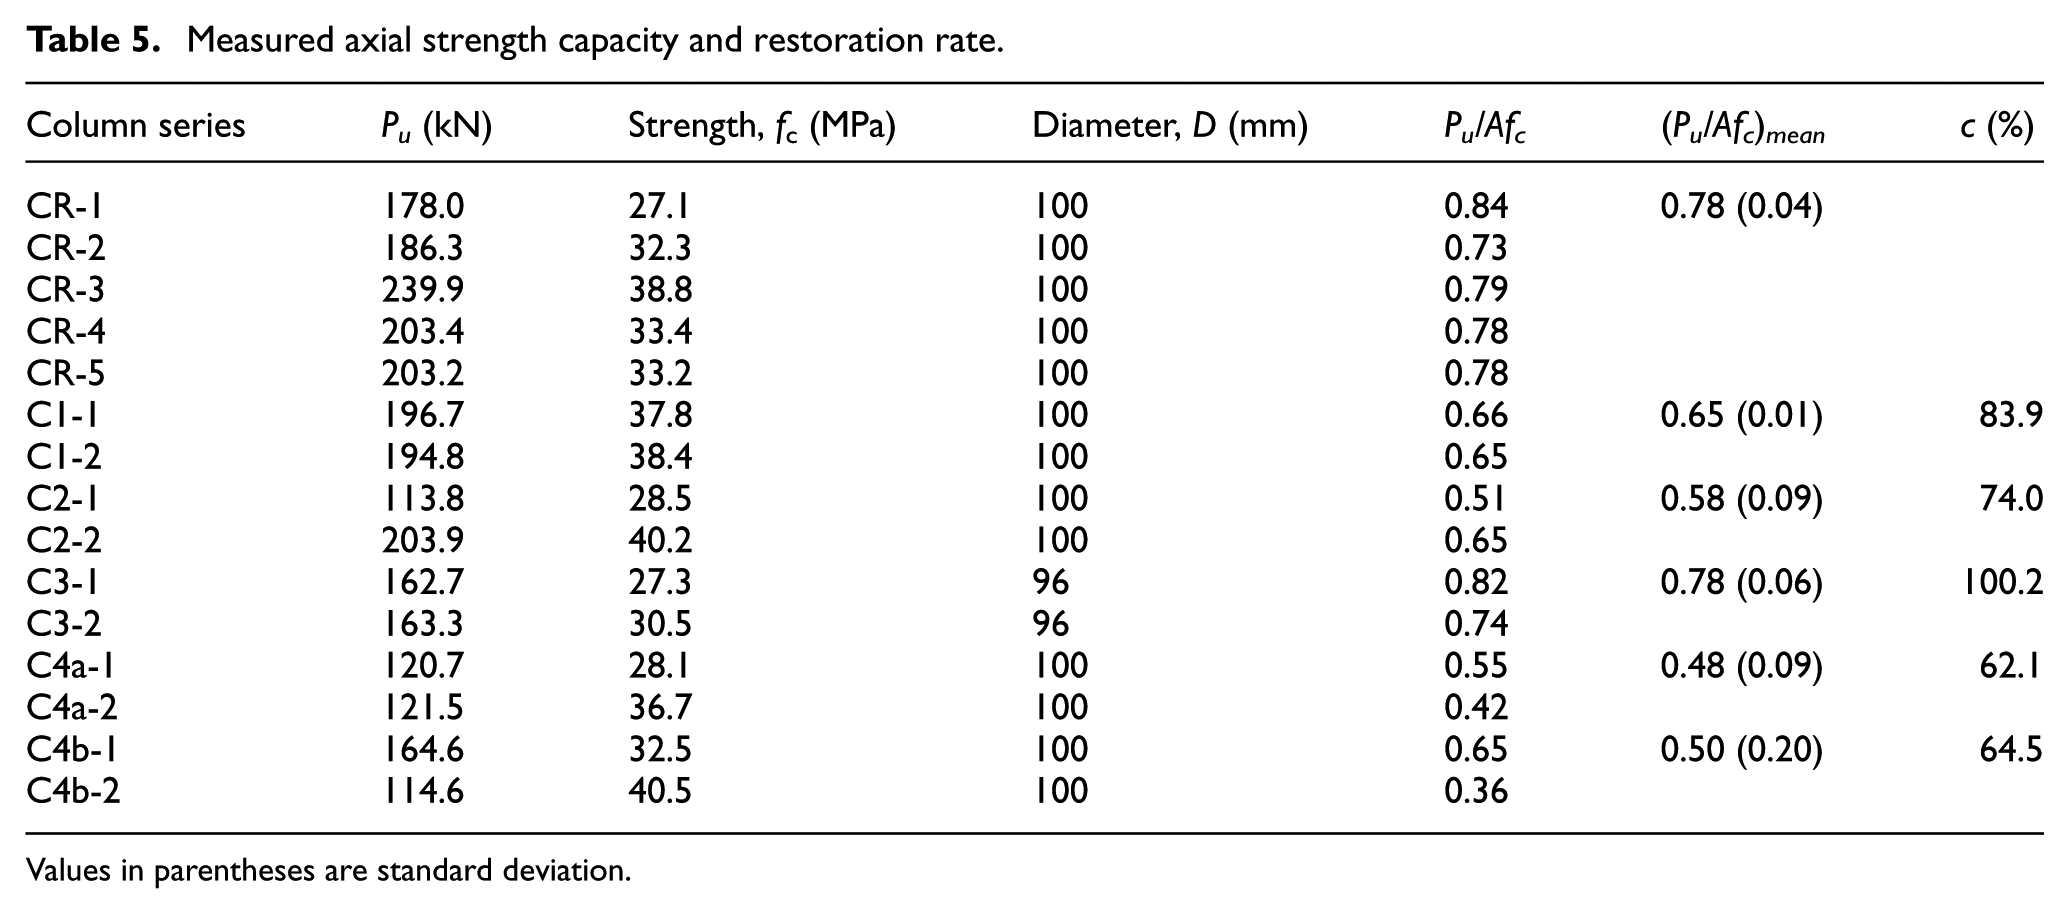
Values in parentheses are standard deviation.
It can be observed that the ultimate axial load capacity in all jointed specimens achieved a recovery ratio (relative to the reference columns) of more than 60%. The CFRP jointed columns (Group J-IV) had the lowest axial load capacity with a recovery ratio of 64.5%, and this could be attributed to the small compressive stiffness and early buckling of the CFRP layer. The steel jacket spliced columns with adhesive (Group J-III) had the highest axial load capacity with a full recovery of the strength owing to the effect of the adhesive. Without the presence of adhesive, the axial load capacity recovery ratio in Group J-II was only 74.0%. The load-bearing capacity of Group J-I recovered to 83.9% of the reference columns.
The slenderness ratio of the tested columns may be classified as intermediate length columns (Canadian Wood Council, 2005). It is generally known that the Euler buckling formula is acceptable for the estimation of long elastic columns whereas it is generally not applicable to short- and intermediate-length columns (Neubauer, 1969, 1970). For an assessment of the prediction of the axial strength of the test columns, the measured bearing capacity of the reference Group R is summarised in Table 6, along with the calculated values using (a) the Euler buckling formula and (b) the axial compressive strength formula. It can be seen that the test results (Pu) are higher than the Euler results (Pr) by 28.7%, whereas they are lower than compression strength results Pc by 24.8%. Taking into consideration the imperfection in the boundary condition, a corrected formula based on cubic Rankine–Gordon formula (CRG) (Henson et al., 1972; Neubauer, 1969, 1970) is adopted in this article to calculate the reference column capacity as
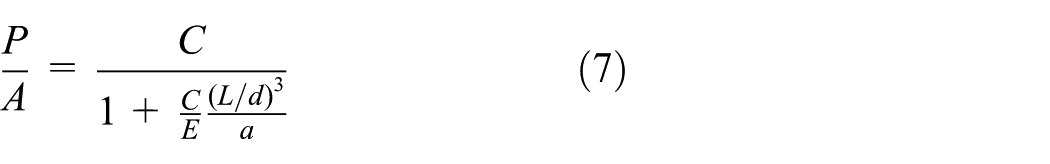
where P is ultimate load, A is cross-sectional area of the column, C is allowable compressive stress, E is the modulus of elasticity parallel to grain, L is the effective length of the column, d is the least dimension of the cross section and a is a numerical coefficient.
Load-bearing capacity of reference columns against CRG predictions.
Pu: test result; Pr: result from Euler buckling formula; Pc: result from axial compressive strength formula; P: result from CRG formula.
As illustrated in the formula, the normalised axial capacity (P/A) is dependent on the values of C and E. When L/d is very small (short), the capacity P/A value approaches C. When L/d is very large (long), the capacity P/A value will depend only upon E, as in the Euler equation. Thus, the CRG formula generally covers columns of all slenderness ratios and is in agreement with various test data (Henson et al., 1972; Neubauer, 1969, 1970; Neubauer and Tekinel, 1966). However, this formula has been proposed for square-section columns with realistic pinned ends. The value of a was set at 60 or 45 in the literature by fitting to the relevant the test results (Henson et al., 1972; Neubauer, 1969, 1970; Neubauer and Tekinel, 1966). For the circular columns in this study, trial calculations indicate that a slightly higher a value equal to 65 tends to produce a better fit to the test results. The average of relative error and maximum relative error (λ) is 4.2% and 7.8% between the predicted results, with a = 65, and the test results, respectively. Thus, the accuracy of the CRG formula is acceptable for the prediction of the axial load capacity of intact circular timber columns. For the jointed columns, appropriate correction on the basis of the tested recovery ratios should be adopted.
Analysis of the strain measurements and load–strain relationship
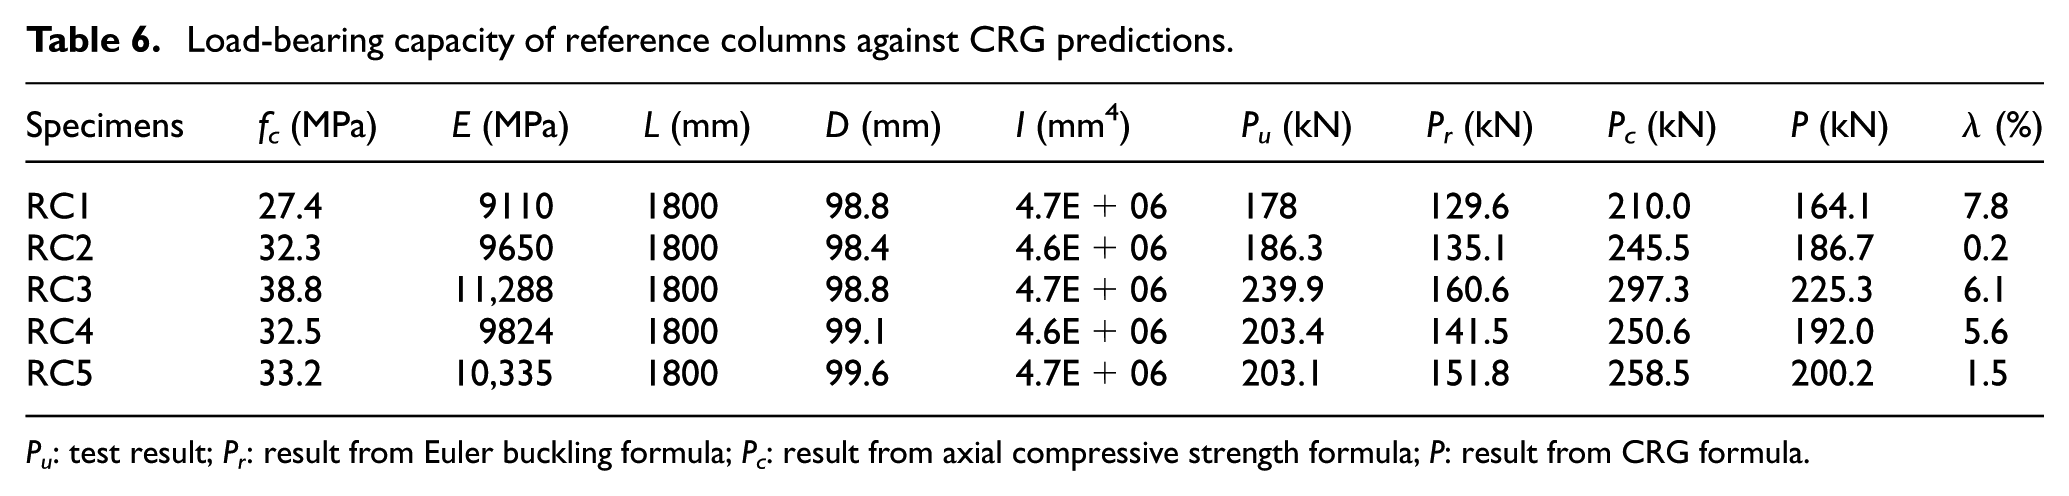
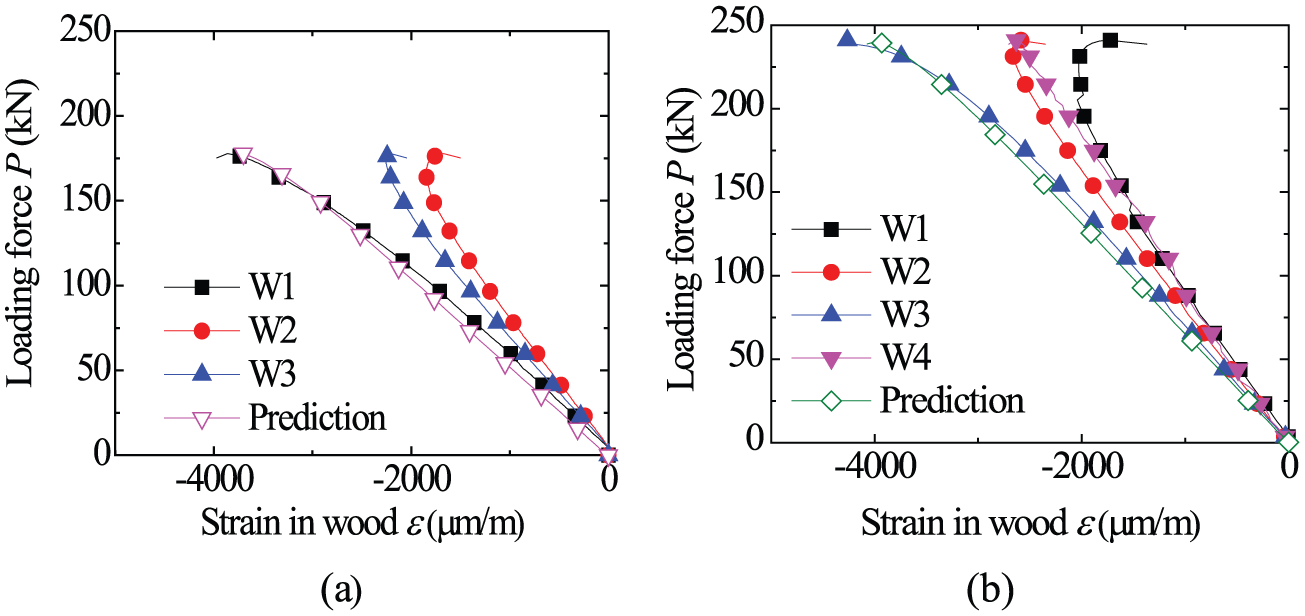
In this section, the measured strains near the mid-height of the column specimens around the circumference (see Figure 4) are analysed to examine the distributions of strains around the joint region. Figures 10 and 11 show the axial load versus strain curves for the reference group and other groups, respectively. A predicated load versus strain curve under the ideal axial compression is also shown in the same figure for the purpose of comparison. The test load is assumed as an ideal axial load, and strain is the nominal strain of the column subject to the test loading in the predicated curves. The nominal strain (εnom) is obtained from the equation of εnom = Δl/l0, in which the Δl is the axial deflection of the column and l0 is the original length of the column in the test. The post-peak strains do not exhibit meaningful readings and so these are omitted.
Load versus measured strains in wood fibres at mid-span for Group A: (a) RC1 and (b) RC3.
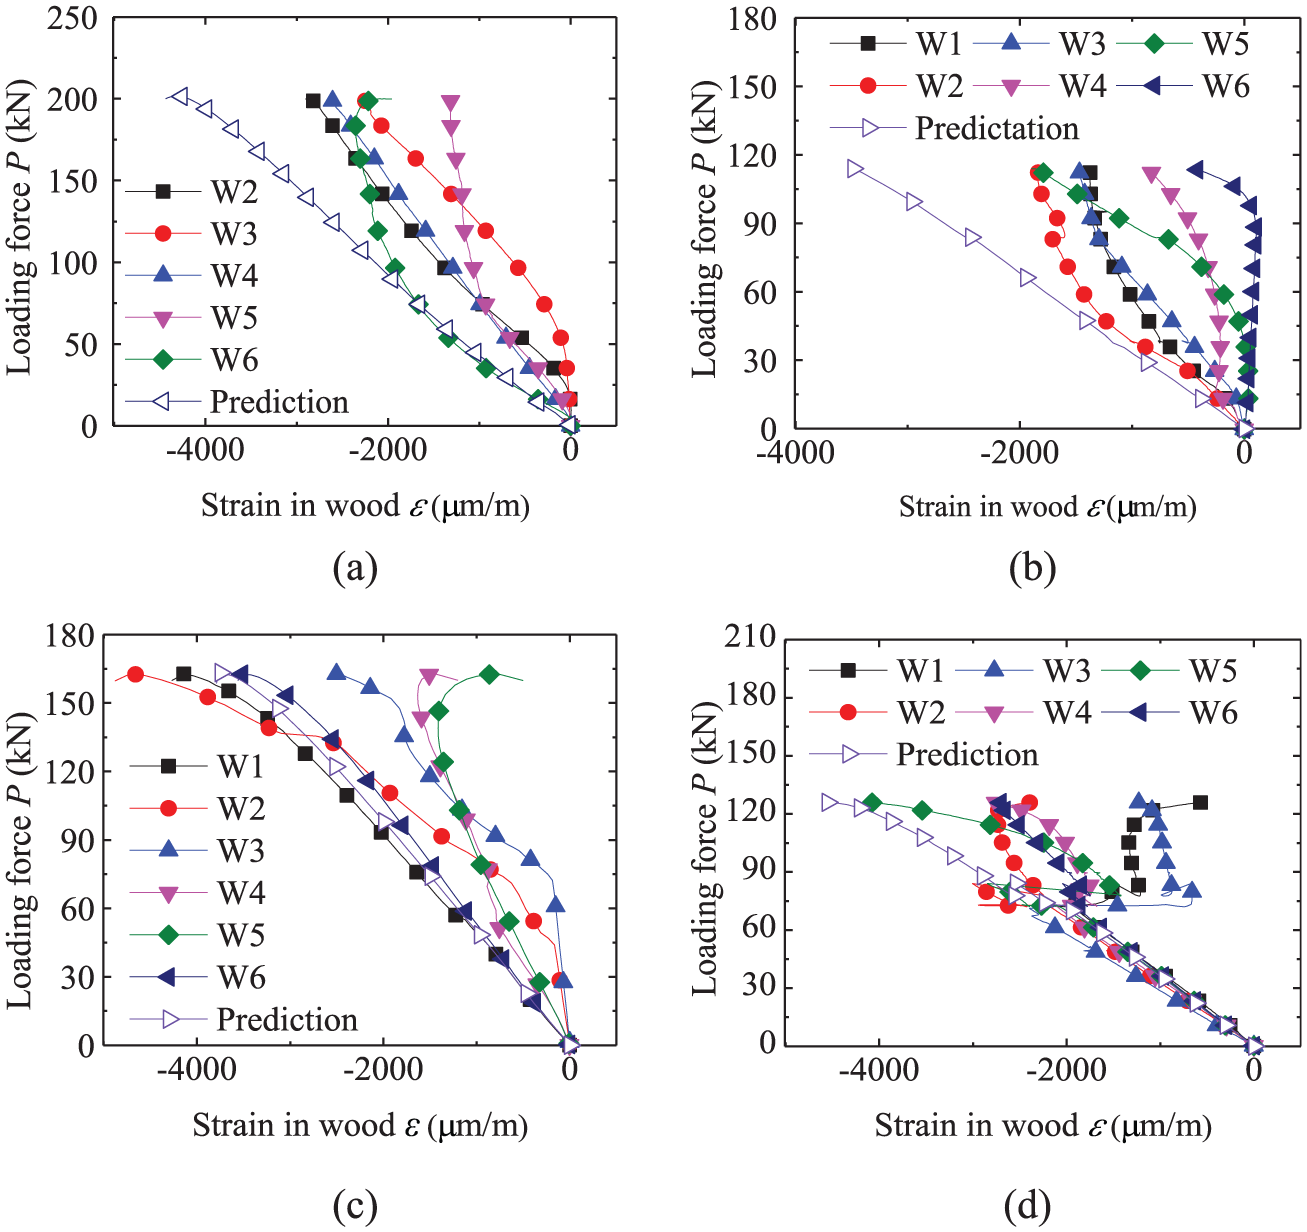
Load versus measured strains in wood fibres at mid-span for jointed columns: (a) C1-1, (b) C2-1, (c) C3-2 and (d) C4a-1.
As can be observed from Figure 10, the load–strain curves for the reference Group R columns have a linearly elastic growth of strain until the loading peak, similar to the load–axial deflection curves. The trend of the measured curves is consistent with the predicated curve for ideal compression. The specimens were approximately in an axial compressive state at the early stage of loading.
From Figure 11, the CFRP jointed columns (Group IV) exhibited the best match with the ideal compression curve before the yield of CFRP. This is consistent with the observations from the axial stiffness and bending resistance in resistance to bending and load capacity. The steel jacket spliced columns without adhesive (Group II), on the contrary, showed the largest difference from the ideal compression curve, and results from difference strain gauges indicated significant uneven compression. This phenomenon actually explains the lower strength capacity as the discussion in flexural bearing capacity and axial strength. With the enhancement of adhesive, the curves of the steel jacket spliced columns (Group III) exhibited marked improvement and tended to approach the performance of the referenced columns, and this is also consistent with the observations earlier from the axial stiffness and bending resistance.
In the test, the transverse strains in the ear hoops, steel jackets and the CFRP were also measured, and the results indicated that these strains were well within the elastic range (reaching only 10%–20% of the elastic limit strain in most cases).
Discussion on the lateral deflection direction and the direction of the splice
The circular columns are generally axis-symmetrical, and as a result, the direction of the lateral deflection would tend to be uncertain (random) in an axial loading situation. However, when the circular columns are retrofitted with spliced joints, the columns are no longer axis-symmetrical, and the direction of the lateral deflection would show certain dependency on the direction of the splices. From the present experiment, the main patterns of the lateral deflection for jointed columns can be summarised into two types: type A, in which the direction of lateral deflection is perpendicular to the splice direction (i.e. the splice give rise to a weaker axis of bending) and type B, which is the opposite to type A, due to the enhancement of the splice by the bolts. The patterns are illustrated in Figure 12, where ‘D’ and ‘U’ indicate the downside and upperside of the half-splices, respectively, and type A1 and A2 both deflect perpendicularly to the splice axis but in reversed directions.
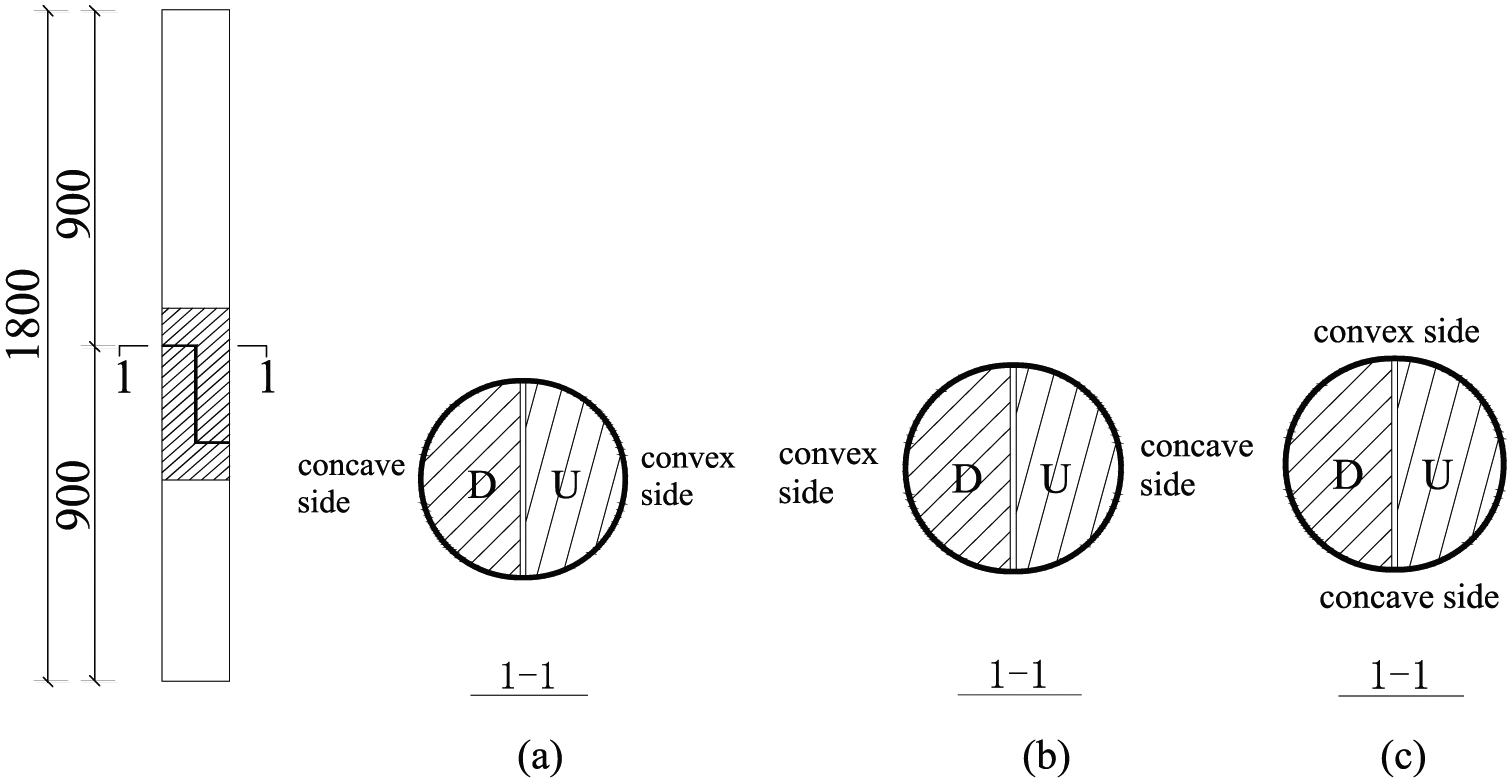
Patterns of lateral deflections for jointed columns: (a) A1, (b) A2 and (c) B.
The lateral deflections of specimens in Groups J-II, III, IV were all in pattern A (A1 or A2), indicating that the spliced joints without additional reinforcement measures indeed resulted in a weaker axis against bending. The division between A1 and A2 is generally unclear, as can be expected. The specimens in Group J-I exhibited deflection patten B. This is attributable to the reinforcement of the spliced axis by the bolts in these specimens.
Conclusion
This article presented a comparative experimental study on the behaviour of timber columns splice jointed at the mid-height with several splicing techniques, namely, plain steel jacket, steel jacket with injection of adhesive, ear hoops and CFRP wrapping, respectively.
The results showed that the load-bearing capacity and stiffness of the spliced columns reinforced with steel jackets and epoxy were capable of recovering up to 100% and 90.3% the level of the intact reference columns. These results suggest that such spliced methods may be acceptable when the splice height needs to exceed the current limit of within the bottom quarter length of the column.
The comparisons among columns reinforced with steel jackets without and with epoxy bond show that the adhesive injection into the splicing joint is important for the axial compressive behaviour of spliced columns reinforced with steel jacket.
The spliced columns with the traditional ear hoop reinforcement at the joint also exhibited satisfactory structural behaviour. The bearing capacity of spliced columns reinforced with ear hoops reached 87% the level of reference columns, while the stiffness also approached 88% of the reference columns.
The splicing columns with CFRP wrapping appeared to exhibit reasonable initial stiffness; however, the columns failed to achieve an acceptable axial strength, and this was mainly due to the low bending stiffness of the joint which could not provide an effective constraint on the development of lateral deflection. The amplified eccentricity resulted in accelerated P–δ effect and hence accelerated failure of the column. The effect tended to improve with the increase of the CFRP from one to two layers. This also indicated that enhancing the bending rigidity and strength of the CFRP joint could be a way to bring the CFRP method for column splicing up to an acceptable level.
The results of vertical strain in the splice joints suggest that columns with spliced joints using ear hoop or CFRP wrapping methods tend to result in better vertical alignment than columns with the steel jacket joints. Such practical installation aspect should also be taken into account in the actual choice of a particular technique for retrofitting timber columns in a heritage timber structure.
Footnotes
Declaration of Conflicting Interests
The author(s) declared no potential conflicts of interest with respect to the research, authorship and/or publication of this article.
Funding
The author(s) disclosed receipt of the following financial support for the research, authorship and/or publication of this article: This work was financially supported by the Twelfth Five-Year National Science and Technology Support Program (2012BAJ14B02), the Graduate Student Research Innovation Project of Jiangsu Province, China (KYLX15_0078), the Fundamental Research Funds for the Central Universities and the Priority Academic Program Development of Jiangsu Higher Education Institutions (CE02-1-36), the China Scholarship Council (201506090054).