
Abstract
Realistic problems restrict the application of many existing structural damage detection methods. Due to the requirement of a comparison between two system states, lack of appropriate baseline data may become one of the limitations to undertake structural health monitoring strategy. This article suggests a non-baseline damage detection approach based on the mixed measurements and the transmissibility concept and demonstrates it in truss structures. The algorithm uses the measurement data from the strains of the truss elements and the displacements of the truss joints, in which the displacements are utilized to estimate the baseline strains based on the transmissibility matrix from an initial finite element model. Wavelet-based damage-sensitive features are extracted from both estimated and measured strains to detect damages of the target elements. Numerical and experimental studies are performed to investigate the feasibility and effectiveness of the proposed approach. It is concluded from the instances that the robustness of the algorithm is realized when handling the measurement noise, modeling errors and the operational condition variability. These permit the potential development of the damage detection method for real structures in site.
Keywords
Introduction
With the aim of sensing and understanding the behavior of complex engineering structures, structural health monitoring (SHM) systems are widely implemented in the fields of aerospace, civil, and mechanical engineering. Vibration-based damage detection has received considerable attention in SHM community due to its flexible and inexpensive measurements that provide comprehensive in situ data (Doebling et al., 1996; Farrar and Lieven, 2007; Sohn et al., 2003). In general, vibration-based damage detection employs data-driven and model-based methods. The former analyzes the vibration signals and utilizes the correlation with structural damage to provide online identification, while the latter allows for quantifying damage and its effect on the performance of structures but often requires additional computation.
Truss structures are commonly used as the support skeletons to bear loading in infrastructures, such as long-span spatial structures and bridges. The presence of a large number of truss elements poses a practical challenge for vibration-based damage detection. Approaches based on modal parameters (e.g. natural frequency, mode shape, and modal damping) have a significant proportion and contribution related to SHM systems and vibration-based damage detection methods (Kim et al., 2003; Salawu, 1997; Wang et al., 2013). For SHM applications on truss structures, there are many experienced difficulties. First, the eigen-parameters were reported to have a high dependence on uncertainties of operational conditions such as environmental and load factors, the measurement noise, and the measurement precision. These variabilities interfered with damage detection results and even cover changes in damage indicators due to damage occurrence. Second, the identification of the modal parameters was difficult when the modes are not well-separated, which was often the case for truss bridges. More importantly, eigen-parameters that extracted from the measurement data of the accelerometer or displacement sensors on the truss joints are too global to provide information about damages of truss elements. Strain strictly reflects damage in the vicinity of a gauge, which could be used to extract a damage indicator to exhibit the localized behaviors where the damage takes places (Natke and Cempel, 1997; Wang et al., 2017). The development of fiber-optic sensor networks facilitates strain-based damage detection (Glisic et al., 2013). For example, An et al. (2013) presented a curvature difference method of strain waveform fractal dimension. This method was then used as a dependable damage detection technique for truss structures. Esfandiari et al. (2010) proposed a sensitivity algorithm to detect the loss of structural stiffness using strain responses from a finite element (FE) simulation of a truss structure.
However, there are still unfavorable factors making SHM challenging to implement in practice. A previous/reference state is required to provide the baseline data before any damage occurs, but for large numbers of aging in-service infrastructures, these baseline data in an undamaged state are basically impossible to obtain (Rodríguez et al., 2010). For these cases, numerical models need to be utilized to provide a reference state, while adopting an appropriate FE model and taking modeling errors to account are also problematic. Another consideration is the operational condition variability affecting the measurement data (Alamdari et al., 2017). It makes damage signal submerged in changes in data due to such variabilities. It creates the opportunity that even if there are the initial baseline data, it will be difficult to identify structural damages according to changes from the baseline data to the current measured data. Or in other words, lack of appropriate baseline data that match with current measured data will result in difficulties when employing the existing vibration-based damage detection methods.
The generalized transmissibility concept for a multiple-degrees-of-freedom system was proposed by Ribeiro et al. (2000). The transmissibility concept was initially used to formulate the relationship between two sets of spectrums with the transmissibility matrix that consists of the two frequency response functions, which can be evaluated from the experimental modal analysis or from the FE simulation. This transmissibility concept in frequency domain has also been used to identify the structural modal parameters (Devriendt and Guillaume, 2007; Urgueira et al., 2011; Wang and Ren, 2012), to detect the damage (Worden, 2003), and to conduct FE model updating (Steenackers et al., 2007). Law et al. (2011) developed a sub-structural response reconstruction method based on the transmissibility matrix from the given FE model. This method was then introduced into the wavelet domain (Li and Law, 2011). Wang et al. (2014) explored the method in the time domain and proposed a sensor placement method for the reconstruction of the acceleration data in truss structures. Li et al. (2012, 2013) presented a novel option of damage detection based on the transmissibility response reconstruction and model updating. Recently, Cheng et al. (2017) studied the advantage of using strains for vibration-based damage detection methods compared to displacement or acceleration measurements. The strain-transmissibility-based damage indicator was extracted using data from the distributed optical fiber sensor on a beam structure before and after damage.
Aiming at the challenge of SHM in truss structures without appropriate baseline data, this article proposed a non-baseline damage detection algorithm based on the mixed measurements and the transmissibility concept. The nodal displacements can provide more global information that is generally insensitive to local damage in a structure (Hester and Gonzalez, 2012; Sim et al., 2011; Wenzel, 2009). If the displacements are measured and the transmissibility matrix from an undamaged FE model of the target structure is given in advance, data corresponding to an undamaged (or previous/reference) state could be extrapolated based on the transmissibility concept. Previous studies of transmissibility showed that it was feasible to estimate the strain responses from the displacement responses. This article also presents a type of damage-sensitive feature (DSF) extracted from the estimated and measured strain responses. Numerical and experimental studies are conducted to investigate the feasibility and effectiveness of the algorithm. These include a simulation case with the effects of the measurement noise and modeling errors, and an exploratory experiment by a fabricated steel truss structure, in which the operational condition variability is taken as the illustration to substantiate the proposed approach.
Strain response estimation based on transmissibility concept in frequency domain
The continuous-time second-order equation of motion is expressed as

where

where

Thus, an m-size strain (output) vector of the structure in frequency domain can be obtained from equation (3)

where
In all of the nodal displacement responses, one set of responses at a node can be considered as the measured displacements that are thus referred to as the known set


where

where

Non-baseline damage detection algorithm for truss SHM
Based on equations (6) and (7), once the transmissibility matrix
The mixed measurements combining displacements and strains can be carried out on the target truss structure. Herein, the measured strains that belong to a current state can be compared with the estimated baseline strains. Feature extraction is carried out by analyzing the statistical pattern of the time histories of the strain response signals. In this study, the wavelet analysis is used to deal with both estimated and measured strains due to its ability to localize both transient and long-range phenomena of the vibration signals in both time and scale domains.
A mother wavelet function
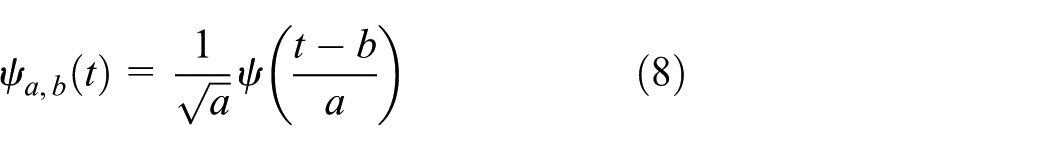
The continuous wavelet transform of a function
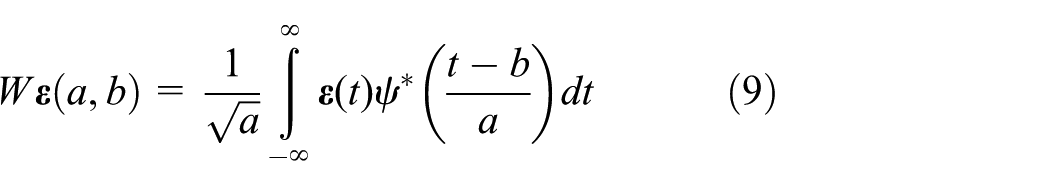
where * represents the complex conjugate. The Fourier transform of equation (9) can be written as
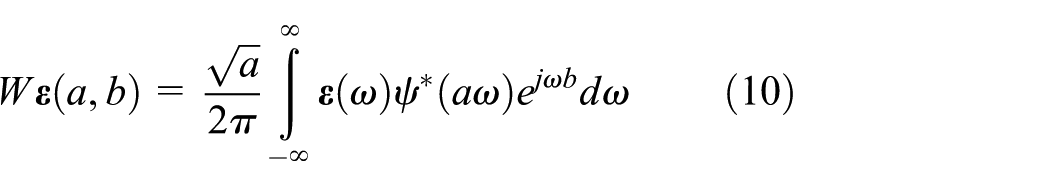
Nair and Kiremidjian (2007) have adopted the energy of the wavelet transform coefficients as the DSF. To maintain the same dimension as the strain data, the standard deviation of the wavelet transform coefficients is defined at appropriate scales as the DSF. For the ith set of strain response signals at scale
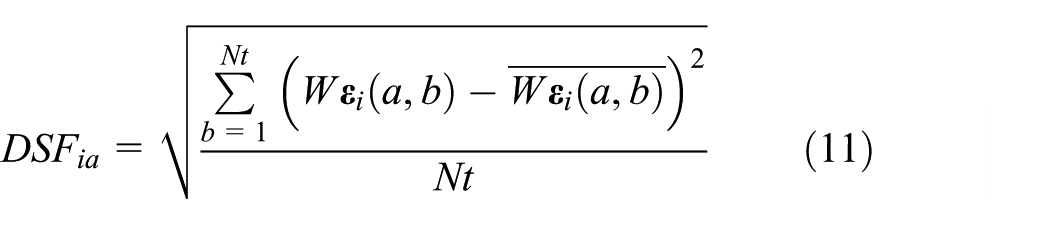
where
To address damage detection in the truss structure, a non-baseline damage detection algorithm is proposed in this article. As shown in a flowchart in Figure 1, the algorithm can be summarized in three steps:
Acquire the displacement responses at the assigned truss joints and the strain responses at the target elements and transform the displacement data into the frequency domain by the fast Fourier transform;
Compute the baseline strains in the frequency domain based on the measured displacements and the transmissibility matrix given by the FE model in advance according to equation (6) and transform the extrapolated strains into the time domain from the inverse fast Fourier transform;
Extract the DSFs from both estimated and measured strains based on the wavelet analysis according to equation (11) and identify the damaged elements by comparing the two DSFs.
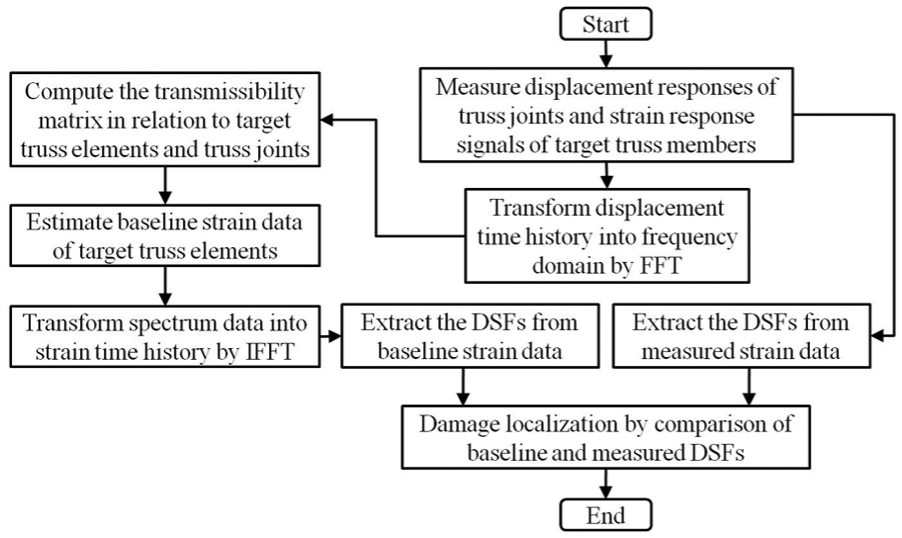
Flowchart of non-baseline damage detection algorithm.
Numerical example
Truss model and damage scenarios
To verify the effectiveness of the proposed algorithm, a truss structure was studied as a numerical example. It was modeled based on a realistic steel truss bridge. The truss consists of 16 joints and 29 elements, as shown in Figure 2. The height of the truss is 11 m, and the length of the horizontal chord is 8 m. The H-shape section has the web plate of 420 × 12 mm2, and the flange plate of 460 × 20 mm2 as shown in Figure 2. The intact elastic modulus of the truss element is 210 GPa, and the added mass of each gusset plate on the truss is 90 kg. Rayleigh damping was assumed in this study and the damping ratios for the first two modes were set to 0.02.
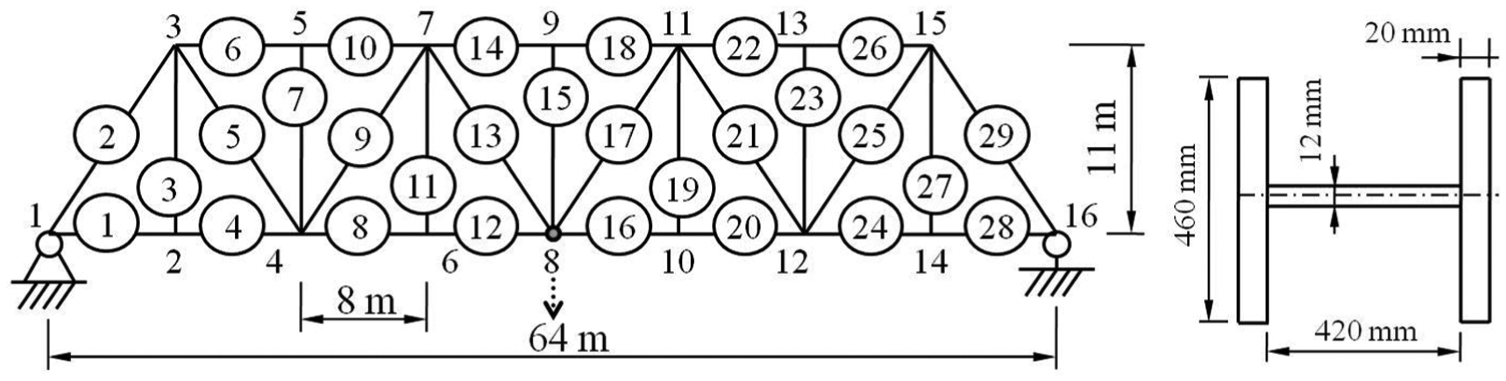
Schematic diagram of the truss model and its H-shaped element.
Random excitation, meaning the amplitude of the load on each time step follows Gaussian distribution, is applied on the node at the bottom of the mid-span of the truss bridge to simulate the environmental excitation. This white noise excitation, with a maximum of 700 kN and an acting duration of 6 s, is inflicted at Node 8. In this case, the strain responses from target truss elements and the displacement responses from only one truss joint (i.e. Node 6) were calculated using the Newmark-β method. The time step is 1/200 s, and the corresponding sampling rate was set to 200 Hz.
Damage was simulated by the elemental stiffness degradation. Both single- and multiple-damage scenarios were performed on the truss elements as listed in Table 1. Considering the damage identification at an early stage, only 5% and 10% stiffness reductions were included in damage scenarios.
Damage scenarios of numerical examples.
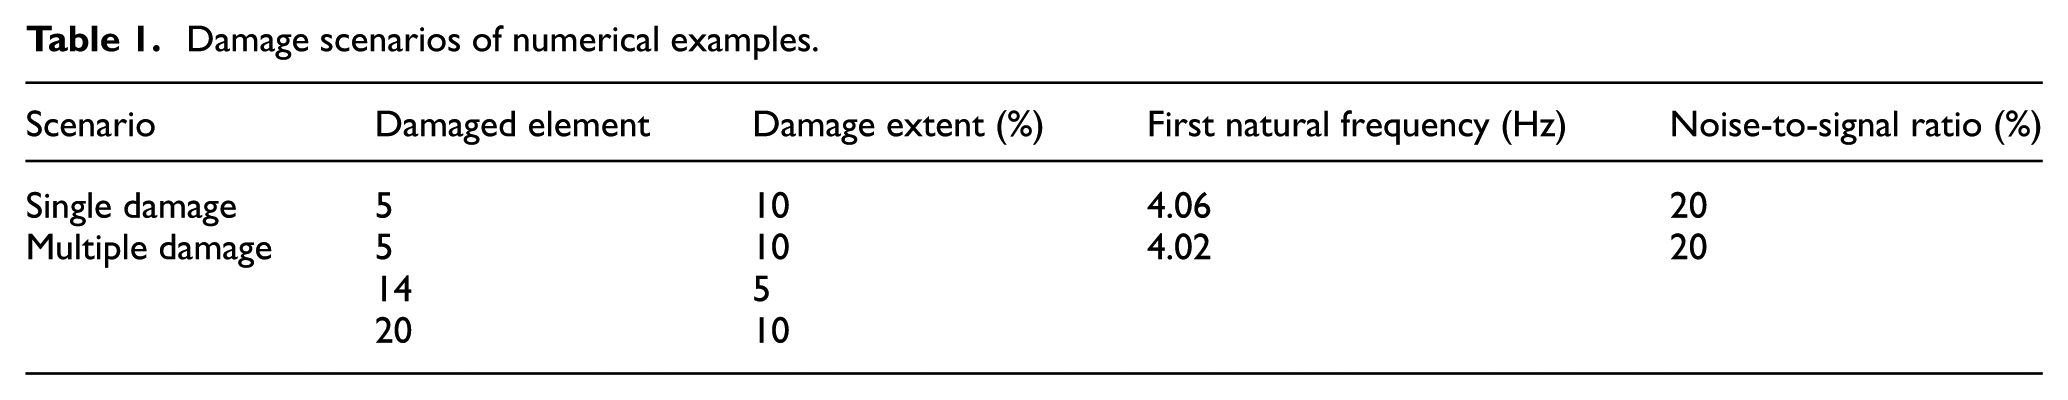
Meanwhile, the measurement noise was simulated to verify the robustness of the algorithm. Concretely, both strain and displacement signals were polluted by adding noise. The ratio of the root mean square value of the noise to the root mean square value of the signal was defined as noise-to-signal ratio (Nair and Kiremidjian, 2007). 20% noisy data (i.e. noise to signal ratio of 0.2) was added into both strain and displacement measurement data. Figure 3 shows the typical strain and displacement response data with noisy data.
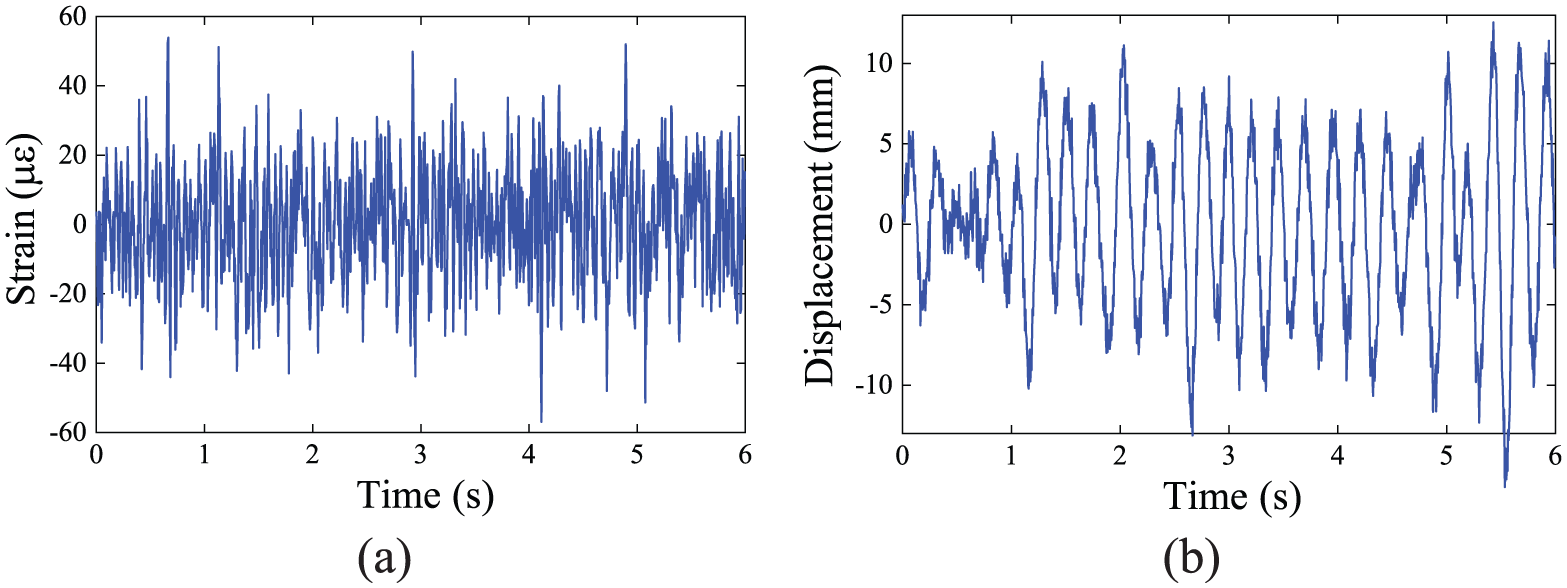
Typical strain and displacement responses in numerical examples: (a) strain–time history at Element 13 and (b) displacement–time history at Node 6.
Results of damage detection
The baseline strains were extrapolated from the measured displacements based on the transmissibility concept, and the DSFs were extracted from both estimated and measured (simulated) strains. The DSFs according to equation (11) were computed as the wavelet transform coefficients of the Daubechies wavelet of order 25 at appropriate scales. The Daubechies-like wavelets were selected due to their discrete wavelet counterparts that can be used when embedding the algorithm at the sensor level. The fourth scale of Daubechies wavelet of order 25 was extracted. The results of damage detection are shown by the histogram in Figure 4. Unlike a beam structure, on which the dynamic characteristics (e.g. mode shape or response DSFs) could be regularly distributed along the beam length to be able to determine local damage, the DSFs of the truss structure are irregular. Thus, it is quite indispensable for the truss structure to obtain the baseline data to detect damage.
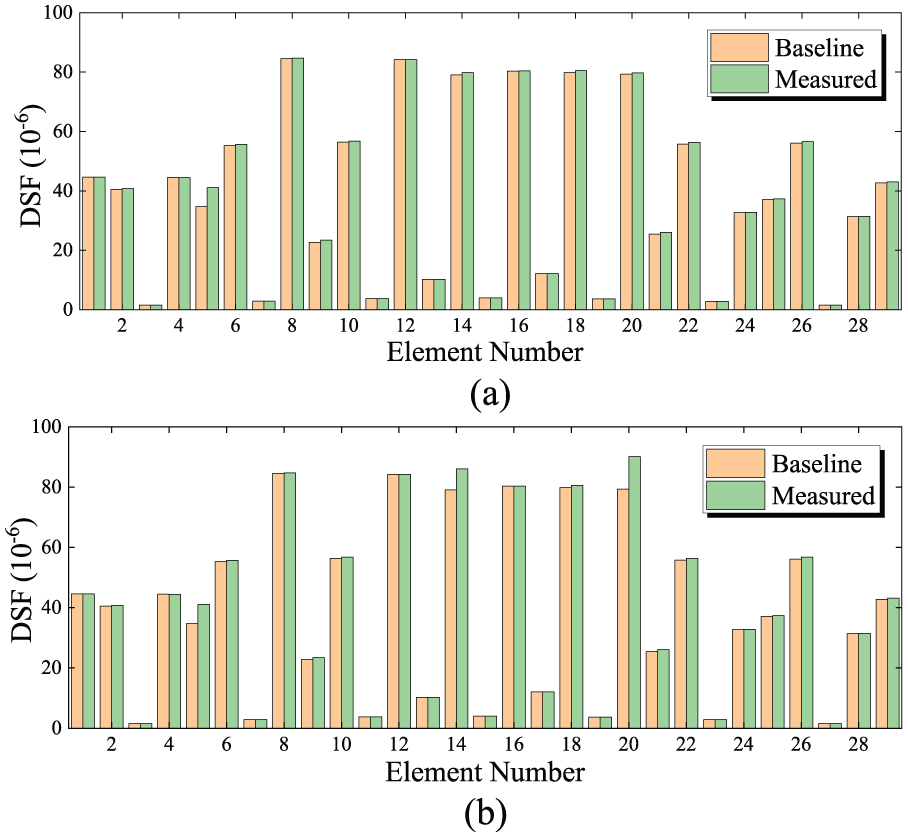
Results of damage detection using baseline (estimated) and measured DSFs by histogram: (a) single damage and (b) multiple damage.
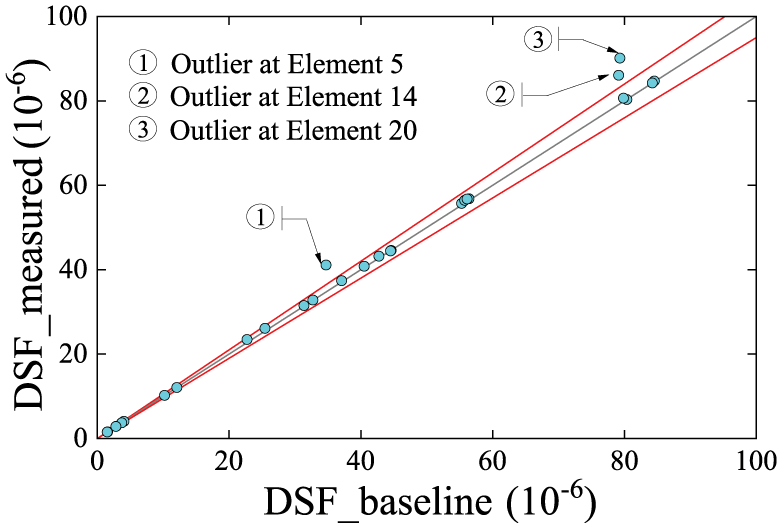
In order to visualize the baseline and measured DSFs to intuitively exhibit damages, a simple two-dimensional (2D) outlier chart was adopted. The x-axis denotes the baseline (estimated) DSFs and the y-axis denotes the measured DSFs. Ideally, it is thought to be undamaged when the baseline and measured DSFs are equal as shown by the gray dashed line y = x in the outlier chart. However, the ideal situation is as good as impossible. Considering variabilities during measurement, the differences between the baseline and measured DSFs can also be found from experiences even though being the undamaged state. Therefore, as long as a data point does not deviate the line y = x too far away, the state is still considered to be undamaged. Note that 5% is a small probability event. The situation that the data points in the outlier chart drop into the zone between lines y = 1.05x and y = 0.95x (shown as the red solid lines, referred as ± 5% error lines) will be assumed to be undamaged.
Meanwhile, since the damage on the element is merely considered as the stiffness degradation in this study, the measured strains of the damaged element will be increased. The fact that wavelet-based DSFs in a damage state should be higher than ones in an undamaged state makes the measured DSFs likely greater than the baseline DSFs in the outlier chart. Combined with the error lines, once the data point locates above the 5% error line, the corresponding element is considered as the damage one.
In fact, whether damage occurs or not, the data points that are referred as outliers could also locate above the 5% error line or below the −5% error line, which is usually, attributed to greater multi-factor interferences during measurement. The phenomenon that an outlier above the 5% error line when the element is undamaged is commonly called “positive falsity,” but if an outlier is found below the −5% error line while damage occurs, it is called “negative falsity.” The emergence of the latter situation will reduce the credibility of a damage detection algorithm.
Figure 5 shows the same data as Figure 4 but compares the DSFs by means of the outlier chart. It is clear that the outliers indicate accurately the damage elements in both single and multiple-damage scenarios using 20% noisy data without “positive” or “negative” falsity. The wavelet-based DSF at an appropriately high scale is robust with respect to handling noise.
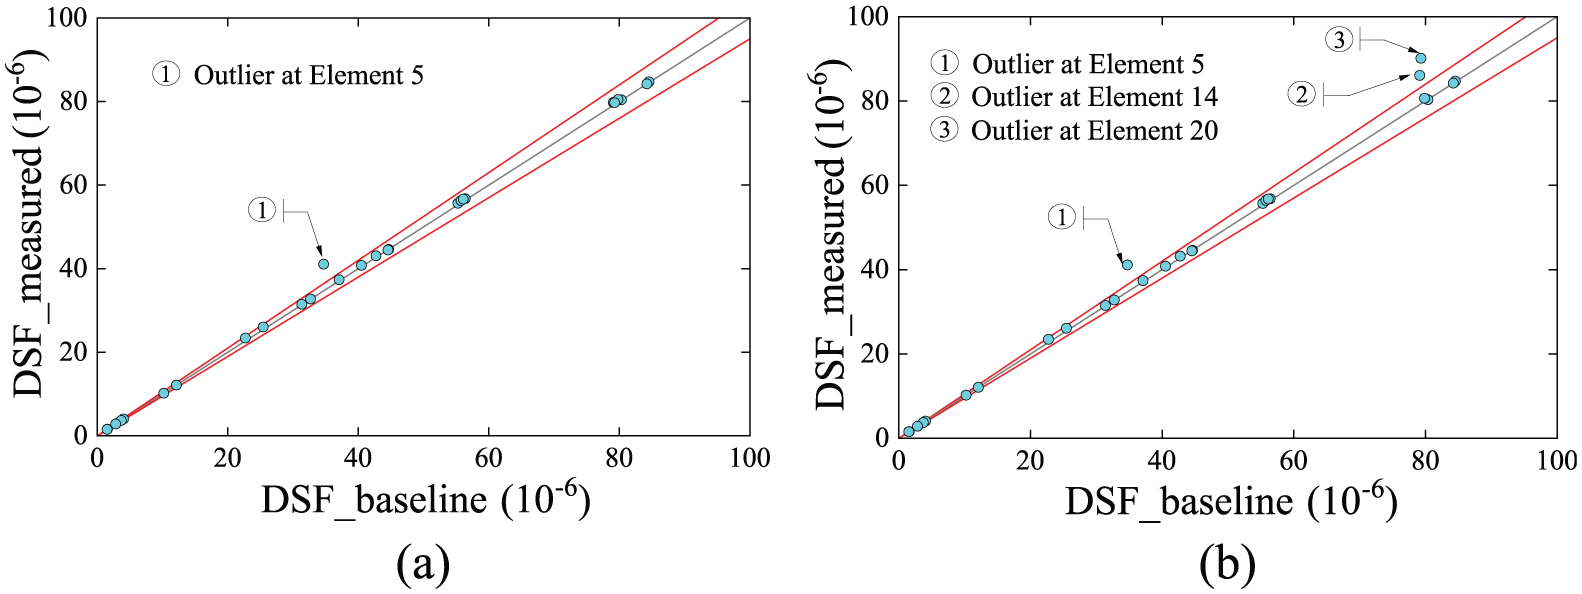
Results of damage detection using baseline (estimated) and measured DSFs by outlier chart with ±5% error line (red solid line): (a) single damage and (b) multiple damage.
Effects of modeling errors
The FE model was used to form the transmissibility matrix for the baseline estimation in the algorithm process. The influences of modeling errors in the given FE model, special for the mass, damping, and stiffness parameters on the performance of the proposed approach was investigated in this section. The multiple-damage scenario in “Results of damage detection” under section “Numerical example” was adopted. Three types of modeling error cases were considered. First, the mass density and the damping ratio were over-estimated initially by 15% and 50%, respectively. Second, the elastic moduli of all truss elements were assumed to reduce 20%. Finally, the uneven stiffness distribution has been considered. The elastic moduli of material in different truss elements were assumed to exhibit a normal random distribution (Furukawa and Otsuka, 2006) with a mean of 210 GPa and a 1% and 5% coefficients of variance, respectively, as shown in Figure 6. The first two modeling errors have been included, and the strain and displacement data were also added by 20% noise in this case.
Modeling errors in uneven stiffness distributions.
The damage identification results of the first two modeling error cases are shown in Figures 7 and 8, respectively. It can be seen that the simulated damages have been identified accurately at Elements 5, 14, and 20. The initial modeling errors resulted from the mass density, the damping ratio, and the global stiffness have no impact on the performance of the non-baseline damage detection algorithm so that the results agree well with the ones shown in Figure 5(b). The reasons can be attributed to the algorithm that makes use of the transmissibility matrix, seen in equations (6) and (7), which is formed by the displacement and strain frequency response functions. When the vibrations are concentrated on the low-frequency band, the frequency response function matrices are dominated by the stiffness matrix
Results of damage detection including over-estimated damping ratio and mass density (multiple-damage scenario).
Results of damage detection including modeling errors in global stiffness (multiple-damage scenario).
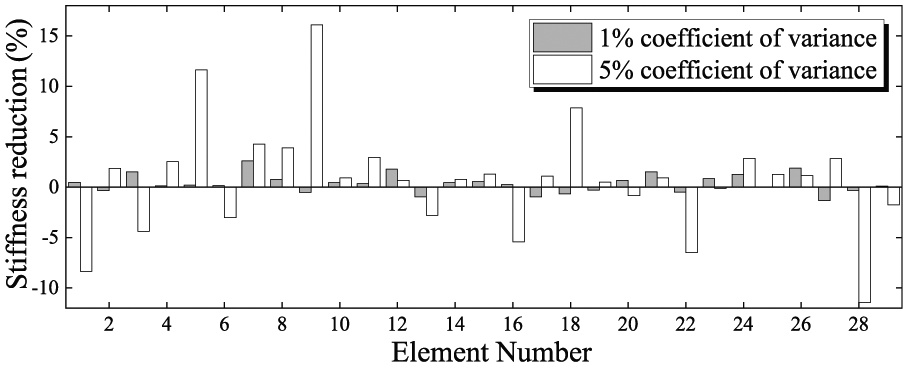
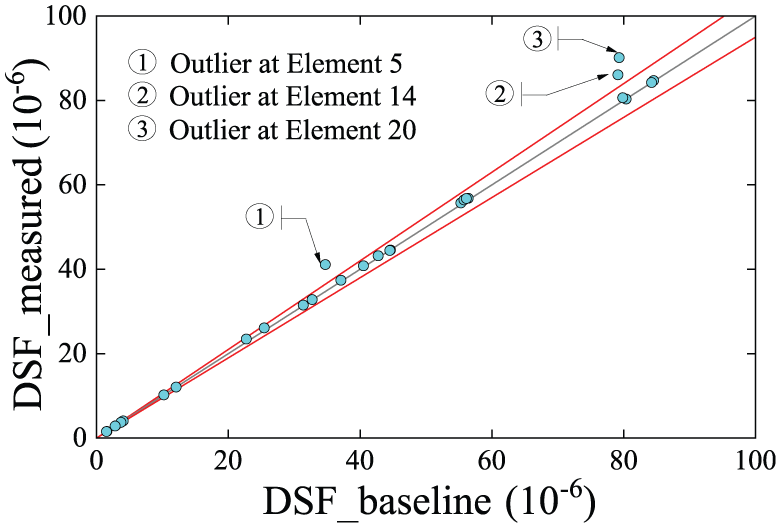
Figure 9 shows the results of damage detection on the case of the uneven stiffness distributions. For the 1% coefficient of variance, Elements 5, 14, and 20 with stiffness reductions can be clearly identified, as shown in Figure 9(a). For the 5% coefficient of variance, as shown in Figure 9(b), many data points (besides Elements 5, 14, and 20) that lie outside the zone between the ±5% error lines were observed. Two “positive” falsities related to the undamaged Elements 9 and 8 have been found. However, all the damage elements can be accurately identified without “negative” falsity. The damage element with 5% minor damage extent in the multiple-damage scenario had still been accurately identified even if there are 5% random stiffness errors. It may be concluded that the non-baseline damage detection algorithm shows the robustness when there were modeling error interferences to a certain extent.
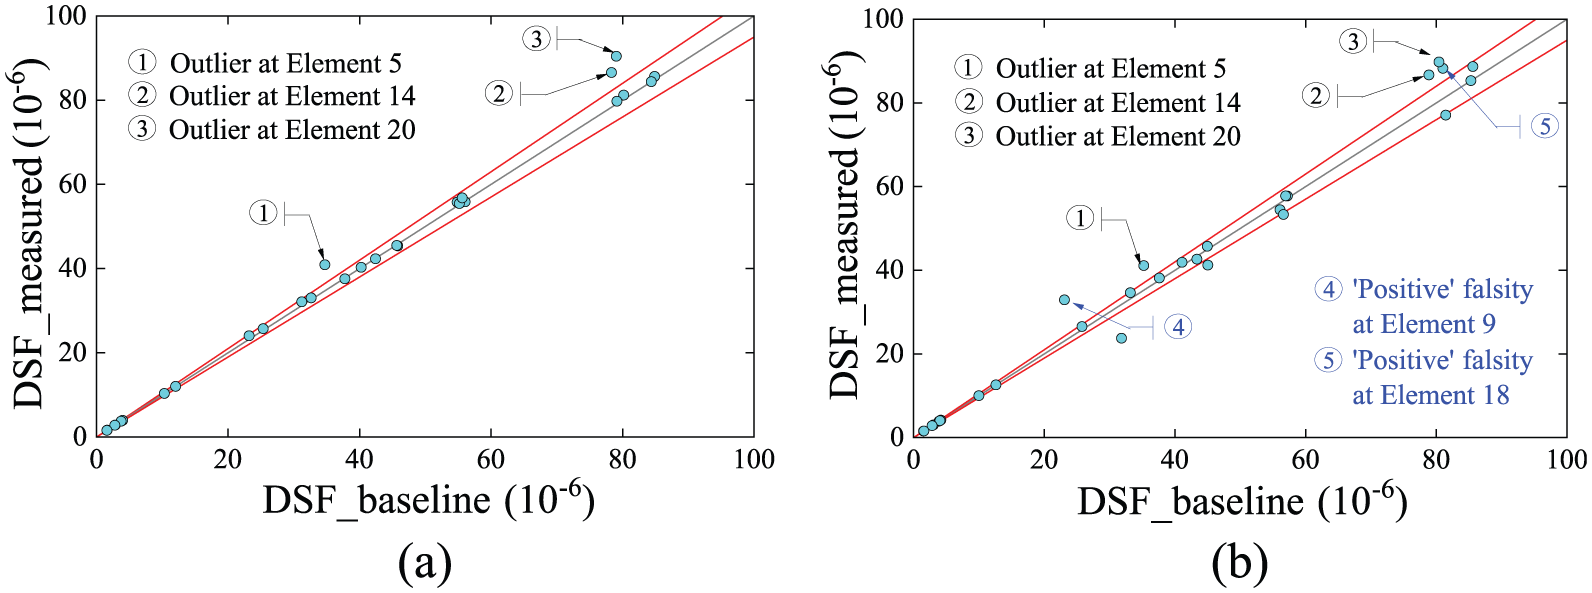
Results of damage detection including modeling errors in uneven stiffness distribution (multiple-damage scenario): (a) 1% coefficient of variance and (b) 5% coefficient of variance.
Experimental investigation
Truss model and experimental setup
An experiment was conducted on a 2D steel truss structure to further investigate the proposed approach. The truss structure was designed and fabricated in laboratory as shown in Figure 10(a) and (b). The truss structure comprises 10 joints and 17 elements. Four hinged supports were fixed on the reaction system tightly as shown in Figure 10(b) to avoid the torsion effects caused by the out-plane motions. The truss joint employs the pin-shaft connection and consists of roller-bearings to maintain the free-rotating capability. Each joint has four roller-bearings in series for the mass consistent as shown in Figure 10(b) in detail. The truss element (rod) with a diameter of 5 mm has the threaded connections with the roller-bearings at its ends. The length of the horizontal and vertical elements between the centers of two adjacent nodes is exactly 200 mm, but the length of all diagonal elements is 283 mm.
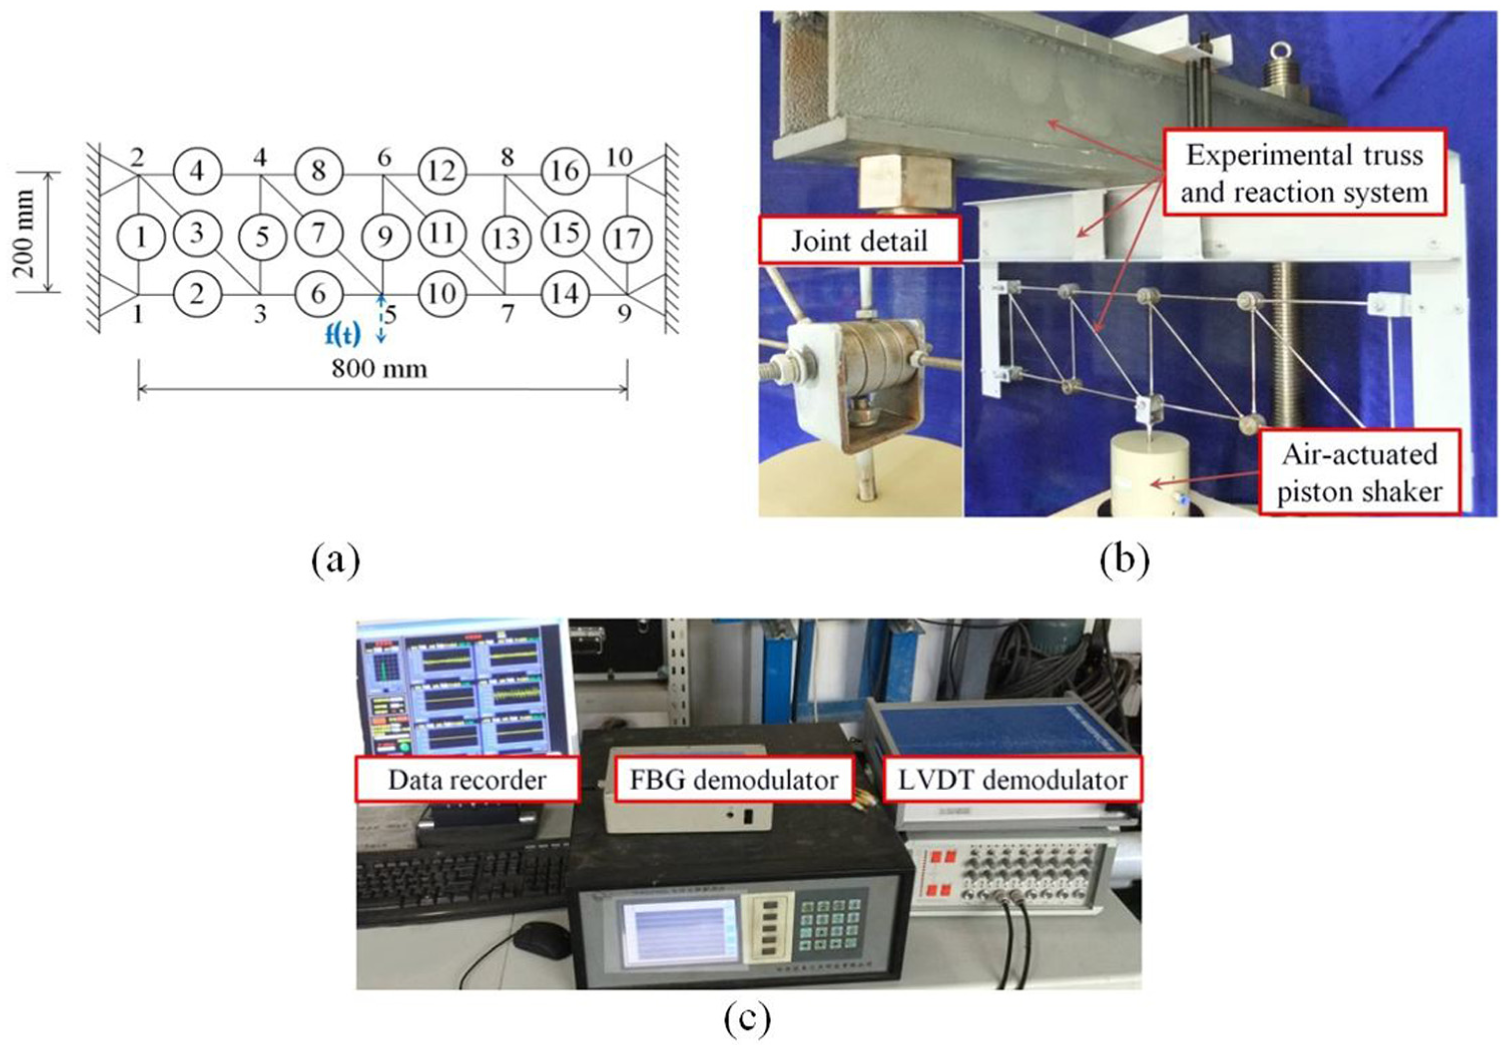
Experimental setup and data acquisition system: (a) experimental truss model, (b) experimental setup, and (c) data acquisition system.
The vertical random excitations were applied to provide a series of non-white noise oscillations by an air-actuated piston shaker at Node 5 with the excitation bandwidth of 0–50 Hz. The axial strains of all the stressed elements were measured by the fiber Bragg grating (FBG) sensors. The FBGs were bonded on the rod and arranged along the consistent vertical plane of the 2D truss structure. The TFBGD-9000 FBG demodulator as shown in Figure 10(c) was used, which changes optical signals into digital signals. Strain data were recorded at a sampling rate of 200 Hz. The strokes of the piston shaker were recorded by a linear variable differential transformer (LVDT) sensor so that only the vertical displacements were measured at truss joints with a sampling rate of 1000 Hz. The HK-9304 signal amplifier and the WE-5921 AD converter were used to change electrical signals into digital signals. Displacement data were recorded with a sampling rate of 200 Hz by the uniform interval extraction. A series of steady data segments were picked on the sample time period from 1 to 11 s from several tests. Typical strain and displacement response data are shown in Figure 11.
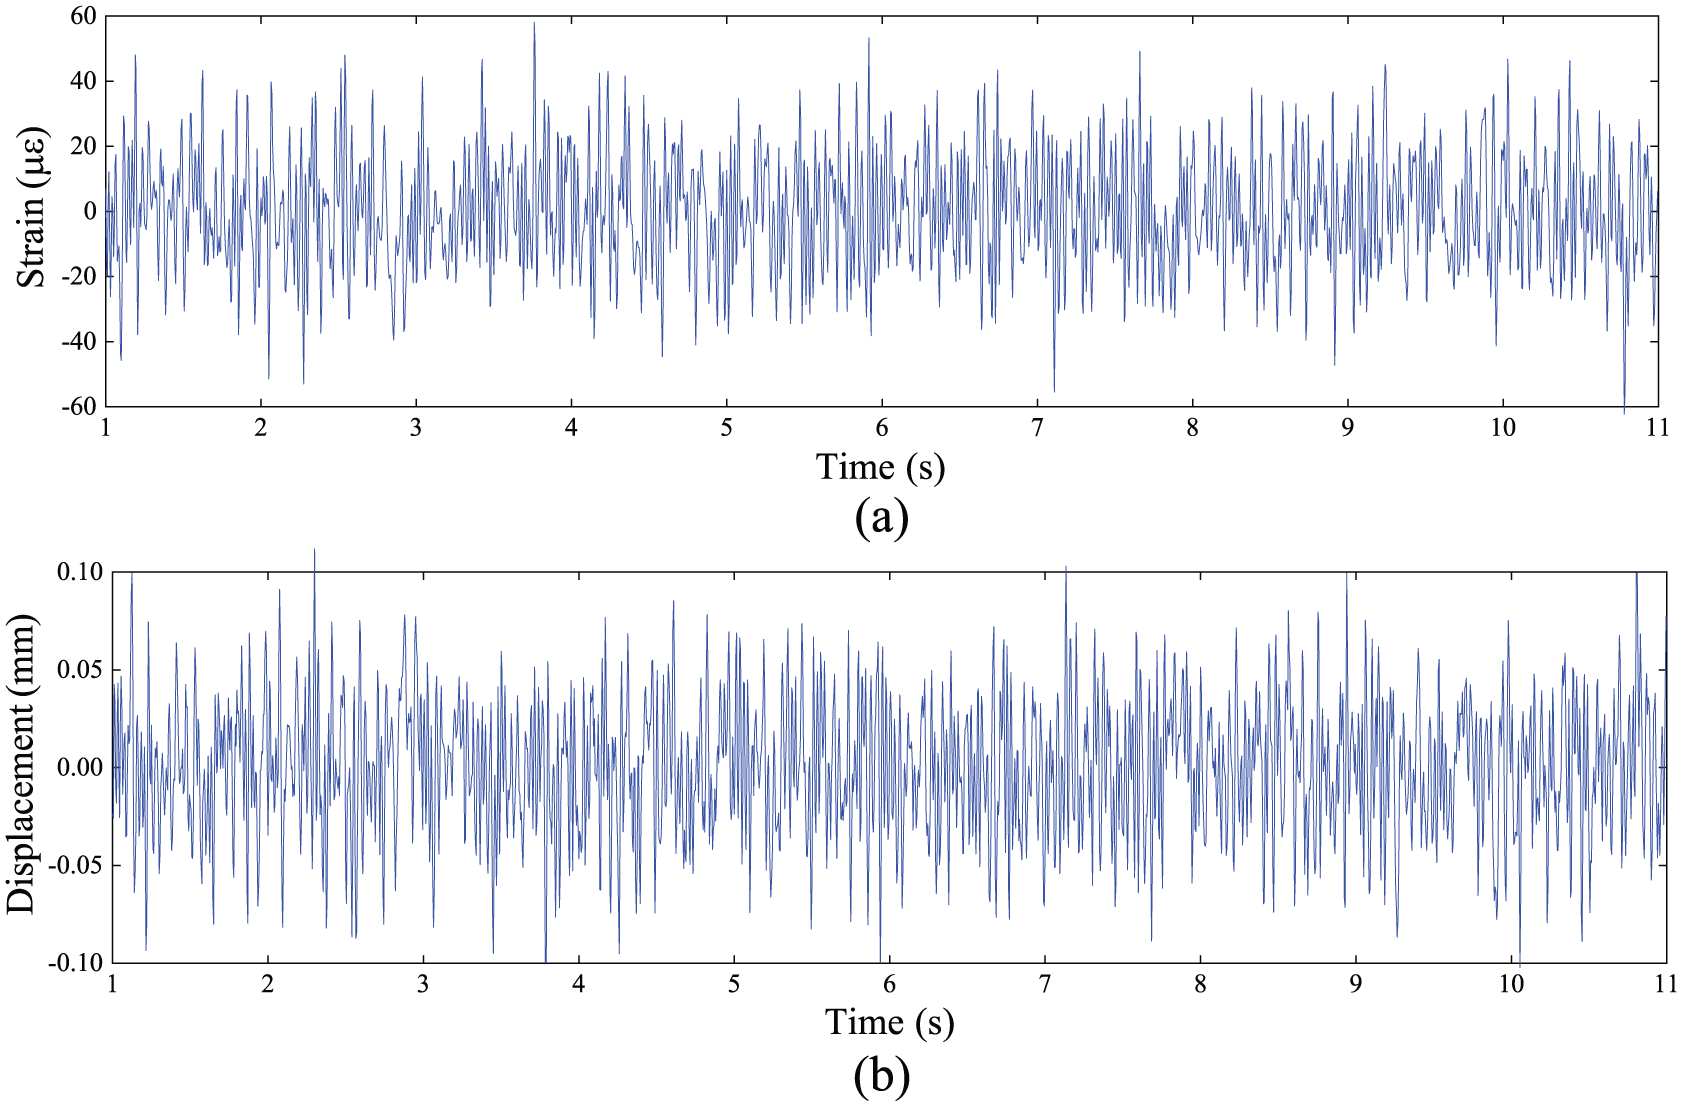
Typical strain and displacement responses in the experiment: (a) strain–time history at Element 13 and (b) displacement–time history at Node 5.
Results of damage detection
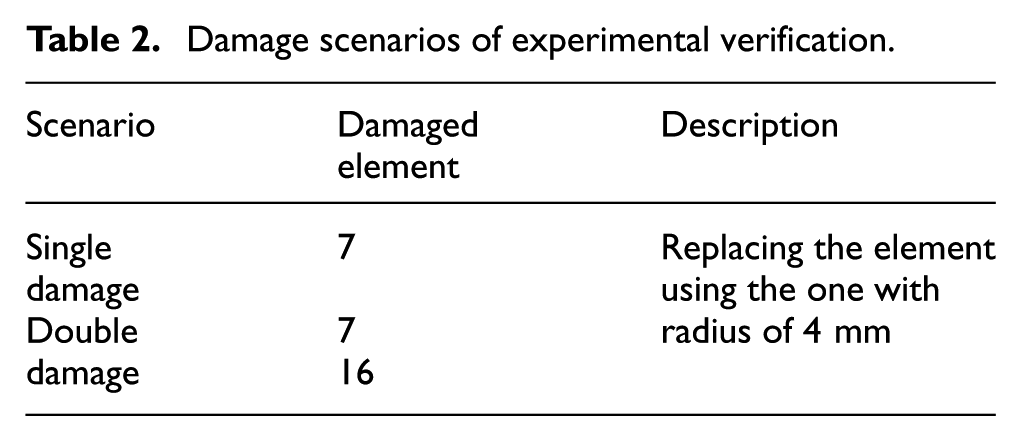
Damage was approximately simulated by a decrease in the cross-sectional dimensions at an element. The damage scenarios are listed in Table 2. The damage rods with a diameter of 5 mm were then replaced by a 4-mm rod.
Damage scenarios of experimental verification.
Based on the study in section “Effects of modeling errors,” only the stiffness modeling was performed on the experimental truss to calculate the transmissibility matrix. The elastic modulus of the steel rod is assumed to 206 GPa. There may be discrepancies between the initial FE model and the actual truss structure, such as manufacturing defects of threaded connections and frictions of pin-shaft connections. Besides, the deployment accuracy of FBG sensors and the torsion effects caused by the out-plane motions could also be considered as the serious interferences during measurement.
Although there are above multi-factor interferences that led to a “positive” falsity at Element 3 as shown in Figure 12(b), the damage elements were still identified in whether single and multiple-damage scenarios. It is noted that when an outlier locates below the 5% error line, there are two possible damage detection results: the element is undamaged with the corresponding data point below the 5% error line; and the element is damaged with the corresponding data point below the 5% error line at the same time. The latter situation is regarded as the “negative” falsity. However, the “negative” falsity could not be found in the experimental results. The reason why such data points were distributed in the outlier chart is that the damages of the elements make the measured DSFs greater than the baseline DSFs. It is brought to the data points related to damage hard to appear below the −5% error line, even though there were great multi-factor interferences. It is shown that the demonstration work shows promising development regarding the proposed approach when confronted without baseline and with only the initial stiffness modeling.
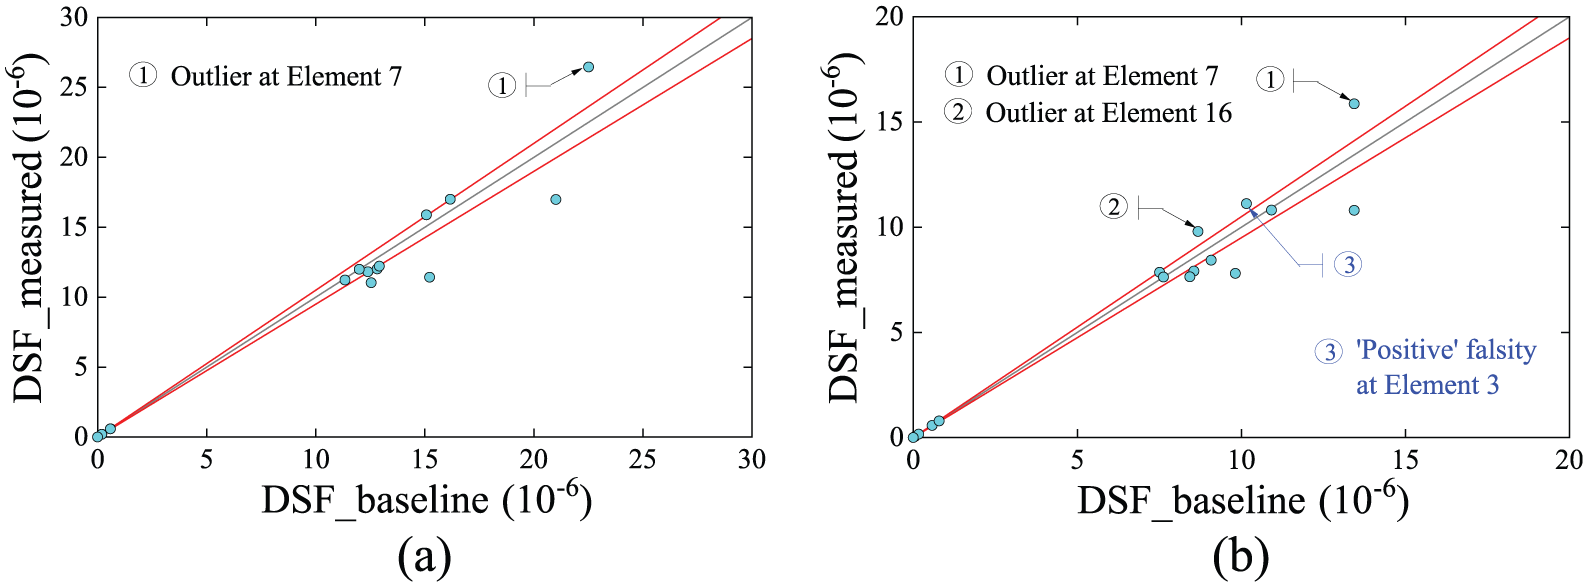
Results of damage detection using baseline (estimated) and measured DSFs by outlier chart: (a) single damage and (b) multiple damage.
Consideration of operational conditions
Damage detection is based on the premise that structural damages will cause changes in features extracted from static and dynamic response data. However, data in situ are easy to be affected by uncertainties of operational conditions such as environment and load factors. Considering the strain-based damage indicators, changes in indicators due to temperature or loading conditions different from damage occurrence may interfere with the damage detection results, which would lead to a meaningless comparison between the initial baseline and the measured data. This section intends to assess the performance of the algorithm related to the operational condition variability. Concretely, the operational condition variability to which the experimental truss was subjected was simulated by the change in the loading point and different loading amplitudes from the shaker at the laboratory level.
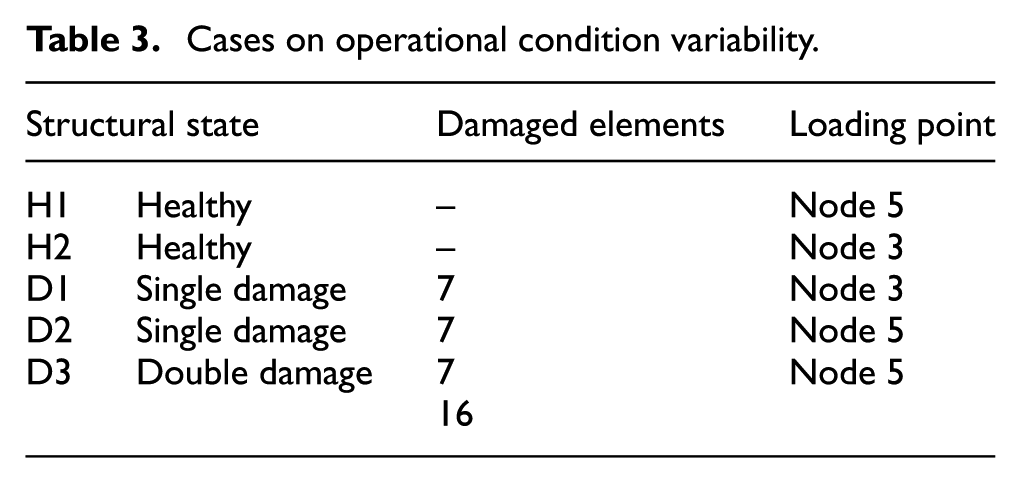
Five cases with different structural state were chosen, that is, H1, H2, D1, D2, and D3, respectively, as listed in Table 3. H1, D2, and D3 were associated with the loading point of Node 5, in which H1 represented the healthy state and in fact, D2 and D3 were just single- and double-damage scenarios in “Results of damage detection” under section “Experimental investigation,” respectively. H2 and D1 were associated with the loading point of Node 3, in which H2 represented the healthy state and D1 had the same damage scenario as D2.
Cases on operational condition variability.
In order to compare the proposed approach, a proven strain-based damage indicator, that is, strain statistical moment (SSM), was used (Li and Xia, 2013; Wang et al., 2017). The damage detection results of Element 7 was illustrated. As shown in Figure 13(a), the measured SSMs cannot characterize the five structural states due to the effect of different loading conditions. For example, the SSMs on the state D1 are lower than the one on the state H1. It may imply from Figure 13(a) that the change due to the applied forces is larger than the one due to damage occurrence. Meanwhile, to eliminate the detrimental effect of different loading conditions, a common practice is to normalize the original SSMs using a reference element. Element 16 could be set as the reference element since the selection of the reference is arbitrary with no prior knowledge. Figure 13(b) shows the normalized SSM on the five structural states. Damage indicators of the state D1 and D2 increase obviously, but the one of the state D3 is observed to decrease. Figure 13(c) shows both estimated and measured DSFs on the five structural states based on the non-baseline damage detection algorithm. It can be seen that besides the measured damage indicators, the baseline damage indicators can be estimated at each structural state.
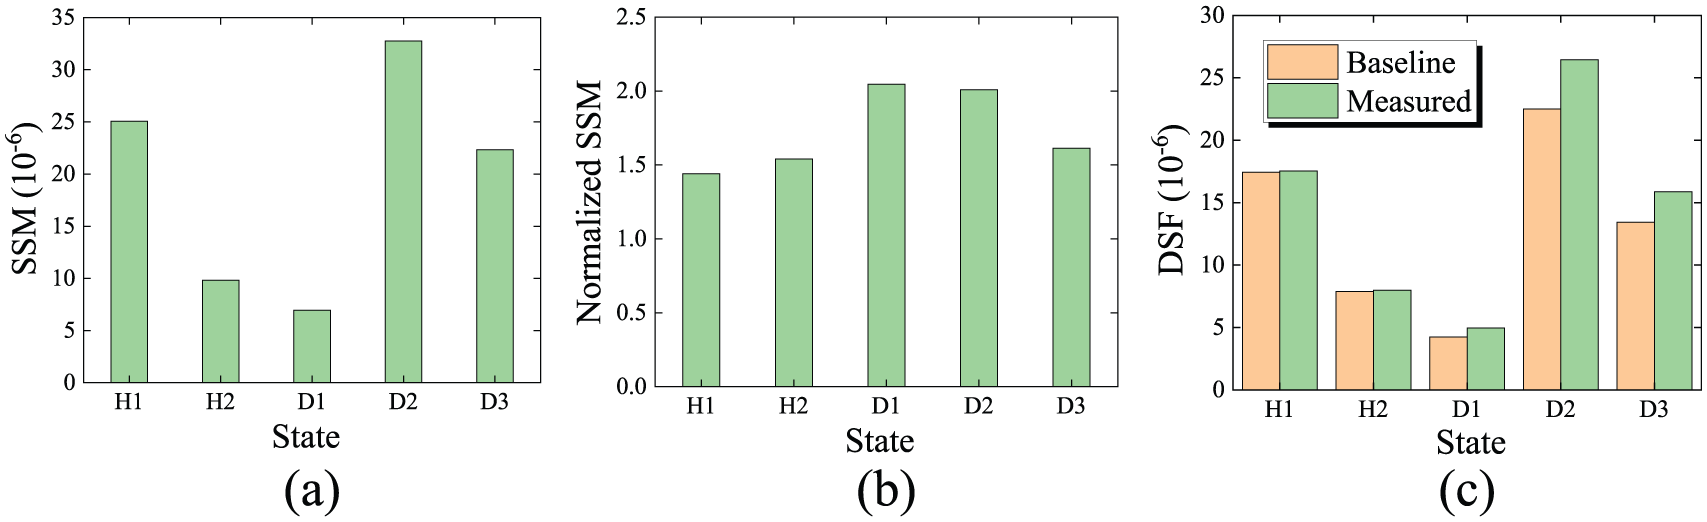
Comparison of three types of damage indicators at Element 7: (a) SSM, (b) normalized SSM, and (c) DSF-based on the proposed approach.
To show the results of damage detection clearly, the relative percent errors were calculated according to the measured and baseline values from each type of damage indicator, giving
where
The damage detection results are shown in Figure 14. Damage states cannot be clearly identified by the SSMs due to the effect of different loading conditions. The normalized SSMs can identify damages at state D1 and D2 effectively but cannot accurately identify damage at state D3 because the reference element (Element 16) is damaged at this structural state. The non-baseline algorithm does not use the reference element normalization so that it does not have this limitation. All the damaged and undamaged states can be identified without using any reference element. The result shows that the proposed approach overcomes the effect of the operational condition variability by employing an appropriate baseline estimation strategy.
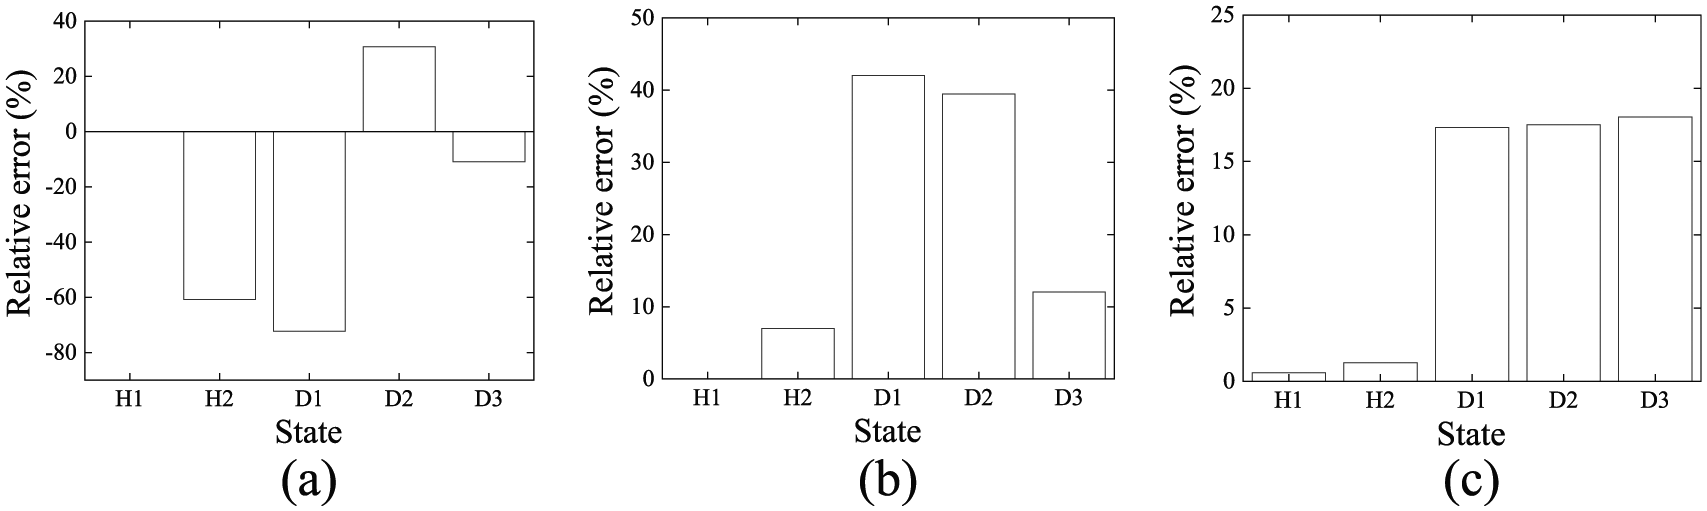
Results of damage detection at Element 7: (a) SSM, (b) normalized SSM, and (c) DSF-based on the proposed approach.
Discussion
Numerical and experimental studies were performed to validate the feasibility and effectiveness of the non-baseline damage detection algorithm, especially for its ability to handle the measurement noise, modeling errors, and the operational condition variability. The work presented in this article should be seen as a first step toward a framework for a non-baseline damage diagnosis of in-service infrastructure. Artificial excitations were applied at a single truss joint and the elemental stiffness degradation was considered as the damage scenarios. The proposed approach does not require an iterative optimization process, but it relies on the baseline estimation at each structural state. However, the baseline estimation based on the transmissibility relationship is questioned when the structure system gives rise to nonlinear vibration characteristics such as the vehicle–bridge interaction vibration. This baseline estimation algorithm should be improved in subsequent studies. Meanwhile, it is well known that the damage on the truss joint itself is one of the key failure modes for the truss structures. More attention should be paid on the damage on the truss joint that affects adjacent elements to facilitate the proposed approach.
Conclusion
A non-baseline damage detection approach based on the mixed measurements and the transmissibility is proposed and demonstrated in truss structures in this article. The algorithm uses the measurement data from the strains of the truss elements and the displacements of the truss joints, in which the displacements are utilized to estimate the baseline strains based on the transmissibility matrix from an initial FE model. Wavelet-based DSFs are extracted from both estimated and measured strain responses to determine damages of the target elements. Numerical and experimental studies are employed to validate the effectiveness of the proposed approach. Concluding remarks from the investigations are summarized as follows:
It is indicated from the numerical example that the outlier chart that consists of the estimated and measured DSFs could identify minor damages accurately in a heavy noise environment. The algorithm conducts the baseline estimation using the transmissibility matrix, which was dominated by the stiffness matrix of structural FE model and allowed modeling errors to a certain extent.
The validity of the approach is demonstrated using the mixed measurements combining FBG and LVDT monitoring systems in a truss structure at the laboratory level. The measurement data from multiple tests were employed to substantiate the proposed approach. Compared with the existing strain-based damage indicator, the non-baseline damage detection algorithm overcomes the effect of different loading conditions by employing the baseline estimation strategy, which is useful in the event of the operational condition variabilities from the SHM system in site.
Footnotes
Declaration of Conflicting Interests
The author(s) declared no potential conflicts of interest with respect to the research, authorship, and/or publication of this article.
Funding
The author(s) disclosed receipt of the following financial support for the research, authorship, and/or publication of this article: The work was financially supported by the National High Technology Research and Development Program of China (“863” Project) with grant no. 2014AA110401.