
Abstract
The vortex-induced vibration behavior and mechanism of an asymmetrical composite beam cable-stayed bridge is investigated by means of aerodynamic sectional tests and computational fluid dynamics methods. Tests are performed for the bridge deck under five wind attack angles (0°, ±2.5°, and ±5°) and two wind directions (0° and 180°) during the completion and construction stages. The influence of damping ratios, wind barriers, and vehicles on the vortex-induced vibration behaviors of the bridge deck is examined. The test and simulation results show that the properties of the vortex-induced vibrations vary with the wind direction as a result of the asymmetry of the main girder. The vertical maximum vortex-induced vibration amplitude of the bridge deck was found to occur at the wind attack angle of −5° and wind direction of 180°, while the torsional maximum was found at the wind attack angle of −5° and wind direction of 0°. Both vehicles and wind barriers have amplification effects on the vortex-induced vibrations of the bridge deck when the wind direction is 180°. The vortex-induced vibration of the bridge deck can be effectively mitigated when the damping ratio increases from 0.5% to 1.5%. The vortex-induced vibration mechanism of the bridge deck under different wind directions can be attributed to the same vortex shedding mode (the Kelvin–Helmholtz vortex and the Kármán vortex street). While, the location of the vortex generation and direction of the vortex shedding at the wake are strongly influenced by the wind directions, resulting in the variation of the vortex-induced vibration properties of the bridge deck with the wind direction. This study provides a guideline for the design of bridges with asymmetrical main girders to suppress the VIV.
Introduction
Long-span bridges are subjected to many aerodynamic and aeroelastic problems as the growth of their span increases their sensitivity to wind loads. Vortex-induced vibration (VIV) is one of the major challenges associated with long-span bridges; it has been observed and discussed in much of the early literature (Battista and Pfeil, 2000; Fujino and Yoshida, 2002; Larsen et al., 2000 and Ge et al., 2011). Although the VIV of a bridge deck is not as dangerous as flutter, it not only causes discomfort to the drivers, but also gives rise to long-term fatigue damage in bridge structures (Ehsan and Scanlan, 1990; Lee et al., 1997). Furthermore, as bridges are complicated bluff bodies, perfect aerodynamic optimization is difficult to achieve in the wind-resistance design process. Therefore, it is of great importance to investigate the VIV behavior of bridge decks and identify an effective way to eliminate this phenomenon. In recent decades, numerous studies have been conducted focusing on the VIV performance of long-span bridges (Bearman and Owen, 1998; Ehsan and Scanlan, 1990; Griffin and Hall, 1991; Liu et al., 2018; Matsumoto, 1999; Yang et al., 2016). Studies of VIV suppression and control for various bridges follow and a number of meaningful conclusions are summarized (Camarri and Iollo, 2010; Chen et al., 2014; Du and Sun, 2015; Fujino and Yoshida, 2002; Ma et al., 2018; Wu and Kareem, 2013). Common VIV countermeasures include both aerodynamic and mechanical countermeasures (Chen et al., 2013). One commonly used aerodynamic countermeasure is the application of additional components on the bridge deck such as wind fairings, guide vanes, and wind barriers. The modification of the air flow around the main girder by attaching or adjusting the parameters of nonstructural components with particular shapes (e.g. railings, maintenance rails, or crash barriers) at particular locations on the girder has also proven to be useful (Zhou et al., 2015). On the other hand, previous research has proved that tuned mass dampers (TMDs) are one of the most effective mechanical countermeasures for controlling the VIVs of long-span bridges and are therefore widely used (Morga and Marano, 2014; Xing et al., 2013). The phenomena and mechanisms of the VIVs of long-span bridges with symmetrical girders were primarily investigated in the aforementioned studies. Nevertheless, the VIVs of long-span bridges with asymmetrical girders have rarely been involved.
In this article, the Gerald Desmond Bridge Replacement, which was characterized by asymmetrical composite sections, was selected as a case study to investigate the VIV performance of this type of bridge deck. Wind tunnel tests are performed for the main girder (<ι><ι><ι>λL</ι></ι></ι> = 1:45) under five wind attack angles (0°, ±2.5°, and ±5°) and two wind directions (0° and 180°) during both the completion and construction stages. The influence of damping ratios, wind barriers, and vehicles on VIV behavior is examined. Useful results regarding the VIV behavior of the bridge deck, as well as suppression countermeasures, are obtained and discussed. The flow pattern around the asymmetrical bridge deck is performed by the computational fluid dynamics (CFD) method. In sum, this study could potentially contribute to further understanding of the VIV performance and mechanism of asymmetrical composite beam bridges and provide a design guideline for VIV suppression of asymmetrical bridge decks.
Experimental setup
Description of the bridge
Figure 1 illustrates the configuration and typical cross-sections of the Gerald Desmond Bridge Replacement located in Los Angeles. The selected bridge is a composite beam cable-stayed bridge with an overall length of 609.6 m and a main span length of 304.8 m. The main girder is 52.7 m in width and 3.2 m in depth. The bridge is supported by two main towers. The west bridge tower has a height of about 157 m measured from the foundation to the tower top.
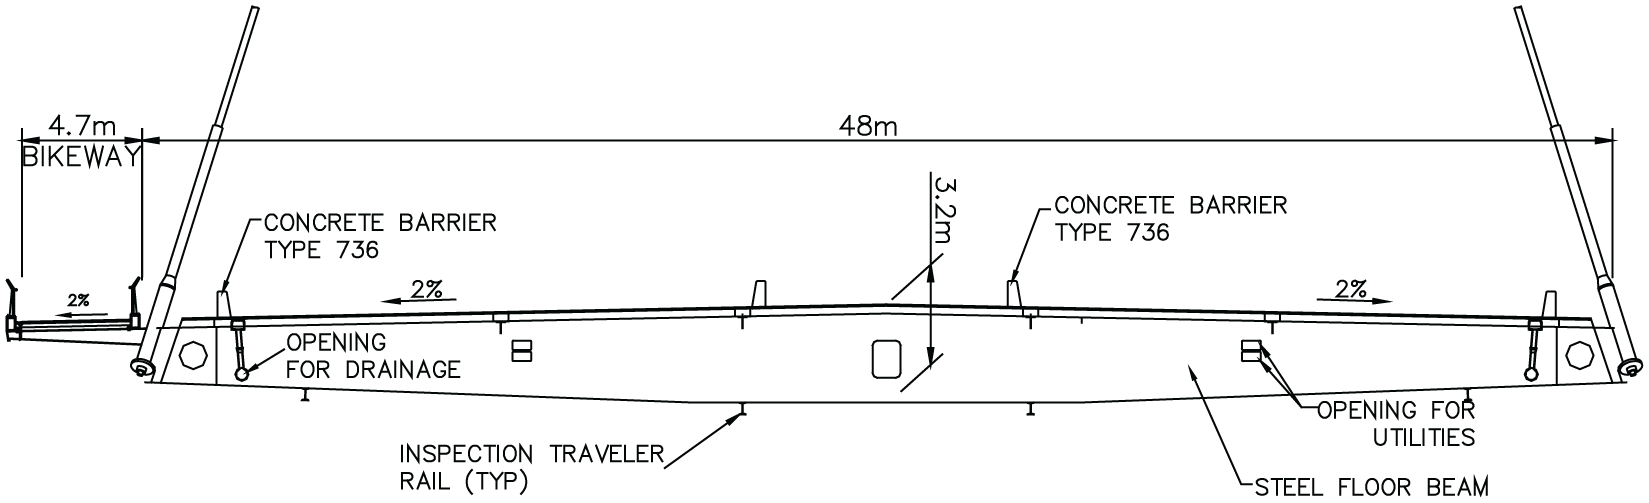
Configuration of the deck.
Aerodynamic sectional tests
Model
The section models were manufactured to faithfully replicate the bridge’s geometry, mass and stiffness properties. A geometrical scale of 1:45 was prescribed to simulate the required details and yield blockage of about 5% in the second test section of the XNJD-1 wind tunnel. The model is 2.3 m long, 1.17 m wide and 0.07 m high. The section model was designed and manufactured using conventional stiff model technology as shown in Figure 2. Each steel box edge girder was constructed independently as a continuous aluminum beam. The edge of each box girder was covered by a removable plastic element to satisfy the requirement that the edge be adjustable in the presence of vortex shedding or flutter problems. The deck surfacing, stringers, and steel transverse beams were modeled using glass fiber reinforced plastic sheets. The deck geometry model was completed by assembling aluminum girders, deck surfacing, stringers, and steel transverse beams. The aluminum skeleton and high stiff deck surfacing in this design ensured the stiffness of the model.

Design of the section model.
The inspection traveler rail, handrails, concrete barriers, and bikeways were constructed using plastic materials and were removable features of the bare deck model. As the screen, which included pipes and mesh, could not be scaled geometrically, the equivalent principle of drag force was used in the model design.
Test setup
The wind tunnel used to investigate the VIV of the bridge deck was an XNJD-1 type industrial wind tunnel located at Southwest Jiaotong University. The dimensions of the test section were 2.4 ×2.0 ×16.0 m3 (W × H × L) and the wind velocity was 0.5–45.0 m/s. The test setup was specially designed to carry out dynamic tests of the bridge deck sections and was mounted on the outside walls of the wind tunnel. The model was suspended by four pairs of linear springs and could vibrate vertically and torsionally. The additional mass necessary to ensure mass similitude was created using steel plate and installed at each end of the model supporting suspension system as demonstrated in Figure 3(a). Figure 3(b) shows the model installed in the test section of the wind tunnel.
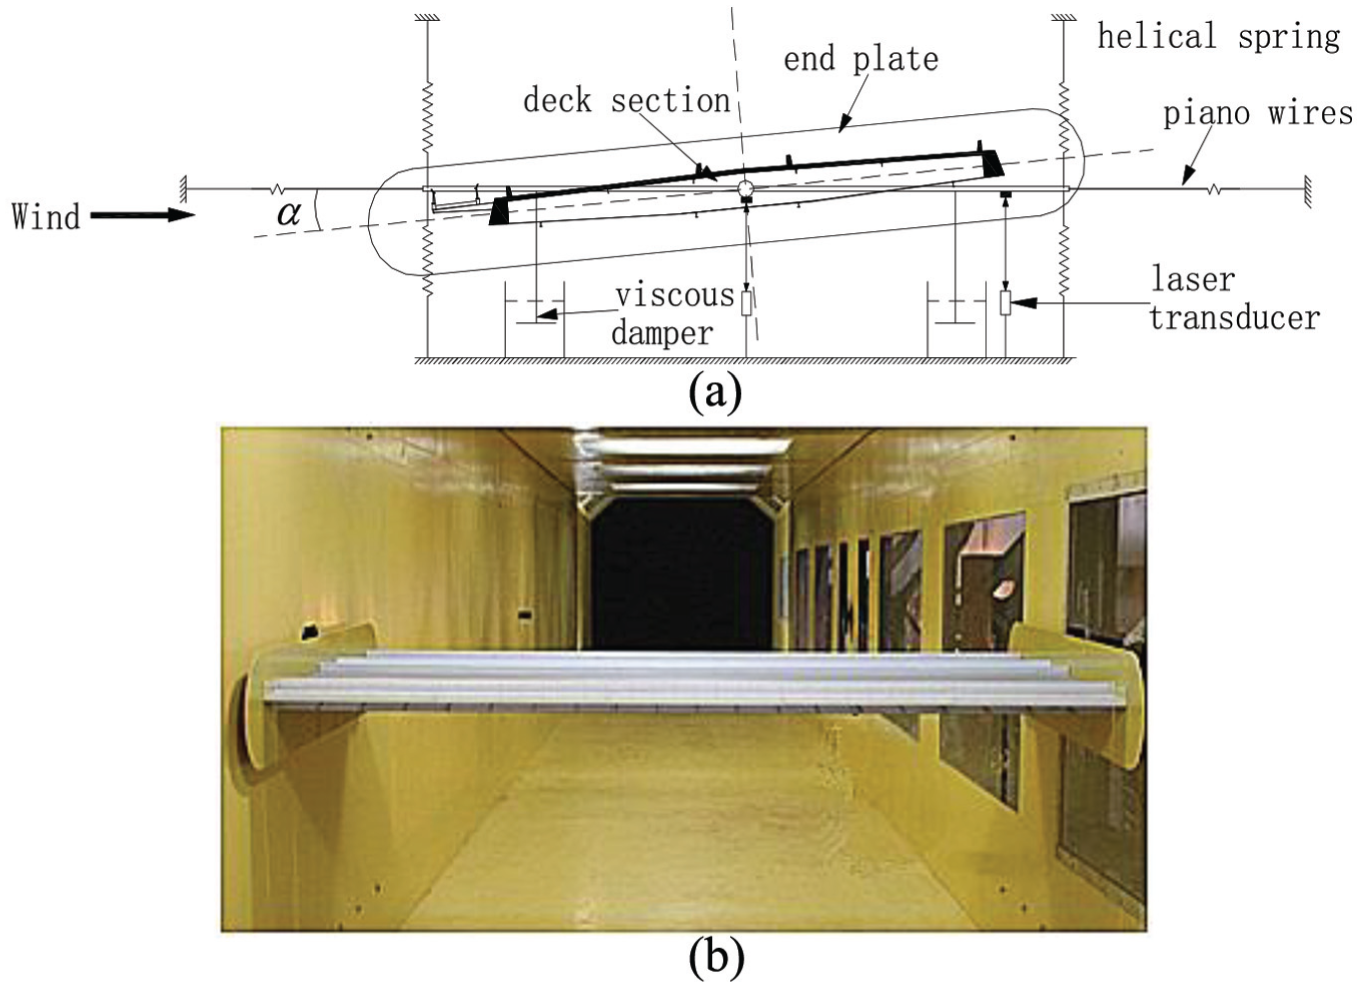
Sectional model testing setup.
Before the VIV testing commenced, the dynamic parameters of the model system were identified using the free vibration approach. Table 1 shows the relevant parameters of the test. The 0.5% damping level was achieved with the use of oil dampers installed on each side of the supporting system. The vertical and torsional damping ratios varying with the vibration amplitude are shown in Figure 4. The results of the vertical and torsional vibration amplitudes observed in the wind tunnel tests clearly demonstrated that the average damping ratio satisfied the required damping level of 0.5%. The 1.5% damping level was achieved using the same method as detailed above.
Similarity scales and setup parameters for aerodynamic sectional model wind tunnel tests.
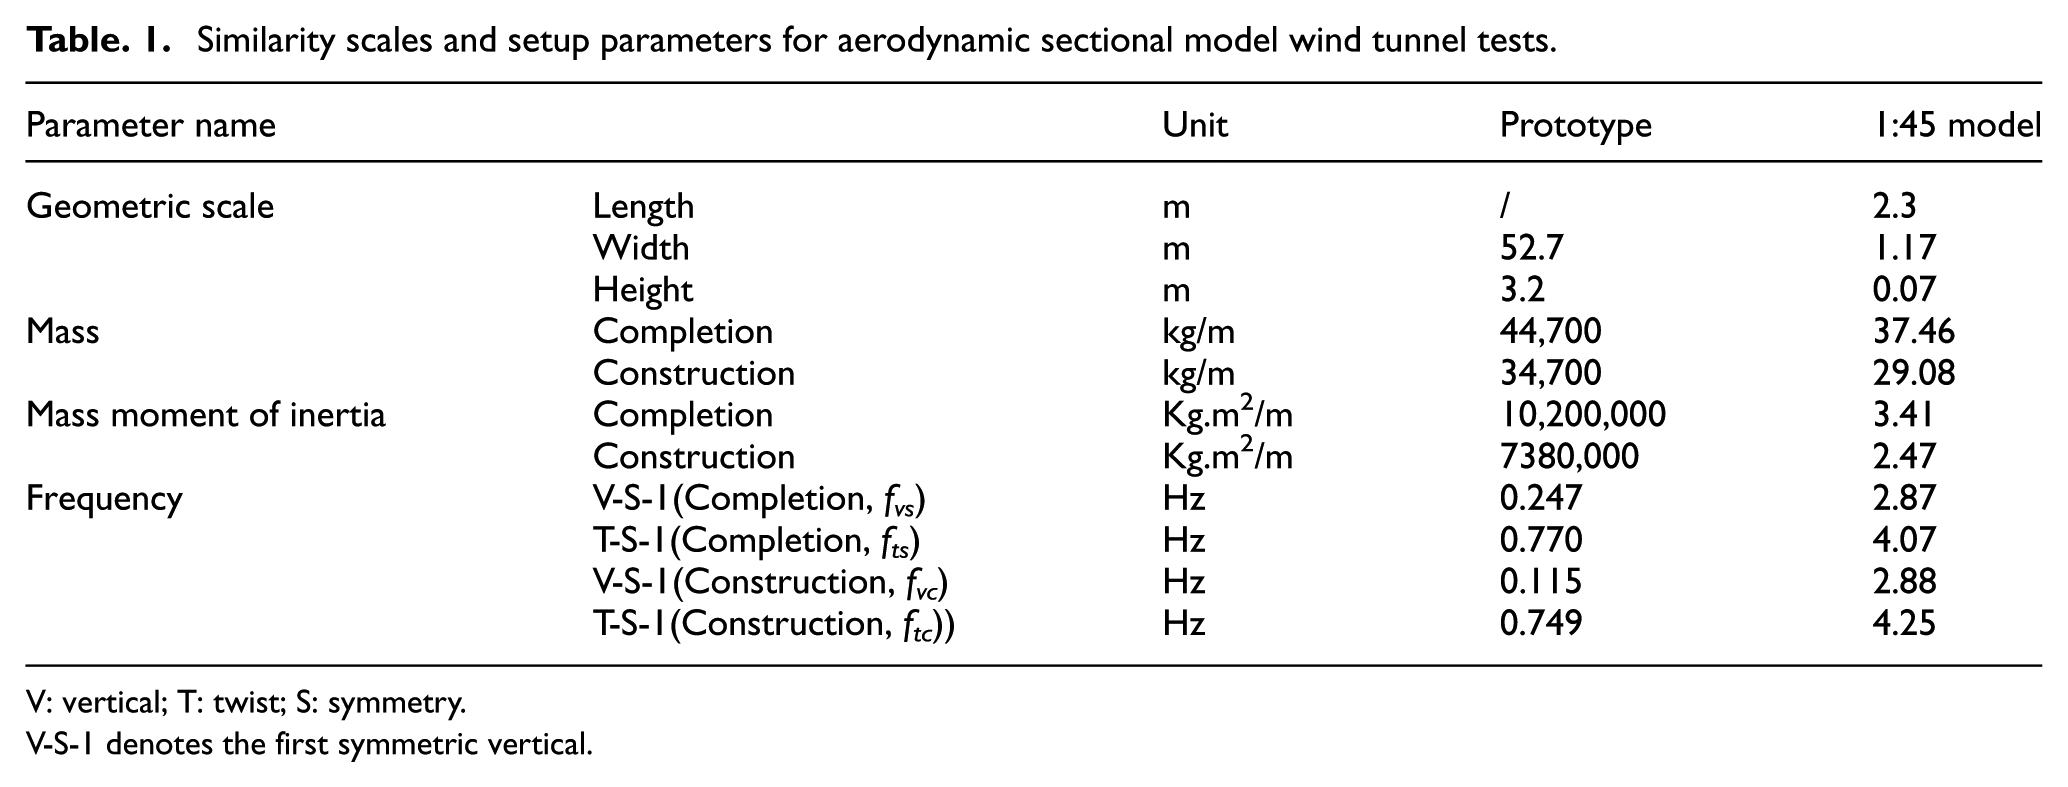
V: vertical; T: twist; S: symmetry.
V-S-1 denotes the first symmetric vertical.
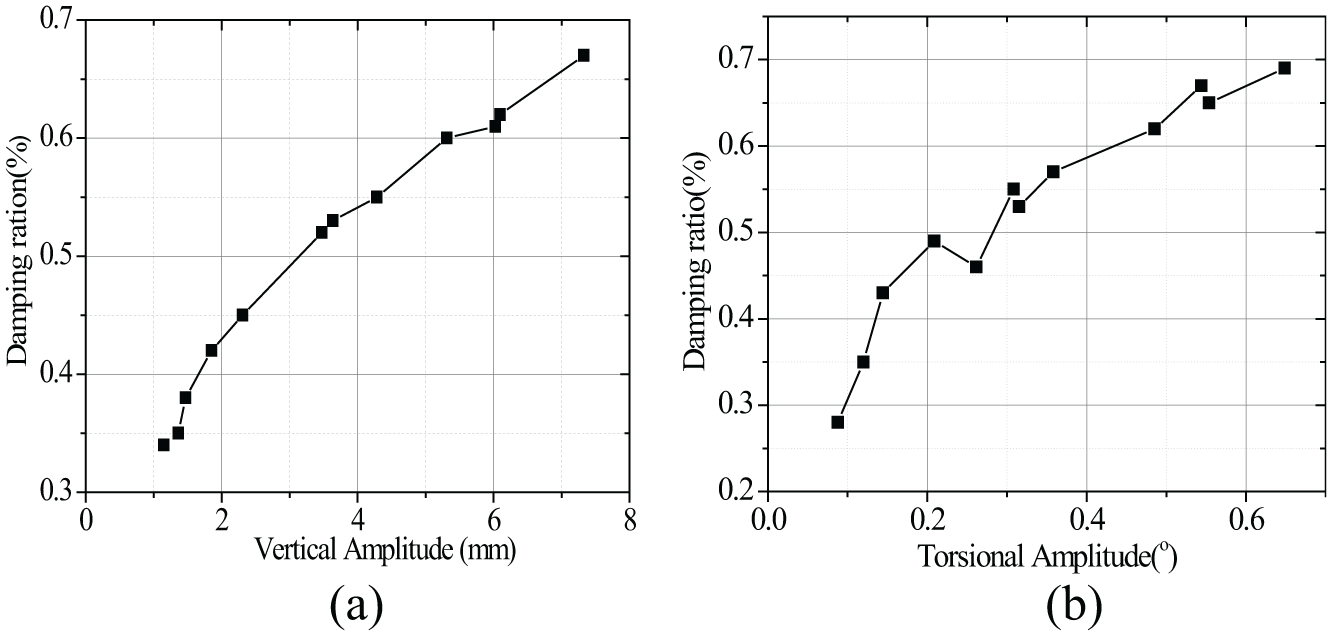
Damping ratio varying with amplitude.
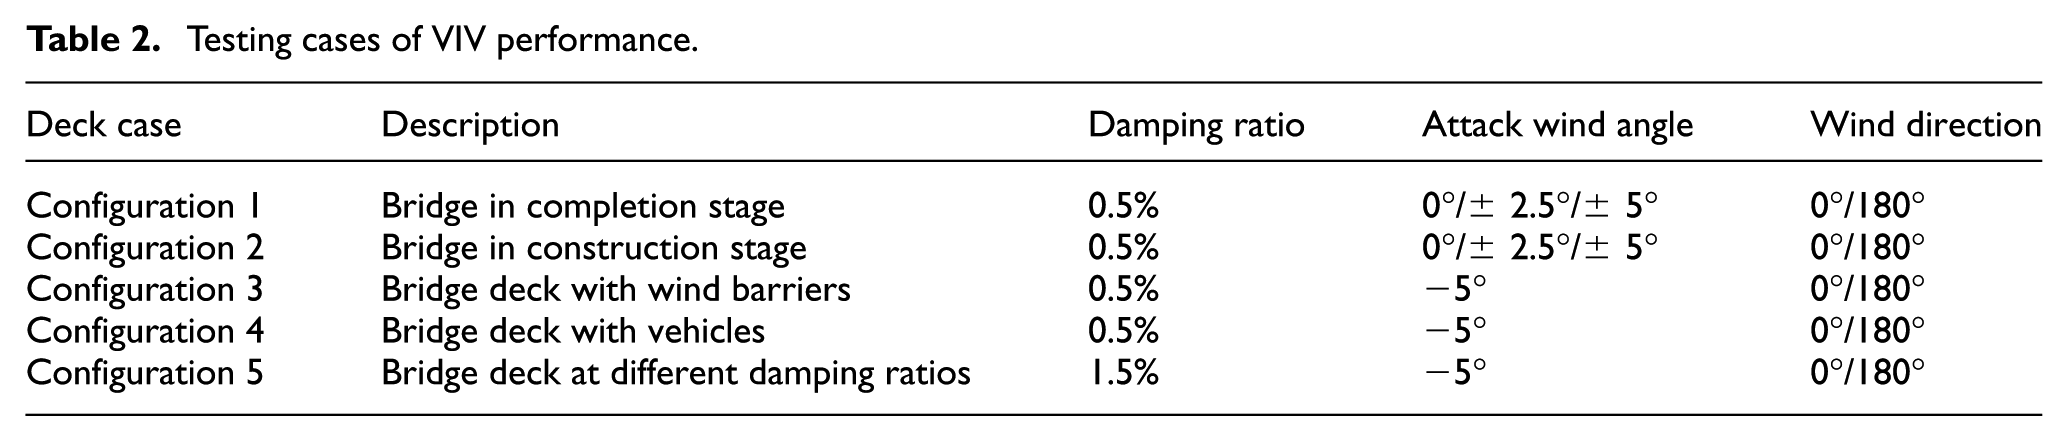
The VIV tests were divided into five groups titled Configurations 1–5. The details are listed in Table 2. Wind directions are defined as shown in Figure 5. The purpose of Configurations 1 and 2 was to investigate the VIV characteristics of the bridge deck under different attack angles and wind directions during the completion and construction stages. Configuration 3 was used to investigate the influence of wind barriers on the VIV behavior of the bridge deck, while Configuration 4 was used to investigate the influence of vehicles on the VIV behavior of the bridge deck. Configuration 5 was used to investigate the VIV characteristics of the bridge deck at different damping ratios.
Testing cases of VIV performance.
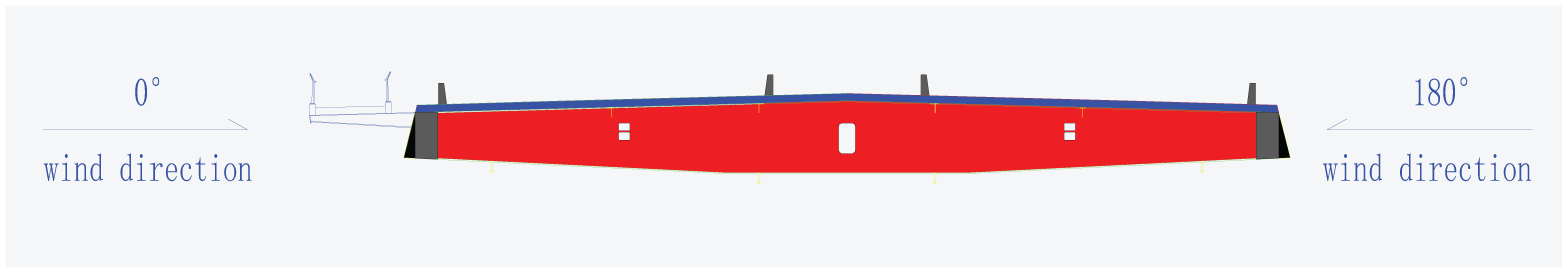
Schematic diagram of the wind direction in vibration test.
Test results and discussion
VIV of the bridge deck in the completion stage (Configuration 1)
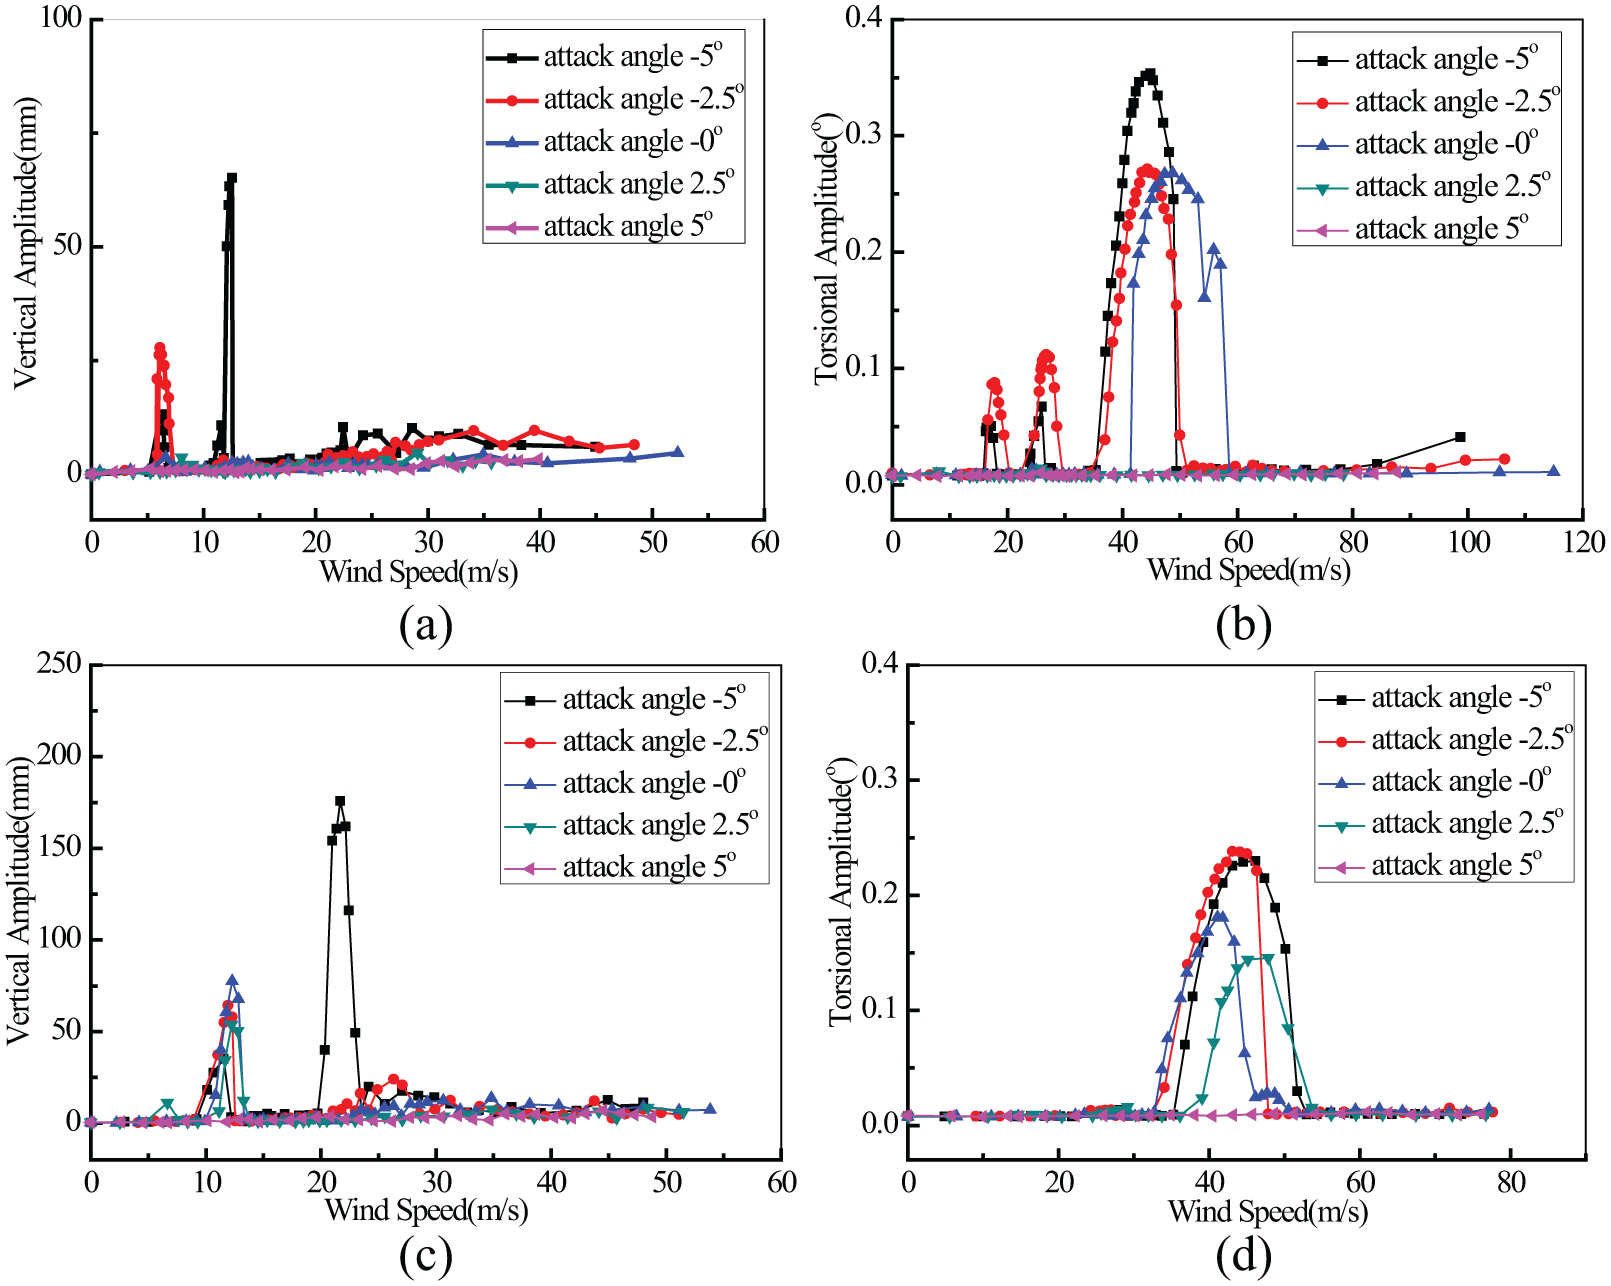
The deck model was tested in Configuration 1 at a damping ratio of 0.5% for five attack angles (i.e. α = 0°, ±2.5°, and ±5°) under smooth oncoming flow in two directions (i.e. β = 0° and 180°). The amplitudes of the VIV versus the wind speeds are shown in Figure 6. It is worth pointing out that the amplitude and wind speed were converted to those of the prototype bridge case based on the similitude parameter.
VIV responses of the bridge deck of Configuration 1.
As presented in Figure 6(a), the wind speed of the prototype bridge varied from 0 to 52.28 m/s. When the wind direction was 0o, the vertical VIVs were found at wind attack angles of −2.5o and −5o. Furthermore, −5o was the most unfavorable wind attack angle; its corresponding peak amplitude was 0.065 m and its lock-in wind speed was about 12.54 m/s. As shown in Figure 6(b), the wind speed of the prototype bridge varied from 0 to 114 m/s. The torsional VIVs in the 0o wind direction were more prominent than the vertical VIVs. Torsional VIVs with large amplitudes occurred at wind attack angles of −5o, −2.5o, and 0o. The most unfavorable wind attack angle for the torsional VIVs was also −5o, and the peak amplitude was 0.35o, which corresponds to the lock-in wind speed of 44.87 m/s.
As presented in Figure 6(c), the wind speed of the prototype bridge varied from 0 to 53.83 m/s. Vertical VIVs were found at three wind attack angles (−5o, −2.5o, and 0 o) when the wind direction changed to 180o. The amplitude of the VIVs increased substantially relative to the VIVs under the wind direction of 0o. The most unfavorable wind attack angle was −5o, the peak amplitude was 0.179 m, and the corresponding lock-in wind speed was 21.69 m/s. As shown in Figure 6(d), the wind speed of the prototype bridge varied from 0 to 77.64 m/s. Torsional VIVs occurred at wind attack angles of −5o, ±2.5o, and 0o, with the most unfavorable occurring at −2.5o. In contrast to the trend displayed by the vertical VIVs, the amplitude of the torsional VIVs in the 180o wind direction decreased relative to the VIVs in the 0o wind direction.
It can be seen from the above illustrations that the VIV properties varied with the wind direction as a result of the asymmetry of the main girder. The main difference is as follows: the amplitude of the vertical VIV under the 0o wind direction is smaller than that of the vertical VIV under the 180o direction, while the amplitude of the torsional VIV is much larger. It can be further shown that the aerodynamic characteristics of the main girder are greatly changed by the left sidewalk setting, and thus the VIV performance of the main girder differs greatly under the two wind direction conditions.
VIV of the bridge deck in the construction stage (Configuration 2)
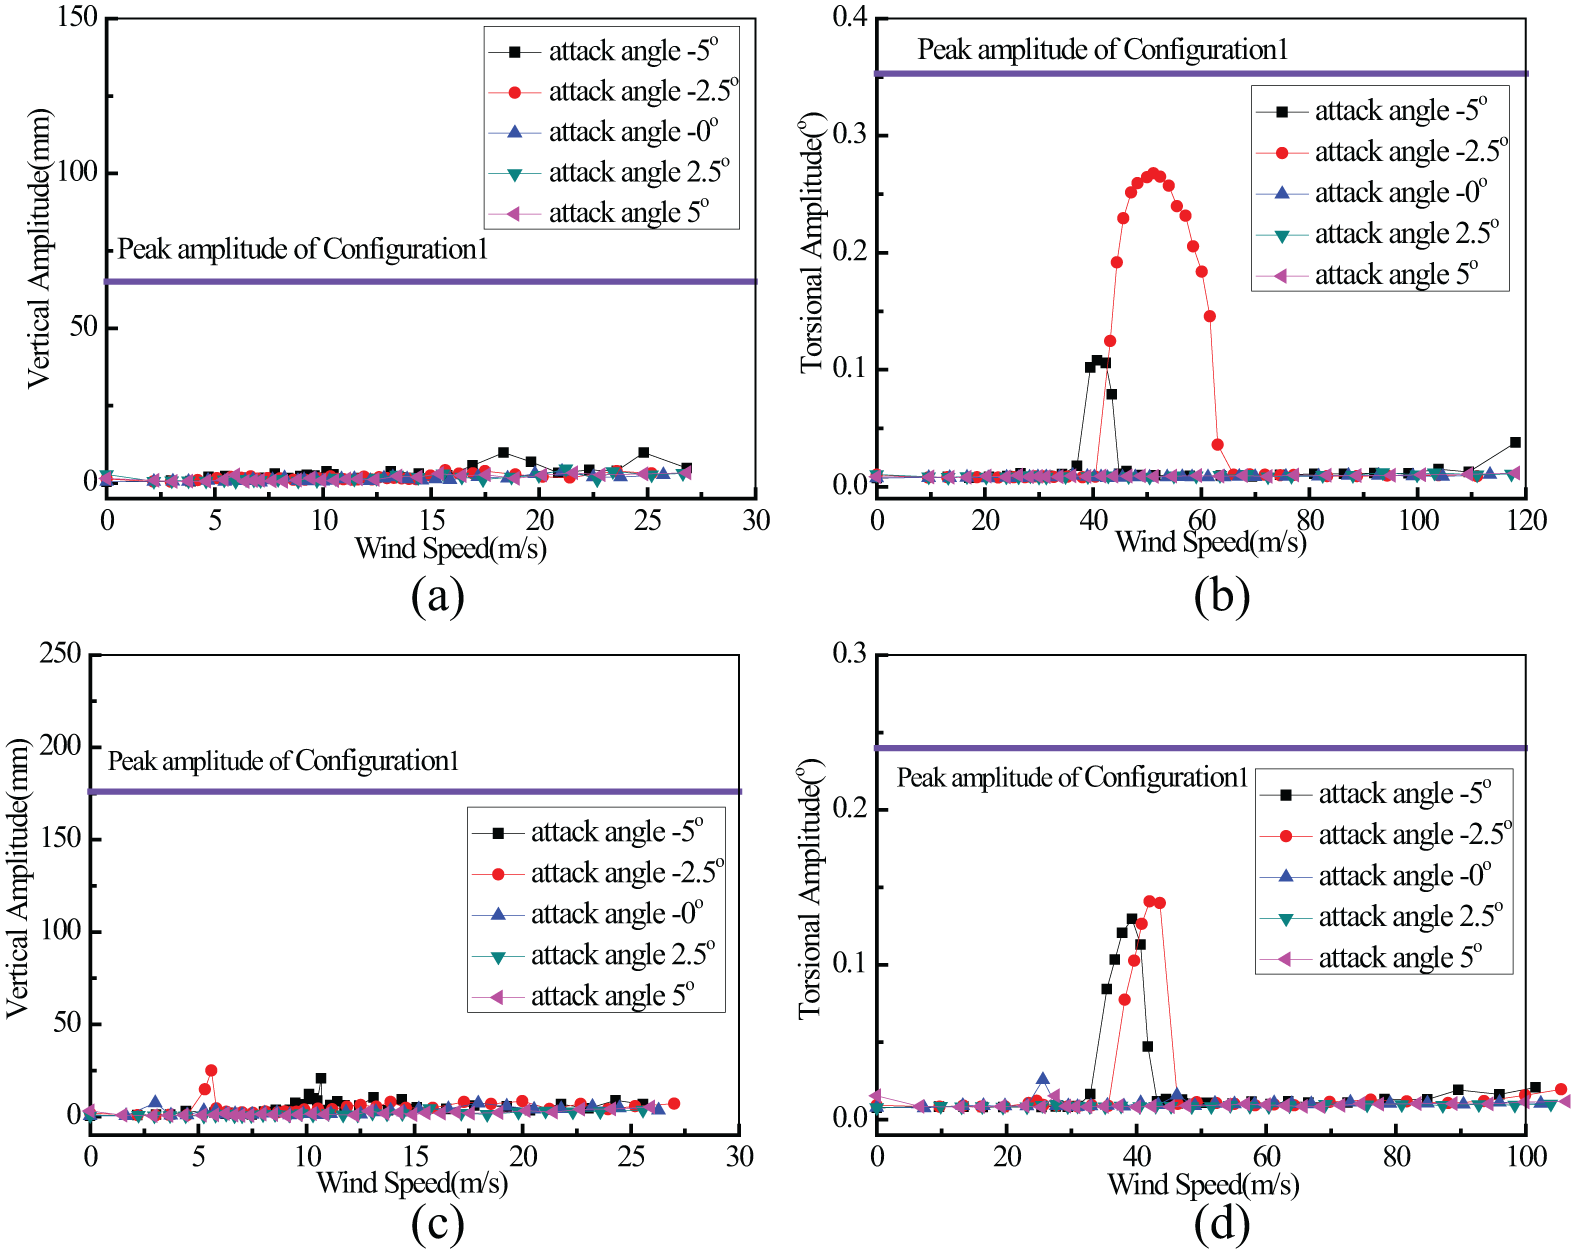
The deck model was tested in Configuration 2 at a damping ratio of 0.5% for five attack angles (α = 0°, ±2.5°, and ±5°)under smooth oncoming flow in two directions (β = 0° and 180°). The VIV amplitudes versus wind speeds and reduced wind speeds are shown in Figure 7. Meanwhile, the VIV responses in the most unfavorable case of Configuration 1 (completion stage) were also plotted for comparison.
VIV responses of the bridge deck of Configuration 2.
As presented in Figure 7(a) and (c), as opposed to the completion stage case, no obvious vertical VIV phenomenon was identified for the bridge deck under different wind attack angles or wind directions during the construction stage. As presented in Figure 7(b) and (d), the torsional VIVs of the bridge deck were found at the wind attack angles of −2.5o and −5o under both 0o and 180o wind directions. Nevertheless, the peak amplitudes of the VIVs decreased to a certain extent in comparison with those seen during the completion stage. In addition, the maximum amplitude of the torsional VIV appeared when the wind attack angle was −2.5o under smooth oncoming flow with a wind direction of 0o. The peak amplitude was 0.27o, which corresponds to the lock-in wind speed of 52.42 m/s.
The above results indicate that the VIVs of a bridge deck in the construction stage are obviously weaker than those of a bridge deck in the completion stage. These results are applicable to any attack angles or wind directions. This suggests that accessories such as anticollision railings, sidewalk railings, and maintenance tracks have adverse effects on the VIV performance of a bridge deck due to the fact that they complicate its aerodynamic shape and increase the possibility of VIVs. Therefore, the following experiments mainly focus on bridge decks in the completion stage.
VIV of the bridge deck with wind barriers in the completion stage (Configuration 3)
For the sake of the serviceability of long-span bridges, as well as the safety of vehicles, it is proposed that wind barriers be installed on the tops of the guard rails on both sides of the bridge deck. From the preceding results (section “VIV of the bridge deck in the completion stage (Configuration 1)”), it can be seen that the most serious VIV of the bridge deck is most likely to occur at a wind attack angle of −5° during the completion stage. Consequently, the Configuration 3 deck model was tested for an attack angle of −5° under smooth oncoming flow with wind directions of 0° and 180°. The influence of wind barriers on the VIV performance of the bridge deck was evaluated as shown in Figure 8. The VIV responses of the most unfavorable case of Configuration 1 are also plotted for comparison.
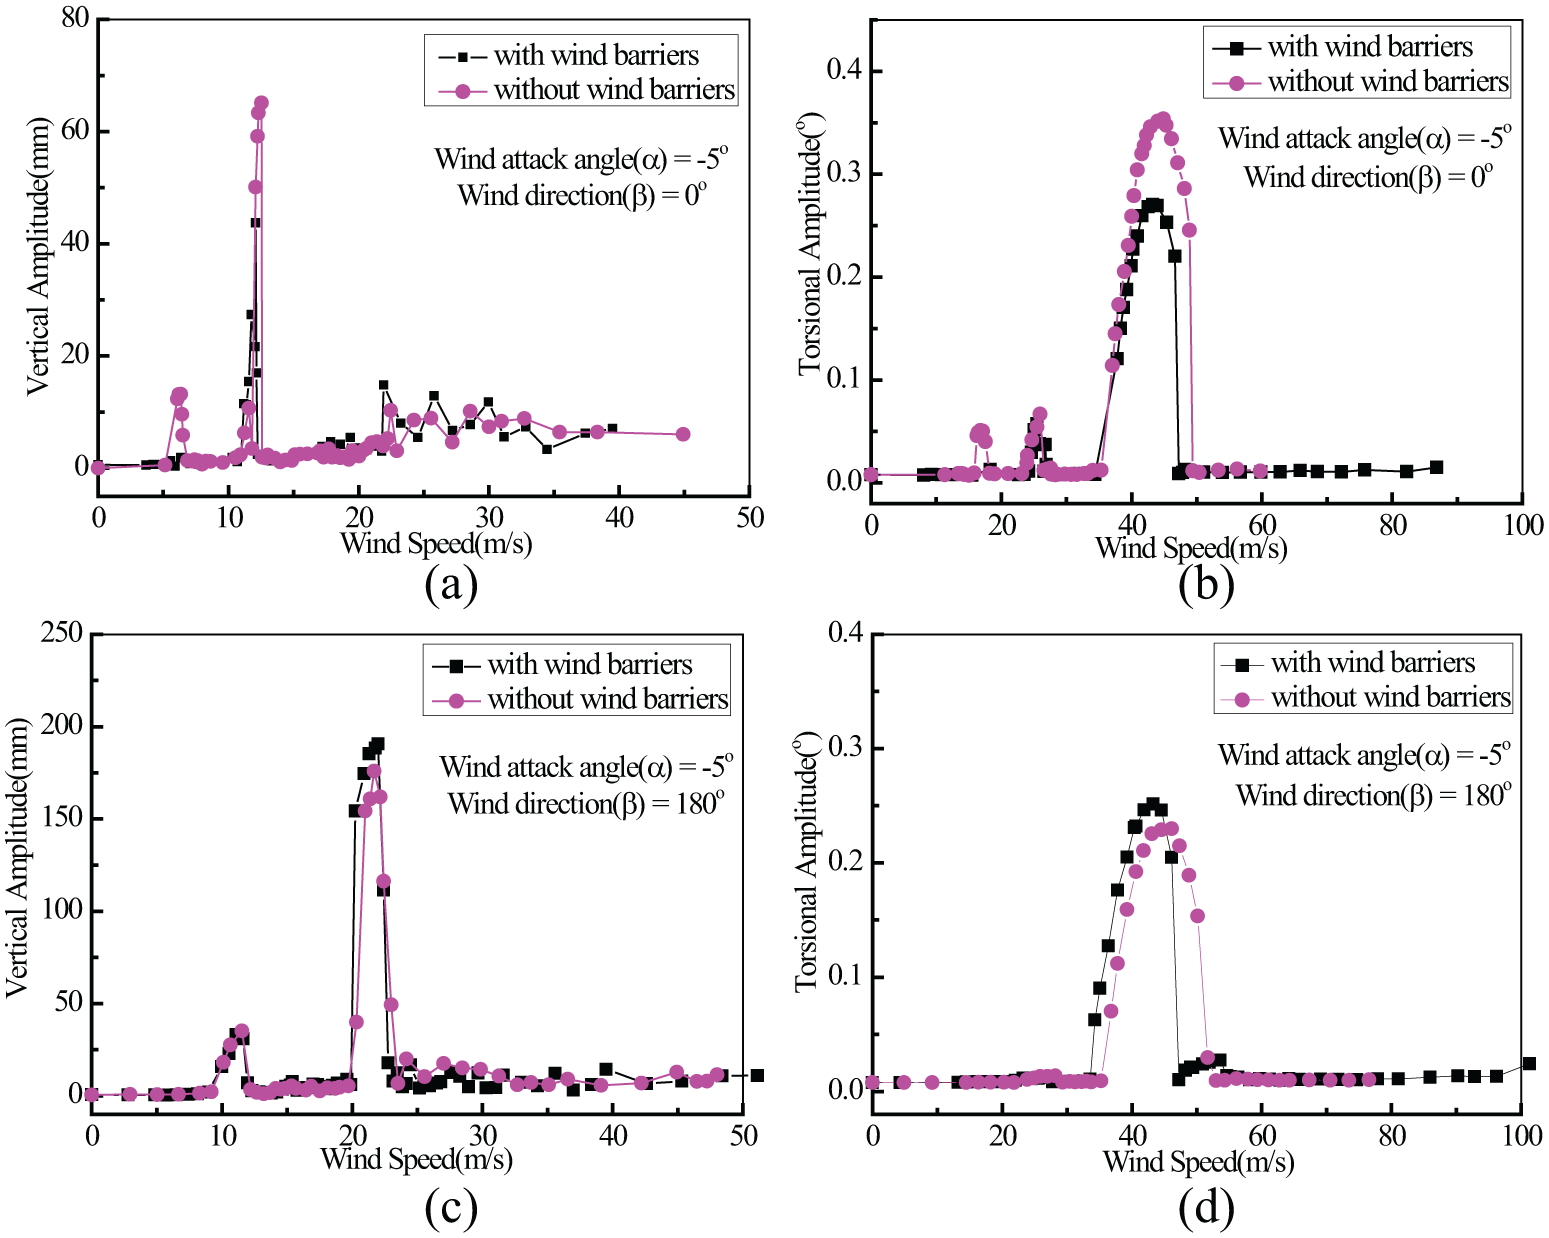
VIV responses of the bridge deck of Configuration 3.
As shown in Figure 8(a) and (b), when the wind direction is 0°, the wind barriers can partly inhibit both the vertical and torsional VIVs. The maximum vertical amplitude decreased from 0.065 to 0.044 m2 and the maximum torsional amplitude decreased from 0.354° to 0.271°. However, as shown in Figure 8(c) and (d), the wind barriers may enlarge the vertical and torsional VIVs when the wind direction is 180°. The maximum vertical amplitude increased from 0.176 to 0.191 m2 and the maximum torsional amplitude increased from 0.237° to 0.252°.
The above results indicate that the influence of the wind barriers on the VIV performance of the bridge section is totally different in the cases of the two wind directions as a result of the asymmetry of the main girder. Wind barriers have potential to suppress the VIV under a 0° wind direction, while tending to enlarge the VIV of the bridge deck under a 180° wind direction.
VIVs of the bridge deck with vehicles(Configuration 4)
It well known that VIV is quite sensitive to the aerodynamic shape of the structures (Ma et al., 2018). The movement of vehicles on the bridge inevitably changes the shape of the bridge cross-section and explicitly affects the VIV performance of the bridge deck. It is therefore necessary to investigate the influence of vehicles on the VIV behavior of a bridge deck. The deck model with vehicles was tested for an attack angle of −5° under smooth oncoming flow with wind directions of 0° and 180°. The vehicle convoy was arranged as shown in Figure 9. The test results are listed in Figure 10. The VIV responses of the most unfavorable case of Configuration 1 were also plotted for comparison.
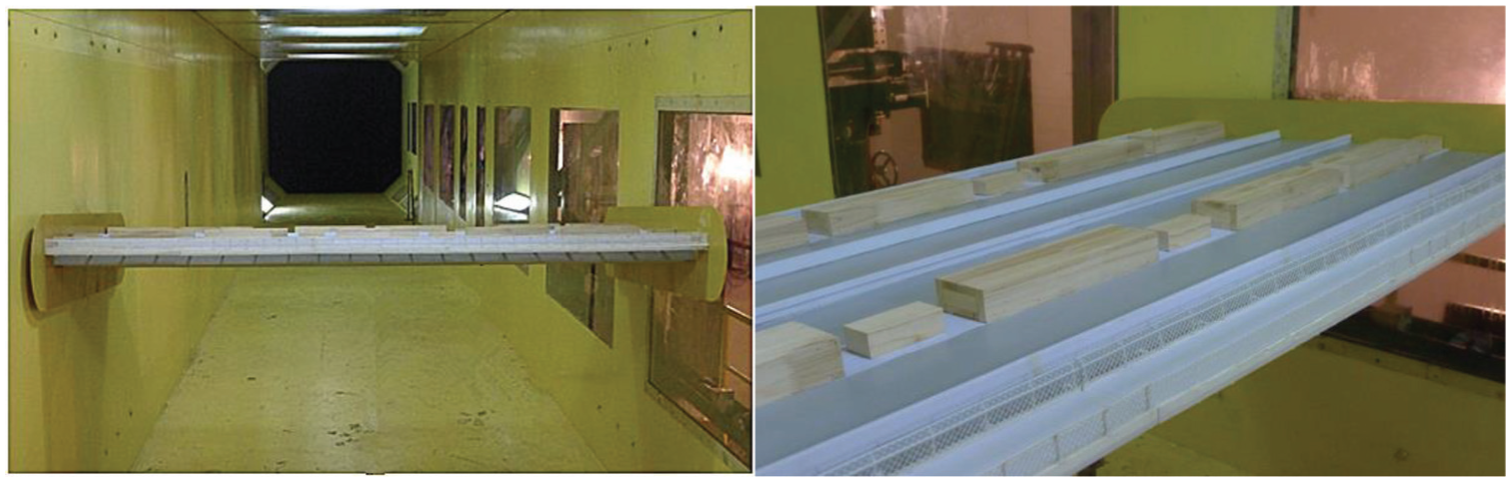
VIV test with vehicles on the bridge deck.
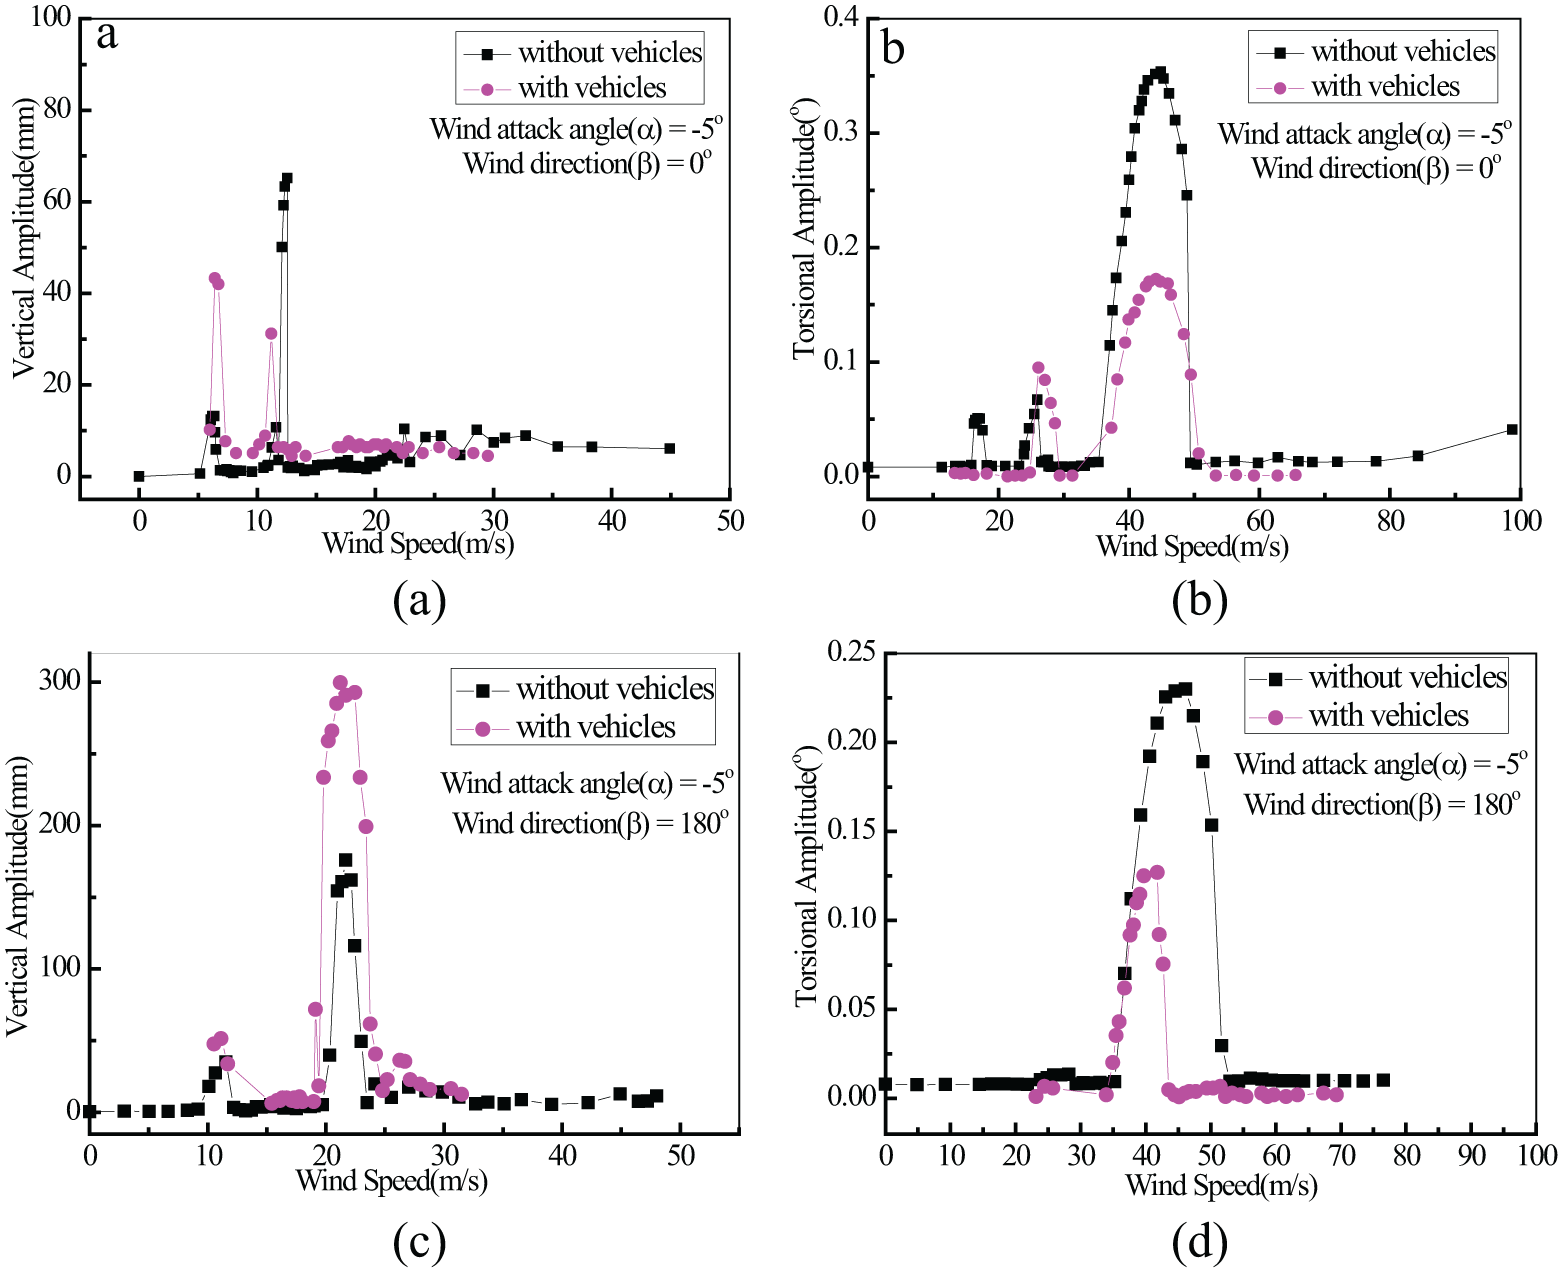
VIV responses of the bridge deck of Configuration 4.
The results show that the influence of vehicle traffic on the VIV performance of the bridge section is also different under the two wind direction conditions. As shown in Figure 10(a) and (b), when the oncoming flow direction was 0°, the vehicles exerted a significant inhibitory effect on the VIV of the bridge deck. The maximum vertical amplitude decreased from 0.065 to 0.031 m2 and the maximum torsional amplitude decreased from 0.354° to 0.171°. However, as shown in Figure 10(c) and (d), the vehicles enlarged the vertical VIV when the wind direction was 180°. The maximum vertical amplitude increased from 0.176 to 0.299 m2. It can be seen from the above results that when the wind direction is 0°, the vehicles have a positive effect on the suppression of the VIV of the bridge deck. However, it is worth noting that the vehicles tend to enlarge the vertical VIV of the bridge deck when the wind direction is 180°.
VIVs of the bridge deck at different damping ratios (Configuration 5)
It is necessary to take effective countermeasures to eliminate the bridge deck VIV phenomenon due to its potential harmfulness. In addition, the experimental results mentioned above show that both vehicles and wind barriers have amplification effects on the VIVs of a bridge deck during the completion stage when the wind direction is 180°. Therefore, the effectiveness of VIV suppression countermeasures should be verified when wind barriers and vehicles are present on the bridge deck. As previously mentioned (Chen et al., 2017a, b), an additional damping ratio is an effective way to solve the wind-induced vibrations of bridge decks. Based on this, the most unfavorable wind attack angle, −5o, was selected to study the effects of damping ratios on the VIVs of a bridge deck. The original structural damping ratios of the sectional models were around 0.5%. In this study, the damping ratio was increased to 1.5% through the installation of oil dampers on each side of the supporting system. Comparisons of the VIV responses under two wind directions for a bridge deck with different damping ratios are illustrated in Figure 11. The VIV responses of the most unfavorable case of Configuration 1 at a damping ratio of 0.5% are also plotted for comparison.
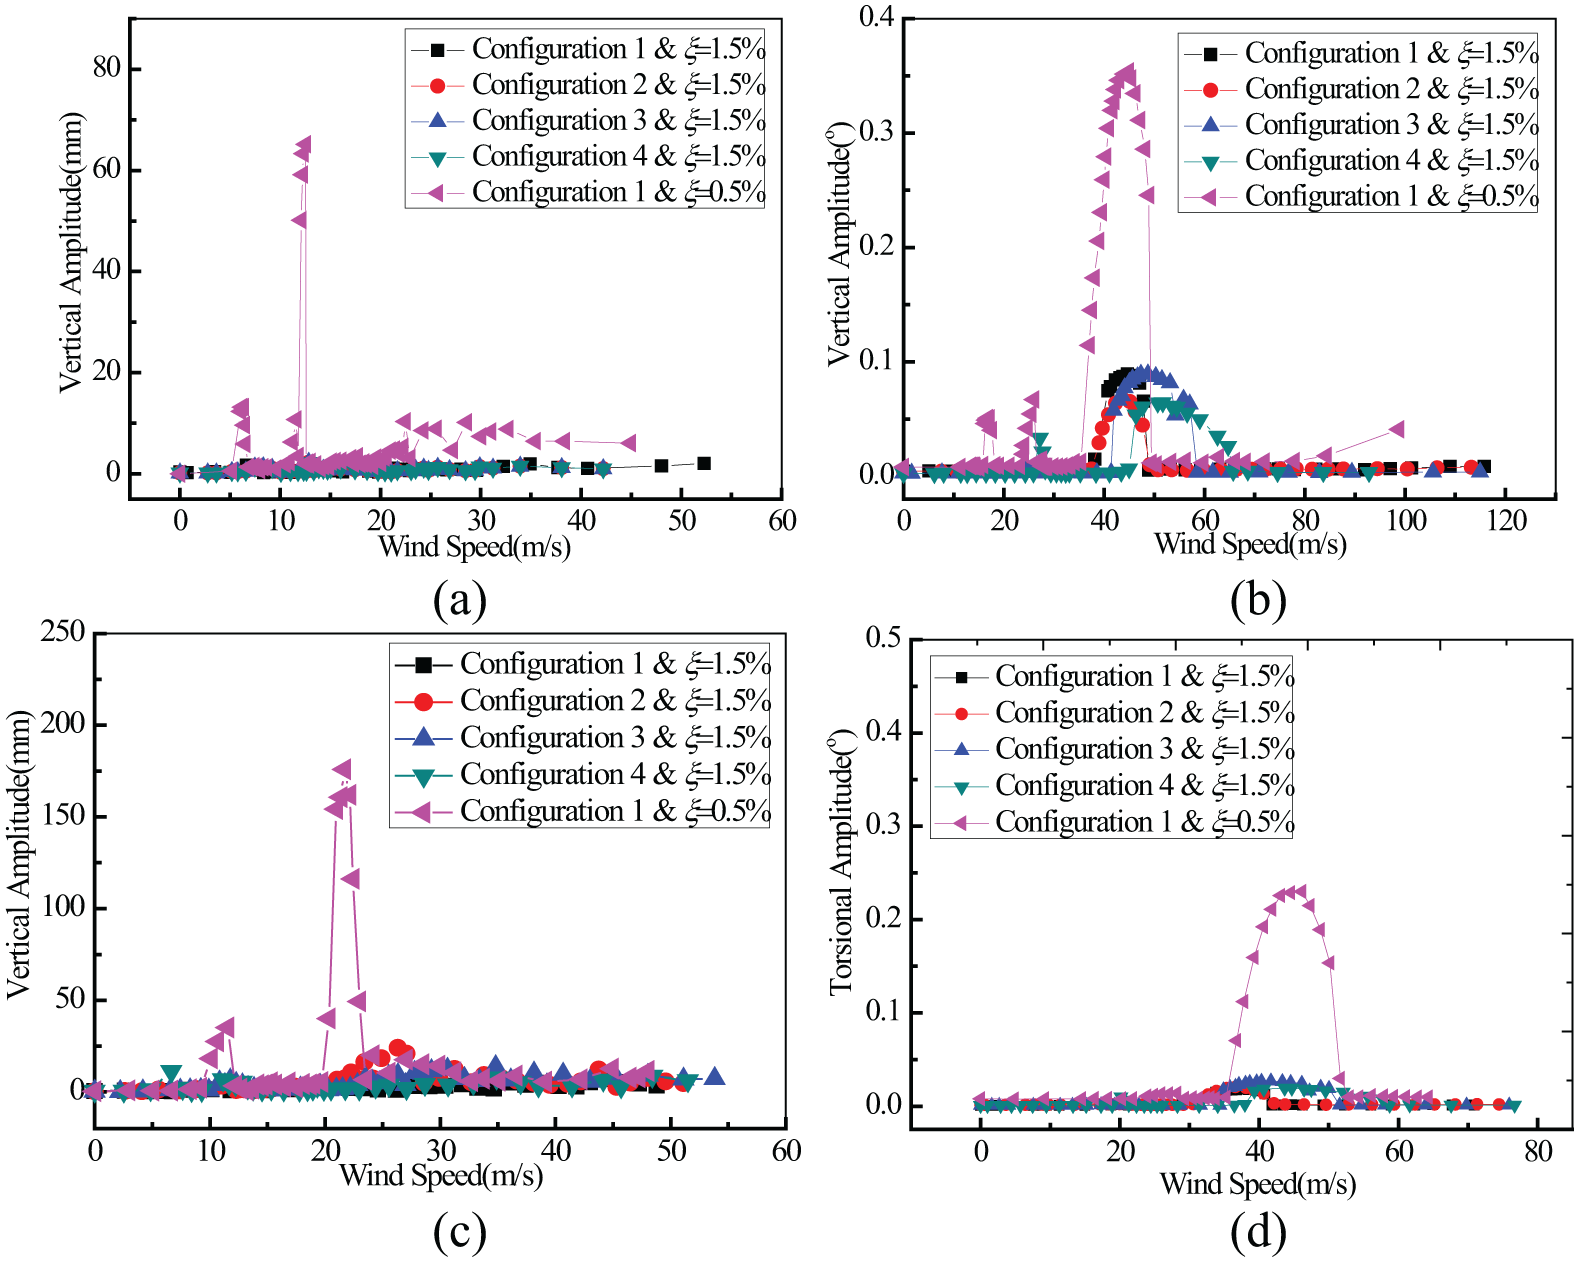
VIV responses of the bridge deck of Configuration 5.
As shown in Figure 11(a) and (b), at a damping ratio of 1.5%, the vertical VIVs of Configurations 1–4 almost disappeared under a 0° wind direction. The torsional VIVs were greatly weakened and the maximum amplitude decreased from 0.354° to 0.089°. As shown in Figure 11(c) and (d), at a damping ratio of 1.5% and under a wind direction of 180°, both the vertical and torsional VIVs decreased sharply compared with the VIVs of the bridge deck at a damping ratio of 0.5%. It can be concluded from the above discussion that increasing the structural damping ratio is useful in mitigating the VIV responses of the bridge deck. The VIVs of the bridge deck can be effectively mitigated when the damping ratio increases from 0.5% to 1.5%.
Mechanism of VIV
Numerical setup
In order to understand the flow pattern around this asymmetrical bridge deck, a numerical two-dimensional (2-D) flow field simulation was performed with the aid of the Fluent© package. The numerical model of the flow around the bridge deck was formulated using the SST k-ω turbulence model. Equations 1 and 2 show the filtered continuity and Navier–Stokes equations
where ui, uj are the velocity components and ρ, P, and μ represent the air density, pressure, and kinematic viscosity of the flow, respectively.
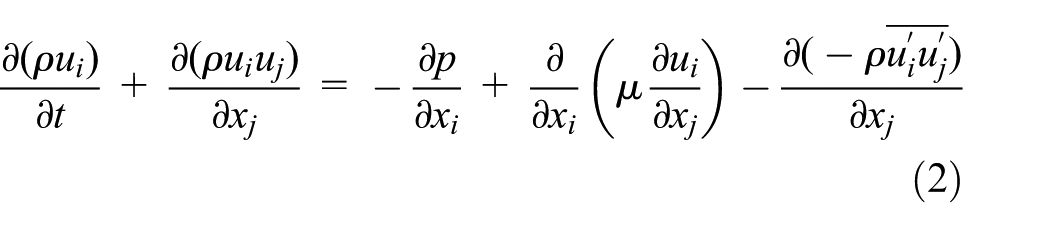
As shown in Figure 12(a), the computational domain is 240D in X-direction (D is the height of the bridge deck) and 150D in Y-direction. The boundary condition details for simulation, illustrated in Figure 12(a), are as follows. Body surface: a non-slip condition is imposed. Inlet: the uniform velocity condition, Re = 1.5 × 10⁴(keep the same value as the test). Outflow boundary: a convective boundary condition (
Simulation setup.
Figure 12(b) presents the mesh of the simulation. Structured O-type mesh systems with the depth of the first mesh approach the body surface given empirically as 0.1D/Re0.5 are applied to adequately resolve the flow. For more efficient simulations, the computational domain is spatially resolved such that a dense clustering of grid points is applied near the wall, especially in the wake zone, while a coarser grid is used away from the wall. Near the bridge girder, the growth rate for cell height is less than 1.1, and there are approximately a total of 149,000+ meshes generated.
Result and discussion
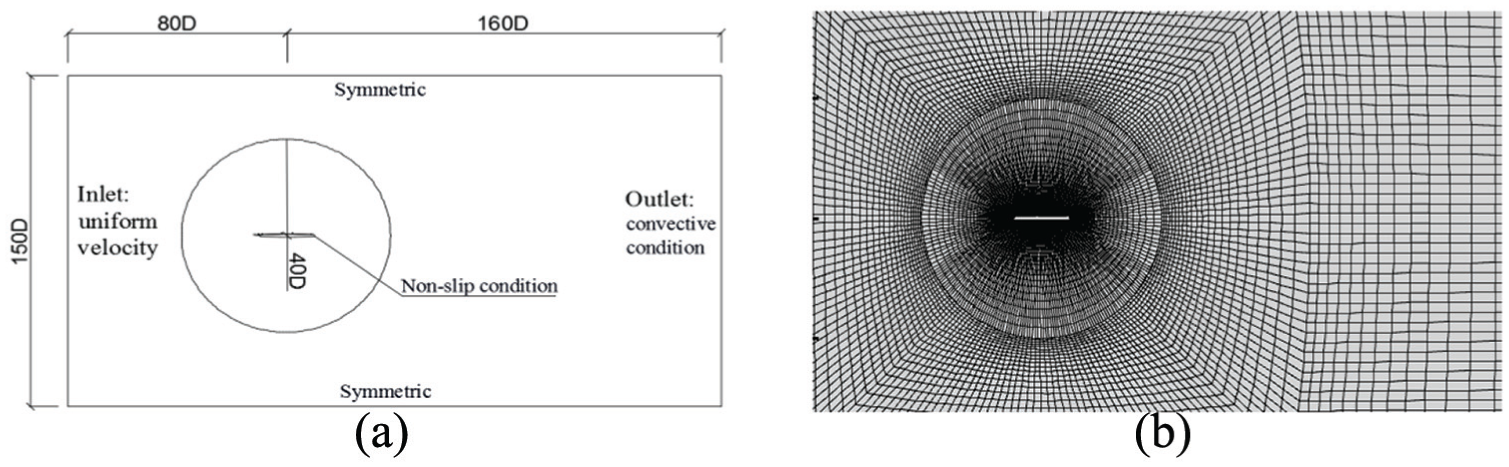
According to the experimental research above, the VIV characteristics of the bridge deck at an attack angle of 0° are obviously different under the two wind directions. Therefore, in order to obtain more comparative results, the numerical study mainly aims to investigate the flow field around the bridge deck at an attack angle of 0° in the completion stage in the two wind directions. The present simulation can be validated by comparing the numerical and experimental values of the aerodynamic coefficients of the bridge deck. As shown in Figure 13, the aerodynamic coefficients of the bridge deck with attack angles of 0° and ±2.5° are aligned with the experimental values.
Comparison of numerical and experimental aerodynamic coefficients.
Figure 14 shows the contours of the instantaneous vorticities for the bridge deck under the wind directions of 0° (Case A) and 180° (Case B), where the blue and red colors, respectively, represent the clockwise and counterclockwise vortices. It should be pointed out that the vorticity (ωz) in z-direction can be written as
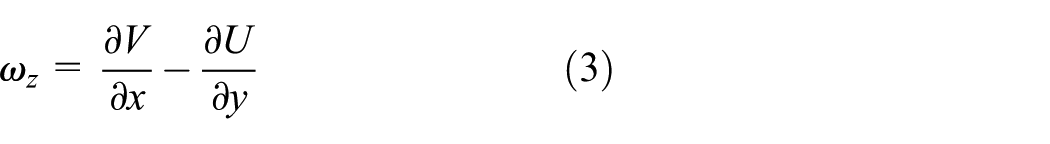
where x and y are the coordinates along the inflow and cross-flow directions, respectively.
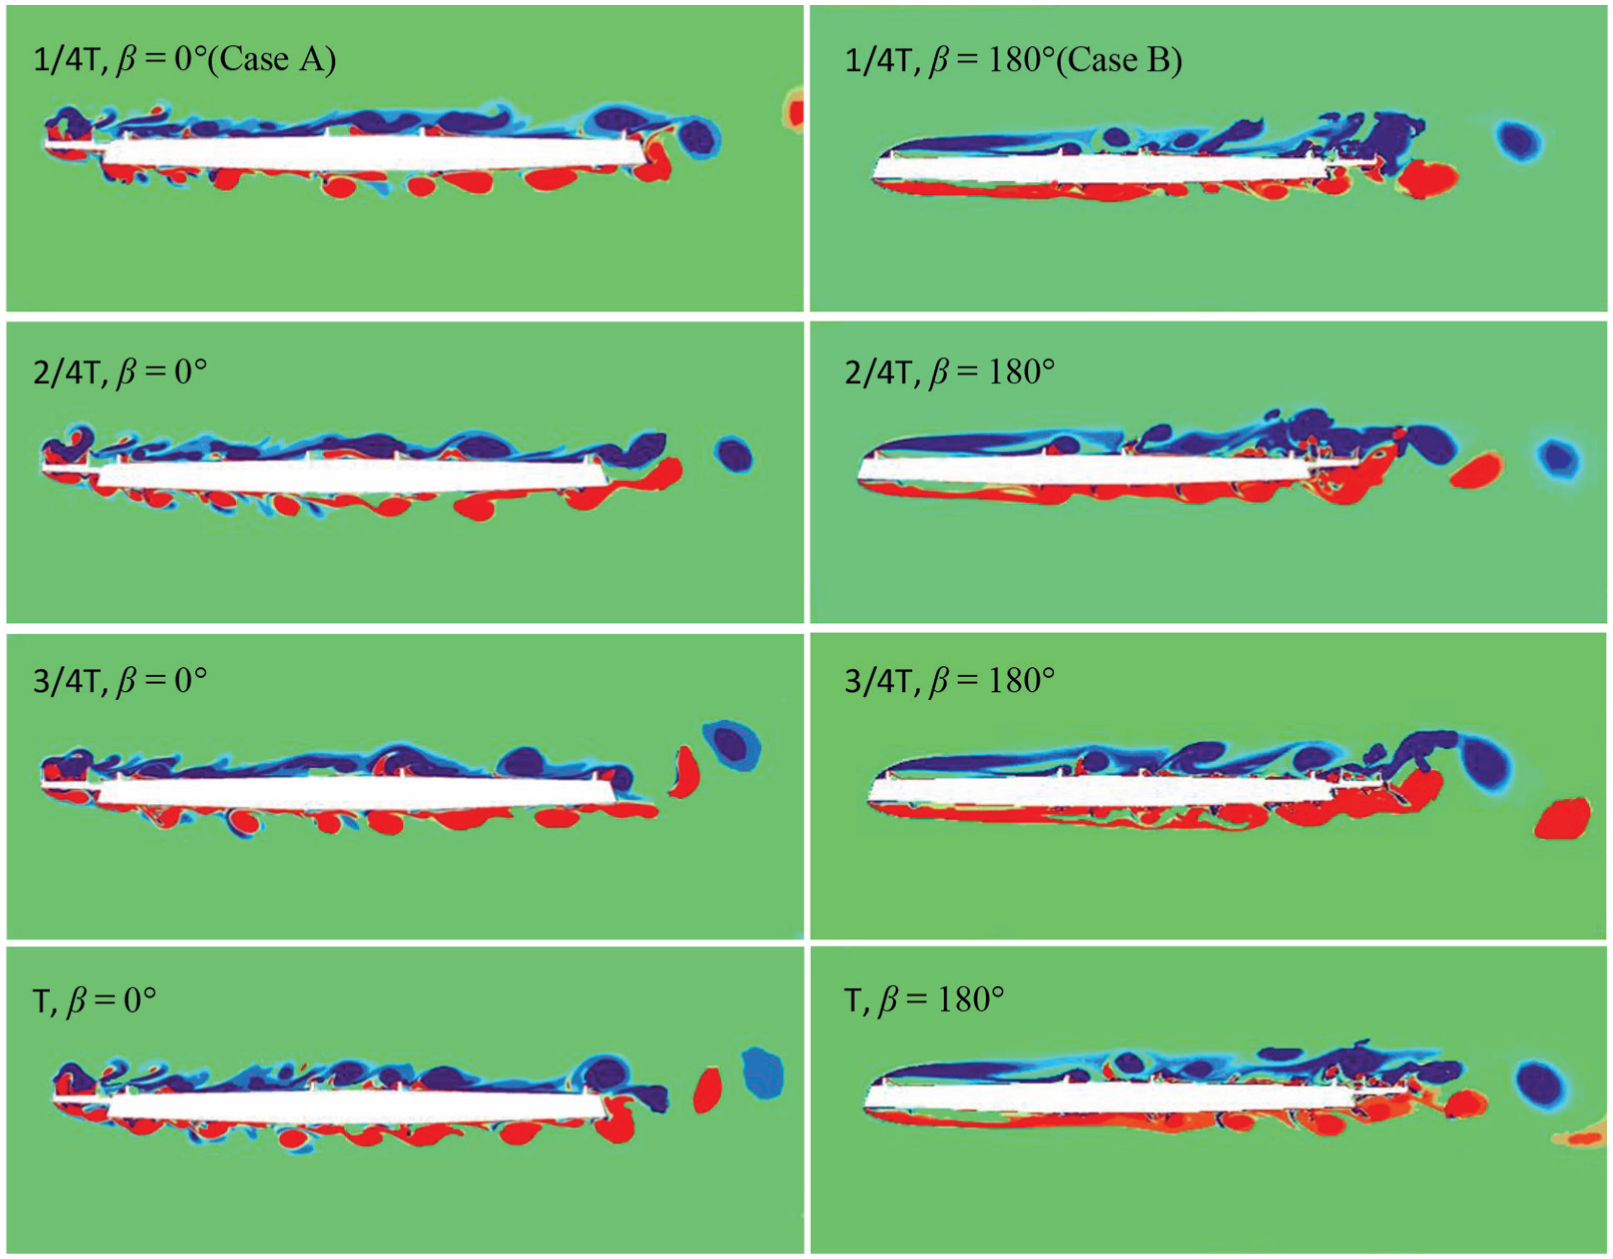
Instantaneous vorticities around the bridge deck under different wind directions.
Two different flow patterns around the bridge deck are revealed in Figure 14 as follows.
Under the wind direction (β) of 0° (Case A), the flows separate at the windward bikeway of the bridge deck. The shear layers immediately become unstable around the upper and lower surfaces of the bridge deck due to the effect of the Kelvin–Helmholtz instability (Li et al., 2014). They then form Kelvin–Helmholtz vortices that move along the upper and lower surfaces of the bridge deck and finally alternatively shed from the bridge tail, resulting in a classical Kármán vortex street at the wake.
Under the wind direction (β) of 180° (Case B), the flows separate at the windward corners of the bridge deck and remain stable before reaching the center of the bridge deck. However, after a certain distance, the shear layers become unstable around the upper and lower surfaces due to the distortion caused by the disturbance of the rails and the tracks of the overhaul vehicle. This finally results in Kelvin–Helmholtz vortices. When these vortices move to the tail, regular vortex shedding (a Kármán vortex street) appears around the leeward bikeway.
The above discussion shows that there are both similarities and differences between the two flow patterns. The major similarity is that there are two of the same type of vortex shedding modes around the surface and at the wake. One is the surface vortex shedding caused by the Kelvin–Helmholtz instability of the separated shear layer, and the other is the trailing vortex shedding caused by the interaction of the upper and lower shear layers at the wake. Both vortex shedding modes (Kelvin–Helmholtz vortex and Kármán vortex street) show obvious regularity and periodicity, which could induce a larger lift fluctuation and may cause VIV.
The differences between the two flow patterns may be the main cause of the different VIV characteristics of the bridge deck under the two wind directions exhibited in the experiments. There are two major differences between the two flow patterns. One is the vortex generation position, which, in Case B, lags half the width of the bridge compared with Case A. The other is the different propagation directions of the vortex shedding in the wake. The mean velocity field around the bridge deck presented in Figure 15 clearly shows that in Case A, the track of the vortex shedding at the wake does not follow the axis direction of the main girder, but propagates upward with a certain angle. In Case B, the motion direction of the shed vortices is consistent with the axis direction of the bridge deck. The characteristics of the VIV of the bridge deck are bound to change with the different distributions of the Kelvin–Helmholtz vortices and the different trajectories of the wake-off vortices.
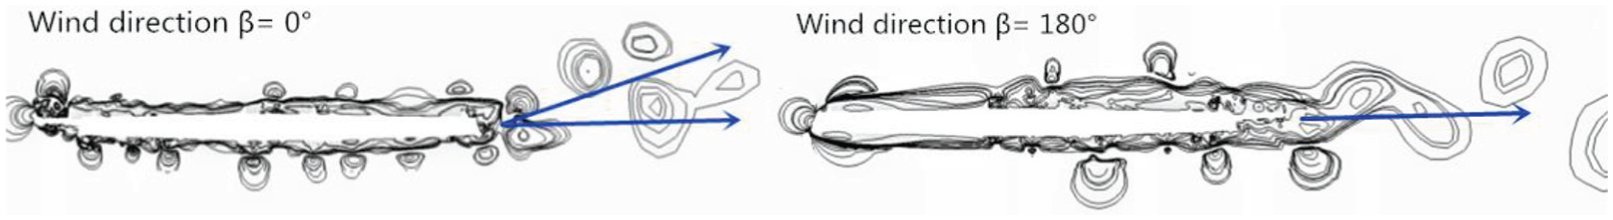
Mean velocity fields of bridge deck at wind direction of 0° and 180°.
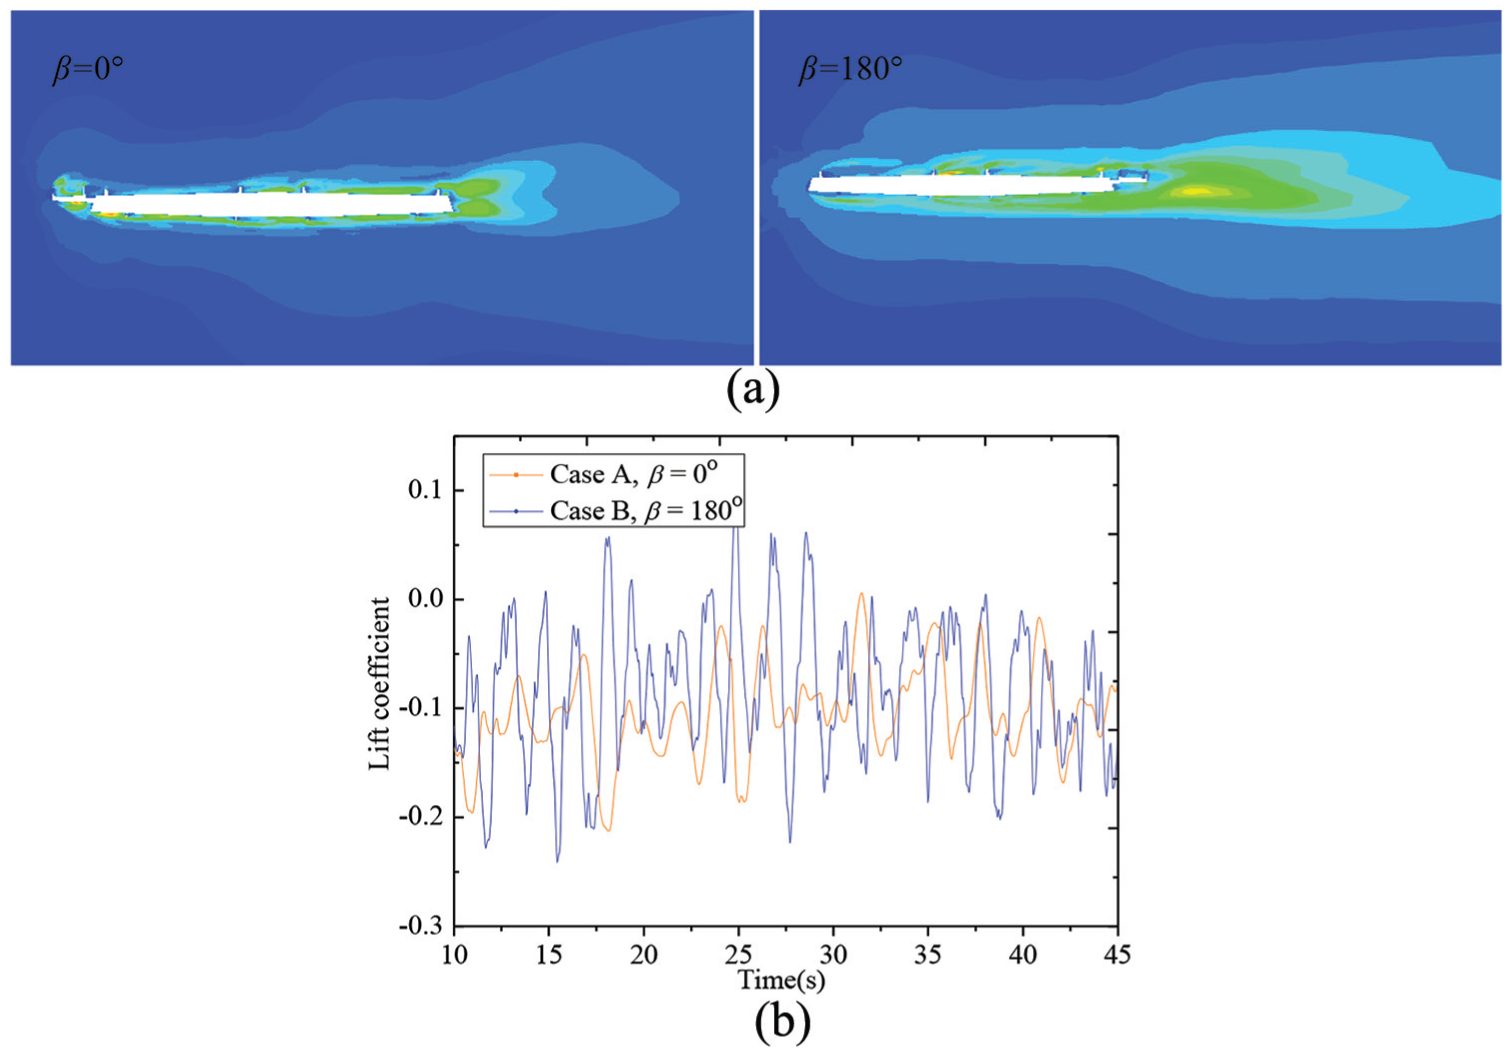
In order to further explain the VIV characteristics of the calculation case, the fluctuating pressure and aerodynamic forces are analyzed as follows. Figure 16(a) presents the contour of the fluctuating pressure around the bridge decks under different wind directions. It shows that the fluctuating pressure distribution in Case B is more extensive than in Case A, especially at the wake. Furthermore, the total lift fluctuation (root mean square value of the lift coefficients) on the bridge deck in Case B is much larger than in Case A, as shown in Figure 16(b). These two details can explain the corresponding experimental results, that is, that the vertical amplitude of VIV under the wind direction of 0° is much less than that under 180° (shown in Figure 6).
Fluctuating pressure and aerodynamic forces on the bridge deck.
To conclude, the VIV mechanism of the bridge deck under the two wind directions can be attributed to the same vortex shedding mode (i.e. the Kelvin–Helmholtz vortex and the Kármán vortex street). On the other hand, the different vibration characteristics of the two cases can be explained by the different flow structures around the bridge deck mentioned above.
Conclusion
In this study, VIVs are performed for a bridge deck with an asymmetrical composite beam under five wind attack angles and two wind directions. The effects of damping ratios, wind barriers, and vehicles on the VIV behavior are examined. The mechanism of VIV is investigated by numerical method. The meaningful results are summarized as follows:
The VIV properties of the bridge deck in the completion stage varied with the wind directions as a result of the asymmetry of the main girder. The maximum vertical amplitude of the VIV of the bridge deck in the service stage was found to occur at a wind attack angle of −5° and a wind direction of 180°, while the maximum torsional amplitude was found at a wind attack angle of −5° and a wind direction of 0°.
No explicit VIV vibration was observed in the tests conducted on the construction condition section model. However, explicit torsional VIV was observed. The maximum amplitude was found to be 0.27° at an attack angle of −2.5° and a wind direction of 0°. This suggests that bridge deck accessories are especially unfavorable to vertical VIV.
Both vehicles and wind barriers have positive effects on the suppression of the vortex vibration of the bridge when the wind direction is 0°, but have amplification effects when the wind direction is 180°.
The vertical (torsional) maximum amplitude of the VIV of the bridge deck decreased from 179 (0.35°) to 42 mm2 (0.09°) as the damping ratio increased from 0.5% to 1.5%. This suggests that increasing the damping ratio reduces VIV responses.
The VIV mechanism of the bridge deck under the two wind directions can be attributed to the same vortex shedding mode, that is, Kelvin–Helmholtz vortex and Kármán vortex street. While, the location of the vortex generation and direction of the vortex shedding at the wake are strongly influenced by the wind directions, resulting in the variation of the VIV properties of the bridge deck with the wind direction.
Footnotes
Declaration of Conflicting Interests
The author(s) declared no potential conflicts of interest with respect to the research, authorship, and/or publication of this article.
Funding
The author(s) disclosed receipt of the following financial support for the research, authorship, and/or publication of this article: Financial support from the National Natural Science Foundation of China (Project No 51778545) is gratefully acknowledged.