






Abstract
This study discusses the wind-induced response of existing pitch-controlled 1.25 MW wind turbine structures, with a particular focus on the influence of the blade-rotation effect, cross-wind loads of the tubular tower and the wind direction, and compares numerical responses with the measured dynamic responses. An integrated finite-element model consisting of blades, a nacelle, a tower and a foundation is established. The aerodynamic loads exerted on the rotating blades and the aerodynamic loads acting on the tubular tower are then obtained. A wind-induced response calculation method of the wind turbine structures corresponding to different wind speeds and wind directions is established for performing a wind-induced response analysis. Finally, comparisons between the measured responses and the corresponding numerical response results are performed to verify the accuracy of the proposed wind-induced response calculation method. The results indicate that neglecting the cross-wind aerodynamic loads of large-scale wind turbine structures can lead to unsafe design. The wind direction has different influences on the along-wind and cross-wind dynamic responses. The statistical values of the measured dynamic responses are slightly greater than those of the numerical analysis results, but the magnitudes of the responses are the same. Therefore, the proposed wind-induced response calculation method for wind turbine structures is feasible and reasonable. It can be used to conduct the fatigue life prediction of wind turbine tubular towers in future research which is an important issue in the structural design of wind turbine tubular tower structures.
Keywords
Introduction
With blades rotating, the wind speed of any point on the blade-rotational plane not only reflects the fluctuating property of wind speed against time but also involves the wind speed fluctuation induced by periodic variation of a spatial point coordinate. This phenomenon is named as ‘rotating effect of the blades’. In general, the gravity, operating load, cyclic load exerted on the rotating blades and the variation of the wind direction can give rise to complex vibrations of wind turbine tubular towers, which tends to result in the fatigue damage, and overturn failure. Furthermore, in order to guarantee the fatigue reliability of the tubular towers, it is essential to study the wind-induced response of wind turbine tubular towers.
At present, time-domain analysis is the only recognized technique for wind-induced response analysis of wind turbine structures. In fact, wind-induced response time-domain analysis method is based on the continuously deepening modelling method of the whole wind turbine structure. In the initial research, researchers have adopted a simplified cantilever model of wind turbine structures to perform wind-induced response analysis (Sathe et al., 2013). Subsequently, it can be observed by more and more researchers that the dynamic characteristics of the blades directly affect the dynamic response of the tubular towers (Kessentini et al., 2010). Therefore, adopting the integrated coupling model to carry out the wind-induced response analysis of wind turbine structures becomes a consensus. Lobitz (1984) modelled the coupling of the tubular towers and the blades through a connection matrix. Moreover, wind-induced response analysis was conducted. However, the integrated model of wind turbine structures was based on the analytical mechanics method, which requires complex mathematical derivation and only applies to fewer degree of freedom models. By employing multi-body dynamics and the finite-element method, Kühn (2001) established an integrated model of wind turbine structures and conducted the wind-induced response. Although the integrated model considered the rotational effect of the blades effectively, adopting the beam element to fully model the dynamic characteristics of the tubular towers was difficult. Murtagh et al. achieved the coupling connection between the blades and tubular towers according to the shear-transfer mechanism, used a rotationally sampled spectrum to consider the rotating effect of the blades, and conducted a wind-induced response analysis of wind turbine structures. However, neglecting the moment, torque and axial force transfer can lead to inaccurate results (Murtagh et al., 2005). In sum, the previous investigations into the wind-induced response based on the integrated coupling model did not consider the influence of the cross-wind load and wind direction. Furthermore, the existing wind turbine professional codes (Germanischer Lloyd and Wind Energy Committee, 2010; IEC 61400-1:2005, 2005) do not consider the rotating effect of the blades.
The wind tunnel test has many drawbacks when used in wind turbine structures. For example, the Reynolds number of the scale model differs from that of the prototype wind turbine structures by an order of magnitude, which leads to the essentially different flow property, aerodynamic properties, three-dimensional characteristics and unsteady properties of the blade surface flow. Moreover, the rotational effect of the blades is difficult to achieve in the scale model. National Aeronautics and Space Administration (NASA) performed a wind tunnel test on wind turbine structures at the Ames wind tunnel test centre and compared the response results with those obtained by the numerical method (Simms et al., 2001). It was concluded that the numerical response results and experimental response data differed significantly. Combined with the relatively high cost, the wind tunnel test has not been widely used in the wind turbine structures. To date, field measurement is the most direct method for studying the wind-induced response of wind turbine structures. Moreover, it can be used to verify the accuracy of the wind-induced response numerical calculation results, which would be used in the subsequent wind-induced fatigue life prediction of wind turbine tubular towers. Huang et al. measured the strain and displacement response of wind turbine tubular towers on-site and compared the measured results with numerical calculation results (Huang et al., 2012). In fact, the field test of wind turbine structures mainly concentrated on the structural vibration properties (Molinari et al., 2011), including the natural frequencies and damping. So far, few researchers compare the numerical response results with corresponding field test data.
Therefore, it is essential to investigate the wind-induced response of wind turbine tubular towers, which considers the along-wind and cross-wind loads, blade-rotation effect and wind direction. In addition, it is also necessary to verify the accuracy of the wind induced response calculation method proposed in this study through comparing the response results based on this method with the measured response data.
In this study, a detailed integrated finite-element model, consisting of a rotor, nacelle, tower and foundation, was established. The aerodynamic loads exerted on the rotating blades and the along-wind and cross-wind aerodynamic loads exerted on the tubular towers were then obtained, respectively. Finally, calculation method of wind turbine tubular towers corresponding to different wind speeds and wind directions was established to conduct the wind-induced response analysis, followed by a comparison with field test response data.
Integrated finite-element model
This study considers an existing pitch-controlled 1.25 MW wind turbine structure located in Zhangjiakou City, Hebei Province, China, based on which an integrated finite-element model was built (Figure 1) in ANSYS software. Due to the commercial secret, the wind turbine manufacturer cannot provide the detailed blade geometrical parameter data. Based on the same natural frequency, the three blades are simplified as cantilevers with rectangular cross-sections. The length, width and depth of each blade are 54.38, 2.86 and 0.064 m, respectively. The mass of the rotor (including the blades and hub) is 45,000 kg. The nacelle and its internal components are treated as an integrated part in the model. The length, width and height of the nacelle are 13.6, 4.7 and 4.7 m, respectively. The mass of the whole nacelle is 85,000 kg. The main body of the tower consists of four segments with varying cross-sectional properties. These segments are 8, 18, 24 and 30 m in height (from bottom to top), yielding a total height of 80 m. The corresponding tube thicknesses for the four segments are 52, 42, 30 and 18 mm, respectively. The diameter of the tower decreases linearly from 4.2 m at the bottom to 2.58 m at the top. A 10 m × 10 m × 1.8 m reinforced concrete raft foundation is located at the bottom of the tower.

Integrated finite-element model.
It is worth noting that when wind turbine structures are in operation, the centrifugal force along the axial direction of the blade can increase the bending stiffness along the flap-wise direction of the blades. In this study, an angular velocity about the rotational axis was applied to the components, including all the elements of the blades, to consider the stress stiffening effect.
Aerodynamic loads of wind turbine structures
In general, because of different aerodynamic properties induced by the rotating blades, the aerodynamic loads of the wind turbine structures can be divided into two parts: one is the aerodynamic load exerted on the tubular tower and the other one is the aerodynamic load acting on the blades. The latter considers the rotating effect of the blades through the rotational Fourier spectrum model.
Rotational Fourier spectrum
A field test confirmed that, owing to the blade-rotation effect, the turbulent wind field around the rotating blades differs significantly from that around the non-rotating blades (Powell and Connell, 1987). Moreover, the blade-rotation effect makes the turbulent wind spectrum energy produce fundamental changes, especially in the high-frequency components (Powell and Connell, 1987). Therefore, to obtain accurate analysis results, it is necessary to adopt the rotational spectrum model instead of the classical turbulent wind spectrum to simulate the wind field around the blades (Huo et al., 2019; Ke et al., 2015; Powell and Connell, 1987). Therefore, it is necessary to construct a rotationally sampled spectrum at a theoretical level to accurately reflect the impact of the blade rotation.
Currently, there are two important types of rotationally sampled spectrum models: the Pacific Northwest Laboratory (PNL) model (Powell and Connell, 1987) and the Sandia National Laboratory (SNL) model (Veers, 1988). These two models creatively provide a theoretical approach for solving the large-scale rigid rotation of the blades, changing the kinematic problem of the blade-rotation into a static problem. However, the PNL model has a strict requirement regarding the origin spectrum (classical turbulent wind spectrum), which greatly restricts its application. In addition, the SNL model does not satisfy the Law of Conservation of Mass or the Navier–Stokes equation. He proposed a rotational Fourier spectrum model without considering the influence of the phase angle on the cross-power spectrum (He, 2011). However, the wind field around the blades has a strong vortex, and it is essential to consider the influence of the phase angle in the cross-power spectrum on the wind field around the blades. In fact, the rotational Fourier spectrum model considering the influence of phase angle in the cross-power spectrum was systematically derived by the authors in this study (Huo et al., 2019). Herein, the detailed derivation process is omitted, and only the final derivation results are given.
The rotational Fourier auto-spectrum can be represented by the following formula (Huo et al., 2019)
The rotational Fourier cross-spectrum can be represented by the following formula (Huo et al., 2019)
Here,
In equation (1) through equation (2),
Wind field simulation of wind turbine structures
In this study, the Kaimal wind spectrum (GB/T 18451-1:2012, 2012; IEC 61400-1:2005, 2005) is used to conduct the wind field simulation of the tubular tower. Furthermore, the rotational Fourier spectrum proposed in this study is recommended for simulating the wind field around the rotating blades.
Dynamic analysis model of wind turbine structure
In fact, both the tubular tower and blades are suffering pressure load exerted on their surfaces. (Hu et al., 2016). In this study, the SFGRAD and SFE commands in ANSYS software were adopted to define the surface load gradient between two selected input points and exert the aerodynamic surface load, respectively. As shown in Figure 2, seven non-uniformly distributed input points on the tubular tower and four uniformly input points on each blade are chosen to conduct the wind field simulation of the wind turbine structure.

Dynamic analysis model of the wind turbine structure.
Wind field simulation of tubular tower
For mean wind speed, the exponential model describing the wind shear effect is also used in the wind turbine structures. The tubular tower can produce a block effect on the incoming flow, which leads to the change in the incoming flow value and direction, that is, the tower-shade effect. With regard to the upwind wind turbine structures, a potential flow model is adopted to consider the tower-shade effect (Bossanyi, 2010). The specific formula of the modified mean wind speed
where
Finally, the modified mean wind speed can be obtained after considering the tower-shade effect, as shown in Table 1. To facilitate to describe the calculation results, the mean wind speed at the height of the hub
Mean wind speed of each input point on the tubular tower.

In this study, the turbulent wind fields around the tower are simulated using the harmony superposition method. The spectrum matrix
According to the theory of Shinozuka, the fluctuating wind speed
where
Here, input point 5 is selected to show the wind field simulation results of the tower. The longitudinal and lateral fluctuating wind speeds of the tower at point 5 are shown in Figure 3.
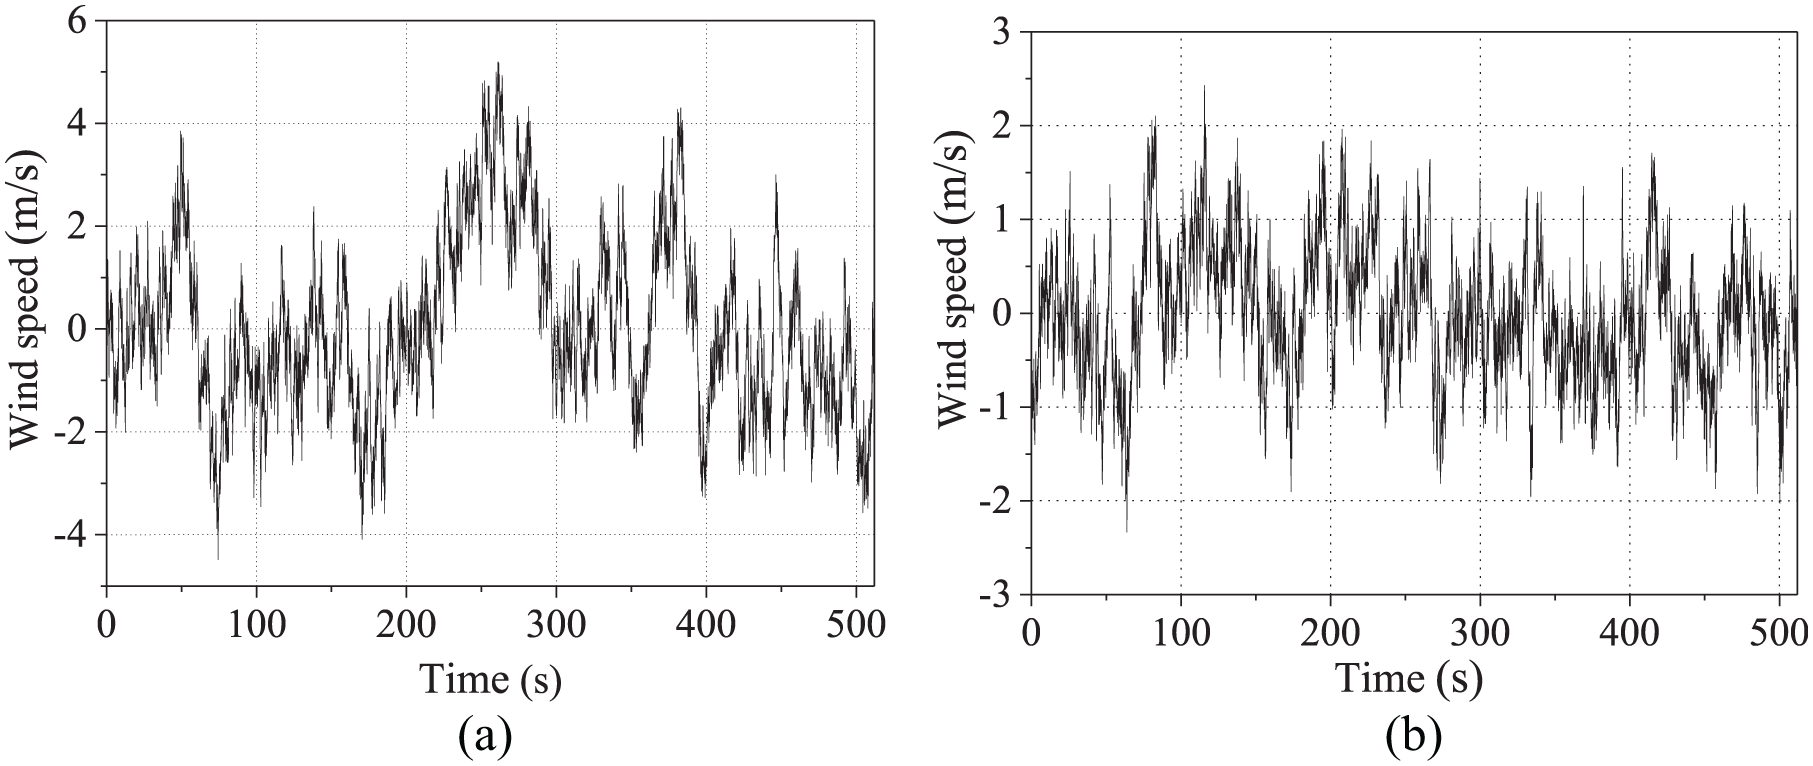
Fluctuating wind speed of the tubular tower at input point 5: (a) longitudinal fluctuating wind speed and (b) lateral fluctuating wind speed.
Wind field simulation of blades
With the blade rotating, the vertical height of any point on the blade represents harmonic variation. Based on the exponential model, the mean wind speed of any point on the blade
where
In fact, the mean wind speeds of the blades are also affected by the tower-shade effect. It is worth noting that in equation (3),

Mean and fluctuating wind speed of the blade at input point 9: (a) mean wind speed of the blade and (b) fluctuating wind speed of the blade.
Aerodynamic loads on blades
At present, the modified Blade Element Momentum (BEM) theory, including the blade tip and hub loss correction and thrust coefficient correction, is used to calculate the aerodynamic loads of the blades through the simulated wind speed obtained in the ‘Wind field simulation of wind turbine structures’ section in this study. In this study, the rotating speed of the blades is approached according to the following aspects: (1) the incoming velocity of blades, which can be obtained by the wind field simulation according to the rotational Fourier spectrum model (including the rotating speed), and (2) the axial induction factor, circumferential induction factor, inflow angle and attack angle in the BEM theory.
To calculate the aerodynamic loads on the blades, the aerodynamic parameters of the aerofoil should be provided (Sun et al., 2017). It is worth noting that the blades used in this study adopt Flygtekniska Forsoksanstalten Aeronautical Research Institute of Sweden-wind energy (FFA-W) series aerofoil (designed by a famous manufacturer in China). Comparisons of geometric shapes of three aerofoils in FFA-W3 are provided in Figure 5. In this study, three aerofoils, FFA-W3-211, FFA-W3-241 and FFA-W3-301, are used on the outer edge

Comparison of geometric shapes of three kinds of the FFA-W3 aerofoil.
In fact, the local pitch angle of the blades consists of the pitch angle at the blade tip and geometric twist angles corresponding to different sections along the spanwise direction. Due to the commercial secret, the wind turbine manufacturer cannot provide the three-dimensional shape and detailed geometrical parameters of the blade. Therefore, as mentioned in integrated finite-element model section, the chord of the blade is equivalent to the constant value. The aerodynamic property curves of the three aerofoils were measured by Risø National Laboratory in Denmark. In addition, glass-reinforced plastic material is used in the blade (provided by a famous manufacturer in China).
For the considered wind turbine structure, the local pitch angle and adopted aerofoils for different input positions are illustrated in Table 2.
Aerofoil parameter data for the considered wind turbine structure.

According to BEM theory, the axial thrust and tangential force per unit length acting at input point 9 on the blades are given in Figure 6.

Axial thrust force and tangential force at point 9: (a) axial thrust force and (b) tangential force.
Aerodynamic loads on tubular towers
For tubular towers with circular sections, the aerodynamic loads mainly include the along-wind aerodynamic load and cross-wind aerodynamic load, according to the bluff body aerodynamics theory. In fact, the increasing height of the tubular towers produces the fact that the cross-wind vibration cannot be neglected.
Along-wind aerodynamic load
The along-wind aerodynamic loads per unit length exerted on the tubular towers
Owing to the lack of wind tunnel test data, the drag force coefficient CD must be determined through a theoretical model. According to the specification of the Engineering Sciences Data Unit (ESDU) 80025 (1980), the drag force coefficient of a two-dimensional smoothly circular cross-section can be described as
where
The along-wind aerodynamic load of the tubular tower per unit at point 5 is obtained, as shown in Figure 7.

Along-wind aerodynamic load of the tubular tower at input point 5.
Cross-wind aerodynamic load
In general, the cross-wind aerodynamic load mainly consists of two types of excitation components: (1) the aerodynamic load caused by the cross-wind fluctuating component of the incoming flow, and (2) the cross-wind lift force generated by the vortex shedding.
Vortex shedding lift force
For tubular towers with circular sections, when the wind speed increases to the subcritical range and the transcritical range, the vortex shedding exhibits significant periodicity according to the load code in China. The vortex shedding lift force of the tubular tower per unit length
where
In addition, when the wind speed increases to the supercritical range, the vortex shedding lift force exerted on the tubular tower shows significant random characteristics. In this study, the Vickery model (Vickery and Basu, 1983), which has good agreement with the prototype experimental results, is adopted to describe the vortex shedding lift force, which is indicated as
where
where
The coherence function between the two points
where
Using the harmony superposition method, the vortex shedding lift force for the specific input point can be obtained.
2.Aerodynamic load caused by the cross-wind fluctuating component
Holmes proposed that the aerodynamic load induced by the cross-wind fluctuating component is regarded as the projection of the along-wind drag force, which is caused by the resultant velocity of the mean wind speed and the cross-wind fluctuating component, acting in the cross-wind direction (Holmes, 2001). The corresponding aerodynamic load
where
In fact, when the reduced wind speed
where
According to the aforementioned theoretical method, the vortex shedding lift force and aerodynamic load caused by the cross-wind fluctuating component at input point 5 are shown in Figure 8.

Cross-wind aerodynamic load of the tubular tower at point 5: (a) vortex shedding lift force and (b) aerodynamic load caused by cross-wind fluctuating component.
Wind-induced response analysis of wind turbine tubular towers
Owing to the introduction of the rotational Fourier spectrum model, the traditional finite-element method can be adopted to perform the wind-induced response calculation for the wind turbine structures. The wind-induced response analysis results obtained in this study could be used to predict the fatigue life of wind turbine tubular towers in the future as long as the accuracy of the wind-induced response numerical calculation result is verified.
Wind-induced response calculation corresponding to different wind speeds and wind directions
The aerodynamic loads on the wind turbine structures corresponding to the arbitrary wind direction and the given wind speed are illustrated in Figure 9. X and Y axes are the body axes of the wind turbine structures.

Aerodynamic loads of wind turbine structures.

Schematic representation of the wind direction angle.
In fact, the wind-induced response of the tubular tower is closely related to the wind speed and wind direction angles. Therefore, the mean wind speed interval
Wind-induced response results of the tubular tower
Height-wise wind-induced response
For a wind speed of 12 m/s and a wind direction angle of 0°, the comparisons of the along-wind and cross-wind displacement mean and root-mean-square (RMS) values of the tubular towers along the tower height direction are shown in Figure 11. In addition, a comparison of cross-wind displacement response with and without the consideration of aerodynamic load exerted on the blades is conducted, as shown in Figure 12.

Comparisons of the along-wind and cross-wind displacement statistical values along the tower height direction: (a) displacement mean value comparisons and (b) displacement RMS value comparisons.

A comparison of cross-wind displacement response: (a) with the consideration of aerodynamic loads on blades and (b) without the consideration of aerodynamic loads on blades.
As shown in Figure 11, the magnitudes of the cross-wind responses are the same as those of the along-wind responses under the wind load, which indicates that the cross-wind vibration is relatively significant and must be considered in the wind-induced response analysis of wind turbine structures. Moreover, different from ordinary wind-sensitive structures, the cross-wind displacement mean value of wind turbine structures is not equal to zero (see Figure 11 and Figure 12(a)). Compared with the case without considering the tangential force (along the cross-wind direction), it can be found in Figure 12 that the tangential forces exerted on the blades, which is non-uniformly distributed and relatively large, cause the non-zero cross-wind displacement response mean value.
Wind-induced response corresponding to different wind direction angles
For a wind speed of 20 m/s, the along-wind and cross-wind displacement mean values along the tower height direction corresponding to different wind directions are provided in Figure 13.

The along-wind and cross-wind displacement mean value comparisons under the different wind directions: (a) along-wind displacement mean value and (b) cross-wind displacement mean value.
For all the considered cases, with the increase of the tower height, both the along-wind and cross-wind responses increase. However, the wind direction angle has a different influence on the along-wind dynamic response and cross-wind dynamic response. The along-wind displacement responses are maximized when the wind direction angle is 22.5°, whereas the maximum value of the cross-wind response appears at 67.5°. The reason for this is that the tangential force distributed non-uniformly along the cross-wind direction has a significant impact on the cross-wind displacement response.
Wind-induced response corresponding to different wind speeds
For a wind direction angle of 45°, the statistical values of the along-wind and cross-wind responses at the tower top corresponding to different wind speeds are given in Figure 14.

Comparisons of the along-wind and cross-wind displacement corresponding to different wind speeds: (a) displacement mean value comparisons and (b) displacement RMS value comparisons.
For all the considered cases, with an increase in the wind speed, the wind-induced dynamic responses of the tubular towers exhibit an increasing trend. It is also clearly observed that the along-wind response values are slightly greater than the cross-wind response values, but the magnitudes are the same.
Owing to the proprietary nature of the information, the variations of the pitch angle of the blades are not considered when the wind speed exceeds the rated wind speed. Therefore, the influence of the pitch angle variation on the wind-induced response of tubular towers when the wind speed exceeds the rated wind speed should be further considered in future studies.
The influence of the rotating effect of the blades on the wind turbine structures
Powell and Connell (1987) proposed for the first time based on their field test that the rotating effect of the blades would produce significant influence on the turbulent wind spectrum, especially in the high-frequency components. Therefore, it is essential to investigate the influence of the blade-rotation effect on the wind field, wind-induced response and fatigue life of tubular tower structures.
Due to the research findings obtained by the authors in this study (Huo et al., 2019), a comparison of wind field around the blades with and without the consideration of rotating effect at input point 13 (selected as a representative) is given in Figure 15. It can be seen that the rotating effect of blades significantly increases both the fluctuating wind speed amplitude and vibration frequency, which inevitably affects the wind-induced response and fatigue life of wind turbine structures.

Fluctuating wind speed comparison: (a) with the consideration of blade-rotation effect and (b) without the consideration of blade-rotation effect.
In addition, a comparison of the stress response RMS values with and without considering the rotating effect of the blades at the bottom of the tubular tower as well as at the doorframe for fatigue assessment is shown in Figure 16. It can be seen from Figure 16 that the stress response RMS values increase dramatically when considering the blade-rotation effect. The stress response RMS value is an important parameter in the frequency-domain analysis of fatigue life. It indicates that the rotating effect of the blades dramatically affects wind-induced fatigue life of the tubular tower. Powell and Connell pointed out that the fatigue life obtained by neglecting the blade-rotation effect was about 10 times of that by considering the blade-rotation effect (Powell and Connell, 1987). Therefore, it is essential to consider the rotating effect of the blades when wind-induced response analysis and fatigue life prediction of the tubular towers are conducted.

Comparison of stress response RMS values with and without the consideration of blade-rotation effect: (a) at the bottom of the tubular tower and (b) at the doorframe for fatigue assessment.
Comparison with field test data
Through the comparisons of the measured response and the numerical response, the accuracy of the wind-induced response calculation method proposed in this study can be verified. In the subsequent research, the verified wind-induced response analysis results are used to conduct the fatigue life prediction of wind turbine tubular towers.
Description of measured points
The existing wind turbine structure adopted in this study was measured by our partner, a famous wind turbine manufacturer in China. The measured points are located in the nacelle, where the unidirectional acceleration sensors are attached through the magnetic mounting base. The detailed measured point layout is shown in Figure 17. The anemometer is installed on the outer surface of the nacelle top and recorded real-time information regarding the wind speed and wind direction.

Measured wind turbine and layout of measured points.
Acceleration data analyses of measured points
Nine sets of the measured cases are given in Table 3.
Basic information for considered cases (year of 2017).

In this study, taking case 4 for instance, the acceleration response of the measured points and the wind speed and wind direction time series are shown in Figure 18.

Acceleration response of measured points and wind speed and wind direction time series for case 4: (a) acceleration response at measured point 1, (b) acceleration response at measured point 2, (c) wind speed time series and (d) wind direction time series.
Comparisons of measured response and numerical results
To verify the accuracy of the wind-induced response calculation method used in this study, the acceleration responses corresponding to the same wind speed, wind direction and location, which are obtained via the numerical method, are extracted for comparison with the measured acceleration responses.
It is an undoubted fact that there is a difference between the measured response and corresponding numerical calculation results due to the significant random characteristics of wind speed. Obviously, it is not appropriate to compare the measured response time history and numerical results directly. Therefore, the statistical variables in time domain and frequency domain are used to verify the correctness of the numerical method in this study. Based on the randomness of wind environment in the field, few researchers could provide the relatively reasonable approach to describe this statistical difference. In this study, as long as the statistical variables of the measured responses and corresponding numerical response results are in the same order of magnitude, the numerical response results are acceptable. That is to say, the accuracy of wind-induced response numerical method proposed in this study can be guaranteed.
Definition of cases for comparison
In this study, the cases for comparison, which combine the wind speed and wind direction, are defined for comparison with the corresponding measured cases. The determination principle of the case for comparison is that when the measured mean wind speed falls into the wind speed interval with an increment of 2 m/s, the interval endpoint value, which is closest to the measured mean wind speed, is taken as the wind speed of the case for comparison. The mean value of the measured wind direction is regarded as the wind direction angle of the case for comparison. The cases for comparison, which correspond to the measured cases, are shown in Table 4.
Determination of the cases for comparison.

The along-wind and cross-wind accelerations corresponding to case 4 for comparison are shown in Figure 19.

Along-wind and cross-wind acceleration responses of the case 4 for comparison: (a) along-wind acceleration response and (b) cross-wind acceleration response.
Time-domain comparison analysis
Time-domain comparison analysis, which consists of statistical analysis and correlation analysis, is a relatively direct method. The mean values of all considered cases are given in Figure 20(a). The RMS value comparisons of the acceleration responses for measured point 1 are provided in Figure 20(b).

Measured acceleration statistical value comparisons: (a) mean measured acceleration and (b) measured acceleration RMS at measured point 1.
As clearly shown in Figure 19, for all the cases and measured points, the numerical mean accelerations are equal to zero. For point 1, it can be found in Figure 20(a) that the measured mean accelerations are between −0.1 and 0 m/s2, which are close to zero and have good agreement with corresponding cases for comparison. For point 2, the measured mean accelerations are between −0.38 and −0.3 m/s2, which are quite different from the corresponding cases for comparison (the accelerometers have been initialized to zero). Therefore, compared with the case of point 2, the deviation of mean value from the corresponding numerical result of point 1 is smaller.
In addition, based on the vibration test data and simulation results (Zhang, 2016), the imbalance in mass, which produced by dust or snow on blades, or due to certain imperfect quality of blades, can intensify the vibration of nacelle in the directions both perpendicular to the spindle (point 2) and parallel to the spindle (point 1) (see Figure 17). However, the vibration of nacelle is severer in the direction perpendicular to the spindle (point 2). Therefore, it can be concluded that the imbalance in mass may cause the larger vibration and mean value deviation of point 2. In sum, the measured acceleration responses of point 1 can be used to verify the accuracy of the method for calculating wind-induced response in this study.
As shown in Figure 20(b), for all the considered cases, the RMS values of the measured acceleration responses are apparently greater than those obtained via the numerical analysis, but the order of the magnitudes are the same.
Furthermore, the correlation analysis of the vibration signal is introduced to conduct the wind-induced response comparison, as detailed in Figure 21(a). In order to describe clearly the difference between the measured response and numerical response, the logarithmic coordinate in Y-axis is adopted.

Correlation function and acceleration response spectrum comparisons for case 4: (a) autocorrelation function comparison and (b) acceleration response spectrum comparison.
As illustrated in Figure 21(a), compared with the statistical value comparisons, the autocorrelation function of the measured acceleration response exhibits better agreement with that of the numerical response.
Frequency-domain comparison analysis
In addition, frequency-domain comparison is performed to verify the wind-induced response numerical method. The detailed results are given in Figure 21(b).
As clearly shown in Figure 21(b), the measured acceleration spectrum exhibits good agreement with the numerical acceleration spectrum, especially in the regions that are close to the natural frequencies of the wind turbine structure. Although there are differences between the wind-induced responses induced by the two different methods, the magnitudes are the same.
It can be concluded that for all the cases considered, the measured response values and the numerical responses are in the same order of magnitude, indicating the high accuracy of the proposed wind-induced response numerical method. The differences between the numerical and measured results are possibly due to the difference between the integrated finite-element model and the actual wind turbine structure, especially for the blade due to the technical secret of the manufacturers. Furthermore, the additional vibrations, including the equipment vibration inside the nacelle; the inevitable mass eccentricity of the blades, not facing the wind direction in real time; and the quick changes in the wind speed and wind direction can lead to greater measured results.
Summary and conclusion
Based on an existing 1.25 MW wind turbine structure, an integrated finite-element model including all components such as rotor, nacelle, tower and foundation is developed using ANSYS software. The wind field of the wind turbine structure was simulated using the harmony superposition method, in which both tower-shade effect and rotational Fourier spectrum model were taken into account. The aerodynamic loads of the blade based on the modified BEM theory and the aerodynamic loads of the tubular tower (including along-wind and cross-wind aerodynamic loads) based on the bluff body aerodynamics theory were calculated, respectively, by means of the simulated wind speed. The wind-induced response analysis of wind turbine tubular towers corresponding to different wind speed and wind direction cases was carried out, followed by the comparison with the existing measured data. As a result, the following conclusions can be made.
For large-scale wind turbine structures, the cross-wind vibration was relatively significant, which should be considered in the wind-induced response analysis of wind turbine structures.
Different from the ordinary wind-sensitive structures, the tangential forces exerted on the blades caused a non-zero cross-wind mean displacement response. Wind direction had a different influence on the along-wind and cross-wind dynamic responses.
Compared with the mean stress, the stress RMS value was significant influenced by the rotating blades, which indicates that it is essential to consider the impact of rotating blades when wind-induced response analysis and fatigue life prediction for the wind turbine tubular towers are conducted.
The statistic variables of the measured response, such as mean value and RMS value, were greater than those of the numerical responses, but all statistic variables had the same order of magnitudes. This indicates that the wind-induced response analysis method proposed in this study is reasonable, which can be used in the wind-induced fatigue life prediction for the wind turbine tubular towers.
Supplemental Material
Highlights – Supplemental material for Wind-induced response analysis of wind turbine tubular towers with consideration of rotating effect of blades
Supplemental material, Highlights for Wind-induced response analysis of wind turbine tubular towers with consideration of rotating effect of blades by Tao Huo and Lewei Tong in Advances in Structural Engineering
Footnotes
Acknowledgements
The authors thank the Ministry of Science and Technology of China for financially supporting the research in the paper through the Grant No. SLDRCE14-B-04.
Declaration of Conflicting Interests
The author(s) declared no potential conflicts of interest with respect to the research, authorship, and/or publication of this article.
Funding
The author(s) disclosed receipt of the following financial support for the research, authorship, and/or publication of this article: The research received financial support by the Ministry of Science and Technology of China through the Grant No. SLDRCE14-B-04.

References
Supplementary Material
Please find the following supplemental material available below.
For Open Access articles published under a Creative Commons License, all supplemental material carries the same license as the article it is associated with.
For non-Open Access articles published, all supplemental material carries a non-exclusive license, and permission requests for re-use of supplemental material or any part of supplemental material shall be sent directly to the copyright owner as specified in the copyright notice associated with the article.
