
Abstract
With the capacity models in the 2004 edition of the European Committee for Standardization’s Standard Design of Concrete Structures, a more realistic limit state function is obtained for reinforced concrete columns with random loads eccentricity. Using this function, the applicability of the code-based design factors is discussed. Taking the wind-dominated combination as an example, the probabilistic distribution of loads eccentricity and the statistics of column resistance are analyzed for representative cases. The analysis indicates that the possible loads eccentricity is scattered over a large range, and the probabilistic model of column resistance varies from case to case, which is largely different from the resistance model assumed in previous reliability calibration. With Monte Carlo simulation, the column reliability and the contributions of both tension failure and compression failure to the total failure probability are calculated and obtained for different cases. The results show that the fixed loads eccentricity criterion underestimates differences in the reliability of columns for different loads eccentricity cases and overestimates the column reliability in some tension failure cases. Furthermore, it is found that the tension failure mode contributes most to the total failure probability for not only some columns designed to fail in tension failure but also for some columns designed to fail in compression failure. To attain a robust design, a group of optimum wind load factors varying with cases is recommended. The new calibration results prove that the recommended wind local factors can achieve a better goal.
Keywords
Introduction
Wind disasters cause enormous socio-economic losses every year all over the world. For example, Hewston and Dorling (2011) reported that the average annual insured losses from wind-related domestic property damage in the United Kingdom are in excess of £340 million in 2005; Li and Ellingwood (2006) and Unanwa et al. (2000) investigated the great losses of residential construction and the social disruption caused by hurricanes in the past two decades in the United States; and Goliger and Retief (2007) reported the severe damages to the sustainability of the human habitat and built environment in Southern Africa. Two reasons are mainly attributed to this issue. One is that the extreme wind events happened more frequently, for example, 1999 wind storm in France (Sacré, 2002). Another is that some existing structures are not sufficiently windstorm-resistant. Hence, to reduce losses caused by wind disasters, many researchers have paid great attention to build more accurate probabilistic models of wind effects on structures, for example, wind speed, gust response factors models (Drew et al., 2013; Gatey and Miller, 2007; Kwon and Kareem, 2013; Sacré et al., 2007; Żurańskį, 2003), and to check whether the existing structures are safe enough by loss estimations with uncertainties in wind and structural resistance, for example, wind fragility or vulnerability analysis, and intervention costs of buildings due to wind-induced damage (Alduse et al., 2014; Cui and Caracoglia, 2015; Peiris and Hill, 2012; Stewart et al., 2016).
For addressing these issues properly in practice, a code-based design is required for the structures at sites with frequent typhoon or strong wind. To achieve balances between safety and economy, a reasonable target reliability is often prescribed for structural members in design codes (e.g. ACI Committee, 2016; EN 1992-1-1, 2004). Generally, the target safety level can be well achieved for structural members by using the design methods in codes, because the code-based design method is obtained by statistical analyses of column resistance (see Ellingwood, 1977; Grant et al., 1978) and reliability analyses of high-strength or normal-strength columns (see Diniz and Frangopol, 1997; Szerszen et al., 2005), and it usually can lead to sufficient windstorm-resistance for the design wind action.
However, some unfavorable outcomes have been found recently for the reinforced concrete (RC) columns. For example, damages of RC columns subjected to a strong wind are usually more severe than they are expected to be. This initiates some scholars’ interests in the safety level of RC column under strong winds. Li (2008) investigated the reasons why some RC columns used to support aqueduct bridges collapsed severely under a strong wind in China. Holický and Vrouwenvelder (1996) found that the reliability differences among 12 cases are much considerable for columns designed by Eurocodes and the reliability level is insufficient in some cases.
In addition, one of the most common reasons for such unfavorable outcomes of columns is the imperfections of design methods in codes (e.g. ACI Committee, 2016; EN 1992-1-1, 2004). The imperfections mainly result from the reliability calibrations following the fixed loads eccentricity criterion for RC columns. It is reported that the design methods in codes can cause a possible unsafe design (i.e. reliability much lower than target value) in some cases of tension failure (Jiang and Yang, 2013; Jiang et al., 2015), and they cannot achieve a uniform reliability under different cases (Jiang et al., 2016; Milner et al., 2001; Mohamed et al., 2001). Actually, the design methods in codes are often well suitable for the dead load and live load combination with a case of nearly fixed loads eccentricity (see Breccolotti and Materazzi, 2010; Hong and Zhou, 1999; Mirza, 1996; Stewart and Attard, 1999; Szerszen et al., 2005), but are not well suitable for the wind and gravity load combinations with a case of noticeably random loads eccentricity.
For reliability evaluations of RC columns, there are two primary models in capacity or resistance calculations. One model follows the analytical formulas in codes, for example, code-based models used by Hong and Zhou (1999), Jiang and Yang (2013), Jiang et al. (2016), Mirza (1996), and Szerszen et al. (2005), and another model works with finite elements, for example, fiber section model used by Frangopol et al. (1996) and Milner et al. (2001) and ABAQUS model used by Mirza and Lacroix (2002). In fact, the analytical capacity model of RC columns in codes has been validated by thousands of column tests, and can be applied well for reliability calibrations with both random and fixed loads eccentricity cases.
Considering random properties of loads eccentricity, Jiang et al. (2016) discussed the applicability of the column design methods in the ACI Committee (2016) in detail for wind-dominated combination, and recommended a group of improved wind load factors varying with cases to achieve the target reliability level. As mentioned earlier, the code-based design methods for columns follow the fixed loads eccentricity criterion in Europe as well as in America. Hence, further studies are also required on how to improve the column design for the European engineering practices (EN 1992-1-1, 2004). Moreover, due to random loads eccentricity, both the compression failure mode and tension failure mode would possibly contribute to the total failure probability, and the contribution analysis needs to be investigated for columns designed based on codes.
Based on the previous studies on column design methods in the ACI Committee (2016), this study focused on the reliability evaluation for column design methods in EN 1992-1-1 (2004). It attempts to build a more realistic reliability model for RC columns under wind-dominated load combination based on the widely accepted column capacity model in the code EN 1992-1-1 (2004). Then, the differences between the probabilistic analysis results of resistance and reliability results obtained by the fixed and random loads eccentricity criterion are discussed for different design cases. The contributions of failure modes to the total failure probability are also investigated for the code-based designed columns with different parameters. To achieve a more robust column design with uniform reliability, a group of improved wind load factors are recommended for design practices.
Design method in the code
Capacity model of RC column
For an RC column with the moment M (along a fixed principal direction) and the compressive axial force N, its model for capacity calculation often adopts an equivalent rectangular stress block assumption in the code EN 1992-1-1 (2004), as shown in Figure 1.
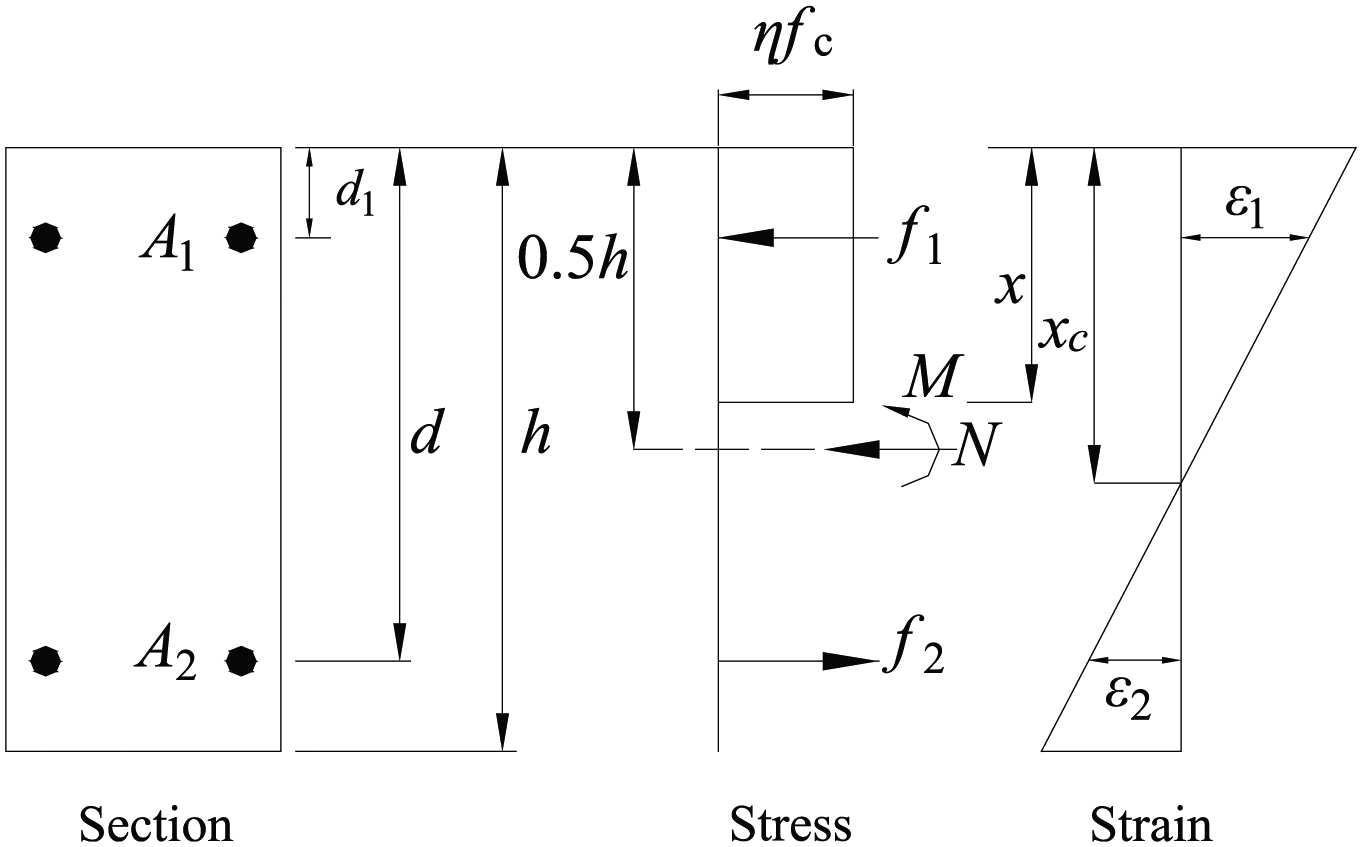
Capacity model of RC columns.
For a typical symmetrical rectangular section, the capacity formulas are given by
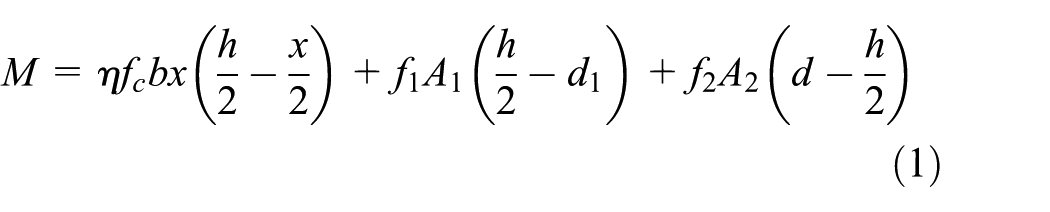

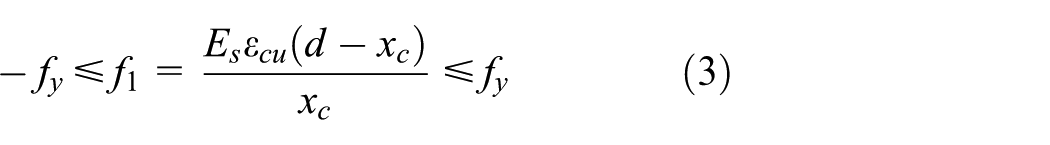
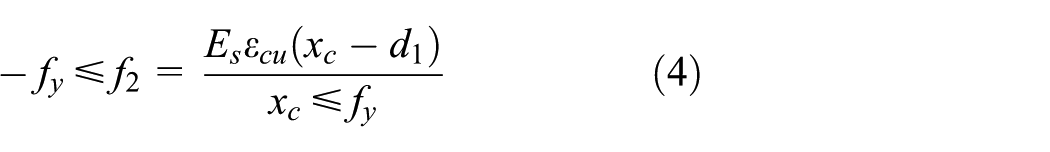

where ηfc is effective compressive strength of concrete, η = 1.0 for fc ≤ 50 MPa, and fc = compressive strength of concrete; f1 and f2 are the stress of steel for compression and tension, respectively; –fy and fy are the yield strength of steel for compression and tension, respectively; A1 and A2 are the area of compressive and tensile steel, respectively, whereby A1 = A2 (assumed true in the whole paper); h and d are the geometrical depth and effective depth, respectively; b is the section width; d1 is the distance from the center of gravity of the tensile (compressive) steel to the extreme tensile (compressive) fiber; xc and x are the depth of the real compression zone and the equivalent rectangular stress block, respectively, λ = 0.8 for fc ≤ 50 MPa; Es = 200 GPa is the elastic modulus of steel; εcu = 0.0035 is the assumed ultimate strain of concrete.
Design factors in the code
For a code-based design, the basic expression of design resistance and load effect is given by

where Ed is the design value of the action effect and Rd is the design value of the corresponding resistance.
For a basic combination of vertical load (including permanent G and imposed load Q) and horizontal wind W, the design values of action effects, Md and Nd are given as


where γG, γQ, and γW = 1.35, 1.5, and 1.5 in the code, respectively, and Gk, Qk, and Wk are the characteristic values of permanent, imposed load, and wind, respectively. If wind dominates the load combination, then in equations (7) and (8), the imposed load action should be reduced by the appropriate factor ψQ (ψQ = 0.7).
In EN 1992-1-1 (2004), the structural resistance Rd is evaluated with the basic variables (e.g. variables describing the material properties, dimensions) adopting design values. For example, the design values of concrete and steel strength are given by
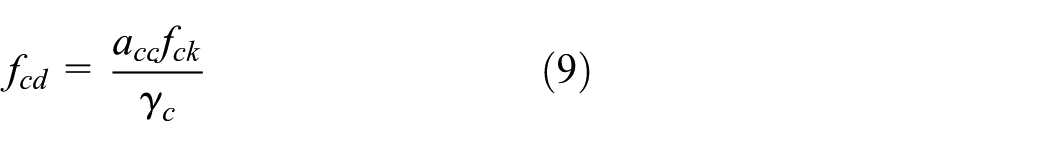
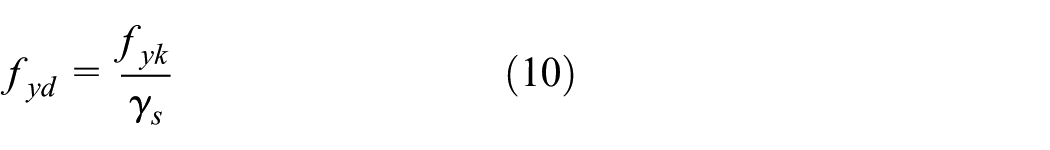
where fck and fyk are the characteristic values of concrete and steel strength, respectively; γc and γs = 1.5 and 1.15, which are the partial factors, respectively; and αcc is allowing for long-term effects and is taken as 0.85.
Note that the design factors mentioned above are calibrated with a reliability analysis based on the fixed loads eccentricity criterion. For this criterion, the limit state function is expressed by

where Z = performance function and ed = fixed loads eccentricity in design, ed = Md/Nd. This implies that the resistance assumed in equation (11) is only dependent of strength variables (e.g. concrete and steel strength) but independent of loads eccentricity variations.
Probabilistic analysis of loads eccentricity
Random properties of loads eccentricity
For a given structure under both wind and vertical load, the total moment and total axial force of a column section are random due to random properties of loads (i.e. Q, G, and W are all considered as random variables). These variables show a coefficient of variation (COV) of relevant magnitude. The statistics of load variables are given in Implementation of Eurocodes–Handbook2 (Leonardo Da Vinci Pilot Project, 2005) and shown in Table 1, which is in correspondence with the code EN 1992-1-1 (2004). Herein, since the wind load is considered to dominate the load combination, the arbitrary point-in-time model is selected for the imposed load.
Statistics of load variables.
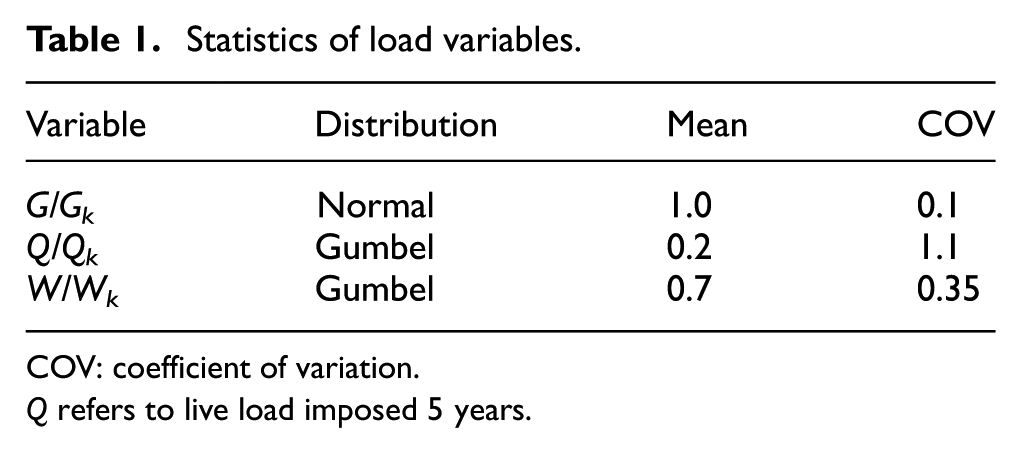
COV: coefficient of variation.
Q refers to live load imposed 5 years.
The random values of the combined moment and axial force are given by

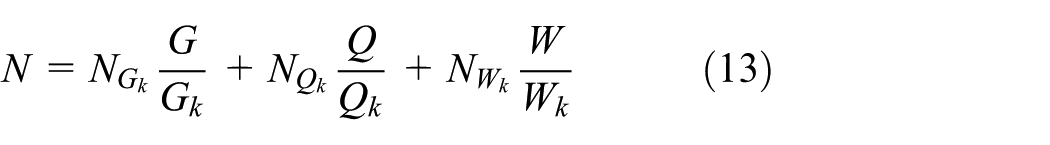
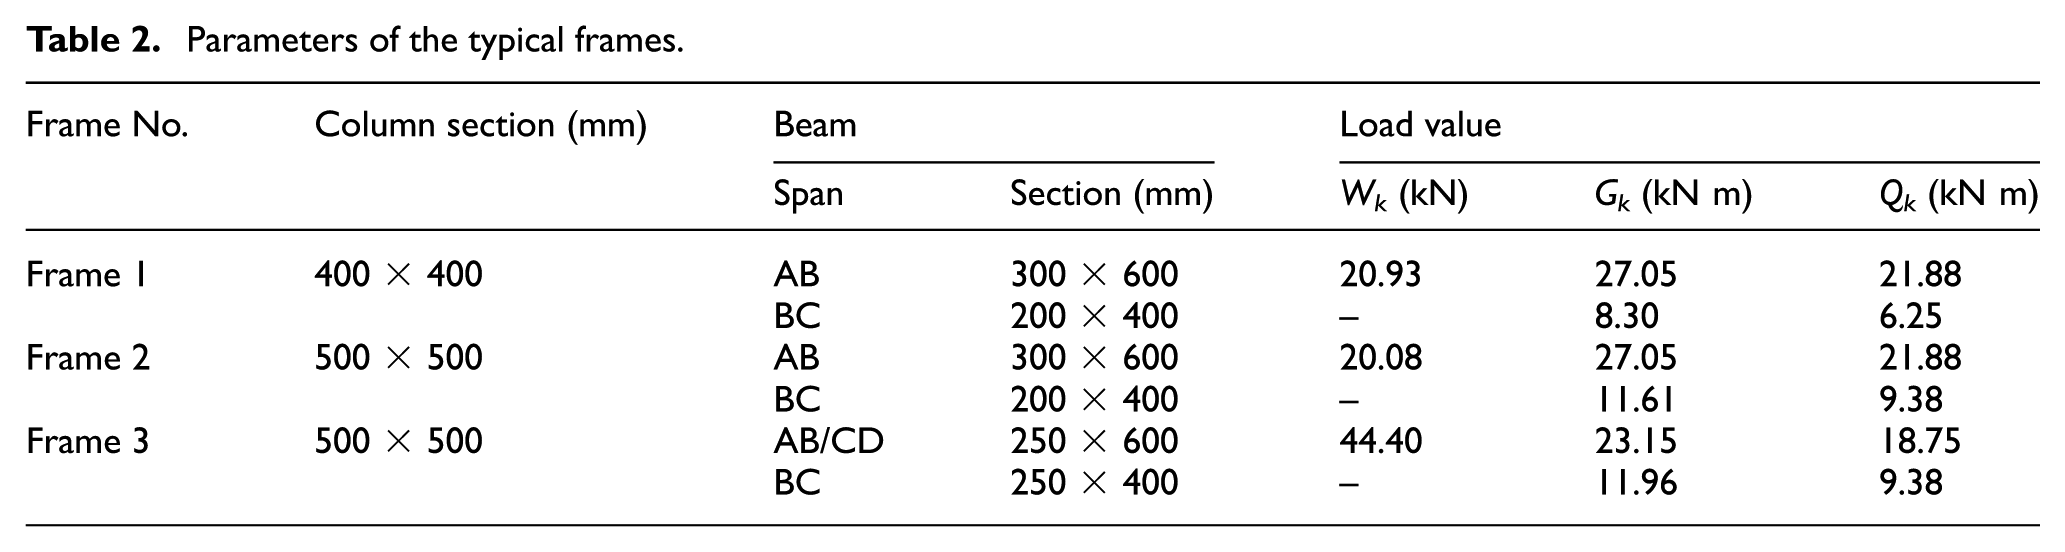
With the random moment and axial force, the column loads eccentricity e is calculated as
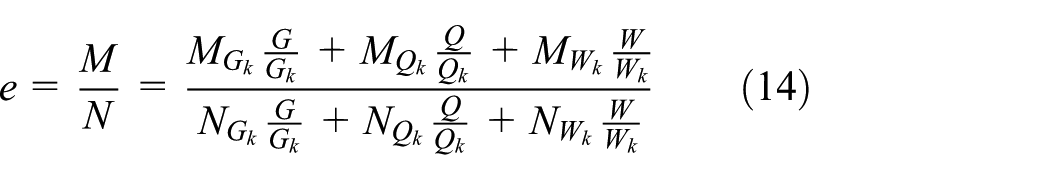
From equation (14), it is seen that e is dependent of not only the loads (e.g. G, W) but also the characteristic values of action effects (e.g.
Probabilistic analysis for typical frames
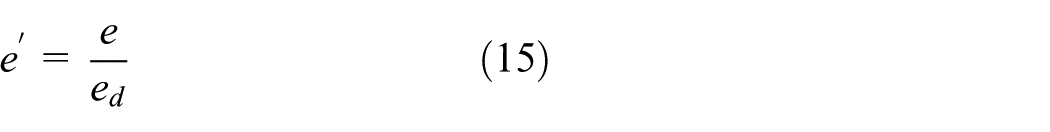
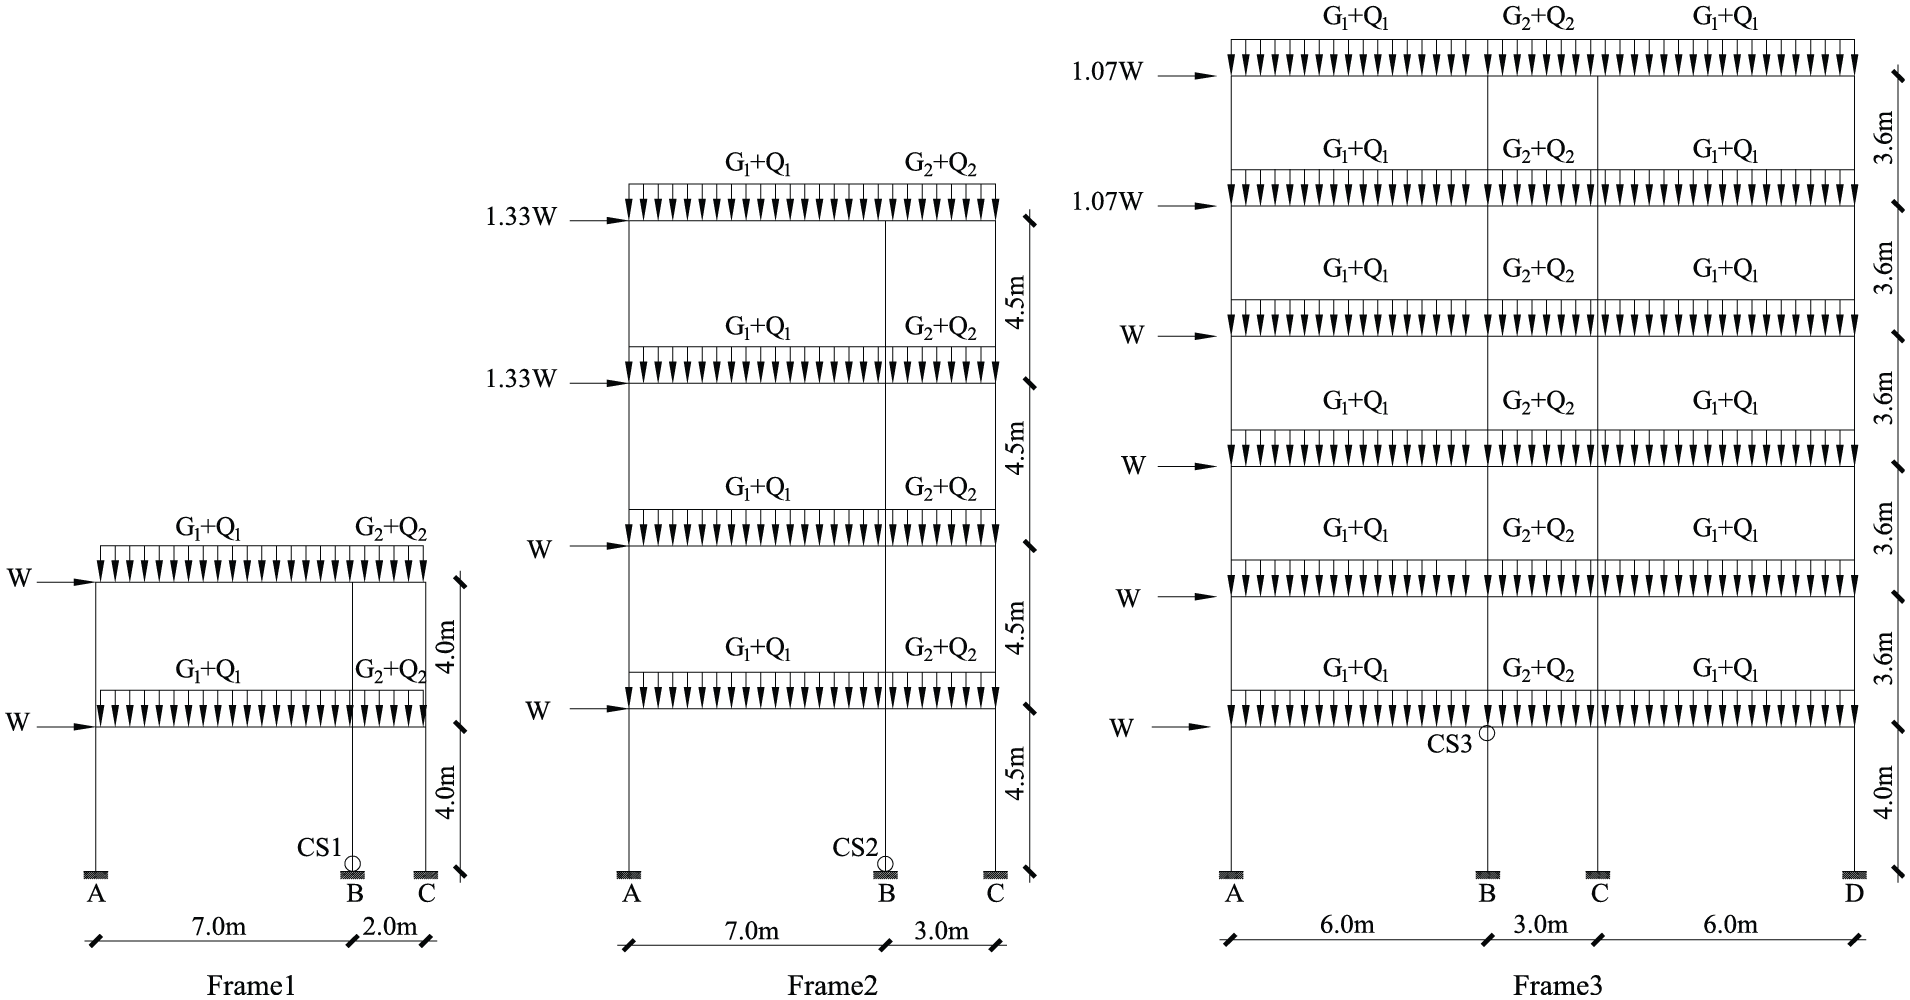
Consider three typical RC frames for the European engineering practices as shown in Figure 2. Their structural parameters are shown in Table 2, and the combination of permanent load and imposed load distributed in different spans are denoted as G1 + Q1 and G2 + Q2. Based on the European load code (Eurocode 1, 2005), the wind-induced internal forces can be calculated for these frame structures. The characteristic values of load effects for column sections (in kN m for the moment and in kN for the axial force) are obtained as shown in Table 3.
Computational model of the typical frame structures.
Parameters of the typical frames.
Load effects for the typical RC frames.
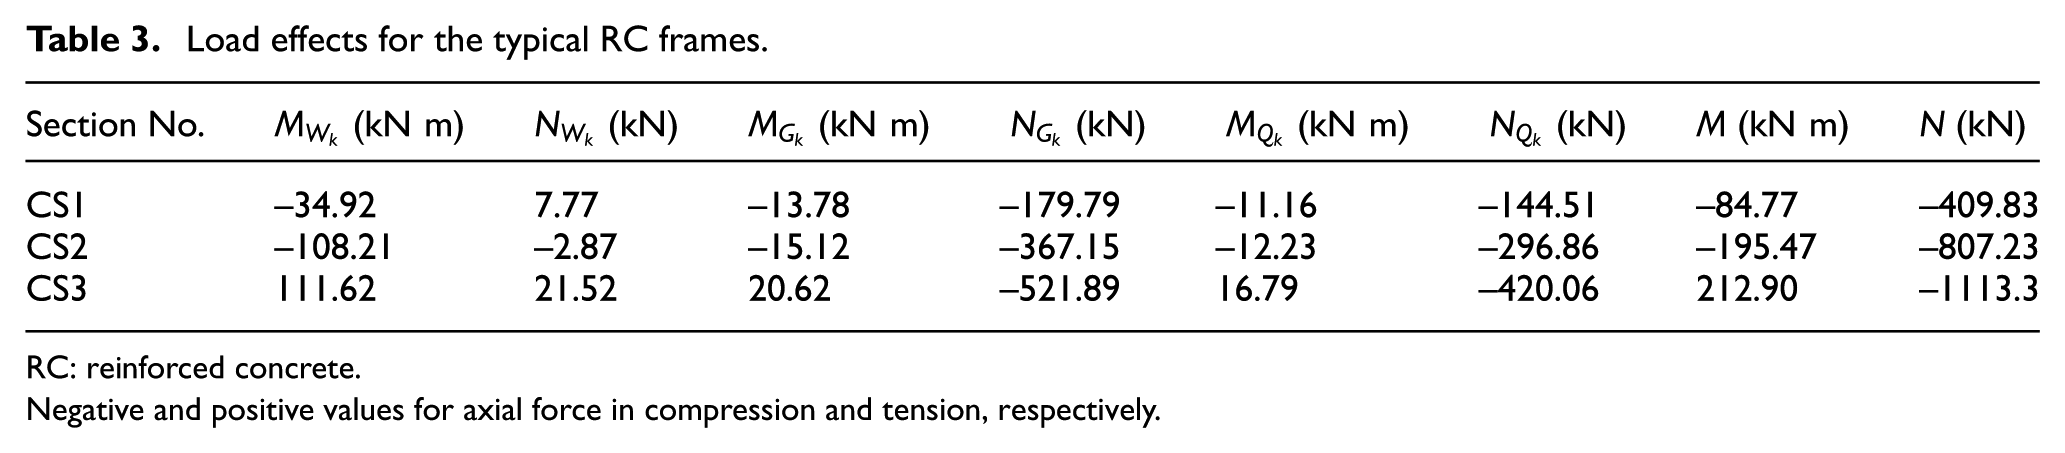
RC: reinforced concrete.
Negative and positive values for axial force in compression and tension, respectively.
With Monte Carlo simulation (MCS), the probability distributions of normalized loads eccentricity are shown in Figure 3. It is seen that the normalized loads eccentricity presents obvious random properties, and its random values are scattered over a large range [0.5, 2.0] for CS1, CS2, and CS3. The mean values are 0.983, 0.900, and 0.927 for CS1, CS2, and CS3, respectively. The COV are 0.253, 0.317, and 0.319 for CS1, CS2, and CS3, respectively. For CS2 and CS3 in taller frames, the wind-induced moment dominates the total moment more strongly (see Table 3) and it leads to a larger COV for the normalized loads eccentricity since the wind has the largest COV among three random load variables.
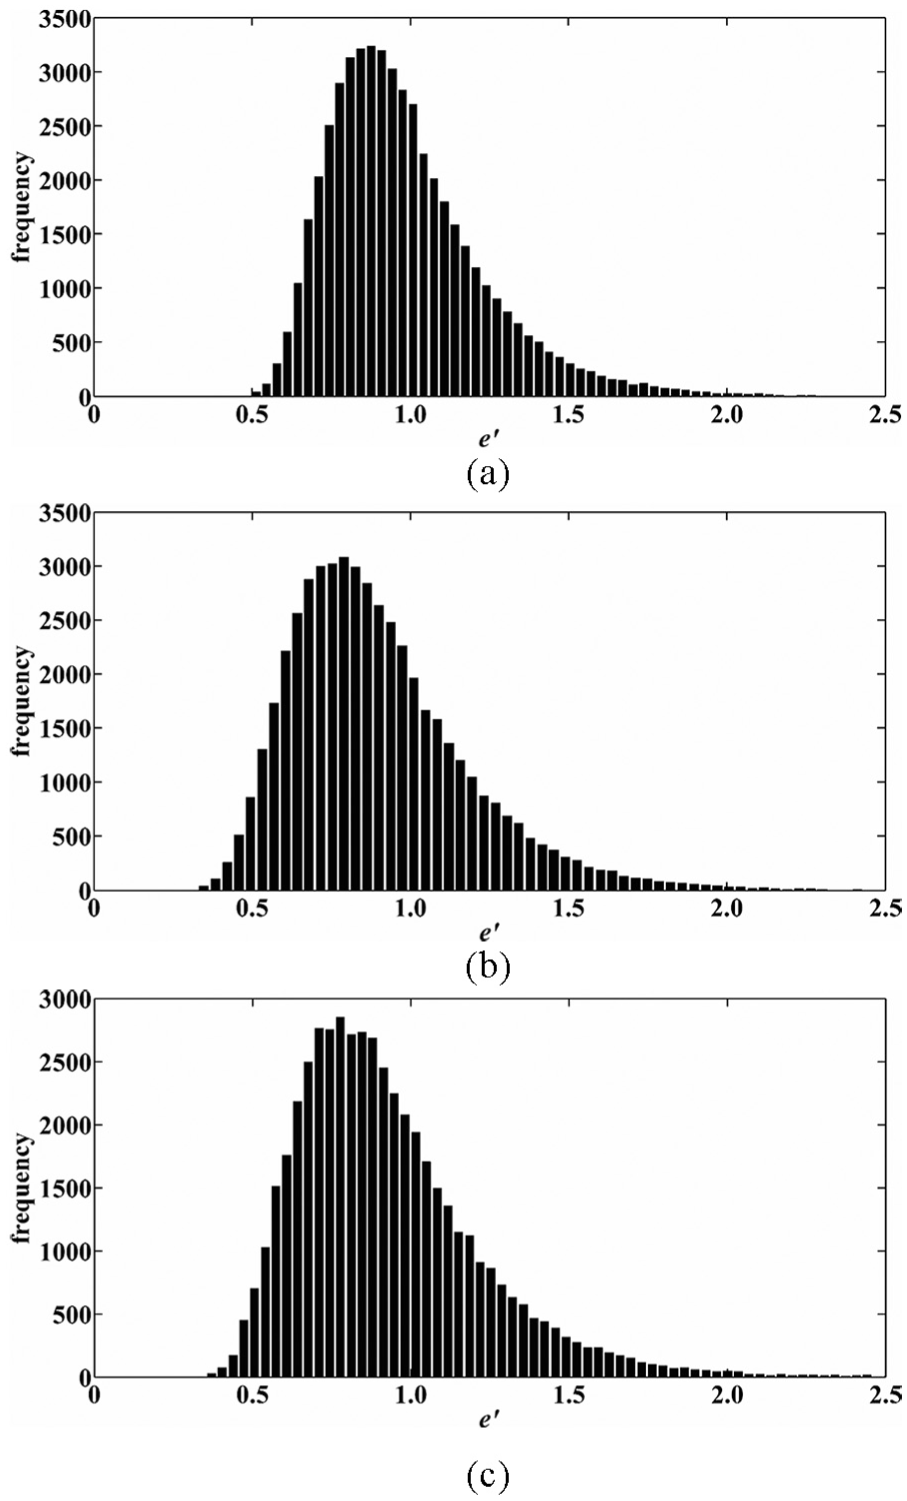
Probability distribution of loads eccentricity for frame structures: (a) mean = 0.983, COV = 0.253 for CS1 in Frame 1; (b) mean = 0.900, COV = 0.317 for CS2 in Frame 2; and (c) mean = 0.927, COV = 0.319 for CS3 in Frame 3.
Parametric probabilistic analysis of resistance
Related design parameters
Generally, design moment Md, design axial force Nd, concrete design strength fcd, and steel design strength fyd are used to check when considering limit state design. Suppose A1 = A2 = As, then the design equation is given by

where only terms of interest are shown in the equation for simplification.
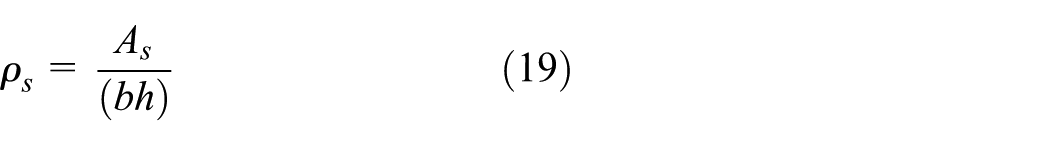
Reinforcement and axial force usually determine the bending capacity of an RC column with selected material configurations (i.e. concrete and steel) and a given section dimension. Herein, two normalized ratios, reinforcement ratio and axial compression ratio, are defined as
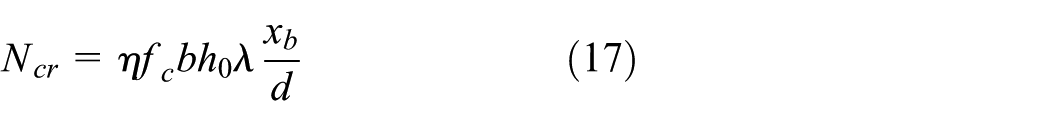
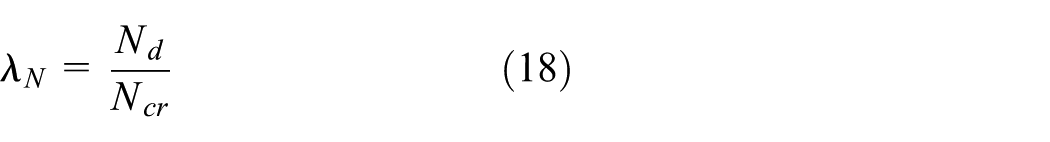
where Ncr is the design axial force under balanced failure and xb is the neutral axis depth at balance. If two ratios are selected, then the design moment Md can be solved by equation (16)
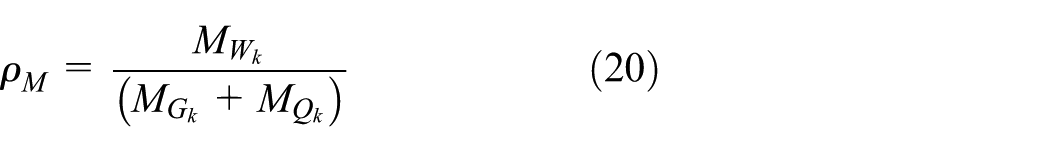
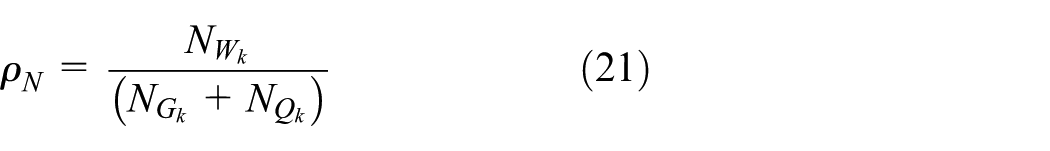
In order to distinguish differences of columns with different load effects, two ratios of moment and axial forces are often introduced in reliability analysis, too, and they are given by
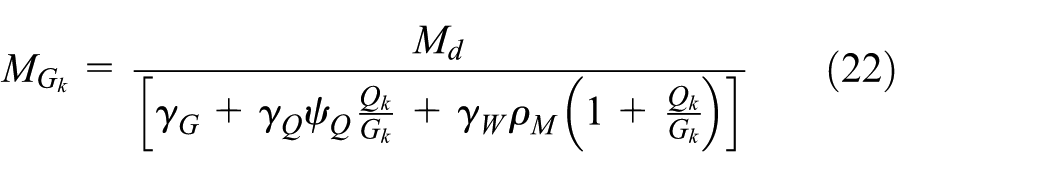
Then, the characteristic values of moment and axial force for each load are expressed as
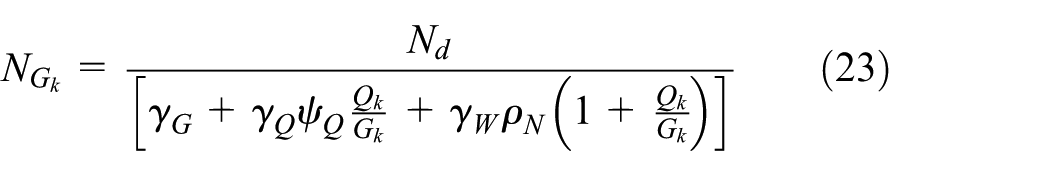
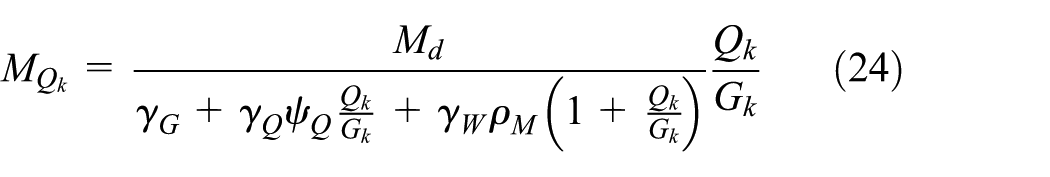
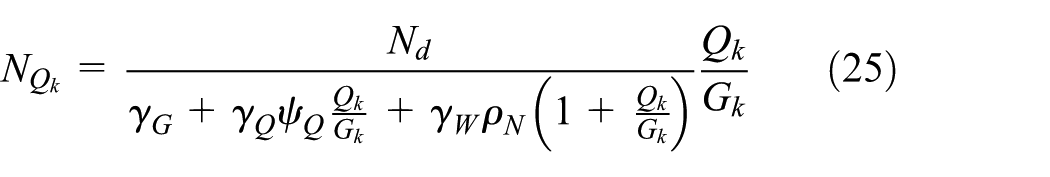
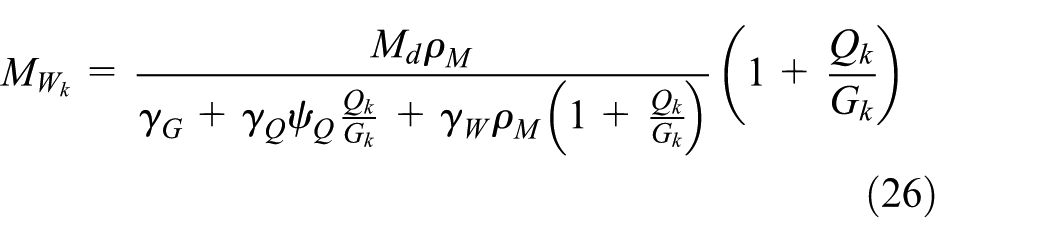
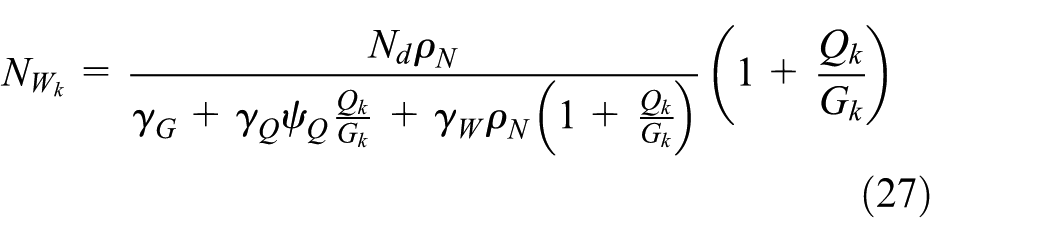
Substituting equations (22) to (27) into equation (15), the normalized loads eccentricity e′ is rewritten as
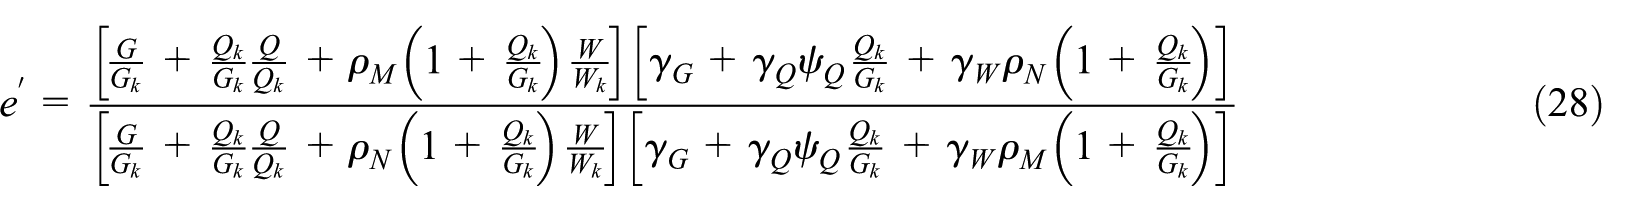
From equation (28), it is known that the random properties of load variables and two normalized parameters, ρM and ρN, have a significant effect on the random properties of e′.
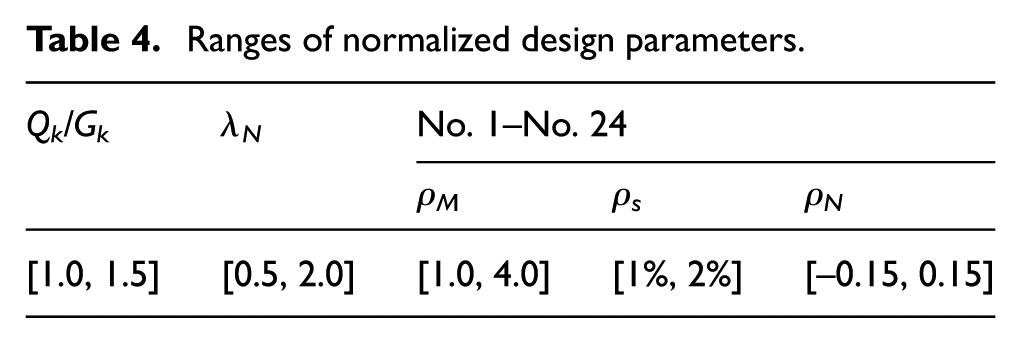
If the random properties of resistance and load variables are all given, the reliability of the RC column may still vary largely with different values of ρs, λN, ρM, and ρN. Thus, the reasonable values of parameters are crucial for reliability evaluation. Ellingwood et al. (1980) reported a common value of Qk/Gk (1.0) for reliability calibration in 1970s. As living conditions improved these years, an increased value of Qk/Gk is accounted (1.5), and thus, two typical values, Qk/Gk = 1.0 and 1.5, are used in the following analysis. Furthermore, based on the analysis results of three structural scenarios (Jiang et al., 2015) and the results of three frames shown in Figure 2 and Table 3, and design requirements in practice, the common ranges of other parameters are also specified. Finally, the common ranges of these normalized design parameters are initially determined as shown in Table 4.
Ranges of normalized design parameters.
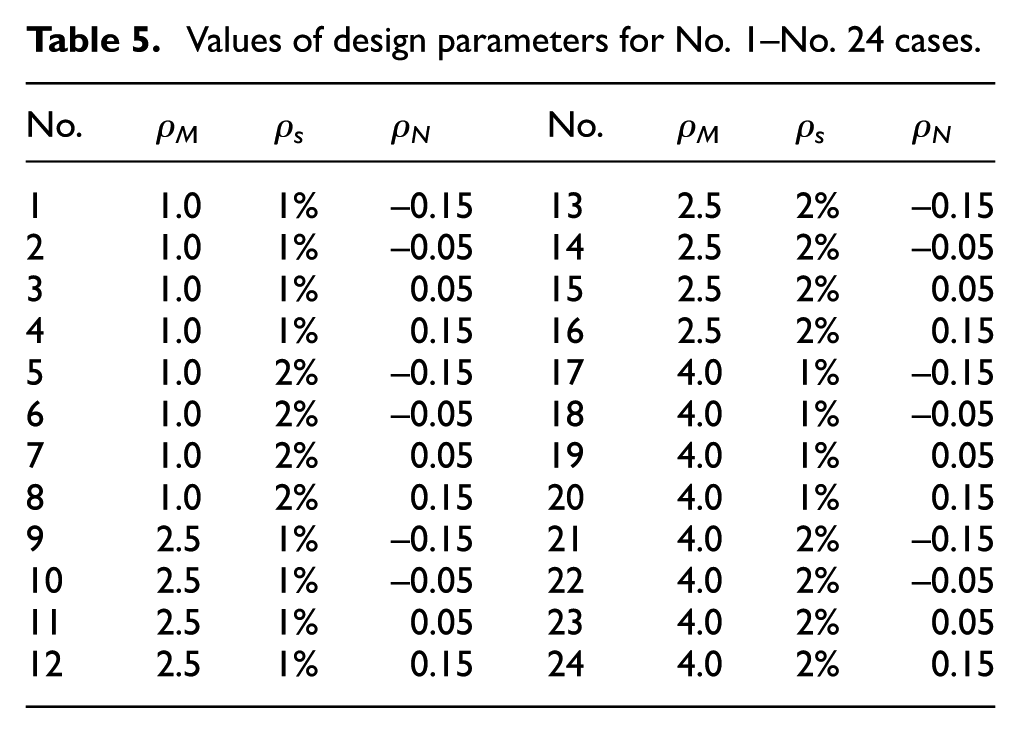
In this study, two, three, and four typical values are selected for ρs, ρM, and ρN, respectively, and they are uniformly distributed in the ranges of interest for No. 1–No. 24 cases, as shown in Table 5. As well, three typical λN values, λN = 0.5, 1.0, and 2.0, and two typical Qk/Gk values, Qk/Gk = 1.0 and 1.5, are considered for tension failure design case, balanced failure design case, and compression failure design case, respectively. Thus, there are 144 cases in total.
Values of design parameters for No. 1–No. 24 cases.
Probabilistic models of resistance variables
For resistance variables, fc and fy are considered as random variables and usually have large effects on column reliability due to their COVs of relevant magnitude. The other resistance variables (e.g. dimensions of column section) are considered as deterministic since they have a much smaller COV and no significant effects on the reliability.
The statistics of resistance variables are shown in Table 6, which is given in Implementation of Eurocodes–Handbook2 (Leonardo Da Vinci Pilot Project, 2005) and JCSS: Probabilistic Model Code (Joint Committee on Structural Safety [JCSS], 2002). Besides, the statistics of column resistance R/Rk are also given in Table 6 for reliability calibration with the fixed loads eccentricity criterion. It is noteworthy that the statistics of column are mainly from Eurocode; thus, it is different from those in ACI, for example, those recommended by Bartlett and MacGregor (1996).
Statistics of resistance variables.
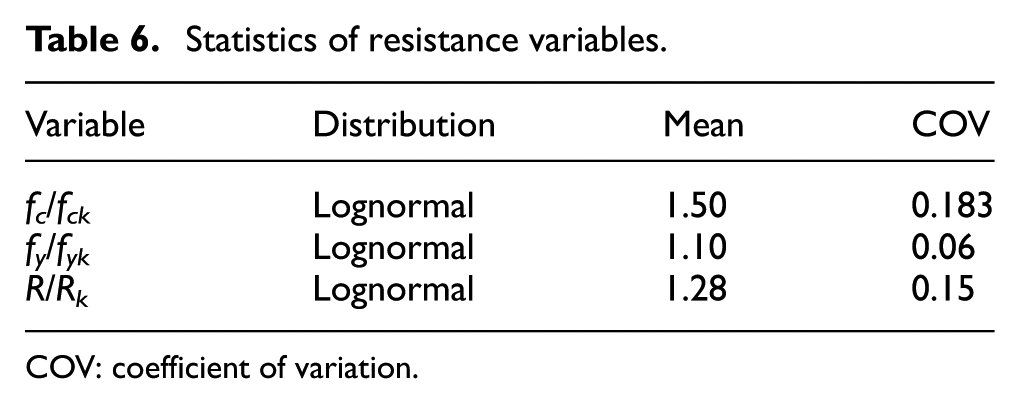
COV: coefficient of variation.
Statistics of resistance with random loads eccentricity
As mentioned earlier, the loads eccentricity produced by combined actions has important random properties for wind-dominated case including vertical actions. Moreover, the column resistance varies largely for different loads eccentricity cases. Thus, the statistics of column strength is dependent on not only the resistance variables (e.g. concrete strength, steel strength) but also the randomness of the loads eccentricity. Let Mu denote the bending strength of a column. Then, Mu is a function of multiple variables, namely, loads eccentricity e, concrete strength fc, steel strength fy, and so on. In this article, a normalized resistance factor R′ is introduced and given by
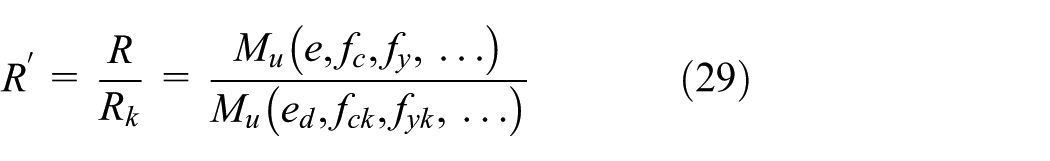
It is known that the statistics of R′ depends only on the resistance variables for columns with a fixed loads eccentricity. For simplification, the constant values for mean and COV of R′ are used in the previous reliability calibration of design code, and the corresponding data are presented in Table 6. However, for a column with a random loads eccentricity, its mean and COV of R′ are largely different from case to case.
Considering a short RC column with a symmetrical rectangular section, its column section is 500 × 500 mm, and concrete and steel materials, fck = 25 MPa and fyk = 400 MPa, are used, respectively. Characterization of the parameters required to define the short column is also shown earlier in Tables 4 and 5.
With MCS and statistics of resistance variables, Mirza (1996) obtained the statistics of resistance for columns with fixed loads eccentricity based on the capacity formulas in the codes and an associated reliability result. Herein, the resistance statistics of columns with random loads eccentricity are analyzed by MCS (run 5 × 10⁵ times) in a similar manner. It is found that for a short column with random loads eccentricity, the resistance statistics vary largely with different λN values; however, the resistance statistics are very similar for Qk/Gk = 1.0 case and Qk/Gk = 1.5 case. Thus, the results are only given for Qk/Gk = 1.0, and there are 72 cases totally in the following analysis.
The results show that the mean varies from 1.07 to 2.12 across all 72 cases. For COV, the difference is much smaller from 0.055 to 0.085. They are both different from the constant values assumed in the previous reliability calibration.
As known, for an RC column, the balanced failure case can also be included in the tension failure case. In Figure 4, the mean values for tension failure design case (e.g. λN = 0.5 and λN = 1.0 case) are much smaller than the values for compression failure design case (e.g. λN = 2.0). Therefore, the reliability in tension failure design case can be much lower than that in compression failure design case.
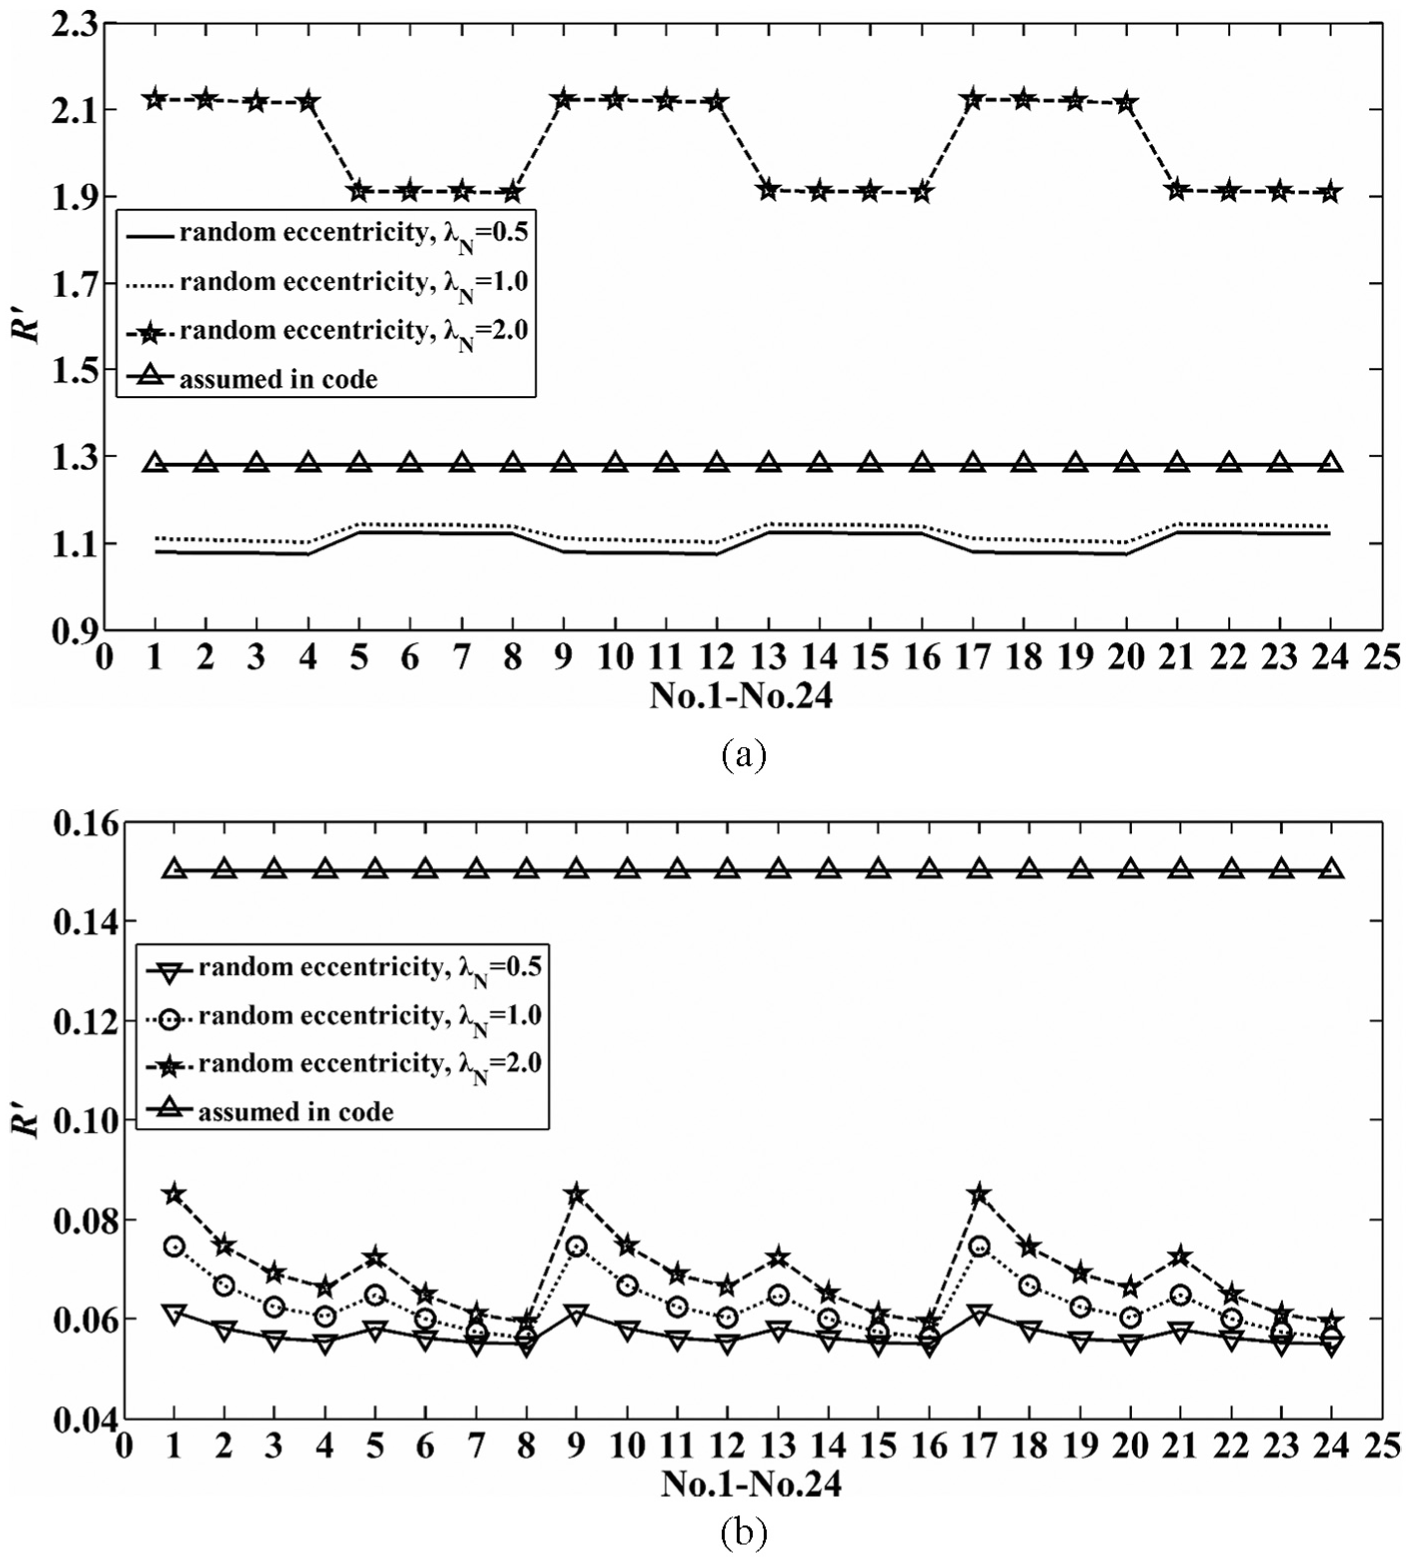
Statistics of resistance for columns with random loads eccentricity: (a) mean value and (b) COV.
Reliability evaluation of columns
Limit state functions with random loads eccentricity
Herein, to make a clear comparison between the random loads eccentricity criterion and the fixed loads eccentricity criterion, only short columns with loading uncertainty is involved, and geometrical imperfections, long-term creep effects, and second-order effects are not considered.
As mentioned above, the loads eccentricity has important random properties for wind-dominated case. Thus, a more realistic limit state function can be expressed by

where e is only due to loading (M/N).
An equivalent limit state function to equation (30) that considers random loads eccentricity can be obtained by using the N–M interaction equation based on equations (1) and (2), and it is expressed by
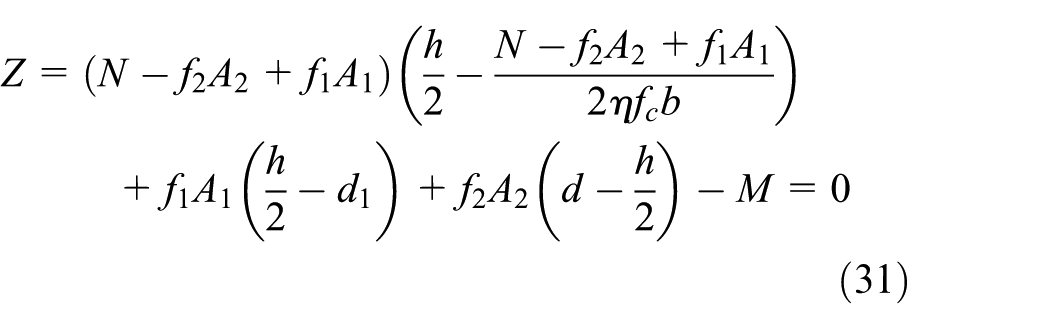
It shows that equation (31) is a nonlinear expression of resistance and load effect terms. However, equation (11) is a linear expression of moments M and the resistance term with a fixed loads eccentricity. Therefore, there is a large difference between equations (31) and (11).
Reliability analysis strategies
As well known, the reliability of a column is path-dependent (Milner et al., 2001), that is, if the gravity loads are applied first and then the lateral forces due to wind, the M–N load trajectory changes direction and the reliability is not the same as that when the gravity and lateral loads increase in proportion at a constant loads eccentricity. However, if the column cannot fail under the first applied gravity loads, the M–N load trajectory usually has a small impact on reliability. In engineering practice, there is only a tiny failure probability for a column designed for wind-dominated combination subjected to only normal gravity loads. Thus, for simplicity, the impact of the M–N load trajectory on reliability is not considered in this article, as well as in many other studies (e.g. Ellingwood, 1977; Mohamed et al., 2001).
After the design parameters are assigned, the reliability of the RC columns can be calculated from the statistics in Tables 1 and 6. Because of the complex nature of the limit state function, as shown in equation (31), MCS is used for reliability calculations. In this study, the main purpose of the MCS application is for searching the design points rather than record the frequency of failures.
Let

The main steps are shown in Figure 5. In order to achieve an accurate reliability result, the sampling number is selected as large enough for each case (107 for most cases). Moreover, the obtained MCS results are also compared with another method, which searches the design point by selecting 50 nodes uniformly distributed within the ranges of interest for each one among m–1 random variables, obtaining 50m–1 points on the failure surface, calculating distance from the origin for each point, and recording the point with the minimum distance. The reliability results given by these two methods match each other very well.
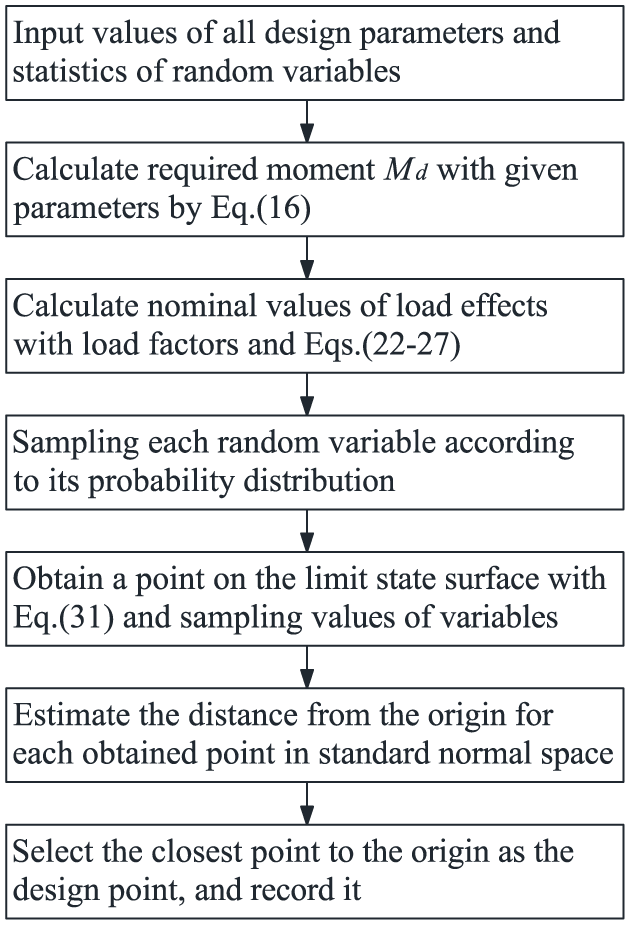
Flowchart for reliability analysis with random loads eccentricity.
Analysis results and discussions
With the flowchart in Figure 5 and the statistics of random variables in Tables 1 and 6, the reliability index is calculated for different cases of columns with random loads eccentricity. For comparison, the corresponding reliability index is also calculated for the fixed loads eccentricity cases. Finally, all the obtained results are shown in Figure 6.
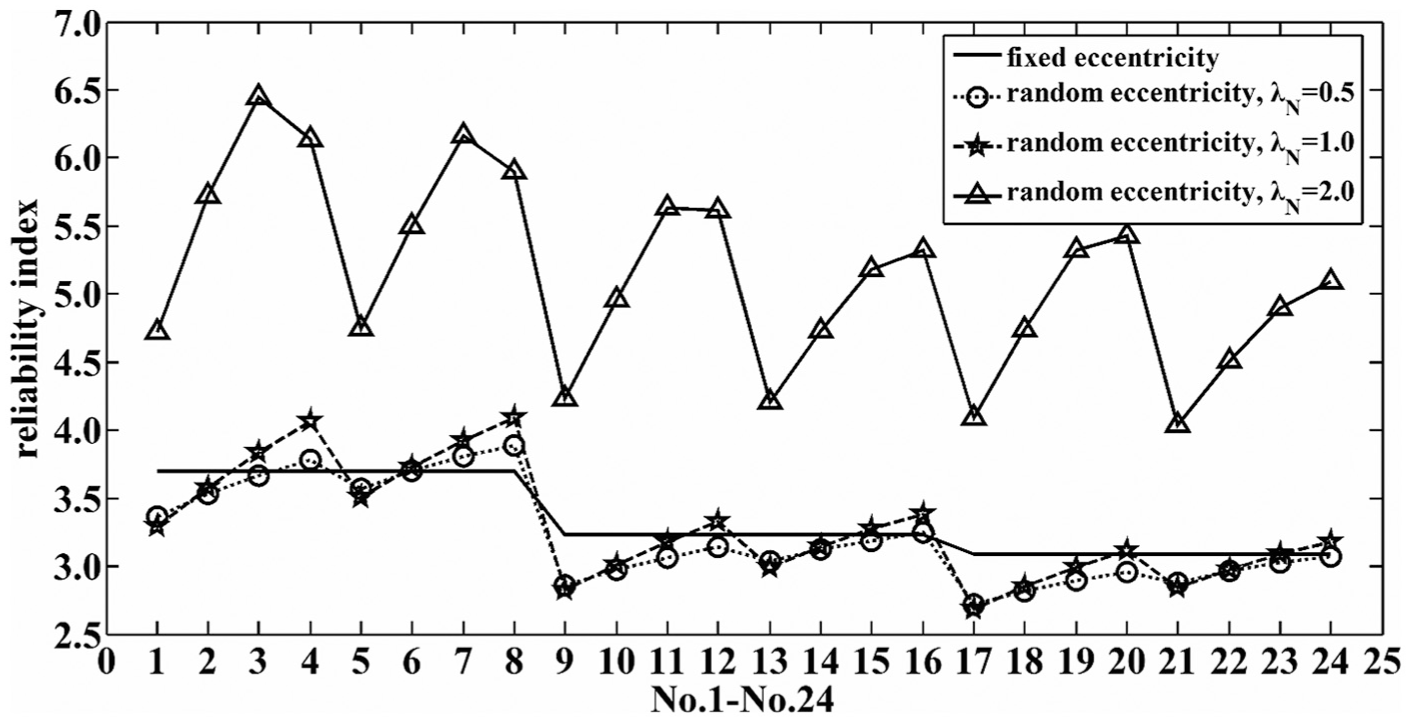
Reliability indexes with random loads eccentricity or fixed loads eccentricity.
Based on the code design method, if a fixed loads eccentricity criterion is used, the reliability index varies from 3.09 to 3.70 only with different values of ρM. But if the random loads eccentricity is taken into account, the reliability index will be different, and shows a scatter over a large range, especially for cases with λN = 2.0. For a total of 72 cases, the maximum and minimum values are 6.44 and 2.68, respectively.
In Figure 6, the reliability indexes based on the random loads eccentricity may be lower than those based on the fixed loads eccentricity in some cases or higher than those based on the fixed loads eccentricity in other cases. For some columns designed to fail in tension failure (λN not larger than 1.0), a lower reliability (e.g. 2.71 for No. 17, less than 3.8) may possibly be found, especially with a larger ρM. Even for the fixed loads eccentricity criterion, the lower reliability cases can also be found and it is reported for load combinations involving wind load (see Ellingwood et al., 1980; Jiang et al., 2016).
Failure mode contribution and improved design measures
Column failures under random loads eccentricity
There are two basic failure modes for RC columns, tension failure and compression failure, which are usually determined by the tension steel of the column section which yields or does not yield in the limit state. For a column design following the fixed loads eccentricity criterion, the failure mode is also assumed to be fixed as compression failure or tension failure, depending on the fixed loads eccentricity value for most cases. However, as mentioned earlier, the loads eccentricity has random properties; thus, the column failure should not be fixed as compression failure or tension failure.
Actually, each failure mode can make a contribution to the total failure probability when considering random properties of loads eccentricity as well as other variables. However, the contributions of each failure mode to the total failure probability can vary from case to case.
Contribution ration of failure modes
To investigate the contributions of each failure mode to the total failure probability under different axial compression ratios, another two larger values, λN =2.5 and 4.0, are considered additionally. Then, the corresponding contribution analysis is performed with MCS (108 in maximum) for all cases, which is 5 × 24 = 120 cases.
The results in Table 7 indicate that for some columns designed to fail in tension failure (λN = 0.5 and 1.0), only the tension failure mode would contribute to the total failure probability; for some columns designed to fail in compression failure (λN larger than 1.0), the compression failure would not always contribute as much as 100% to the total failure probability, and sometimes, the tension failure would even contribute more. For example, it shows that the tension failure mode contributes more for No. 6 case when λN = 2.0 (columns designed to fail in compression failure). However, there is only compression failure when λN = 4.0.
Proportion of compression failure and tension failure to the total failure with different cases.
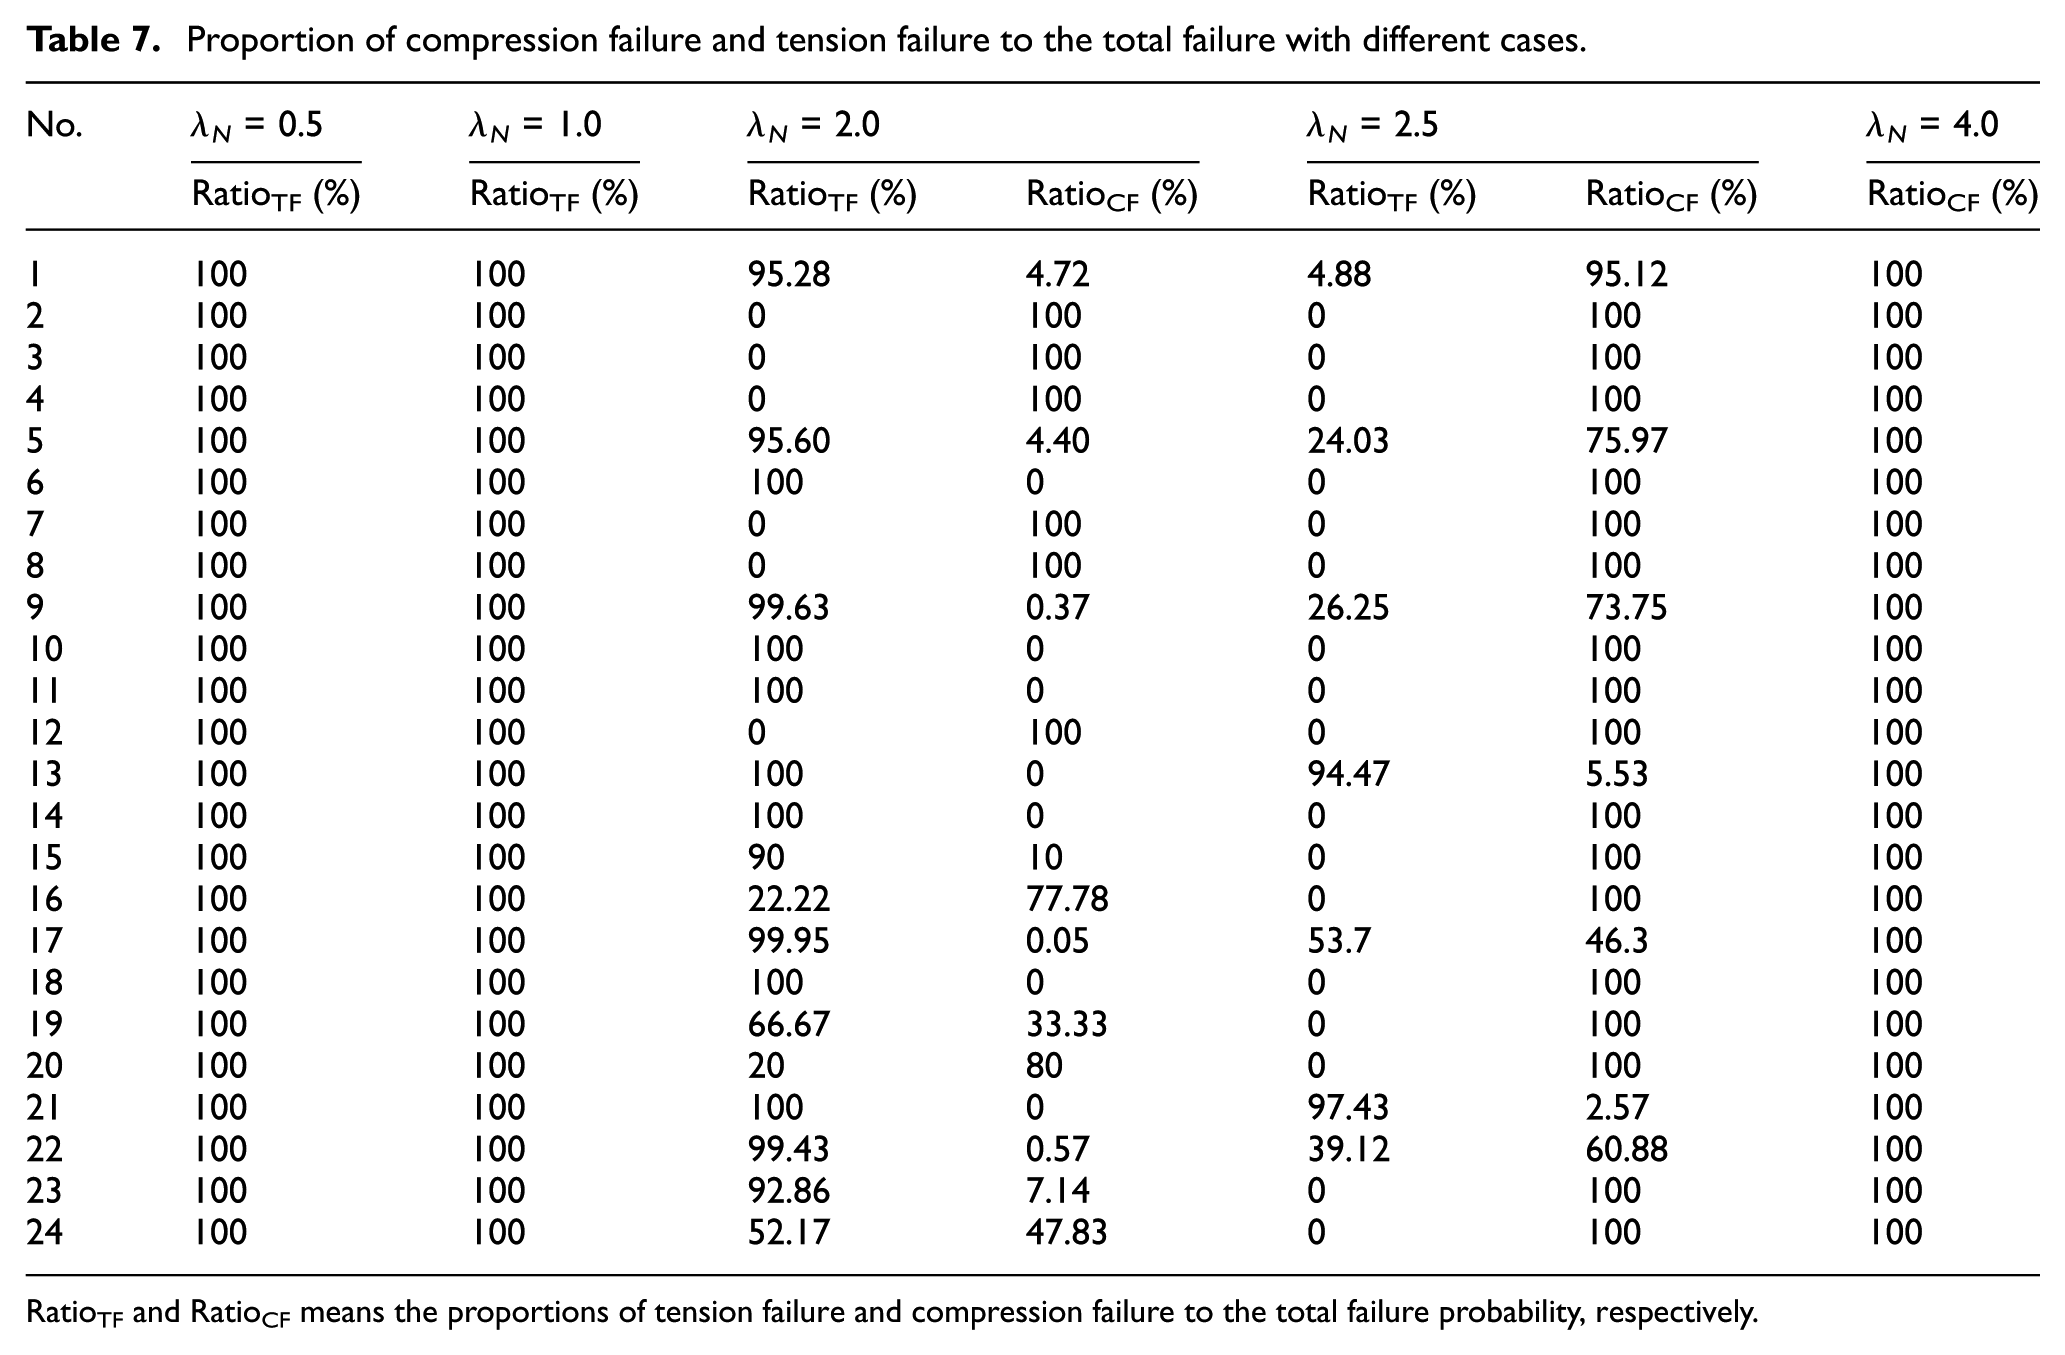
RatioTF and RatioCF means the proportions of tension failure and compression failure to the total failure probability, respectively.
Improved design measures and results
It is known that the constant load and resistance factors usually lead to designs with large variations of reliability; thus, they should be improved to achieve a robust design (Ching et al., 2013). For an RC column designed with 50 years of service life, the target reliability is usually 3.8 for both tension failure and compression failure in Eurocode. If the same target reliability is also assumed as βT = 3.8 for columns with tension failure (e.g. lower reliability cases with λN = 0.5 and 1.0), then the constant design factors (e.g. load factors, resistance factors) used in codes are required to be improved to achieve this goal. To be consistent with the code and conveniently applied, only the wind load factor γW is improved and other design factors (e.g. γG and γQ) are still kept fixed.
A tentative range from 1.2 to 2.5 with step size 0.05 is selected for searching the optimum γW, which is the one that corresponds closest to the target reliability index 3.8 in general. The optimum values of γW are obtained for 48 different cases (i.e. No. 1–No. 24 and λN = 0.5 and 1.0), as shown in Figure 7.
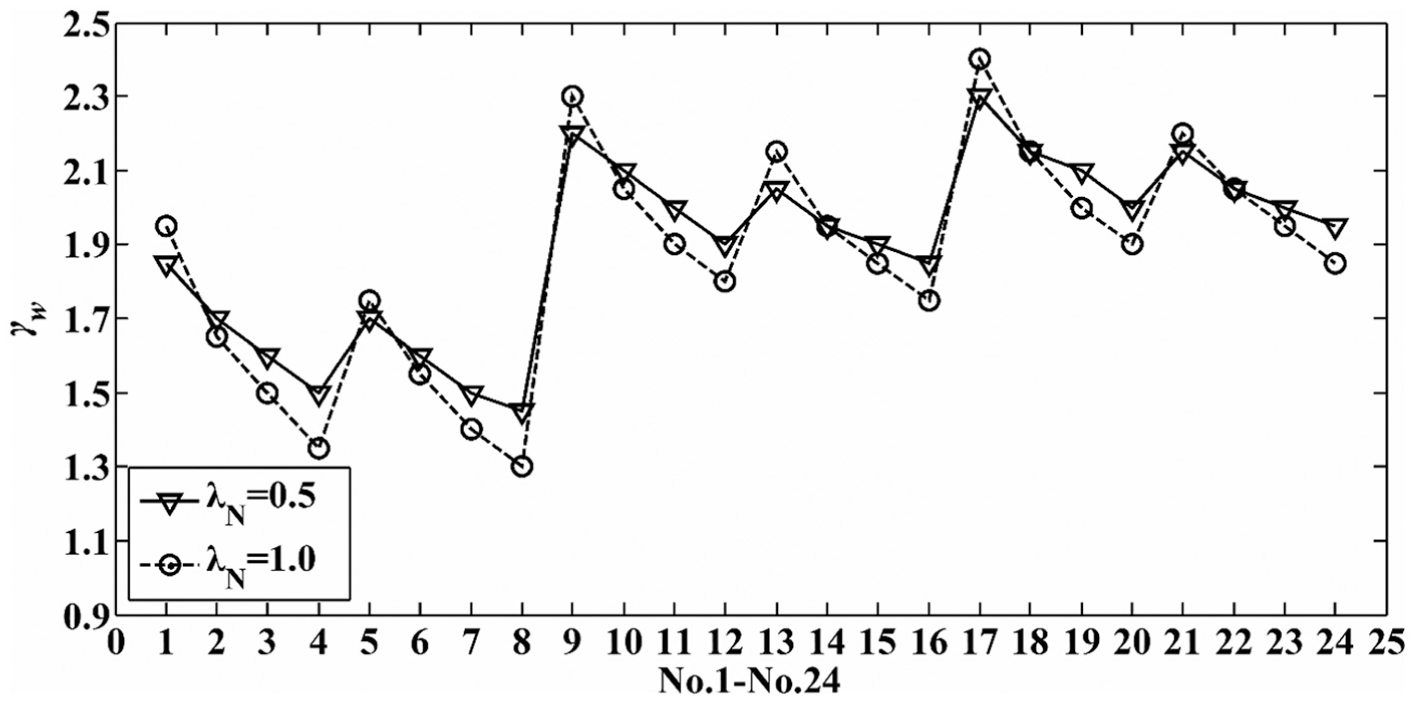
Recommended values of γW for different cases.
It can be seen that the optimal γW is not constant and varies from 1.3 to 2.4. However, a constant value 1.5 is adopted in the European Code (see JCSS, 2002) for column design. For comparison, the robustness evaluation of these two measures (i.e. non-constant and constant γW factors) is performed for a total of 48 cases, and the results are given in Table 8. It is shown that the design method with the recommended values can achieve a robust design within 48 cases, leading to a smaller COV and a closer value to the target reliability 3.8.
Robustness evaluation of the methods with different γW factors for 48 cases.
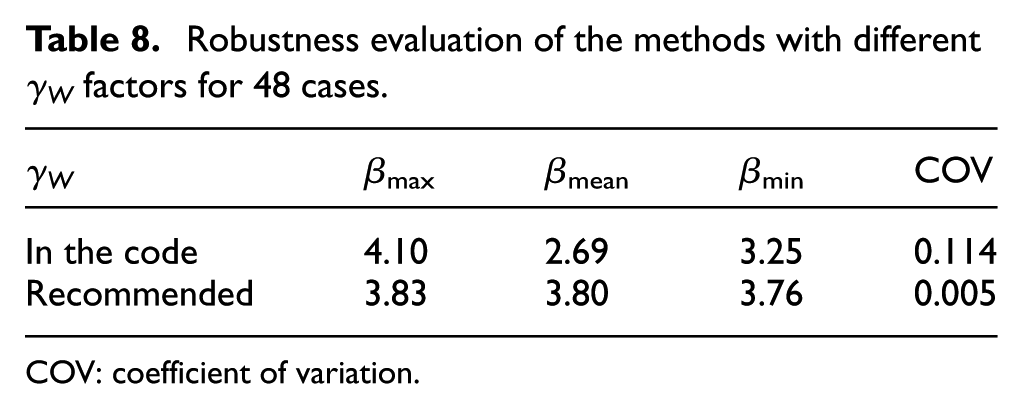
COV: coefficient of variation.
Conclusion
Based on the capacity model in Eurocode, a more realistic limit state function of RC columns with random loads eccentricity was established. The column resistance, reliability, and contribution of both tension failure and compression failure to the total failure probability were calculated and obtained for different cases. From the analyses, the following main conclusions are drawn.
For wind-dominated combinations, the column loads eccentricity is scattered over a large range, and the resistance probability model is quite different from the model assumed in the previous code-based reliability calibration.
The fixed loads eccentricity criterion used in previous reliability calibration can underestimate differences in the reliability of columns for different cases and overestimate the reliability in some tension failure cases.
For columns designed by code-based factors, the reliability in the tension failure case is much lower than that in the compression failure case, and it is even lower for the tension failure case with a larger ratio of the moment produced by wind load to the moment produced by vertical load, when random properties of loads eccentricity are considered.
For some columns designed to fail in compression failure, the tension failure mode rather than compression failure mode would contribute as much as 100% to the total failure probability. Thus, the tension failure mode would have a significant impact on the total failure probability for columns designed to fail in not only tension failure but also compression failure.
The recommended wind load factor varying with cases can ensure a mean reliability index closer to the assumed target reliability index 3.8, and a smaller coefficient of variation, thus a better robust design can be achieved.
Further attention should be paid to the studies of the uniform reliability design of RC columns with random loads eccentricity for other load combinations.
Supplemental Material
Highlights – Supplemental material for Reliability evaluation of reinforced concrete columns designed by Eurocode for wind-dominated combination considering randomloads eccentricity
Supplemental material, Highlights for Reliability evaluation of reinforced concrete columns designed by Eurocode for wind-dominated combination considering randomloads eccentricity by Youbao Jiang, Suixiang Peng, Michael Beer, Lei Wang and Jianren Zhang in Advances in Structural Engineering
Footnotes
Declaration of conflicting interests
The author(s) declared no potential conflicts of interest with respect to the research, authorship, and/or publication of this article.
Funding
The author(s) disclosed receipt of the following financial support for the research, authorship, and/or publication of this article: The research is supported by the National Natural Science Foundation of China (Grant No. 51678072), the National Key Basic Research Program of China (Grant No. 2015CB057705), and the Key Discipline Foundation of Civil Engineering of Changsha University of Science and Technology (18ZDXK01). This support is gratefully acknowledged.
Supplemental Material
Supplemental material for this article is available online.
References
Supplementary Material
Please find the following supplemental material available below.
For Open Access articles published under a Creative Commons License, all supplemental material carries the same license as the article it is associated with.
For non-Open Access articles published, all supplemental material carries a non-exclusive license, and permission requests for re-use of supplemental material or any part of supplemental material shall be sent directly to the copyright owner as specified in the copyright notice associated with the article.