
Abstract
This study reports the cyclic loading test results of normal-strength concrete-filled precast high-strength concrete centrifugal tube columns. Seven half-scale column specimens were tested under cyclic loads and axial compression loads to investigate their seismic behavior. The major parameters considered in the test included axial compression ratio, filled concrete strength, and volumetric stirrup ratio. The structural behavior of each specimen was investigated in terms of failure modes, hysteresis behavior, bearing capacity, dissipated energy, ductility, stiffness degradation, drift capacity, and strain profiles. Test results revealed that the concrete-filled precast high-strength concrete centrifugal tube column exhibited good integral behavior, and the failure modes of all columns were ductile flexural failures. Lower axial compression ratio and higher volumetric stirrup ratio resulted in more satisfactory ductile performance. In contrast, the filled concrete strength has a limited influence on the structural behavior of concrete-filled precast high-strength concrete centrifugal tube columns. Based on the limit analysis method, the calculation formula for the bending capacity of the concrete-filled precast high-strength concrete centrifugal tube column was developed, and the results predicted from the formulas were in good agreement with the experiment results.
Keywords
Introduction
Recently, the demand for logistics warehouse buildings in China has increased significantly. Unlike residential buildings, logistics warehouse buildings require large spans and high stories to meet special needs of building functions and to accommodate equipment and pipes. Hence, large-sized concrete members are preferred to increase the stiffness of the structure, as well as to control deflection and vibration. In the construction of such buildings, the use of precast concrete (PC) structures may be beneficial because the onsite work, construction period, and costs can be significantly reduced when compared to cast-in-place reinforced concrete (RC) structures (Kim et al., 2016; Park, 1995). However, the heavy weight of the PC members causes transportation and lifting difficult. Special large vehicles and cranes need to be employed to lift the whole PC members, which would increase the cost. Therefore, the application of PC members, especially PC columns, is limited in such buildings due to the heavy lifting weight. As an alternative method, concrete-filled precast concrete tube (CFPCT) columns have elicited considerable attention because they provide an effective and economical solution to the above issues. In the past few decades, similar types of columns with various details have been investigated under different names such as half PC columns (Choi et al., 2000; Hamada et al., 1998), outer-shell PC columns (Hosoya et al., 2001; Hosoya and Asano, 2000; Hosoya and Hukuyama, 2008; Iso et al., 1999; Masuda and Yoshioka, 1994; Zhang et al., 2009), semi-PC columns (Xiao et al., 2012, 2013), concrete-filled hollow PC columns (Kim et al., 2016, 2017; Lee et al., 2014; Lim et al., 2014; Park et al., 2015), or CFPCT columns (Ding et al., 2017; Shan et al., 2017; Wu et al., 2018; Zhang et al., 2018a). In this method, a PC tube can be prefabricated in factory, and after erecting the PC tube on site, a composite column composed of PC tube and filled concrete can be completed by filling the core with cast-in-place concrete. On one hand, the use of PC tube reduces the lifting weight of the columns and eliminates fieldwork such as rebar placement and formwork. On the other hand, the filled concrete increases the stiffness and damping of the column, and enhances the integrity of the beam-column joints.
In order to avoid the difficulty of installing and removing the internal mold and to improve the production efficiency, various methods such as centrifugal casting method (Choi et al., 2000; Hamada et al., 1998; Hosoya et al., 2001; Hosoya and Asano, 2000; Hosoya and Hukuyama, 2008; Masuda and Yoshioka, 1994; Shan et al., 2017; Zhang et al., 2018a), multiple internal molds (Ding et al., 2017; Wu et al., 2018; Xiao et al., 2012, 2013; Zhang et al., 2009), sequential concrete placements rotating a section (Iso et al., 1999; Kim et al., 2016; Lim et al., 2014), and thin steel plate internal molds (Kim et al., 2017; Lee et al., 2014; Park et al., 2015) have been adopted to fabricate PC tubes. All these methods could improve the production efficiency and structural safety. In contrast, the centrifugal casting method is relatively simple, reliable, and economical, thus attracting more and more research interest. In the CFPCT column, the PC tube is usually constructed using normal-strength concrete, and the strength of filled concrete is generally the same as that of the PC tube. Existing studies (Choi et al., 2000; Hosoya and Asano, 2000; Iso et al., 1999; Xiao et al., 2012) showed that the overall seismic behavior of CFPCT columns constructed with normal-strength concrete is comparable to that of RC columns. However, PC tube cracking can occur during transportation, lifting, and pouring of core concrete. Hence, the adoption of high-strength concrete is recommended for PC tube (Hosoya and Hukuyama, 2008). Compared with normal-strength concrete, high-strength concrete can provide better structural behavior and economy for PC tube. Owing to the application of high-strength concrete, the structural behavior of the PC tube during construction can be improved. As a composite column, when the bond between the PC and filled concrete is insufficient, early delamination of the PC tube may occur, which decreases the seismic behavior, especially the energy dissipation capacity (Choi et al., 2000; Hamada et al., 1998; Hosoya and Asano, 2000; Iso et al., 1999; Kim et al., 2016). This phenomenon becomes more obvious when high-strength concrete is used. Literature reviews display that research on CFPCT columns remains scarce. In addition, studies to date have primarily focused on the structural behavior of CFPCT columns constructed with normal-strength concrete. A few studies are available on the seismic behavior of normal-strength concrete-filled precast high-strength concrete tube (CFPHCT) columns under combined axial compression and lateral cyclic loads. Therefore, to promote the application of the CFPHCT column and solve the issues mentioned above, the integrity and seismic performance of the CFPHCT column under seismic loads need to be further investigated.
In this study, centrifugal casting method was adopted for fabricating the precast high-strength concrete tube. High-strength consecutive stirrups were employed to enhance the integrity between the precast high-strength concrete centrifugal tube and filled concrete, as well as to improve the ductility of the composite column. For the filled concrete, normal-strength concrete was used to reduce costs. In order to investigate the integrity and seismic performance of the normal-strength concrete-filled precast high-strength concrete centrifugal tube (CFPHCCT) column, cyclic loading test on seven specimens subjected to combined axial compression and cyclic loads was conducted. The failure mode, hysteretic behavior, and dissipated energy of specimens were analyzed and evaluated. The effects of various parameters including axial compression ratio, filled concrete strength, and volumetric stirrup ratio on the seismic performance of specimens were investigated and summarized. Moreover, calculation formula was proposed to predict the bending capacity of the CFPHCCT column.
Configuration and fabrication of the CFPHCCT column
The configuration of the CFPHCCT column is shown in Figure 1(a). The CFPHCCT column comprises two parts, namely, precast high-strength concrete centrifugal (PHCC) tube and filled concrete. The PHCC tube, which is composed of high-strength concrete, longitudinal bars and high-strength consecutive stirrups, can be prefabricated in factory. After the PHCC tube is erected on site, the core can be filled with cast-in-place concrete. The stirrups that cross the core area provide mechanical bonds between the PHCC tube and filled concrete, thus enhancing the integrity of the CFPHCCT column. The thickness of the PHCC tube is typically determined considering the arrangement of the steel bars. In the case that the cross-sectional dimension is 400 × 400 mm and the core area diameter is 280 mm, the lifting weight of the PHCC tube column can be reduced by about 39% compared to the solid column.
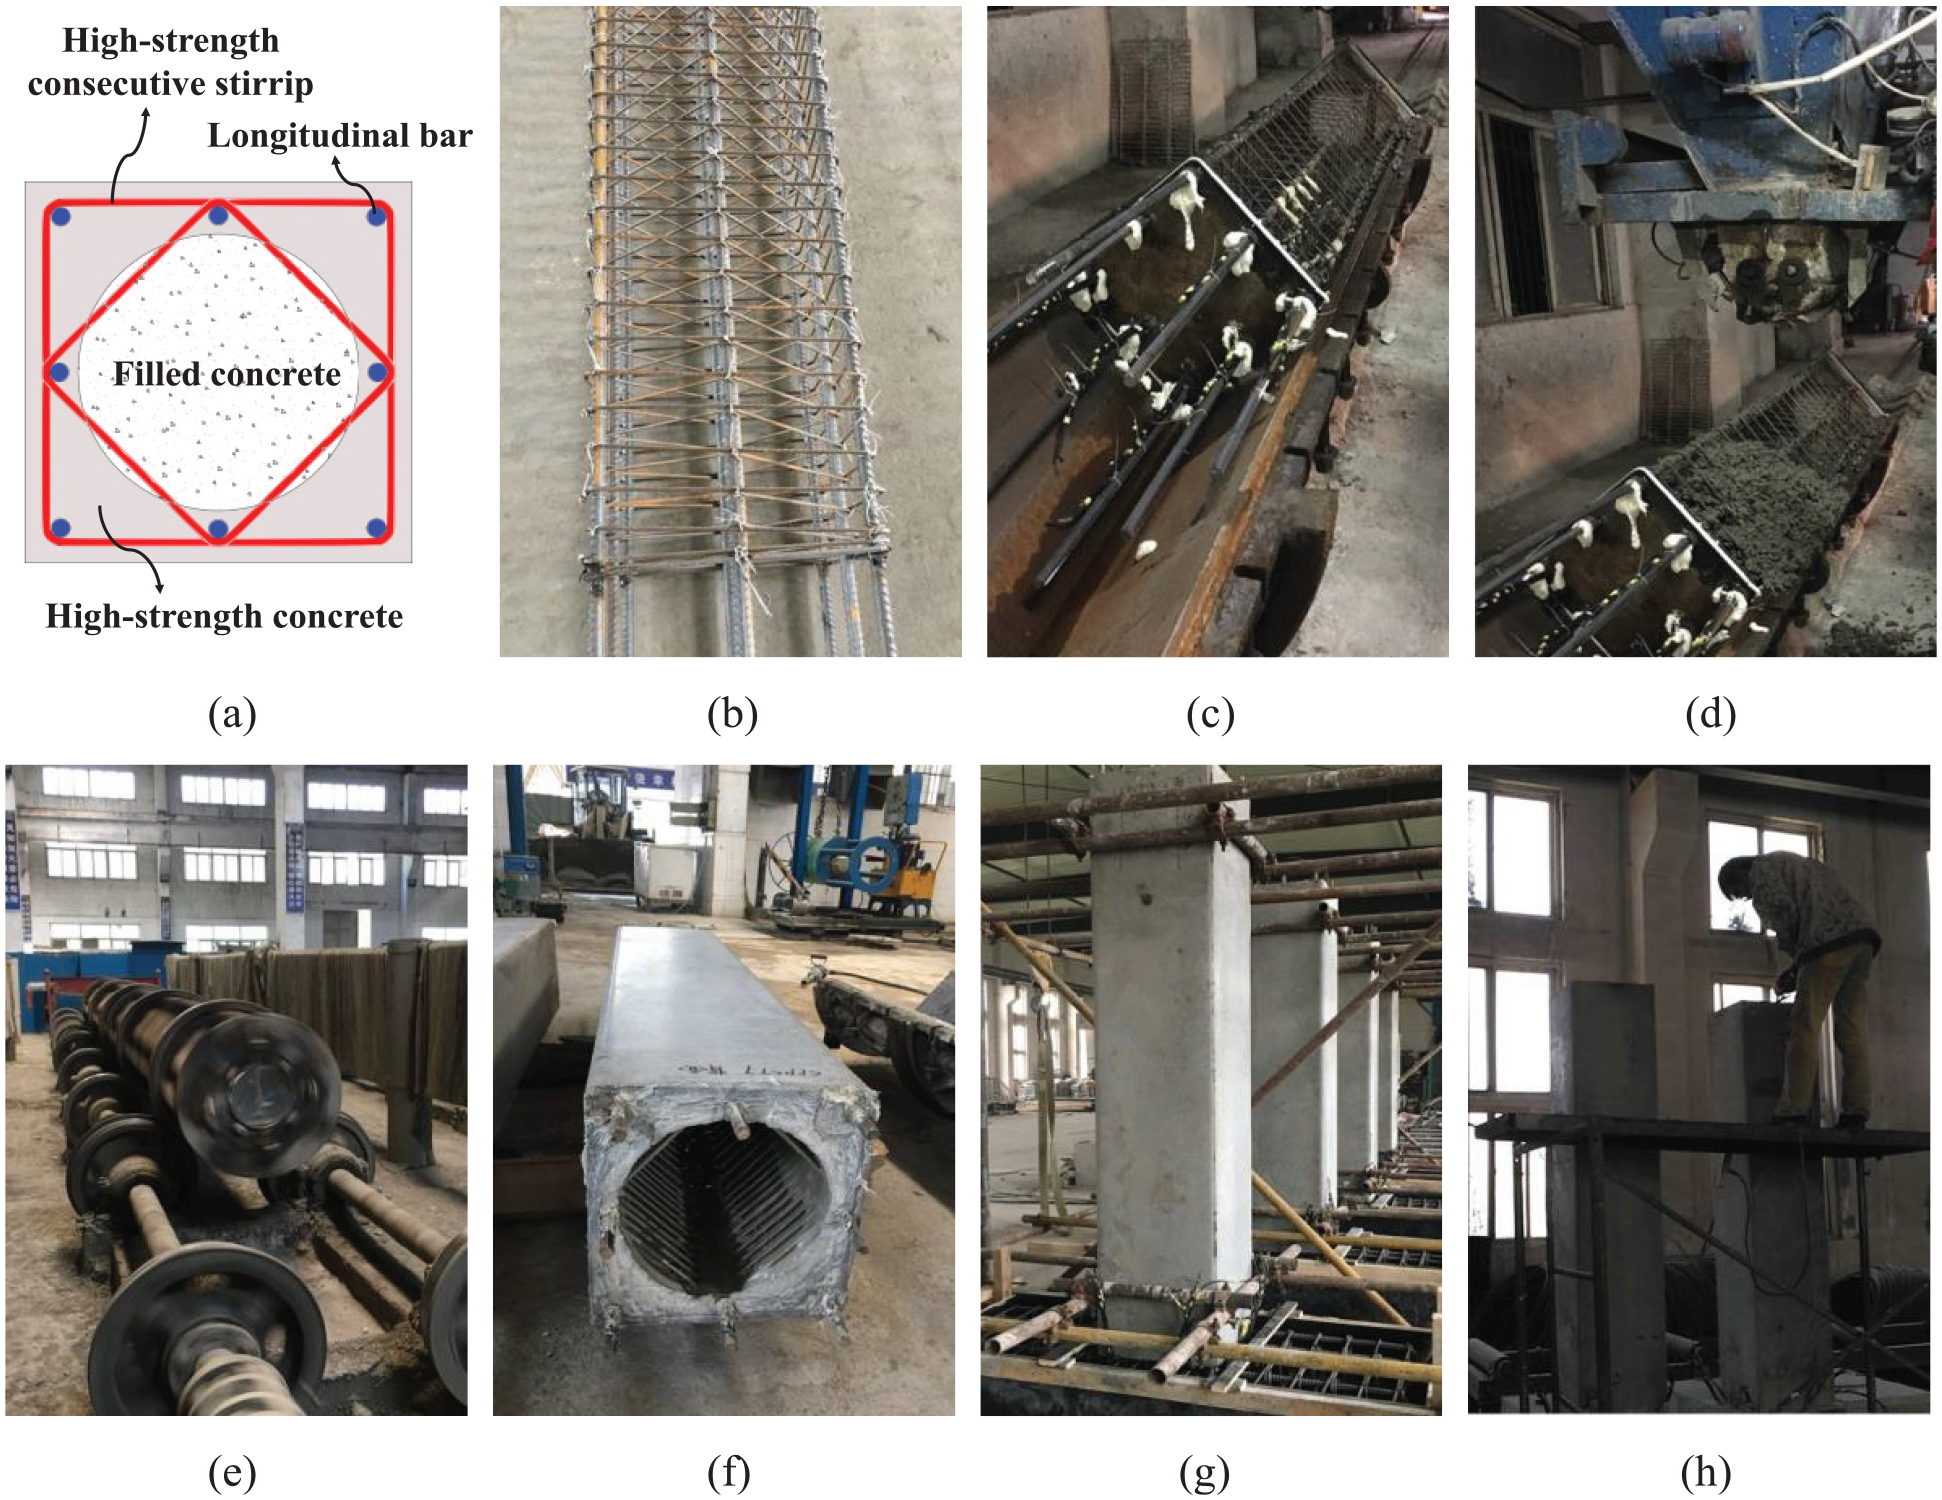
Configuration and fabrication of CFPHCCT column: (a) configuration of CFPHCCT column, (b) reinforcement cage, (c) into the mold, (d) concrete pouring, (e) centrifugal casting, (f) completion, (g) erection of PHCC tube, and (h) core concrete pouring.
Figure 1(b) to (h) demonstrates the fabrication procedure of CFPHCCT columns. First, the reinforcement cage was fabricated and placed in the mold. Afterward, the concrete was poured. After the centrifugal casting and curing, the PHCC tube was completed. Finally, the CFPHCCT column can be completed by filling the core with cast-in-place concrete after erecting the PHCC tube.
Test program
Specimen details and test parameters
Seven half-scale columns were prepared and tested to failure. Test parameters involved axial compression ratio, n (0.15, 0.20, and 0.25), filled concrete strength, fcu.f. (38.7 and 48.2 MPa) and volumetric stirrup ratio, ρsv (0.41%, 0.53%, and 0.74%). Figure 2 presents the details of specimens, and Table 1 summarizes the specimen information.
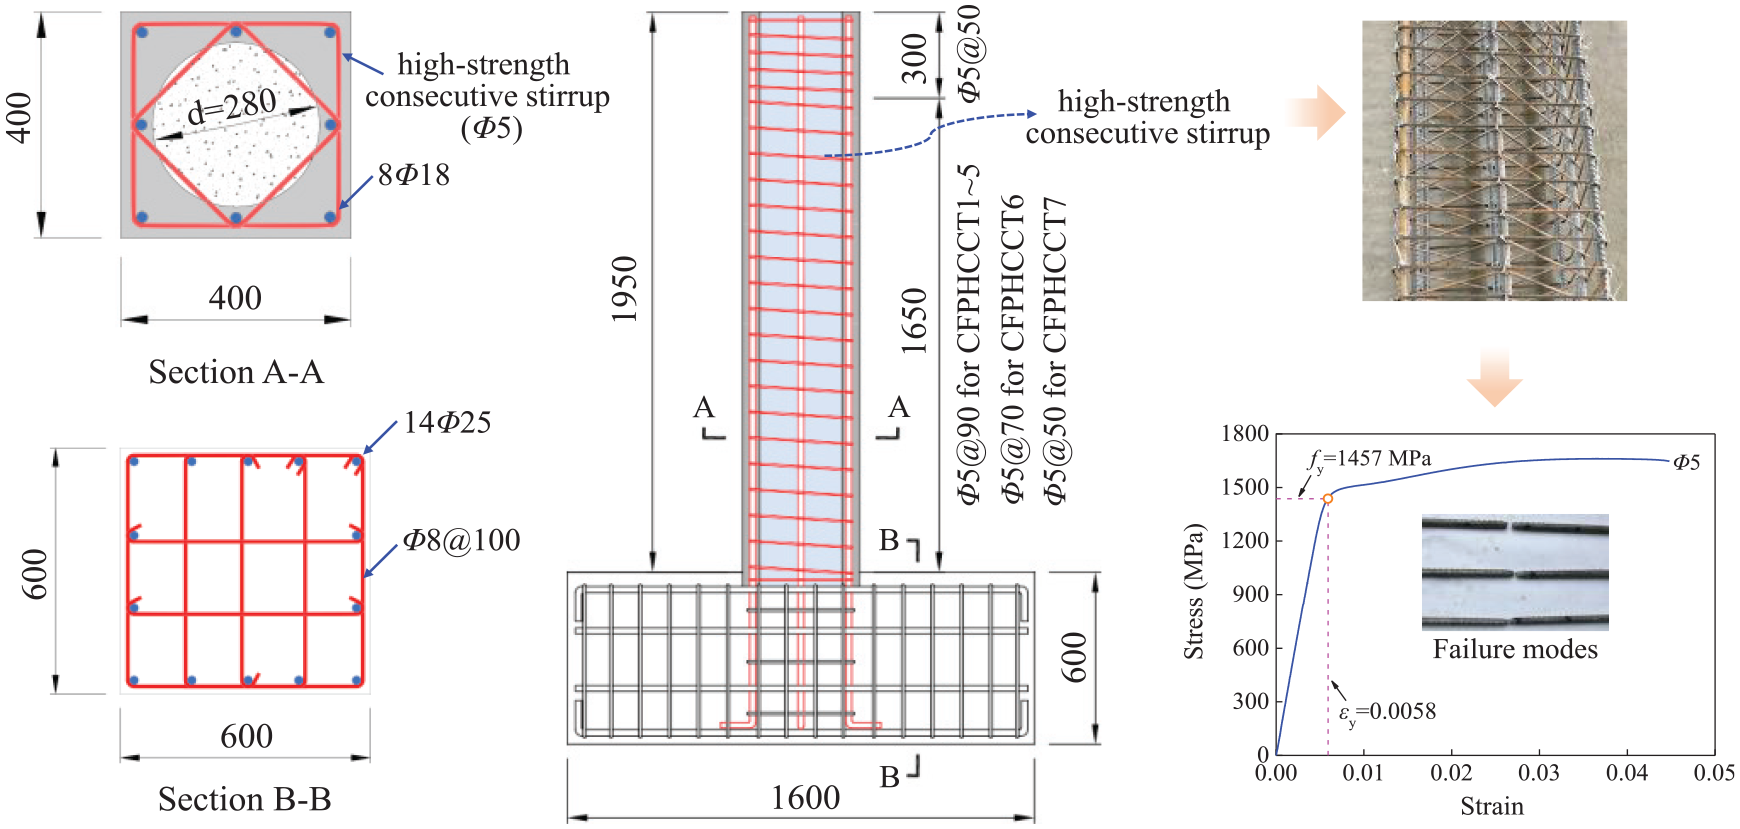
Details of test specimens (unit: mm).
Summary of test specimen information.
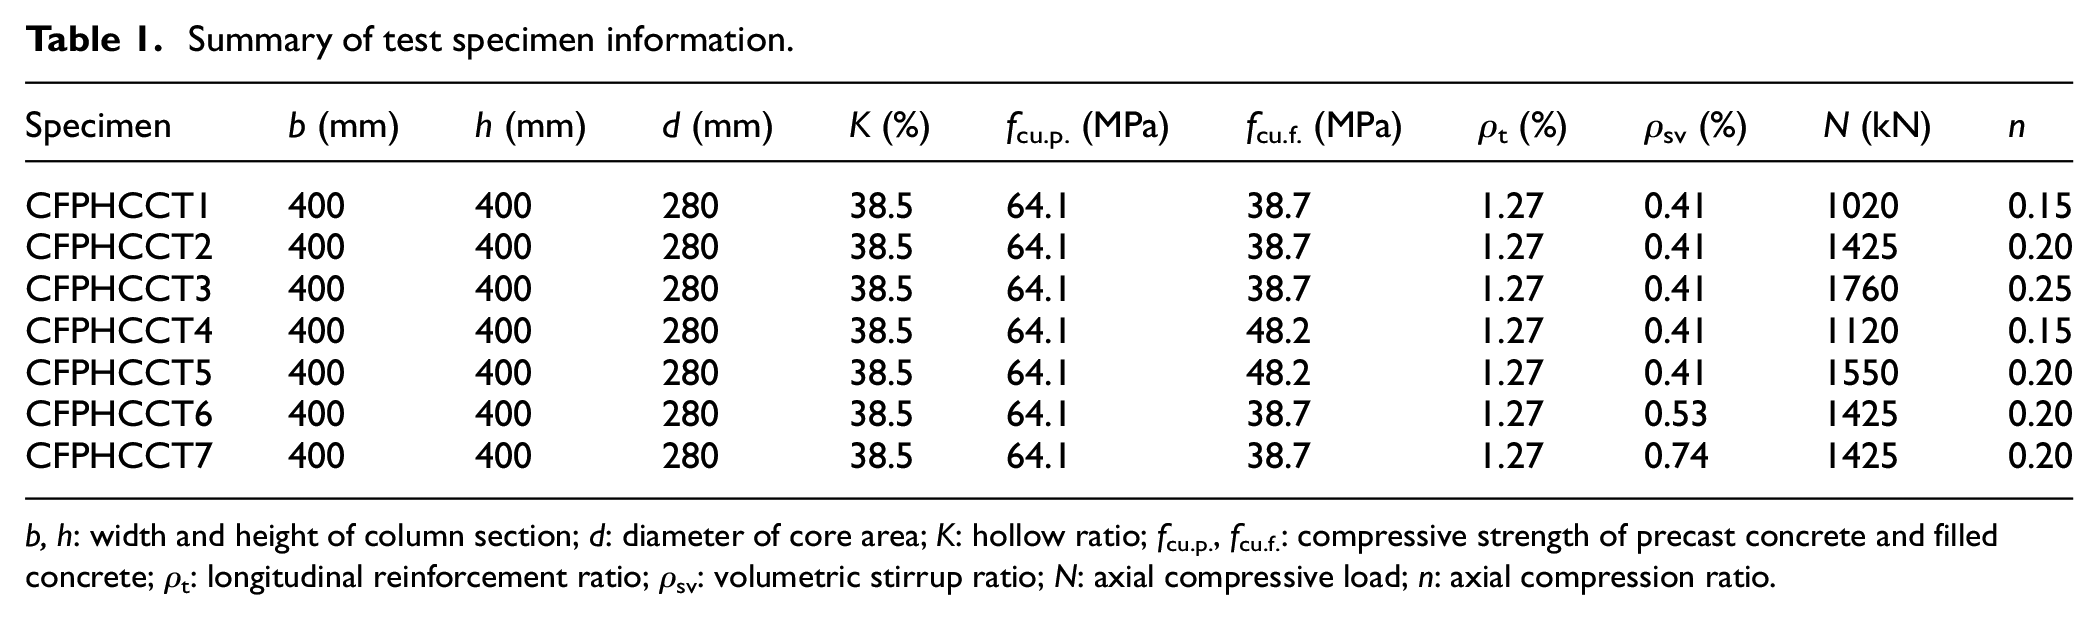
b, h: width and height of column section; d: diameter of core area; K: hollow ratio; fcu.p., fcu.f.: compressive strength of precast concrete and filled concrete; ρt: longitudinal reinforcement ratio; ρsv: volumetric stirrup ratio; N: axial compressive load; n: axial compression ratio.
The measured height from the bottom of each specimen to the loading point was Hn = 1.74 m. All specimens were fixed by a foundation beam with a cross section of 600 × 600 mm. For all specimens, eight deformed bars, each with 18 mm diameter, were used as longitudinal bars, producing a longitudinal reinforcement ratio of 0.0127. For stirrups, a high-strength steel bar with 5 mm diameter was arranged over the full height of the column to avoid the column failure in shear. The spacing of stirrups along the column height is shown in Figure 2.
CFPHCCT1 and CFPHCCT2 were selected as control specimens. CFPHCCT2 and CFPHCCT3 differed from CFPHCCT1 in the n, which was 0.20 and 0.25, respectively, and the other parameters were the same. The purpose of CFPHCCT4 and CFPHCCT5 was to evaluate the effect of fcu.f. on the structural behavior of the column. Hence, these specimens have a higher concrete compressive strength (fcu.f. = 48.2 MPa). In CFPHCCT6 and CFPHCCT7, the spacing of stirrups was decreased to 70 and 50 mm, respectively, and the corresponding ρsv was increased to 0.53% and 0.74%, respectively. For CFPHCCT columns, the axial compression ratio can be calculated by n = N/(fcu.p.Ap + fcu.f.Af), where fcu.p. and fcu.f. are the axial compressive strength of PC and filled concrete, respectively, Ap and Af are the section area of the PHCC tube and filled concrete, respectively.
Material properties
Compression tests for 150 × 150 × 150 mm3 concrete cubes were conducted according to GB/T50152-2012 (2012). The PC and the filled concrete used in the specimens were cured under air-dry condition. The reserved concrete cubes for compression test were cast and cured simultaneously with the specimens. The average cube compressive strength (fcu.p.) of PC at 28 days was 64.1 MPa. The strength grades of filled concrete were designed at two different levels, and the average cube compressive strengths (fcu.f.) at 28 days were 38.7 and 48.2 MPa, respectively. Tension tests for reinforcement were performed according to GB/T228-2010 (2010). The yield strength, tensile strength, and elongation were 440, 580 MPa, and 29% for longitudinal bars, and 1457, 1672 MPa, and 11% for stirrups, respectively. Furthermore, a typical stress–strain relationship of stirrups obtained from the test is illustrated in Figure 2.
Test setup and loading history
The test setup and loading history are illustrated in Figure 3. The foundation beam was restrained to a strong floor by anchoring blots. The axial compressive load was applied to the top of the column by a hydraulic jack and remained constant during the test. After the axial compressive load on the column stabilized, the lateral cyclic load was exerted to the loading point by a 2000 kN capacity actuator. The loading history involved a load-controlled stage and a displacement-controlled stage. At the load-controlled stage, the increment of the load was 0.2Py and each load step was repeated once. Hereafter, displacement-controlled loads were exerted at displacement levels of 1Δy, 2Δy, 3Δy …, and each load step was repeated twice. Test terminated when the lateral load declined to 85% of the peak load.
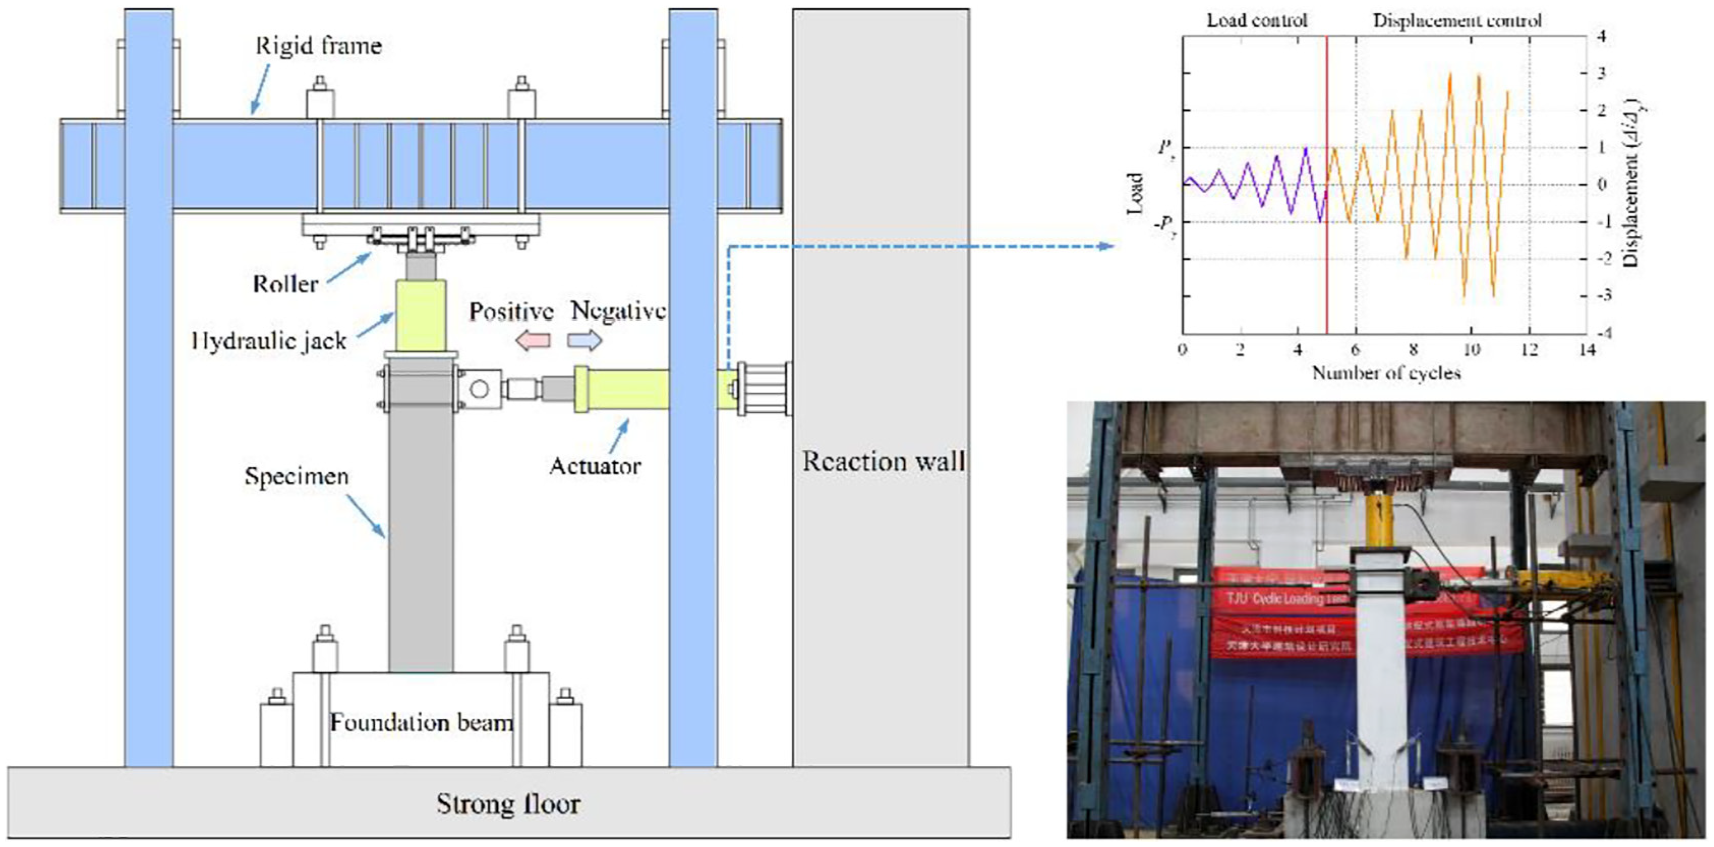
Test setup and loading history.
Instrumentation
The arrangement of displacement transducers and strain gauges is illustrated in Figure 4. Each specimen was instrumented with a load cell and a displacement transducer (DT1) to obtain the hysteresis curves. Displacement transducers DT2 and DT3 were adopted to measure the rotations and curvatures of the plastic hinge region, and the shear distortion was monitored by DT4 and DT5. Furthermore, displacement transducers DT6, DT7, and DT8 were installed to monitor the displacement of the foundation beam and ascertain the fixity of the support. To measure strains in the plastic hinge region, the strains in the column concrete, longitudinal bars, and stirrups at various locations along the height of the column were recorded by strain gauges, as shown in Figure 4(b).
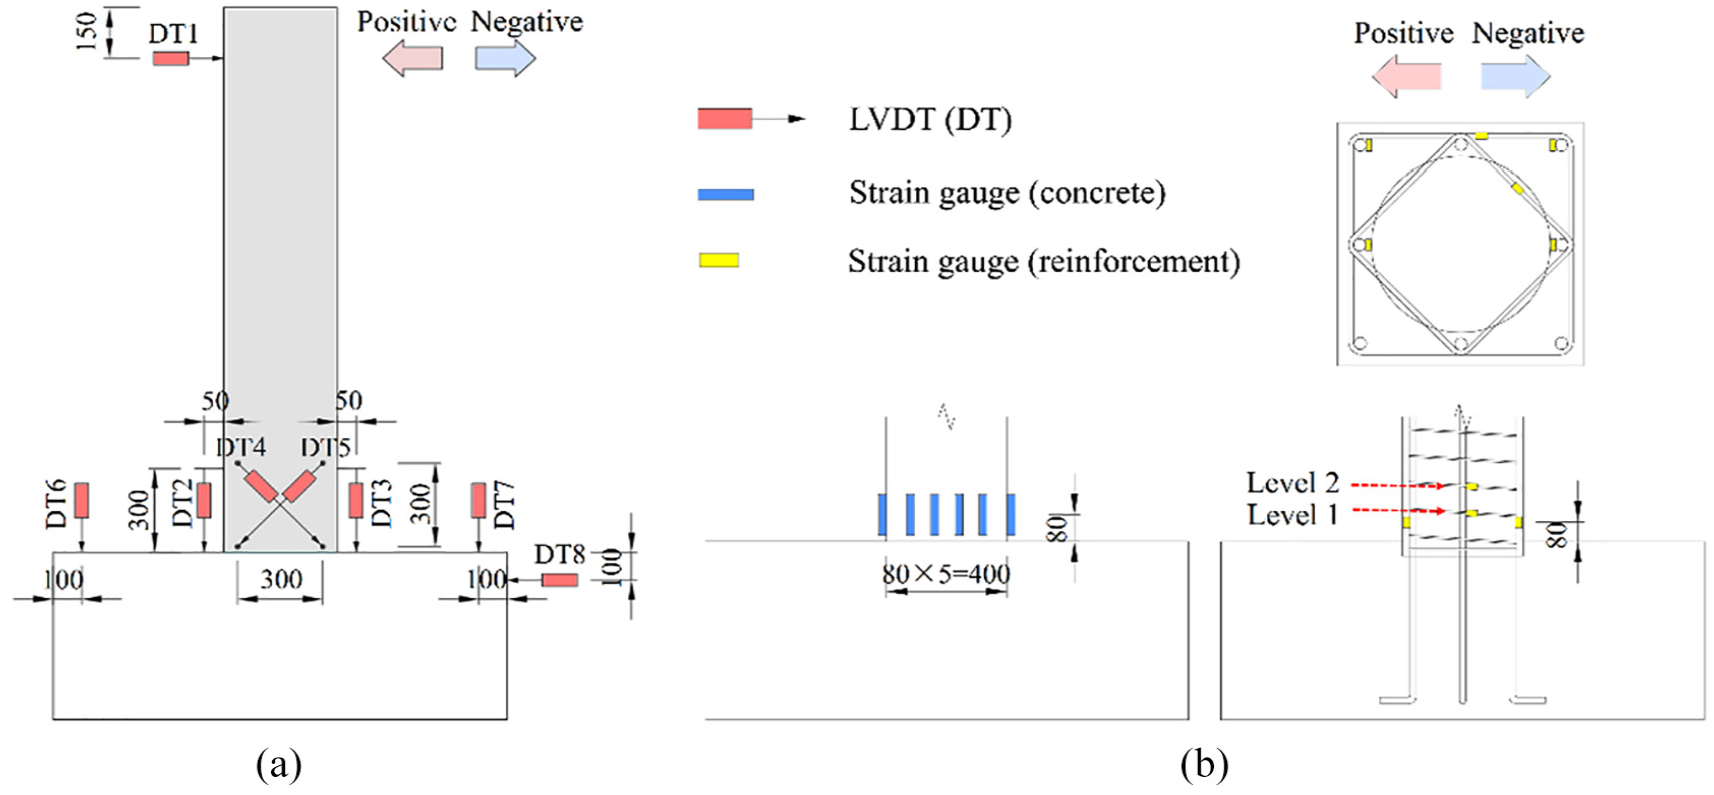
Setup of instrumentation (unit: mm): (a) instrumentation arrangement and (b) strain gauges.
Test observations and failure modes
The failure modes of all specimens are presented in Figure 5. The displacement of the foundation beam was negligible, which displays that it can be considered as a fixed support for the specimen. The failure processes and failure modes of all specimens are described as follows.
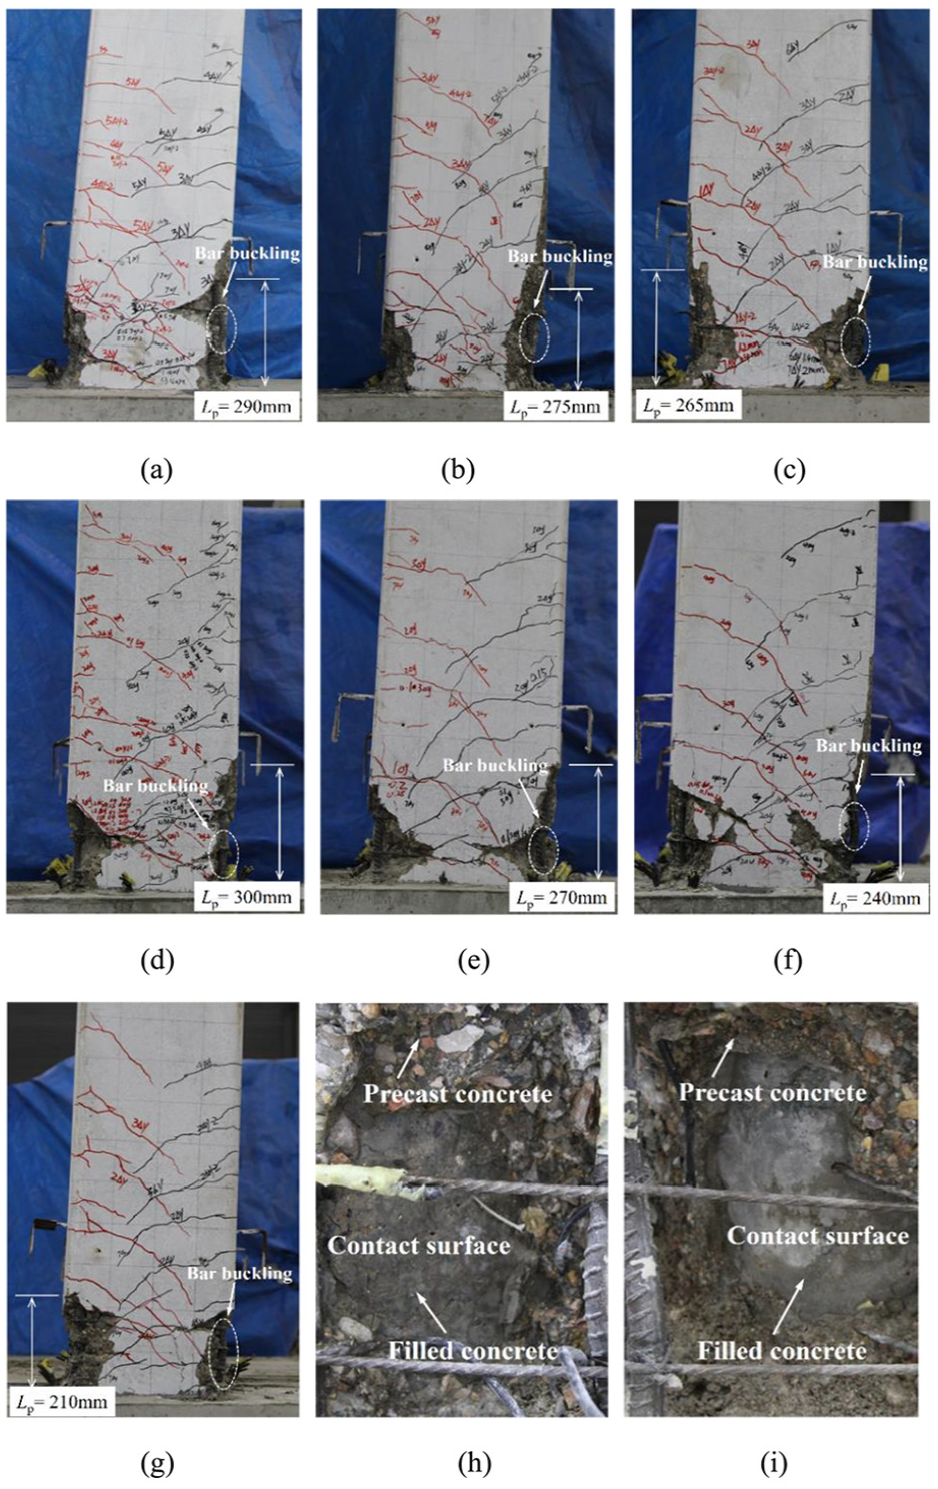
Failure modes of specimens: (a) CFPHCCT1, (b) CFPHCCT2, (c) CFPHCCT3, (d) CFPHCCT4, (e) CFPHCCT5, (f) CFPHCCT6, (g) CFPHCCT7, (h) contact surface between precast and filled concrete in CFPHCCT1 after experiment, and (i) contact surface between precast and filled concrete in CFPHCCT3 after experiment.
Similar failure processes and test phenomena were observed in all specimens during the experiment. Flexural cracks perpendicular to the column axis occurred first at the root region of the column. As the load increased, existing cracks extended and widened gradually, and more flexural cracks formed and developed along the height of the column. Before 1.0% drift ratio, all specimens were dominated by flexural cracks. Afterwards, some flexural cracks became inclined and extended to the axis of the column due to the effect of the shear. Then, slight concrete spalling was observed at the drift ratio of approximately 2.0%–3.0%, and this impairment was concentrated in the root region. After reaching maximum load, the exerted load gradually decreased with the severe spalling and crushing of the concrete and the buckling of the longitudinal bars. Ultimately, all columns failed in compression-flexural mode with plastic hinges fully developing at the root region of the column. At the maximum load, for specimens CFPHCCT1–7, the flexural rotation values of the plastic hinge region were in the range of 0.0116–0.0201 rad, and the shear distortion values of the plastic hinge region were in the range of 0.0011–0.0017 rad. This indicates that the failure mode of all specimens was dominated by the flexure.
The plastic hinge refers to the severely damaged region formed at the maximum regions of the column. In this study, the plastic hinge length is defined as the maximum height of the severely damaged region of the column. As illustrated in Figure 5(a) to (g), the measured plastic hinge lengths of specimens CFPHCCT1–7 were approximately 290, 275, 265, 300, 270, 240, and 210 mm, respectively. For specimens with different axial compression ratios, as illustrated in Figure 5(a) to (c), as the n increases from 0.15 to 0.20 and 0.25, the plastic hinge lengths deceases by 5.2% and 8.6%, respectively. This indicates that a higher axial load level results in a lower development height of the plastic hinge. In specimens CFPHCCT2, CFPHCCT6, and CFPHCCT7, the use of the smaller spacing of the stirrups reduced the damage in the column. When the spacing of stirrups decreases from 90 to 70 and 50 mm, the plastic hinge length decreases by 12.7% and 23.6%, respectively, as shown in Figure 5(b), (f), and (g).
After the experiment, the contact surface between the precast and filled concrete was carefully examined by breaking the concrete in plastic hinge region. No bond damage between the precast and filled concrete was observed, as illustrated in Figure 5(h) and (i). Therefore, the PHCC tube has a good synergistic behavior with the filled concrete, and the proposed CFPHCCT column achieved good integrity behavior.
Test results and discussion
Hysteresis behavior
The hysteresis curves of all columns are presented in Figure 6(a) to (g). In this study, the drift ratio is defined as the ratio of the displacement at the loading point to the column height Hn. Based on the Park method (Park, 1989), the yield displacement can be determined, as illustrated in Figure 6(h). The ultimate displacement (Δu) is defined as the post-peak displacement when the exerted load declined to 85% of the maximum load.
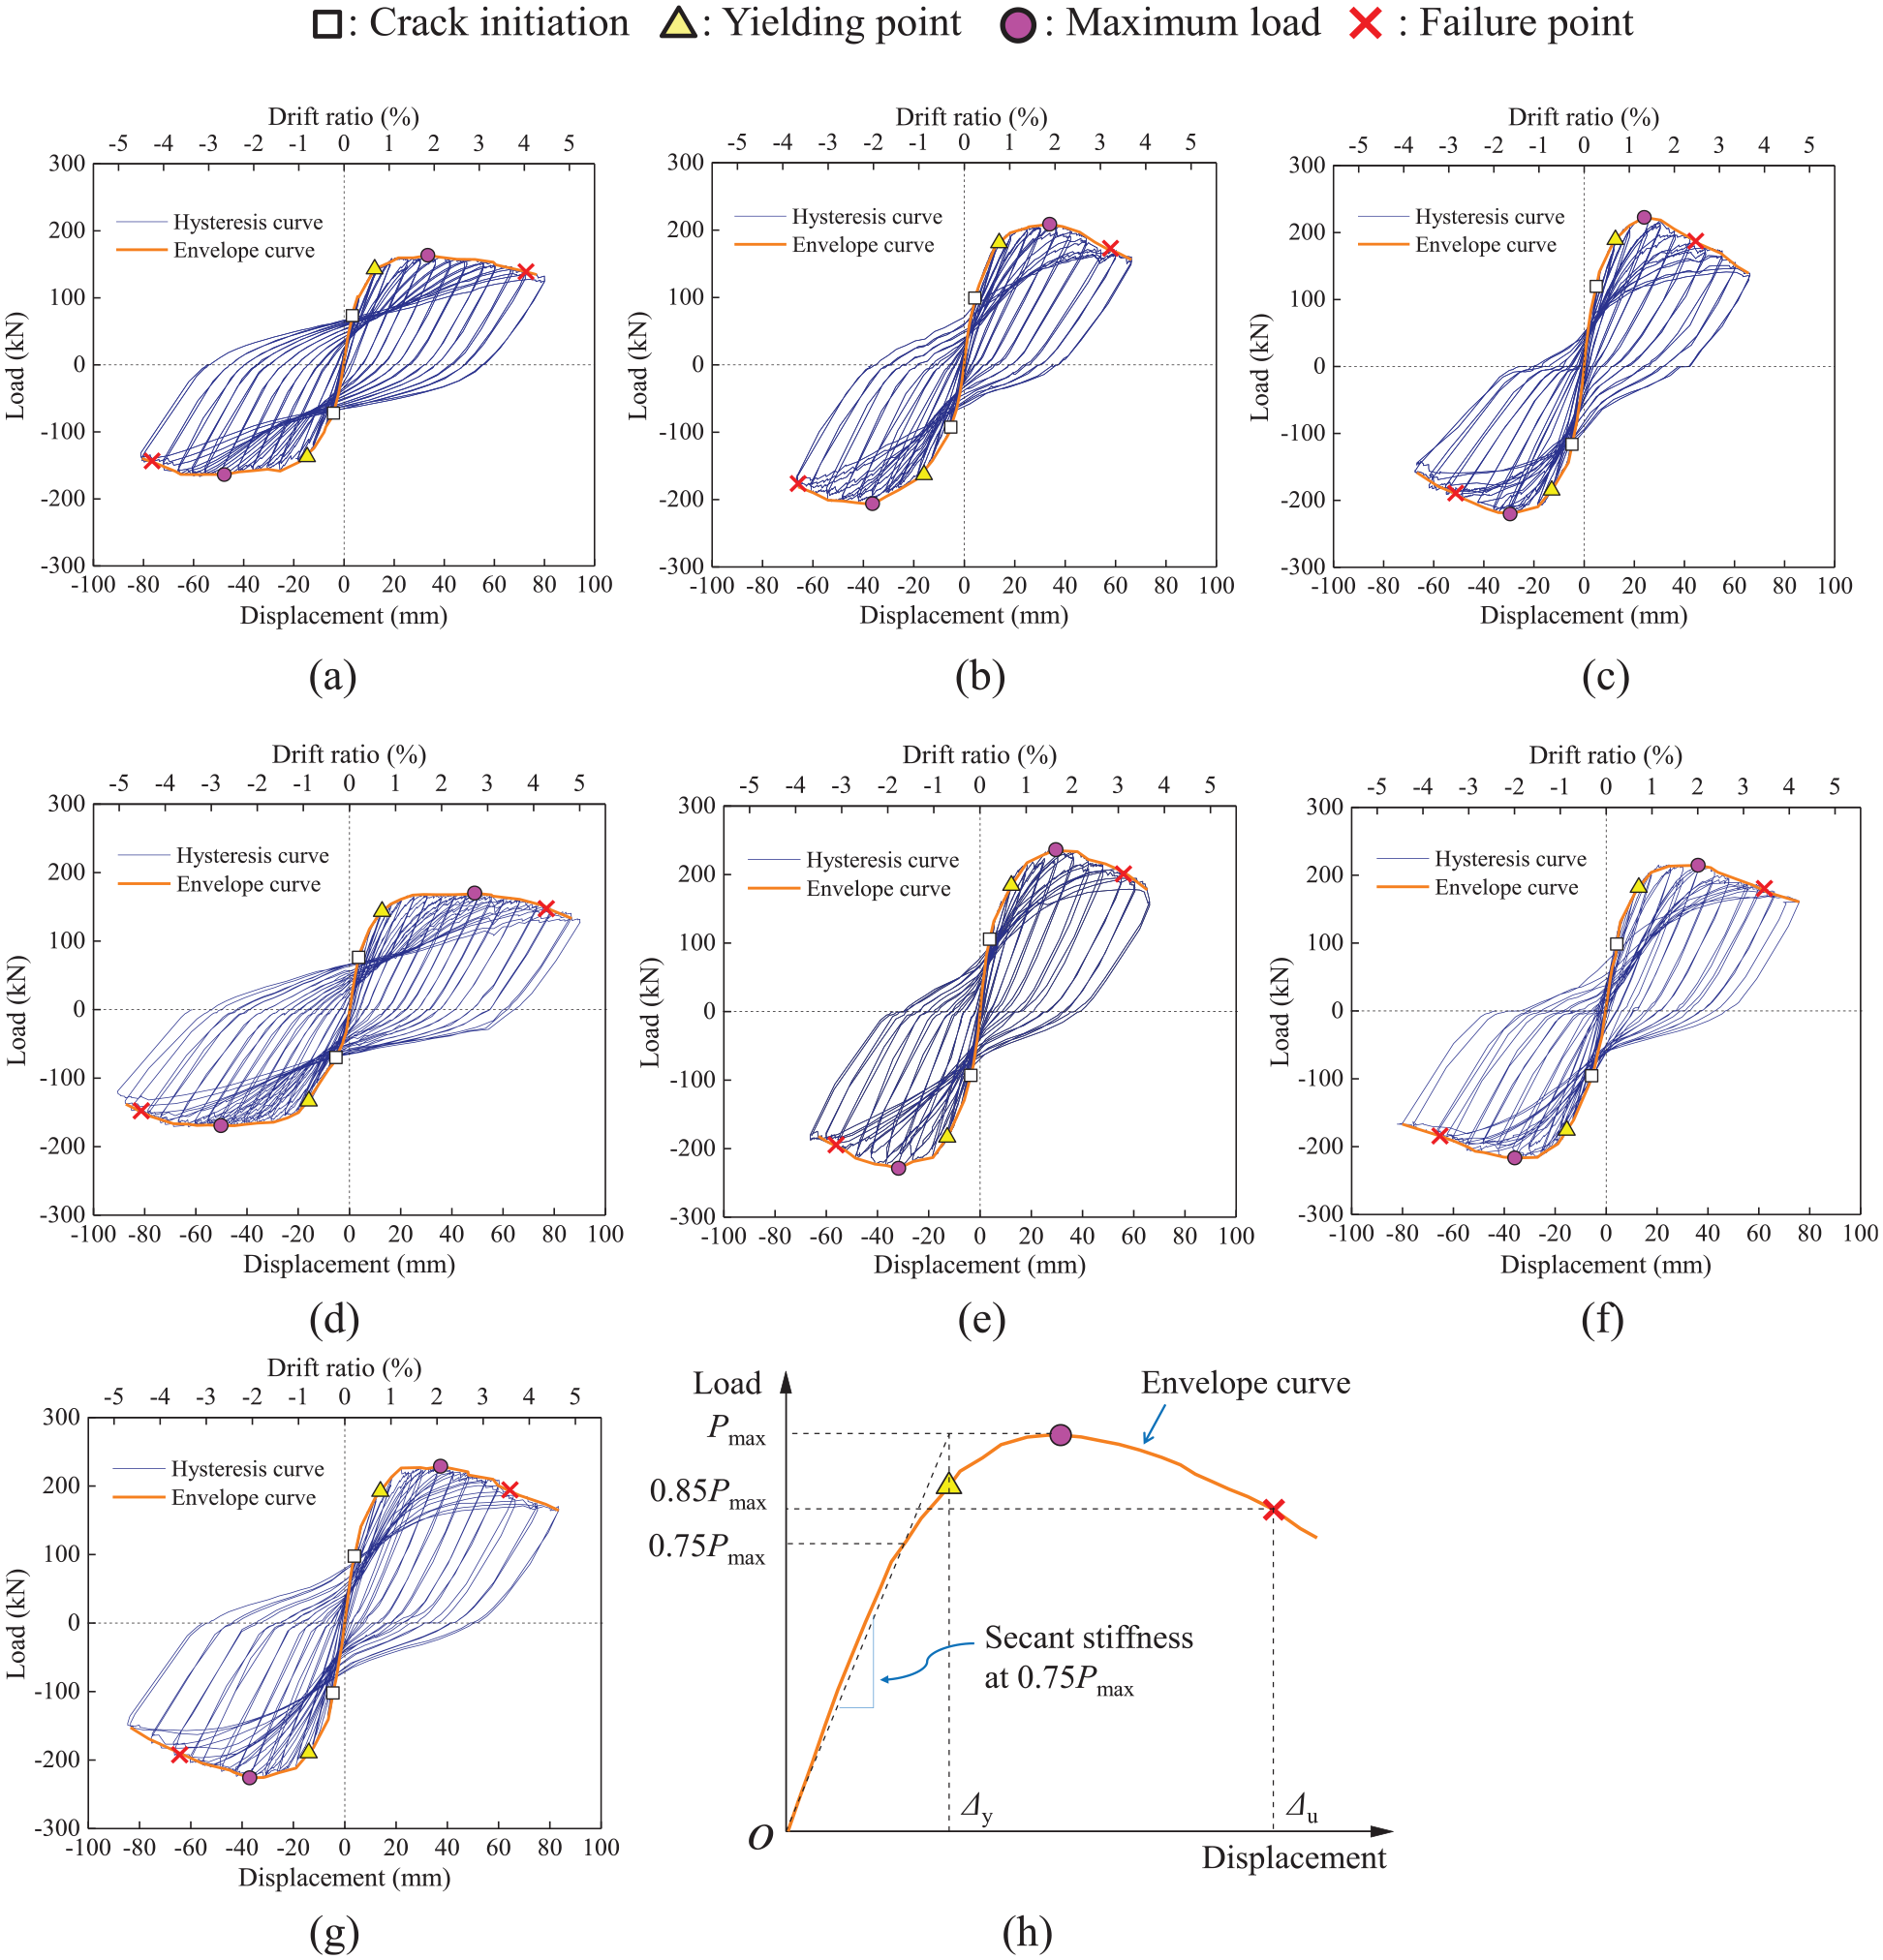
Load–displacement relationships: (a) CFPHCCT1, (b) CFPHCCT2, (c) CFPHCCT3, (d) CFPHCCT4, (e) CFPHCCT5, (f) CFPHCCT6, (g) CFPHCCT7, and (h) definitions of yield and ultimate displacements.
As illustrated in Figure 6(a) to (g), all columns showed a typical pinched response of the RC members. In general, the hysteresis behaviors of test specimens were similar, and CFPHCCT columns exhibited better deformation and energy dissipation capacity. At the early stage of loading, the load–displacement curve was almost linear prior to cracking. The area of the hysteresis curve was small, indicating that the column was in an elastic stage. Afterwards, the slopes of the hysteresis curve began to decrease gradually due to the propagation of cracks. The hysteresis curves exhibited a nonlinear behavior after yielding because of the inelastic deformation of the column. Then, after reaching the maximum load, the exerted load gradually decreased, and mild pinching effect of the hysteresis curve can be observed.
Envelope curves and characteristic loads
Figure 7 depicts the envelope curves for all columns. The characteristic loads and corresponding displacements of the envelope curves are recorded in Table 2. The results in Table 2 are the average values in both loading directions. Pcr and Δcr are the cracking load and displacement, respectively; Py and Δy are the yield load and displacement, respectively; Pm is the maximum load; Δu and Ru are the ultimate displacement and drift ratio, respectively; φu is the ultimate curvature of plastic hinge region; μ is the ductility ratio; Ki0 is the initial stiffness; Et is the total cumulative energy dissipation; Mt is the tested bending capacity; Mc1 is the bending capacity obtained from N–M interaction curve; Mc2 is the bending capacity obtained from proposed calculation formula.
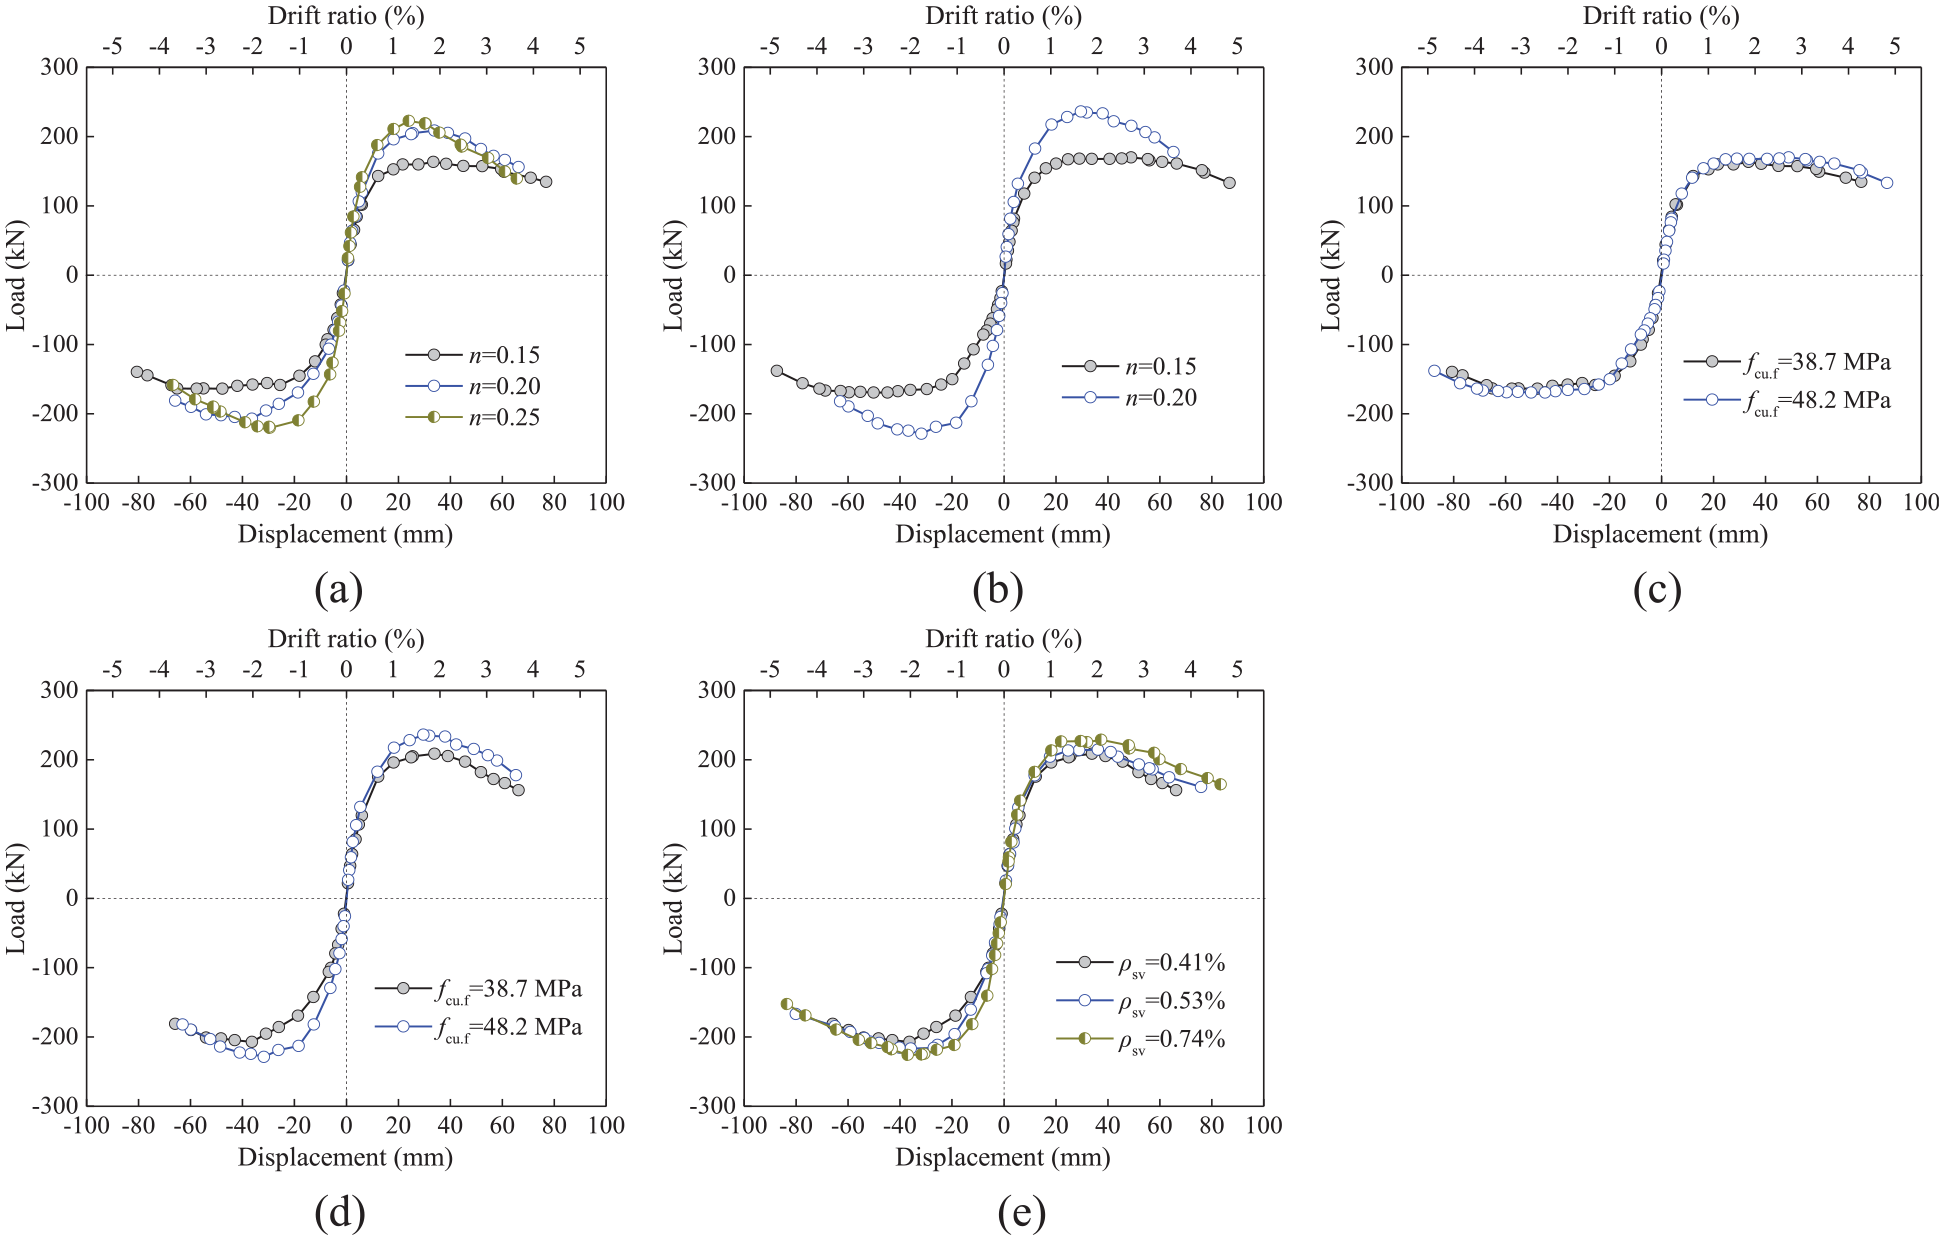
Effects of test parameters on envelope curves: (a) axial compression ratio (CFPHCCT1, 2, and 3), (b) axial compression ratio (CFPHCCT4 and 5), (c) filled concrete strength (CFPHCCT1 and 4), (d) filled concrete strength (CFPHCCT2 and 5), and (e) volumetric stirrup ratio (CFPHCCT2, 6 and 7).
Test results.
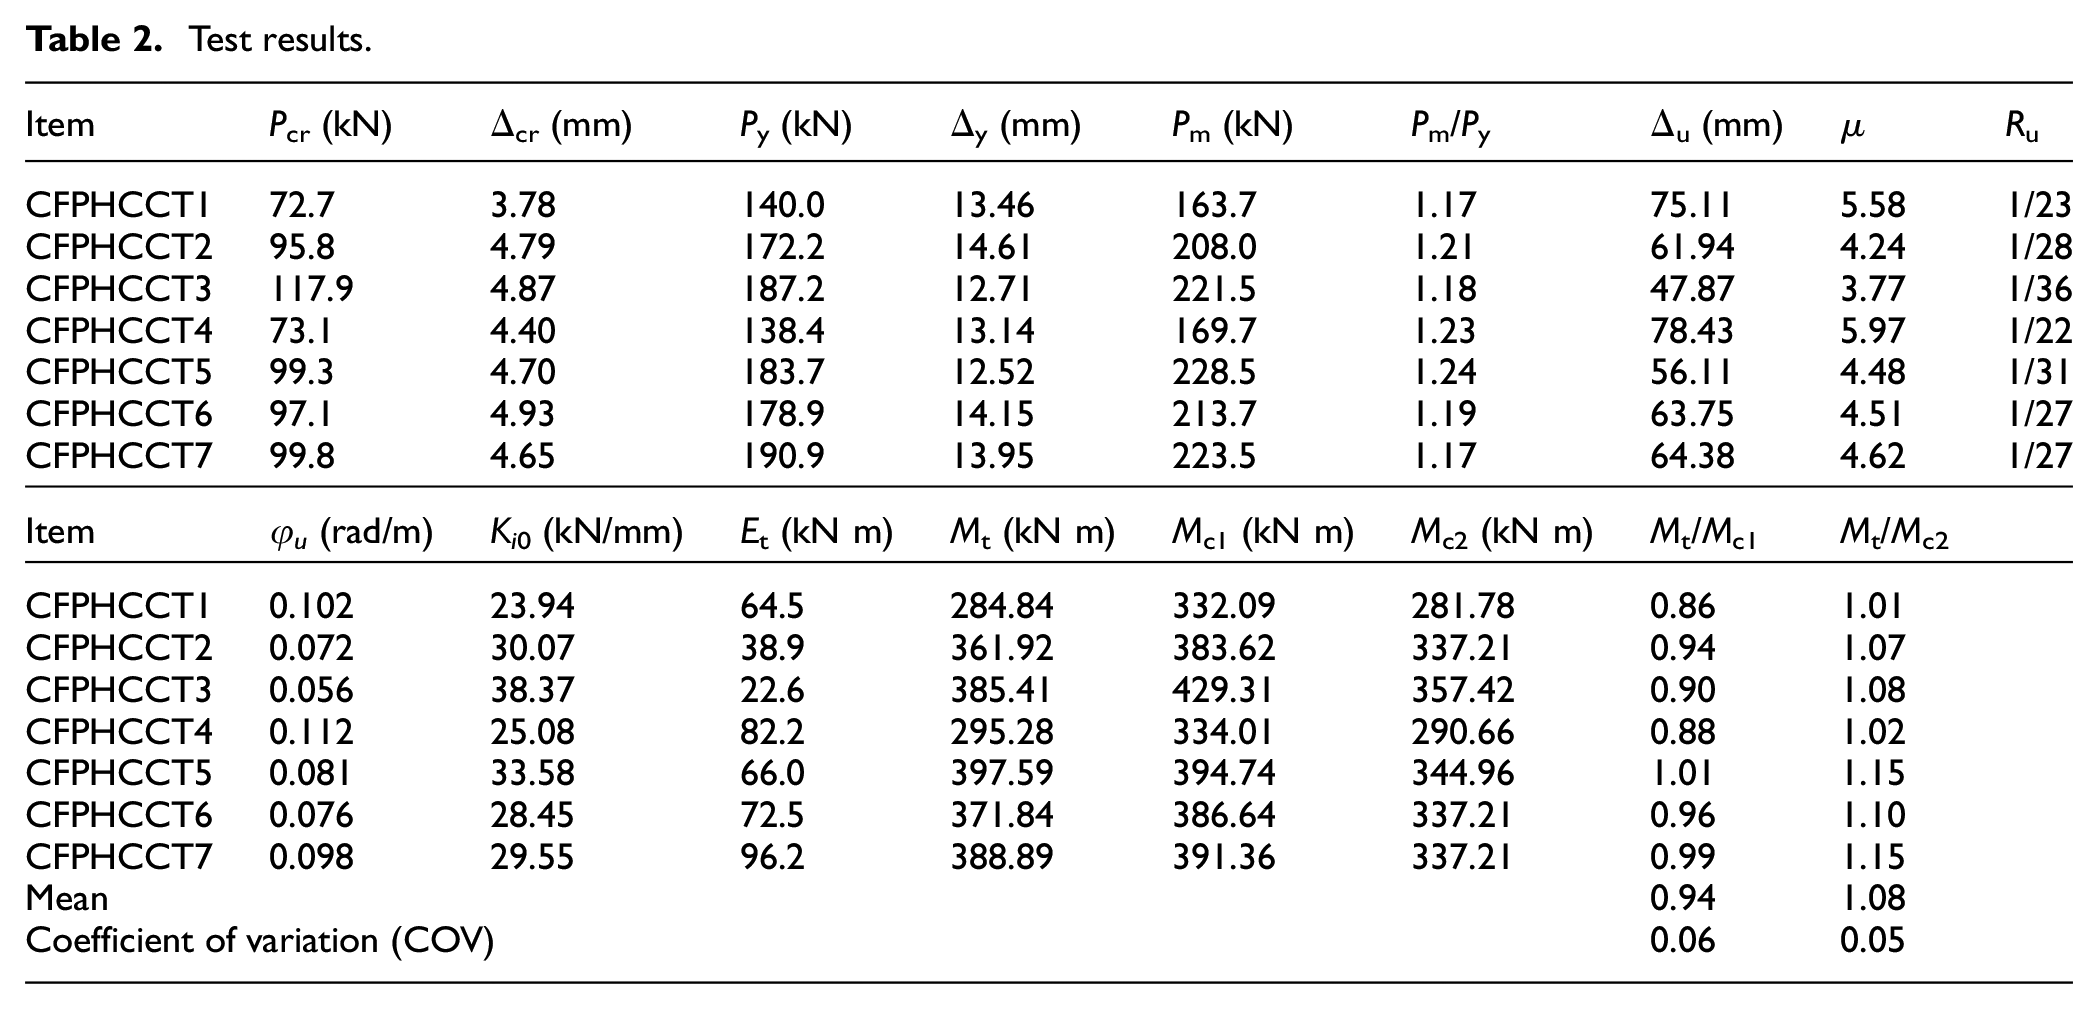
As can be found from Table 2, compared with CFPHCCT1, the Pcr of CFPHCCT2 and CFPHCCT3 increased by 31.8% and 62.2%, respectively. Furthermore, the Pcr of CFPHCCT5 was higher than that of CFPHCCT4 by 35.8%. This is mainly due to the fact that the cracking process was delayed due to the presence of the axial compressive loads. Therefore, a higher n resulted in a higher Pcr. By contrast, the cracking loads of CFPHCCT2, CFPHCCT6, and CFPHCCT7 were almost the same. Moreover, columns with different filled concrete strength exhibited no obvious differences in cracking loads. Hence, the ρsv and fcu.f. have minor effect on the cracking behavior of the CFPHCCT column.
Figure 7(a) shows the comparison of envelope curves for CFPHCCT1, CFPHCCT2, and CFPHCCT3, which were subjected to different n of 0.15, 0.20, and 0.25, respectively. It can be found that increasing the n from 0.15 to 0.20 and 0.25 increased Py by 23% and 33.7% and Pm by 27% and 35.3%, respectively. As illustrated by the comparison of CFPHCCT4 and CFPHCCT5 in Figure 7(b), as the n increased from 0.15 to 0.20, the Py and Pm of CFPHCCT5 increased by 32.7% and 34.6%, respectively. Hence, as the n increased, the yield and maximum loads increased. In contrast, the deformability of the column exhibited the opposite result. The deformability decreased with the increase of the n. CFPHCCT1 reached an ultimate drift ratio of 4.3%, CFPHCCT2 reached an ultimate drift ratio of 3.6%, whereas CFPHCCT3 attained only 2.8%. Compared with CFPHCCT4, the ultimate drift ratio of CFPHCCT5 reduced by 28.5%. In Figure 7(c) and (d), no noticeable differences were observed between the two different strengths of the filled concrete (fcu.f. = 38.7 MPa for CFPHCCT1 and CFPHCCT2, and fcu.f. = 48.2 MPa for CFPHCCT4 and CFPHCCT5). However, it is noticed that, under higher n, a higher filled concrete strength provided a larger increment of maximum load for CFPHCCT column. This may be due to the fact that an increase in n leads to an increase of the compressive area of the column, thus enhancing the contribution of filled concrete to the load carrying capacity. As Figure 7(e) illustrated, the yield and maximum loads, as well as the ultimate drift ratio were slightly improved with the increase in ρsv. This is mainly attributed to the confined effect of the high-strength consecutive stirrups. The increase in the ρsv resulted in less post-peak strength degradation. The ultimate drift ratio of CFPHCCT6 and CFPHCCT7 increased by approximately 3% and 4%, respectively, as compared with that of CFPHCCT2. This indicates that the inelastic behavior of CFPHCCT columns can be enhanced by increasing the ρsv. In addition, the Pm/Py values of the columns ranged from 1.17 and 1.24, indicating that the CFPHCCT column has good deformation performance after yielding.
Ductility and ultimate curvature
The ductility ratio is adopted to quantify the inelastic deformability of columns, which can be calculated by μ = Δu/Δy (Zhao, 2008). Moreover, ultimate curvature (φu) of the plastic hinge region is employed to evaluate the rotation performance of columns. As illustrated in Figure 4(a), the ultimate curvature for each column can be determined by the readings of displacement transducers DT2 and DT3. The values of μ and φu for each column are recorded in Table 2.
As illustrated in Table 2, it can be observed that the influences of various parameters on μ and φu were similar. As can be found from Table 2 that increasing n from 0.15 to 0.2 and 0.25 decreased μ by 24% and 33%, and φu by 29% and 45%, respectively. Furthermore, compared to CFPHCCT4, CFPHCCT5 exhibited 25% and 28% reduction in μ and φu, respectively. Comparison results demonstrate that the larger axial load level is detrimental to the ductility and rotation performance of the column. By contrast, the fcu.f. and ρsv have a favorable effect on both μ and φu. As Table 2 illustrates, CFPHCCT columns with higher fcu.f. exhibited slightly higher μ and φu with respective to those with lower fcu.f.. This results indicate that the increase in the strength of filled concrete can improve the deformability of CFPHCCT columns to some extent if the integrity between the precast and filled concrete was guaranteed. However, as the ρsv increased, the μ and φu of the column gradually enhanced. Compared with CFPHCCT2, CFPHCCT6 and CFPHCCT7 exhibited 6.3% and 9% increase in μ, respectively. Furthermore, the φu of CFPHCCT6 was approximately 6% higher than that of CFPHCCT2. In contrast, the φu for CFPHCCT7 was about 1.36 times that of CFPHCCT2. These findings indicate that the ρsv has a favorable effect on the inelastic deformability of columns due to the confined effect of the high-strength consecutive stirrups. The above results were consistent with the failure modes observed during the test, the use of smaller spacing of stirrups reduced damage to the plastic hinge region, thus enhancing the inelastic deformability. In general, for CFPHCCT1–7, the μ values gained in the test were ranged from 3.77 to 5.97, which achieved the demand of μ ≥ 3.0 for concrete members (Zhang et al., 2018b). Furthermore, based on the classification of ductility levels (Morrison et al., 2012), CFPHCCT columns have moderate (3.0 ≤ μ < 4.0) to high (μ ≥ 4.0) levels of ductility. In sum, the CFPHCCT column exhibited excellent ductility behavior.
Stiffness degradation
Secant stiffness (Ki) is employed to evaluate the stiffness deterioration (Shen et al., 2013). Ki is commonly decided by equation (1)
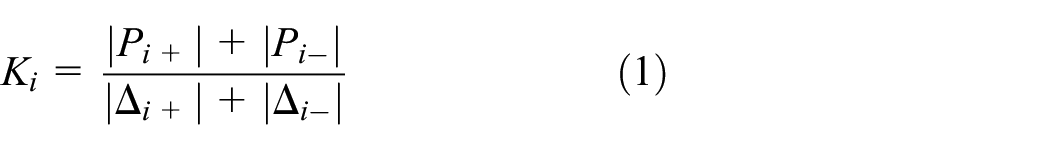
where Pi+ and Pi− represent the maximum load at the ith cycle in positive and negative directions, respectively, and Δi+ and Δ i− represent the corresponding displacements. The stiffness comparison for columns with various parameters is plotted in Figure 8, and Table 2 records the Ki0 of all columns.
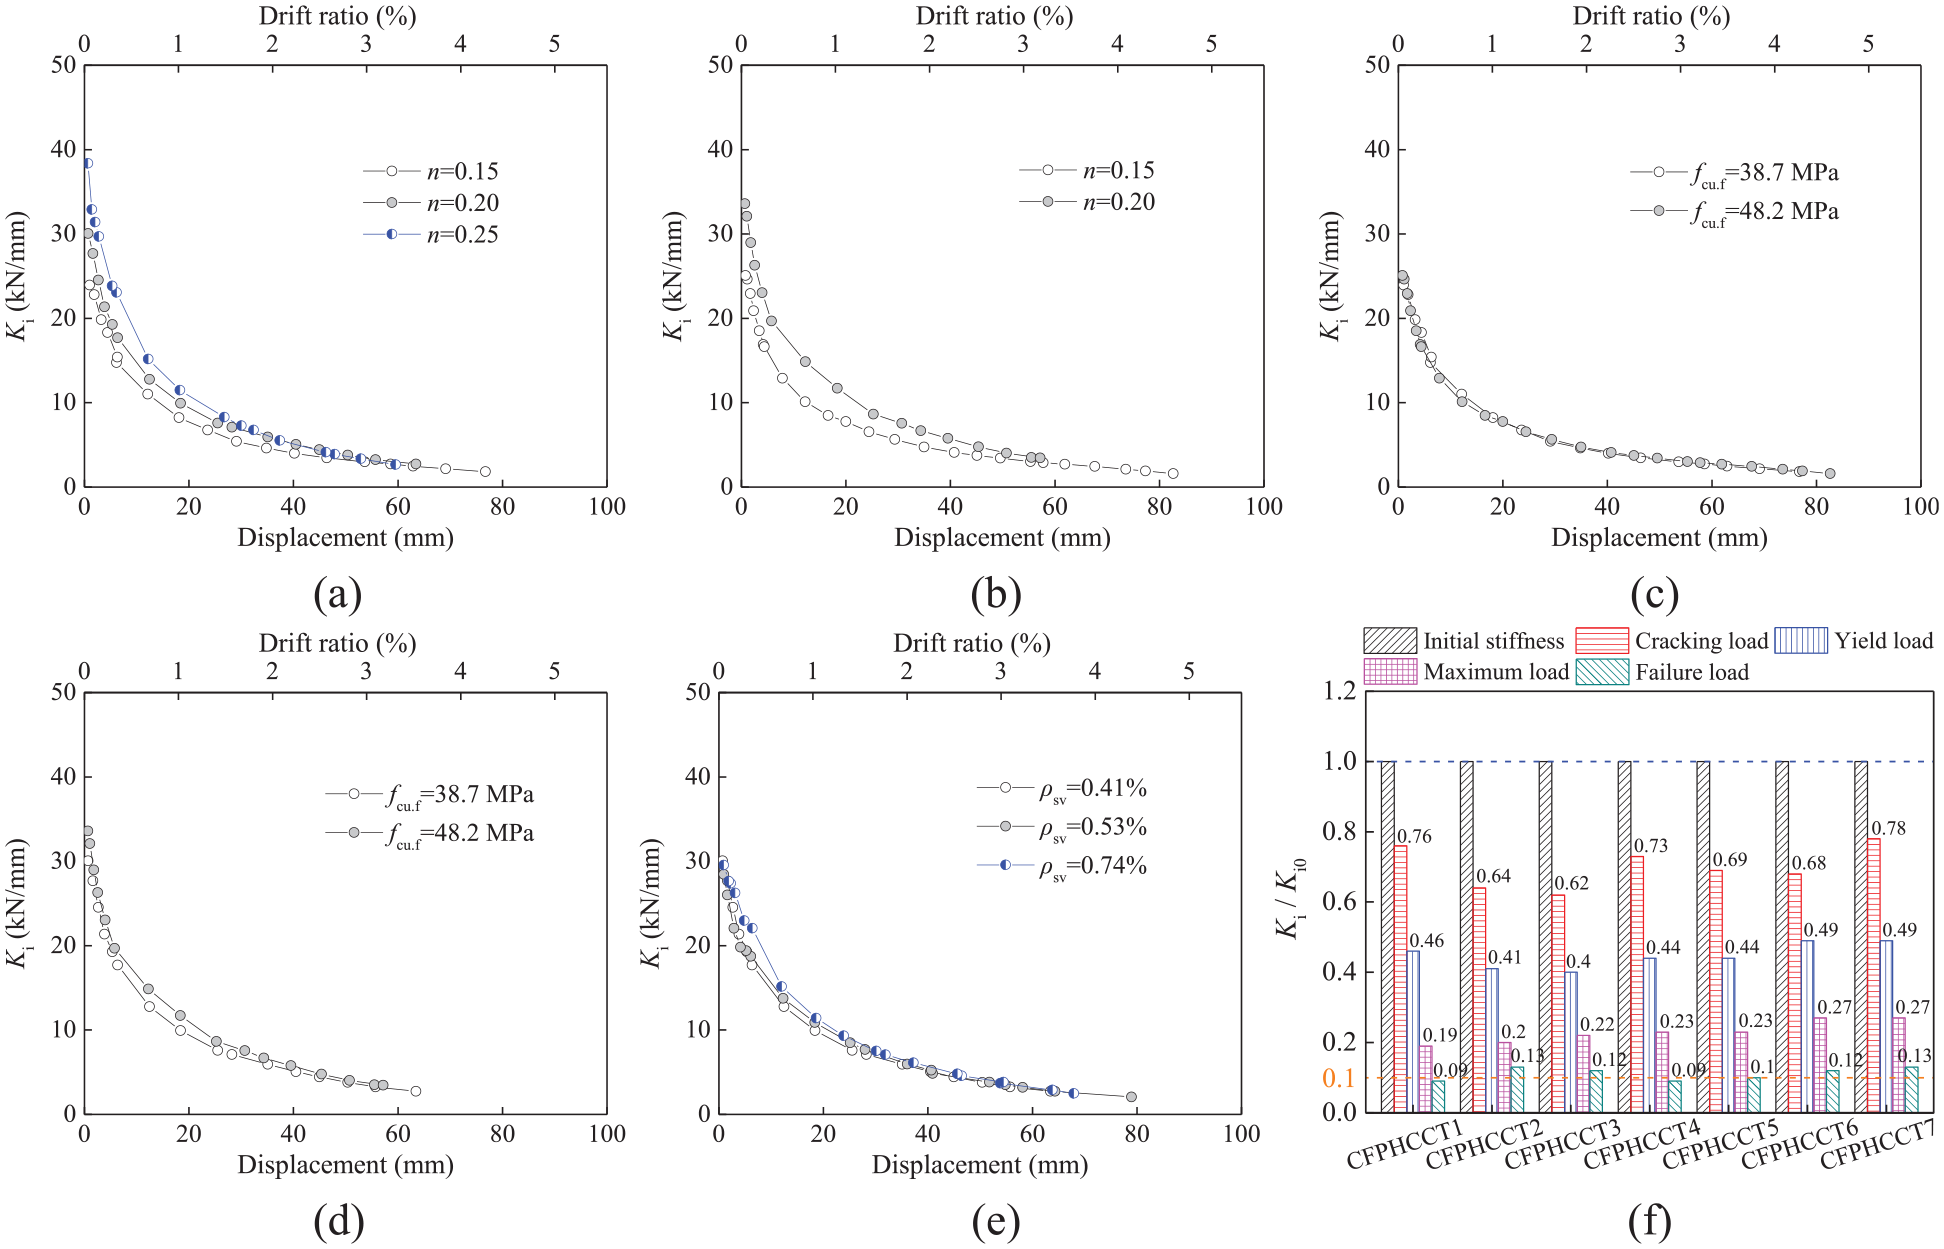
Stiffness degradation: (a) effect of axial compression ratio (CFPHCCT1, 2, and 3), (b) effect of axial compression ratio (CFPHCCT4 and 5), (c) effect of filled concrete strength (CFPHCCT1 and 4), (d) effect of filled concrete strength (CFPHCCT2 and 5), (e) effect of volumetric stirrup ratio (CFPHCCT2, 6, and 7), and (f) stiffness comparison.
As illustrated in Table 2 and Figure 8(a) and (b), the Ki0 of CFPHCCT columns tended to enhance as the n increased. Compared with CFPHCCT1, CFPHCCT2, and CFPHCCT3 exhibited 25.6% and 60.3% increase in Ki0, respectively. Moreover, the Ki0 of CFPHCCT5 was 34% higher than that of CFPHCCT4. However, increasing the n led to a faster stiffness deterioration rate before reaching the peak load. After that, the deterioration rate of specimens CFPHCCT1–5 became slower, and the degradation tendency tended to be uniform. As Figure 8(c) and (d) illustrated, it seems that the fcu.f. has minor influence on the initial stiffness and stiffness degradation. The difference in Ki0 between CFPHCCT2 and CFPHCCT5 was 11.7%, while the difference in Ki0 between CFPHCCT1 and CFPHCCT4 was only 4.8%. In addition, with the increase of ρsv, the Ki0 of CFPHCCT columns remained almost unchanged, as illustrated in Table 2. However, it can be found from Figure 8(e) and (f) that, the deterioration of stiffness for column with a higher ρsv was slightly slower than that of column with a lower ρsv. The stiffness of CFPHCCT2 at cracking load declined by 36%, whereas the stiffness of CFPHCCT6 and CFPHCCT7 at cracking load declined by 32% and 22%, respectively. At yielding load, the stiffness of CFPHCCT6 and CFPHCCT7 was about half of the Ki0, while the stiffness of CFPHCCT2 was about 40% of the Ki0. When the peak load was reached, the stiffness of CFPHCCT2 dropped to 0.2Ki0. In contrast, the stiffness of CFPHCCT6 and CFPHCCT7 dropped to 0.27Ki0. This may be attributed to the fact that the confined effect of high-strength consecutive stirrups reduced the damage in the column, thereby relieving the deterioration process of the stiffness. Moreover, the CFPHCCT column maintained about 10% of its Ki0 at failure load, as shown by Figure 8(f). Generally, CFPHCCT columns exhibited a stable stiffness deterioration process.
Energy dissipation
Figure 9(a) to (e) plots the cumulative energy dissipation (Ec) curves for all columns, where Ec can be calculated by summing the area of each hysteresis loop before the ith cycle. Table 2 lists the total cumulative energy dissipation (Et) for each column. Furthermore, the equivalent viscous damping coefficient (ζeq) is employed for better understanding the hysteresis behavior (Xiao et al., 2012). The value of ζeq can be obtain by equation (2)
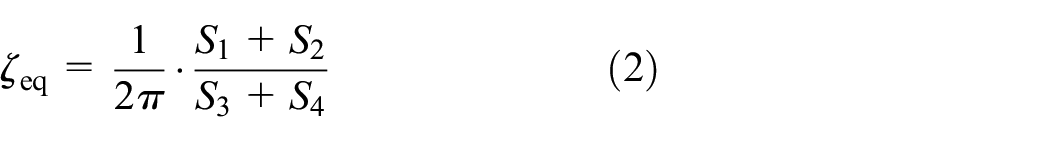
where S1, S2, S3, and S4 represent the areas of regions ABC, CDA, OBE and ODF, respectively, as illustrated by Figure 9(a). The ζeq versus displacement curves and characteristic ζeq for all columns are depicted in Figure 9.
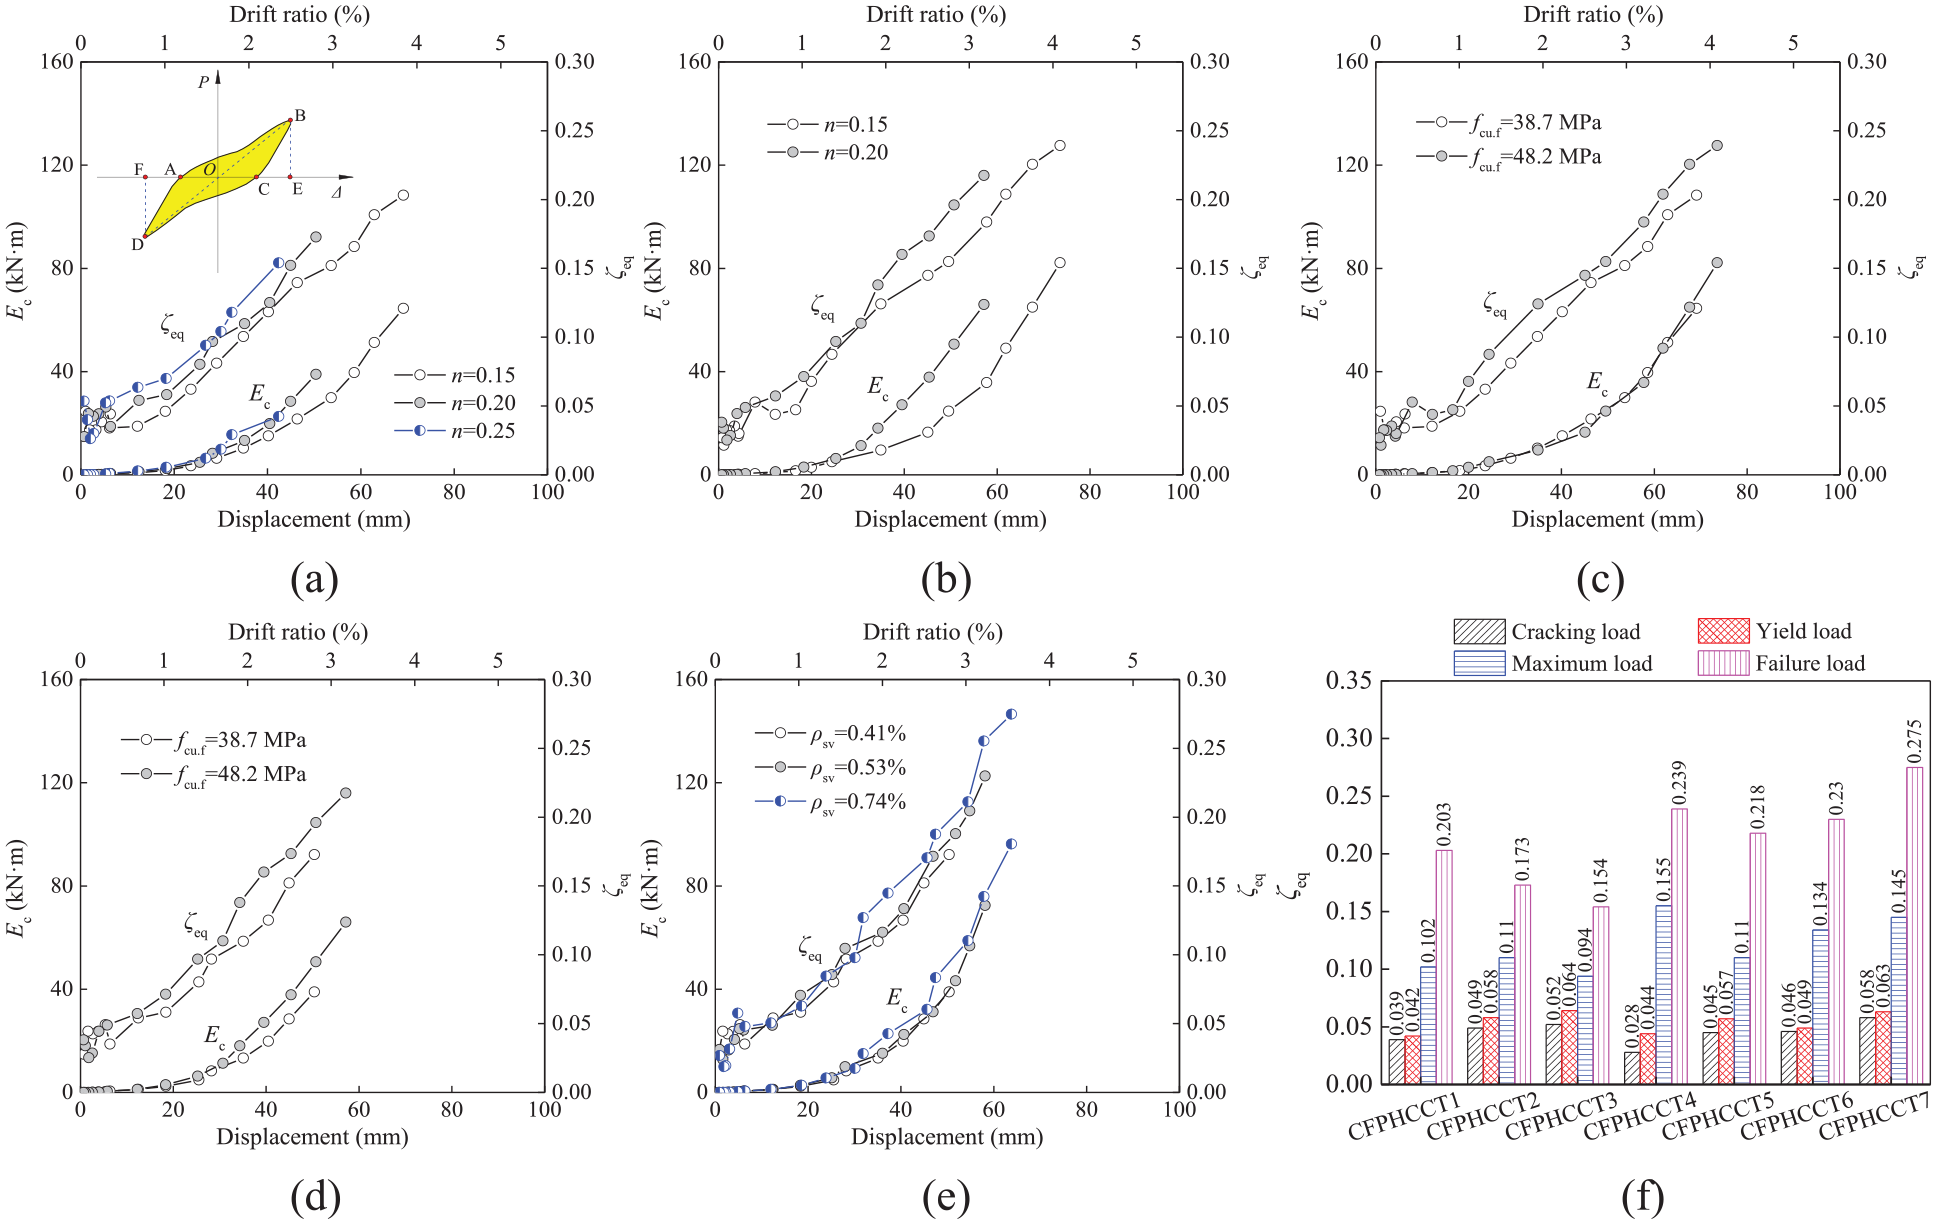
Energy dissipation: (a) effect of axial compression ratio (CFPHCCT1, 2 and 3), (b) effect of axial compression ratio (CFPHCCT4 and 5), (c) effect of filled concrete strength (CFPHCCT1 and 4), (d) effect of filled concrete strength (CFPHCCT2 and 5), (e) effect of volumetric stirrup ratio (CFPHCCT2, 6, and 7), and (f) characteristic ζeq.
As Figure 9(a) to (e) and Table 2 illustrated, the growth trend of Ec for all columns was similar. As the displacement increased, the energy dissipation capability was enhanced continuously. At the same drift ratio, columns with higher n produced larger energy dissipation than those with lower n, as illustrated by Figure 9(a) and (b). However, columns with higher n experienced smaller ultimate displacement, resulting in lower Et at failure. It can be found from Table 2 that as the n increased from 0.15 to 0.20 and 0.25, the value of Et declined by 40% and 65%, respectively. Compared with CFPHCCT4, CFPHCCT5 exhibited 20% reduction in Et. Hence, the n has an unfavorable effect on energy dissipation capacity. Furthermore, the Et value of column with higher strength of filled concrete was higher than that of column with lower strength of filled concrete, as shown by Figure 9(c) and (d). This indicates that CFPHCCT columns with enhanced filled concrete strength could withstand relatively large energy dissipation as the deformation increased. Findings from Figure 9(e) and Table 2 reveal that an increase in ρsv caused a noticeable increase in Et. The Et values of CFPHCCT6 and CFPHCCT7 increased by 86% and 147%, respectively, as compared to CFPHCCT2. Furthermore, CFPHCCT7 exhibited the best energy dissipation in all columns with a total energy dissipation of 96.2 kN m. Therefore, the energy dissipation capability of the CFPHCCT column can be enhanced by increasing the ρsv.
As Figure 9(a) to (e) presented, in specimens CFPHCCT1–CFPHCCT7, the ζeq value was around 0.05 at elastic phase. Then, the ζeq value increased rapidly due to the increased cumulative damage of the column. As Figure 9(f) illustrated, the ζeq value of each column increased significantly after yielding. At the post-peak phase, larger ζeq values could be found in columns with smaller n or higher fcu.f.. Furthermore, the ζeq value increased as the ρsv increased. At the point of failure, CFPHCCT7 displayed a ζeq of 0.275, while the ζeq values of CFPHCCT6 and CFPHCCT2 were 0.23 and 0.173, respectively. The findings of previous research have shown that the ζeq of normal RC columns subjected to flexural failure ranges from 0.1 to 0.2 (Zhao, 2008). In this study, the ζeq of CFPHCCT columns was between 0.154 and 0.275. Hence, the CFPHCCT column proposed in this study possessed comparable or even better energy dissipation capability than normal RC columns.
Cross-sectional strain distribution
The cross-sectional strain distribution of each column at different drift ratios can be determined by using the strains obtained from concrete and longitudinal bars illustrated in Figure 4(b). The strain distribution in cross section for each column in positive loading direction is presented in Figure 10. As can be found from the figure, the neutral axis gradually moved upward as the drift ratio increased, thus the compression zone height decreased. Furthermore, as Figure 10(a) to (e) illustrated, the n has a noticeable effect on the height of compression zone. As the n increased, the height of compression zone increased. In contrast, the effect of fcu.f. and ρsv on the compression zone height was inconspicuous. Generally, the cross-sectional strain distribution for each column was almost linear, although a slight deviation from linearity was observed. Therefore, the assumption of the linear strain distribution was valid and can be suitably employed to predict the bending capacity of the CFPHCCT column.
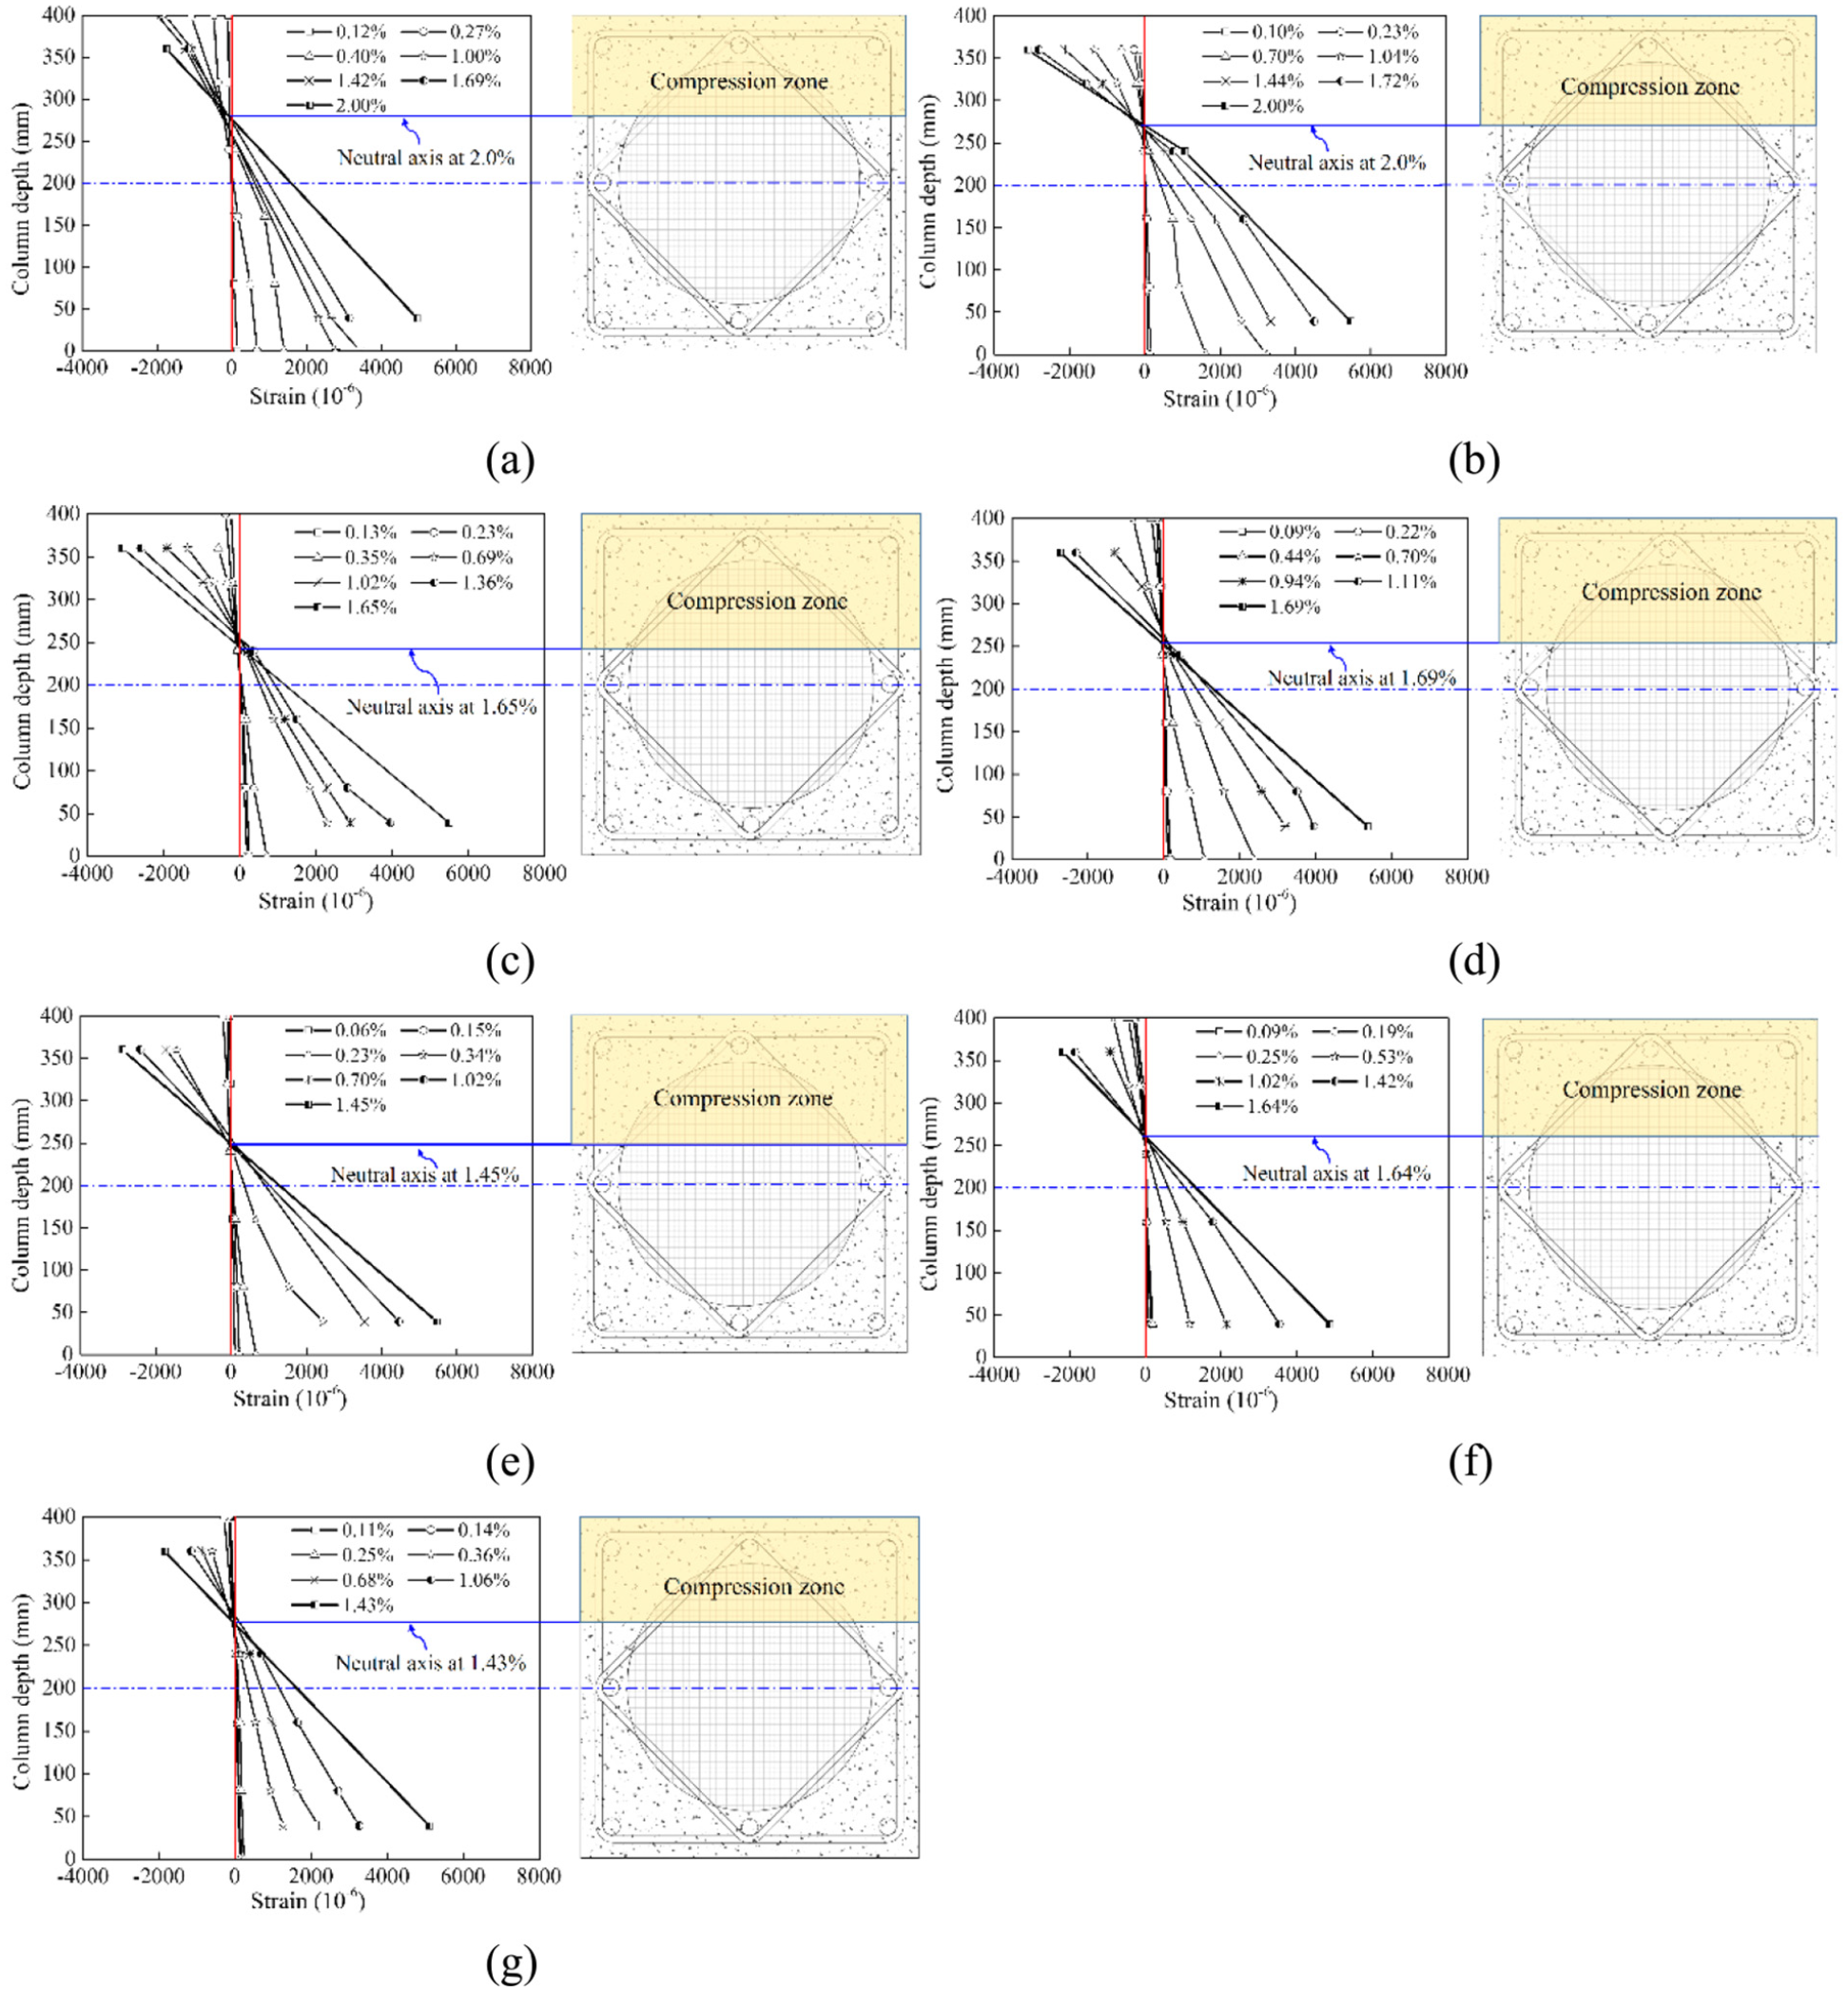
Cross-sectional strain distribution: (a) CFPHCCT1, (b) CFPHCCT2, (c) CFPHCCT3, (d) CFPHCCT4, (e) CFPHCCT5, (f) CFPHCCT6, and (g) CFPHCCT7.
Strain development of stirrups
Figure 11 depicts the strain development of stirrups for each column. The strain gauges G1 and G2 were attached to the stirrup at level 1, as illustrated in Figure 4(b). As observed in Figure 11, the stirrups of each column maintained a small strain before the occurrence of inclined cracks, indicating that the shear was mainly sustained by concrete. A sudden increase in the strain of the stirrups can be observed when the inclined cracks occurred in the plastic hinge region. Subsequently, as the applied displacement increased, the stirrup strain continued to increase rapidly. Findings from Figure 11(a) to (c) display that the strain of stirrups was significantly reduced as the n increased. This is mainly due to the fact that the presence of axial compressive load limited the propagation of the inclined cracks and thus inhibited the strain development of stirrups. Furthermore, at the maximum load, the stirrup strain of the column with higher ρsv was smaller than that of column with lower ρsv, as illustrated in Figure 11(b), (f), and (g). For all columns, the stirrup strain did not reach the yield strain when the maximum load was reached, indicating that stirrups was in the elastic phase. After the maximum load, the exerted load was gradually reduced, but the stirrup strain increased rapidly, which indicates that the confined effect of stirrups began to play a major role in increasing the strain of the stirrup. In general, high-strength consecutive stirrups can provide better confinements for PHCC tube and filled concrete in the post-peak phase, and enhance the integrity of the CFPHCCT column.
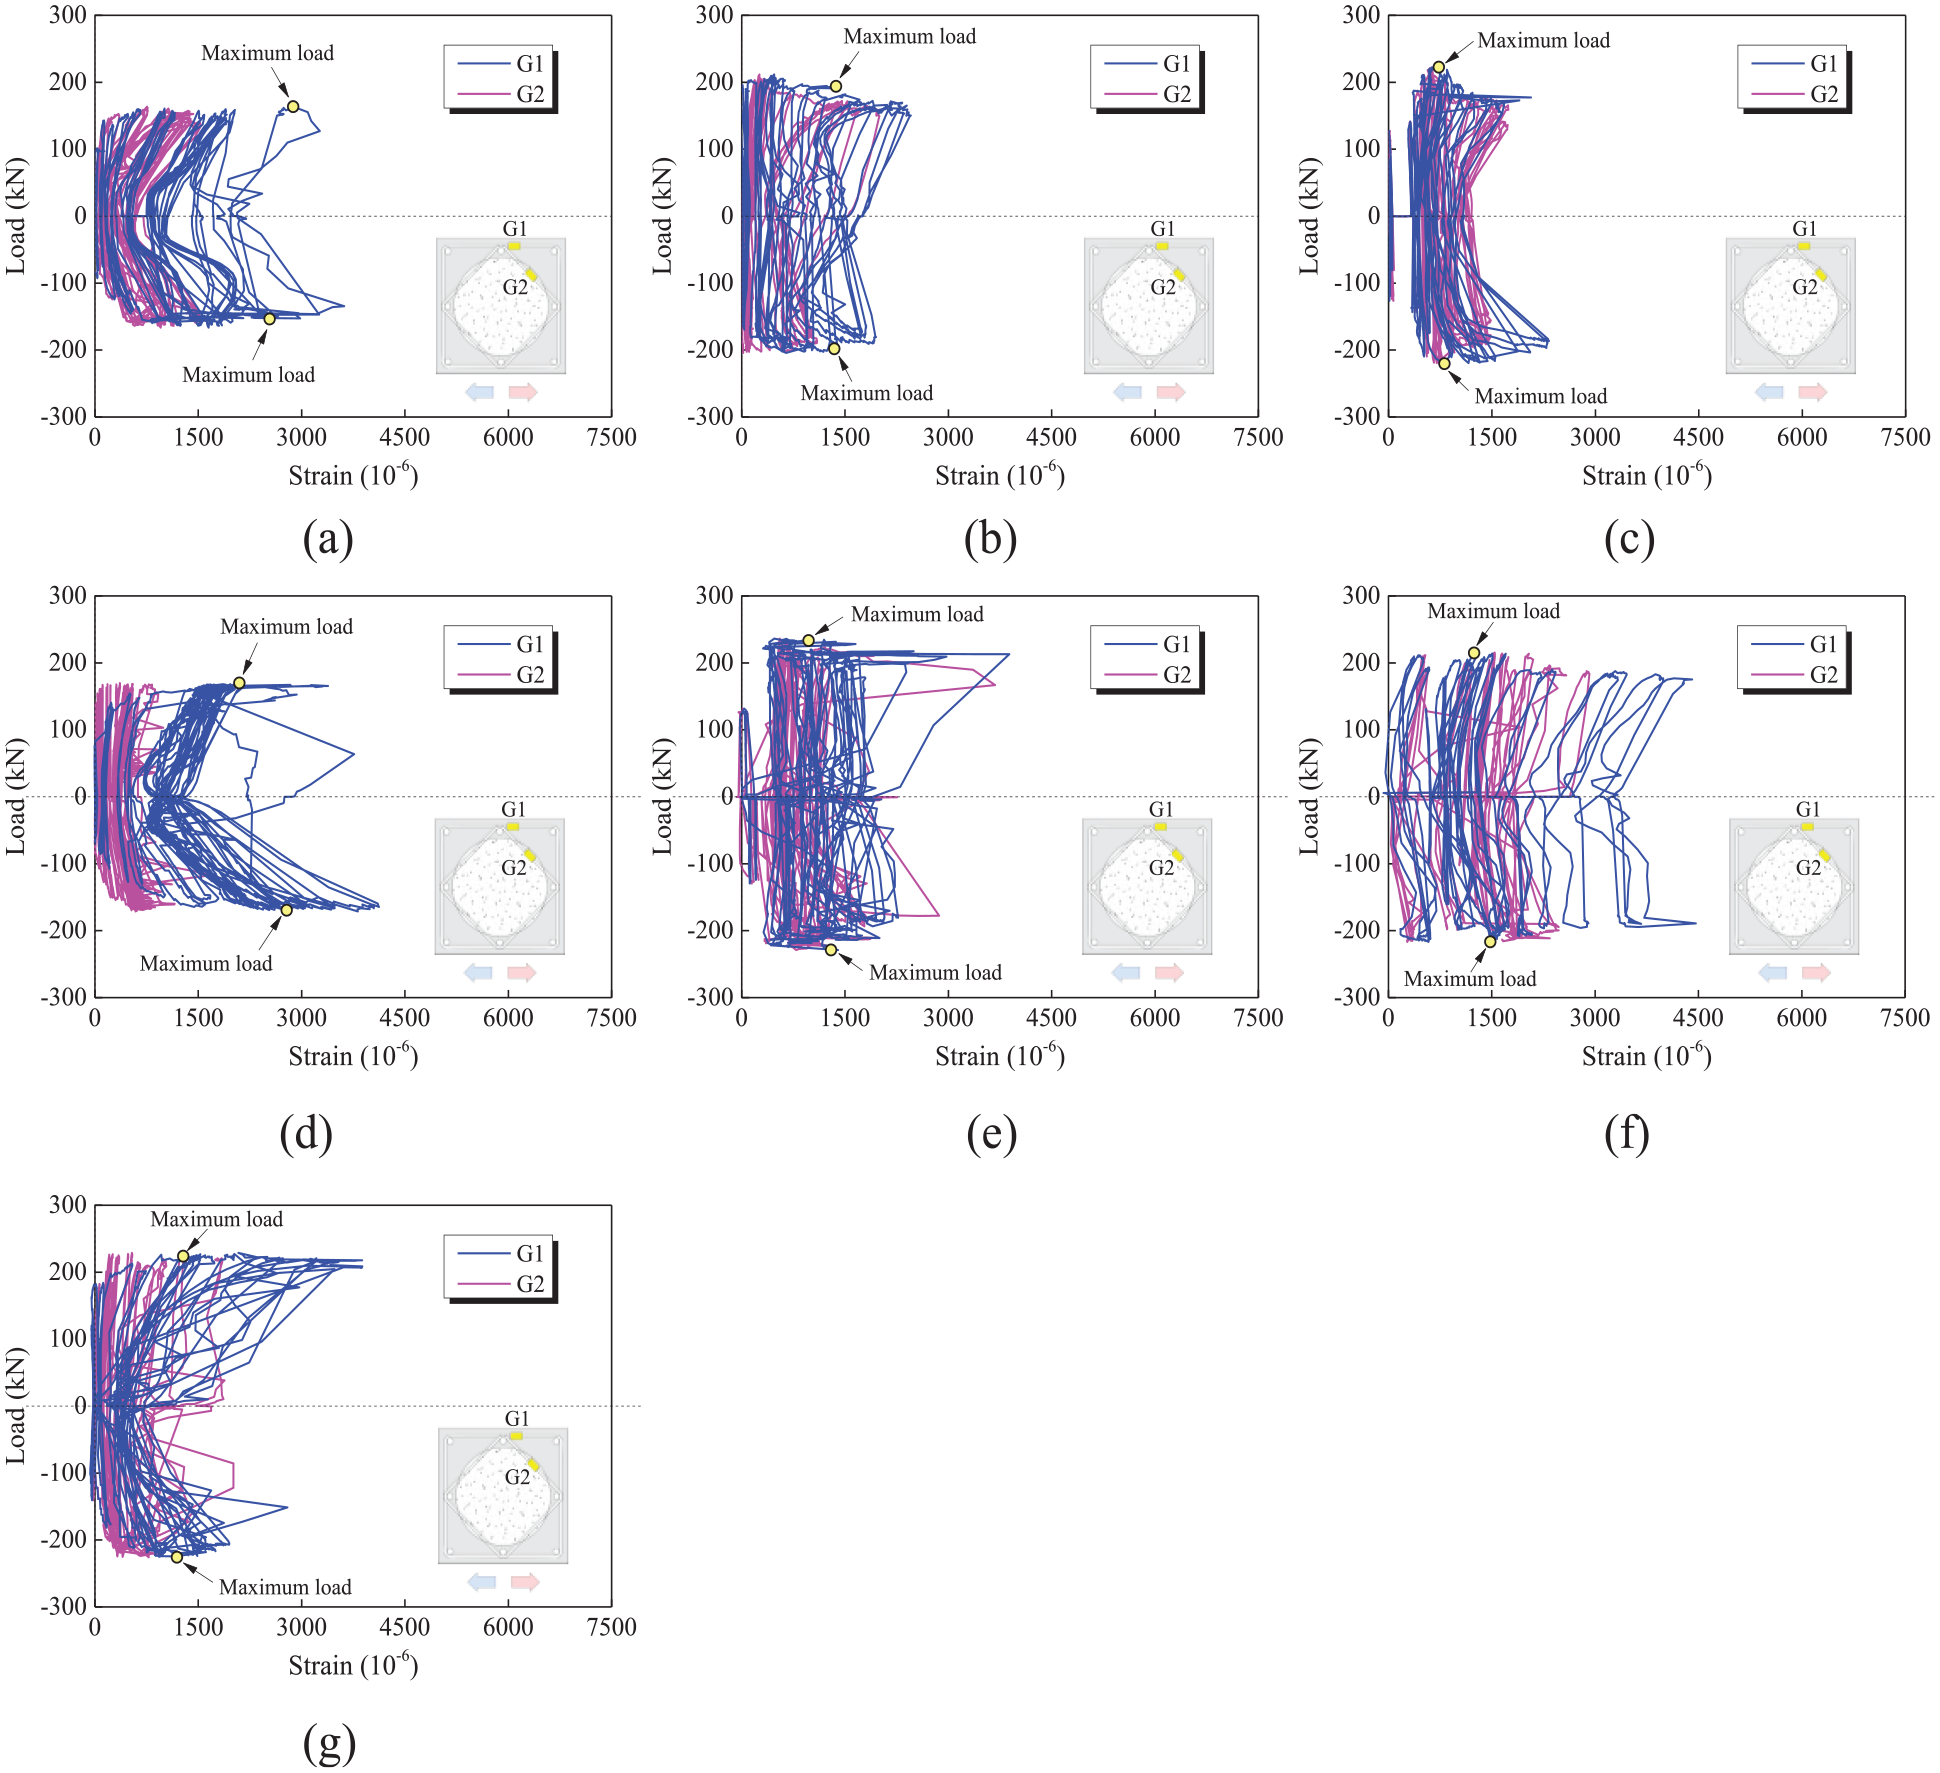
Strain development of stirrups: (a) CFPHCCT1, (b) CFPHCCT2, (c) CFPHCCT3, (d) CFPHCCT4, (e) CFPHCCT5, (f) CFPHCCT6, and (g) CFPHCCT7.
Bending capacity
Based on the test results, the failure mode of all CFPHCCT columns was dominated by flexure, which can be regarded as integral component. Therefore, the assumption of the linear strain distribution is valid and can be suitably employed to predict the bending capacity of the CFPHCCT column.
Axial load-bending moment interaction curves
In order to examine the load-carrying capability of CFPHCCT columns, the bending capacity of each column was predicted according to GB 50010-2010 (2010). Based on the assumption of linear strain distribution, the compatibility related to the perfect bond between PC and filled concrete, and the internal force balance calculated from the constitutive equations of different materials, the N–M interaction curves can be obtained by conducting cross-sectional analysis using a fiber model. In the predictions, steel bars were regarded as an ideal elastic–plastic material, and the constitutive equation for compression concrete recommended by CECS 356-2013 (2013) was employed. Figure 12(a) displays the N–M interaction curves for all columns, and the comparison between the test and predicted results is given in Figure 12(a) and Table 2. It can be found that the average Mt/Mc1 value was 0.94, and the COV was 0.06. Hence, the predicted results agree well with the test results. This indicates that the CFPHCCT column developed full combined strength.
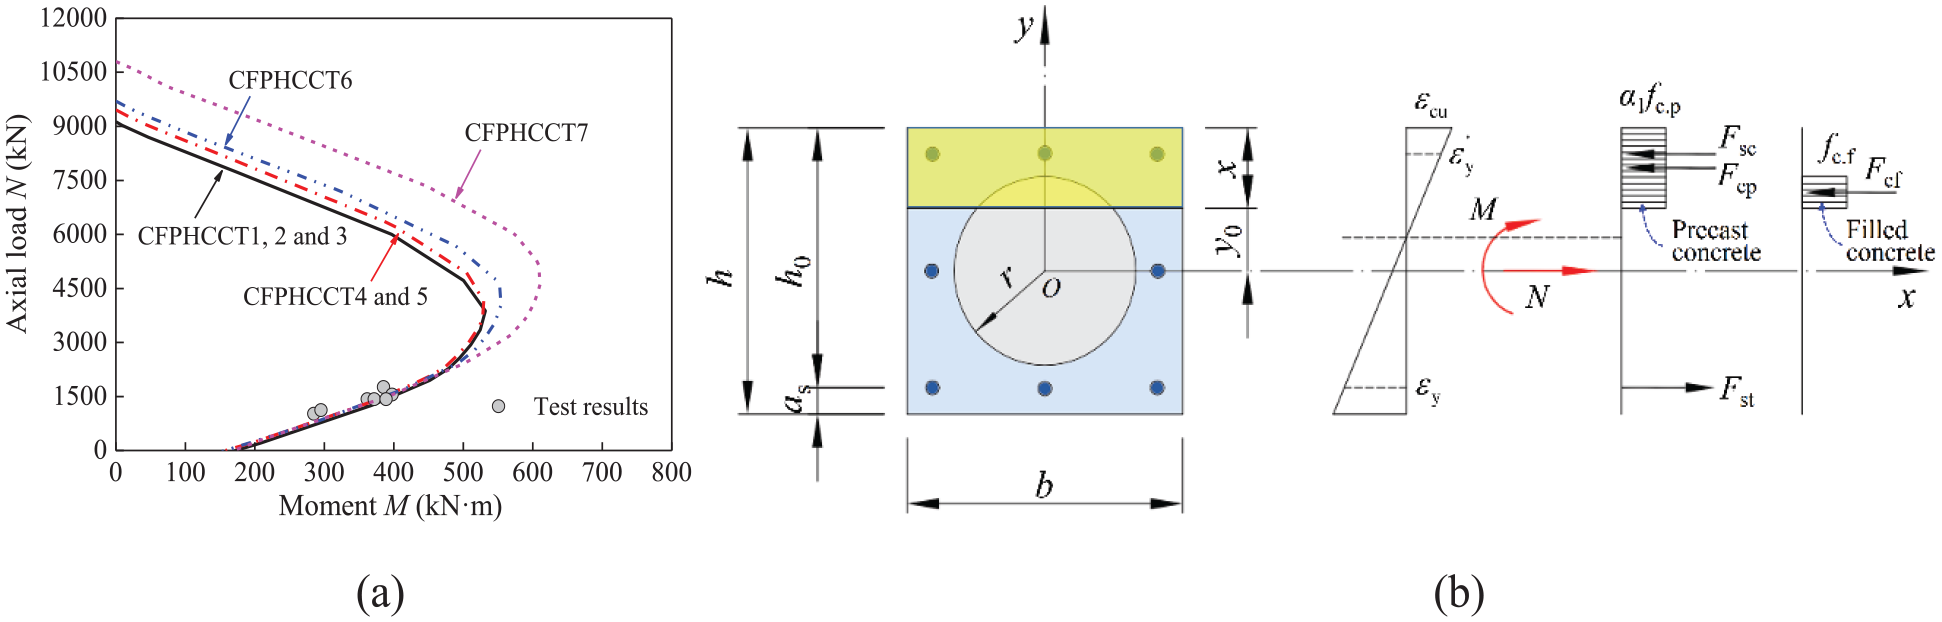
Prediction of bending capacity: (a) N–M interaction curves and (b) distribution of strain and stress at the limit state.
Calculation of bending capacity
According to the test results, the calculation formula for predicting the bending capacity of CFPHCCT column was proposed in this study. Figure 12(b) plots the strain and stress distribution on the cross section at the limit state. The tensile strength of concrete was neglected. Based on the equilibrium condition of the internal force, the bending capacity M can be calculated by equations (3)–(12)
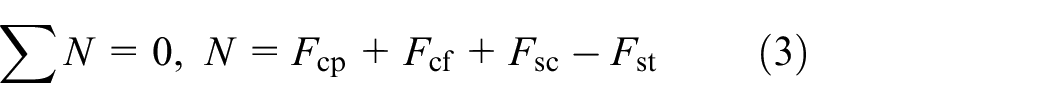
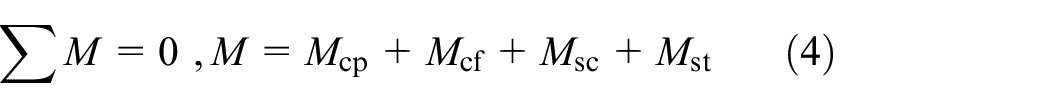
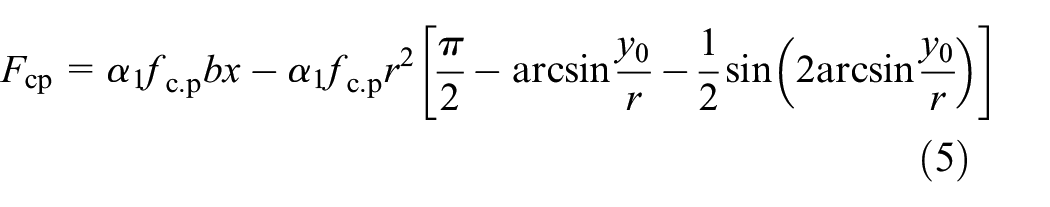
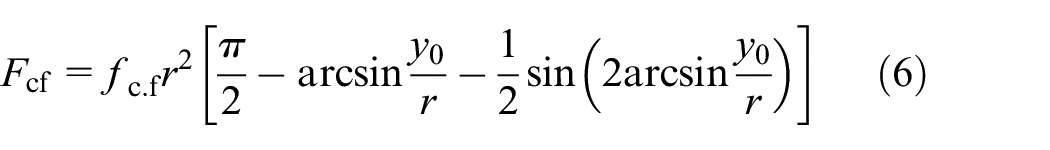
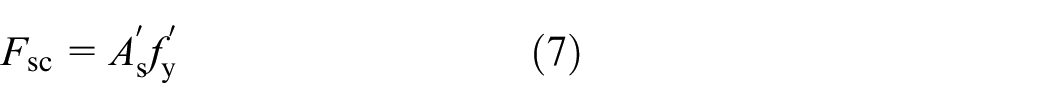

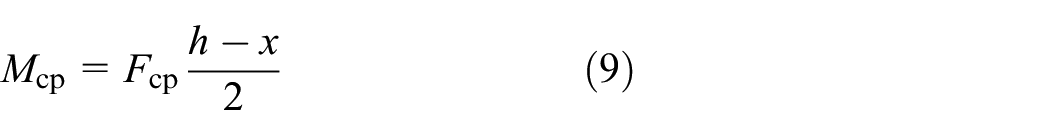
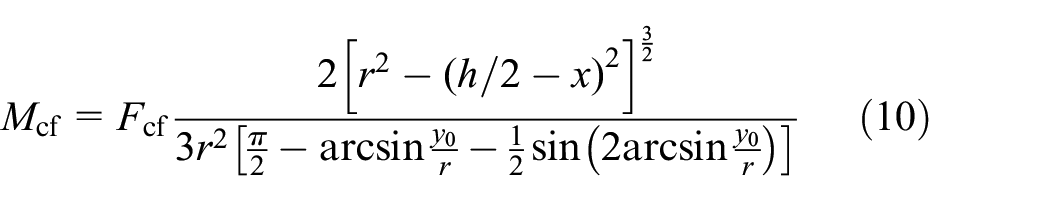
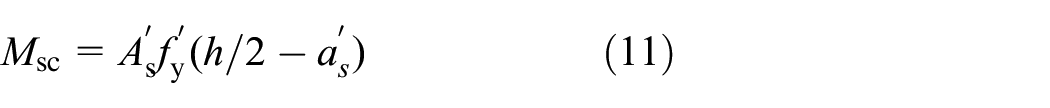

where Fcp, Mcp: compressive force of PC and corresponding bending moment, respectively; Fcf, Mcf: compressive force of filled concrete and corresponding bending moment, respectively; Fsc, Msc: compressive force of longitudinal bars and corresponding bending moment, respectively; Fst, Mst: tensile force of longitudinal bars and corresponding bending moment, respectively; r: radius of core area; x: height of concrete compression zone;


The comparison of test and calculated results is reported in Table 2. It can be found that the test results werer slightly higher than the calculations, and the proposed calculation formula gave a conservative prediction. The average Mt/Mc2 value was 1.08, with a COV of 0.05, which indicated that the bending capacity predicted from the calculation formula was in good agreement with the experiment results.
Conclusion
This work mainly presented the experimental and analytical results of cyclic tests on CFPHCCT columns. The major findings from the limited study reported in this work are summarized as below.
All CFPHCCT columns failed in ductile modes with good integrity of the column section due to the presence of high-strength consecutive stirrups, and no bond damage between the precast and filled concrete was found. The proposed CFPHCCT column achieved good integrity behavior. Furthermore, decreasing spacing of the stirrups helped to delay the spalling of PC and the buckling of longitudinal bars, and reduced the damage of the plastic hinge region.
Despite the increased bearing capacity and initial stiffness, high axial compression ratio has an unfavorable effect on the inelastic performance of CFPHCCT columns, such as a rapid degradation of strength and stiffness, a low ductility and dissipated energy, and a decline in inelastic deformability. In contrast, the filled concrete strength has a limited influence on the structural behavior of CFPHCCT columns.
In CFPHCCT columns, a smaller spacing of high-strength consecutive stirrups can improve ductile behavior. The increase of volumetric stirrup ratio improved the bearing capacity, ductility, energy dissipation capacity, and inelastic deformability, but has minor effect on the initial stiffness.
The ductility ratio of CFPHCCT columns ranged from 3.77 to 5.97, which achieved the ductility demand of concrete members in seismic zone. In general, CFPHCCT columns have moderate to high levels of ductility and exhibited excellent ductility behavior.
High-strength consecutive stirrups did not yield at maximum load, hence the confinement of high-strength consecutive stirrups to the core concrete can continue to increase. This indicates that the high-strength consecutive stirrups can provide better confinements for CFPHCCT columns during the post-peak phase and enhance its integrity behavior.
The calculation formula based on the limit analysis method was developed to predict the bending capacity of CFPHCCT columns. The comparison indicates that the results predicted from the formula are in good agreement with the test results, and the proposed calculation formula provides a conservative prediction.
Footnotes
Declaration of Conflicting Interests
The author(s) declared no potential conflicts of interest with respect to the research, authorship, and/or publication of this article.
Funding
The author(s) disclosed receipt of the following financial support for the research, authorship, and/or publication of this article: This research was supported by the National Natural Science Foundation of China (Grant no. 51578369) and the Tianjin Science and Technology Major Projects, China (Grant no. 17ZXCXSF00080). The authors wish to express their sincere gratitude to the sponsors.