
Abstract
Hong Kong is situated in an intraplate area of low to moderate seismicity, where recorded strong-motion accelerograms are scarce. As part of the seismic design process, dynamic time-history analysis is sometimes required for assessing the seismic performance of structures. Hence, earthquake accelerograms representative of various local design hazard levels are needed. This study aims to develop a methodology for building up a database of earthquake accelerograms for the Hong Kong region which can be used for the analysis and design of a variety of structural and geotechnical systems. An outline of the previous probabilistic seismic hazard analysis studies conducted for Hong Kong is first presented and several design earthquake scenarios are determined, which contribute most to the local seismic hazard given a specific return period. The median response spectra and conditional mean spectra of the selected earthquake scenarios for reference rock sites are then derived based on the component attenuation model. The conditional mean spectra are then used as the target spectra for the selection and scaling of recorded accelerograms sourced from the available global database. Finally, a suite of conditional mean spectra–compatible accelerograms for rock sites is presented, from which event-specific and site-specific accelerograms are generated through dynamic site response analysis.
Keywords
Introduction
Hong Kong, as a densely populated metropolis, has a highly developed and sophisticated infrastructure system including buildings, bridges, tunnels, and so on, among many other components. One of the major concerns is the safety and resilience under seismic conditions as earthquake failure could lead to enormous direct and indirect economic losses, in addition to potential loss of lives. The need for proper seismic design and assessment of structures has been discussed and investigated within the engineering community in Hong Kong in the past three decades (Scott et al., 1994). While the seismic design requirements for bridge structures in Hong Kong are specified in the Structures Design Manual for Highways and Railways (Highways Department, 2013), the statutory code of practice for seismic design of building structures is still being drafted and will be published soon.
For seismic design and assessment purpose, earthquake accelerograms play an important role in dynamic analysis, especially for structures prone to inelastic response and higher-mode effects during earthquakes. The construction of a reliable ensemble of earthquake accelerograms for engineering applications in Hong Kong is long overdue. On the other hand, Hong Kong being located in an intraplate area of low to moderate seismicity has a scarcity of recorded earthquake accelerograms that are of engineering relevance (Lee et al., 2000). As a result, ground motion selection and scaling, which associate the local seismic hazard with recorded earthquake ground motions from other regions, provide a reasonable alternative. It is an essential, yet underrated, issue in seismic design and assessment, as the choice of ground motion inputs is as important as the structural modelling itself.
Normally, the ground motions for a structure at a certain location are selected considering the specific structural properties and seismic hazard (Baker and Cornell, 2006). Four scaling methods have been used, including geometric-mean scaling of pairs of ground motions, spectrum matching of ground motions, first-mode-period scaling to a target spectral acceleration, and scaling of ground motions as per the distribution of spectral demands (Huang et al., 2009). Although these approaches are suitable for ground motion selection for a particular structure, they are not necessarily applicable to other structures in the entire region with a variety of structural and geotechnical systems at a wide range of locations. A more practical approach is to develop a standardised database of accelerograms which are not structure-specific. Instead, these accelerograms should consist of a specific variety of spectral shapes, ground motion durations and other parameters to be able to capture the local ground motion aleatory variability. The application of such accelerograms is expected to save a lot of effort in local seismic design and assessment practice.
This study is aimed at developing a methodology for building up a database of standardised accelerograms which are representative of the projected earthquake scenarios and site conditions in Hong Kong. In this aspect, the conditional mean spectrum (CMS) methodology will be useful for selecting and scaling accelerograms for structural design. The procedure is described as follows:
(a) Identify the dominant earthquake scenarios from the de-aggregation of local seismic hazard within the probabilistic seismic hazard analysis (PSHA) framework.
(b) Simulate the median response spectra of the dominant scenarios for rock sites by employing the component attenuation model (CAM).
(c) Calculate the corresponding CMSs by scaling up the median response spectra to match with the uniform hazard spectrum (UHS).
(d) Select and scale the recorded accelerograms sourced from global strong-motion database in accordance with the newly derived CMSs.
(e) Simulate the accelerograms for a specified site based on dynamic site response analysis. The procedure proposed in this article can be used to simulate earthquake accelerograms for dynamic time-history analysis of a variety of structural and geotechnical systems in Hong Kong.
Seismic hazard in Hong Kong
Hong Kong is located within the South-Eastern coastal seismic belt of China. Within this belt, a total of 119 earthquakes with surface-wave magnitude Ms ≥ 4.75 have been recorded since 1067 (Lee et al., 1976, 2000), including 84 events with Ms between 4.75 and 5.25, 21 events between 5.5 and 5.75, 7 events between 6 and 6.5, 4 events between 6.75 and 7, and 3 events between 7.3 and 7.5. Hence, tremors can be felt in Hong Kong occasionally due to regional seismicity.
Various seismic hazard studies have been carried out for Hong Kong since the late 1980s. In the absence of recorded strong-motion data in this region of low to moderate seismicity, some of the early investigations (Lee et al., 2000; Pun and Ambraseys, 1992) employed attenuation models based on relationships developed from the empirical database of records collected in regions of high seismicity like North Western America. However, because of insufficient supporting evidence for the application of attenuation relationships from high seismicity regions to local conditions in the South China region, empirical models were often replaced by theoretical models in more recent studies.
In a seismological model, the coefficients of the Fourier amplitude spectrum (FAS) for characterising the spectral properties of the earthquake ground motion are expressed as algebraic functions comprising the product of a combination of component factors that define contributions by various ground motion generating/modification mechanisms. One of the component factors is the generic source factor of intraplate earthquakes as derived from the analysis of data recorded in Central and Eastern North America, which is characterised by very hard rock conditions (where seismic waves reaching the ground surface are not very different from those generated by the source of the earthquake). The other factors in the expression are regional path and site factors that can be derived from the results of seismological studies undertaken in the subject region of interests. Thus, the stochastic methodology is not purely theoretical as the modelling parameters have to be derived by calibration against empirical data. Accelerograms can be generated by combining the FAS as defined by the seismological model with random phase angles. Parametric studies undertaken to generate accelerograms using the stochastic process have been used to develop ground motion predictive expressions (GMPEs). The CAM is a GMPE developed by some of the co-authors using this approach. CAM is described in greater details later in section ‘Scenario-specific median response spectra for rock sites’. Details of studies involving the use of CAM and the stochastic methodology can be found in Chandler and Lam (2002), Free et al. (2004), Tsang (2006), Tsang and Chandler (2006), and more recently Arup (2015). Other notable contributions to stochastic simulations are reported in Huang and Wang (2015a, 2015b, 2017) and Liu and Hong (2013).
While stochastic simulations in its own right can generate random phase angle accelerograms, this study features the assimilation of a stochastic-based attenuation model (i.e. CAM) into the CMS methodology. The integration of CAM into CMS has the following advantages over stochastic simulations: (a) preserving phase angle information embodied in the real accelerogram records and (b) ensuring that the selected (and scaled) accelerograms are automatically code compatible.
In most of the aforementioned studies, the PSHA methodology was employed to provide estimates of spectral response for different structural natural periods with different probabilities of exceedance or return periods. Good consistency is observed between the independently developed models in the intermediate and high natural period ranges (Tsang and Lam, 2018). Considering the spatial variations of seismic hazard within Hong Kong (Scott et al., 1994; Su et al., 2015), a recommended design response spectrum (DRS) model has been proposed in Su et al. (2011), Tsang (2018) and Tsang and Lam (2018), which encompasses and idealises the UHS models from various recent studies. For reference rock sites with a return period of 2475 years (rounded up to 2500 years for convenience hereafter), the DRS model in displacement format is expressed as
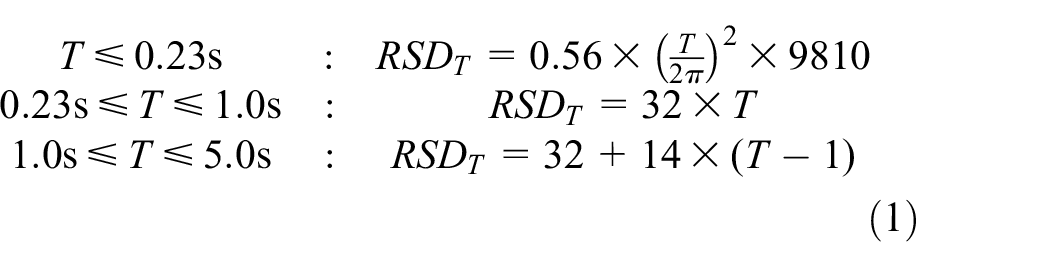
where RSDT = response spectral displacement (mm) and T = natural period of the structure (s). The compatible acceleration DRS model can be obtained conveniently by direct transformation of the displacement DRS model by

where RSAT = response spectral acceleration (g) and g is the acceleration due to gravity. Note that this DRS model has a format (and equations) slightly different from that of the default response spectrum model (Tsang, 2015) recommended in Eurocode (EC) 8, that is, EN 1998-1 (British Standard Institution (BSI), 2004), to which some of the local design codes refer (Highways Department, 2013). Hence, Tsang and Lam (2018) have simplified the DRS model to one that is compatible with EC8. Figure 1 compares the original DRS model initially put forward by Su et al. (2011) and the EC8-compatible model in Tsang and Lam (2018) for reference rock sites with a return period of 2500 years. The spectral demand implied by the simplified model has slightly overestimated for the period T in the range 1.0–3.5 s and underestimated for T above 3.5 s in comparison with the original DRS model. In this study, the DRS model, which more realistically represents the seismicity pattern in the region surrounding Hong Kong, is adopted as the UHS model.
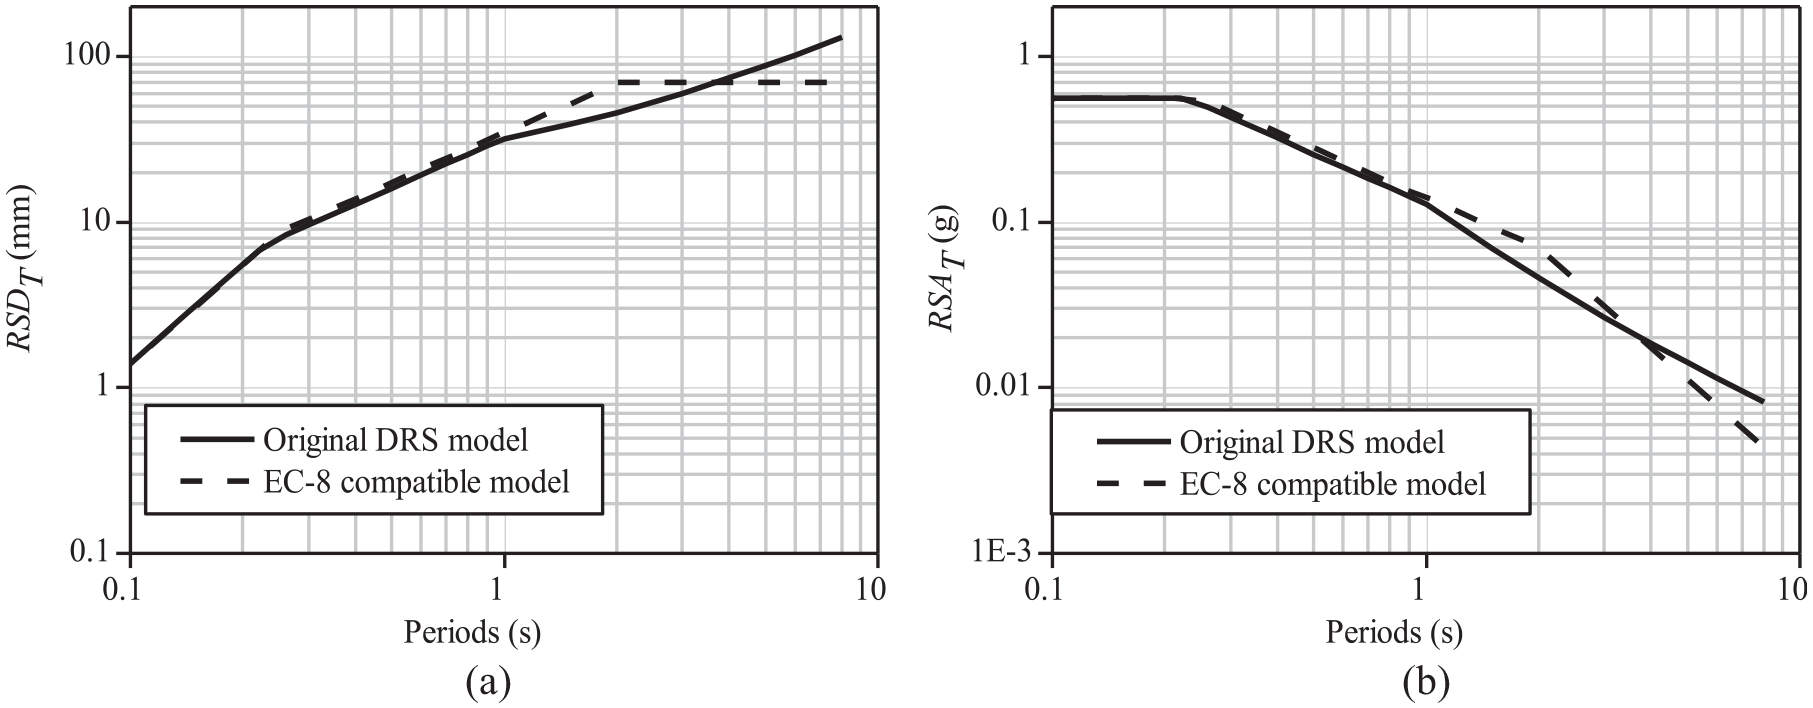
Comparison of original DRS model with EC8-compatible model for reference rock sites with a return period of 2500 years (Tsang and Lam, 2018): (a) displacement format and (b) acceleration format.
CMS for rock sites
General
When using the recorded acceleration time histories for dynamic analysis, the ground motion characteristics have to be representative of the dominant (or design) earthquake scenarios. There are in general two common approaches for selecting ground motion time histories.
The first approach is to find recordings with appropriate seismological properties which are consistent with those of the design earthquake scenarios in terms of earthquake magnitude and source-to-site distance as identified in the de-aggregation result, as well as the tectonic environment and earthquake rupture mechanism. However, as indicated by Baker (2015), there are several problems associated with this approach. First, it restricts the selection to a limited number of available ground motion records. This can be more problematic in regions of low-to-moderate seismicity like Hong Kong where there is a paucity of strong motion data that can be sourced locally (Lam et al., 2016). More importantly, the seismological parameters are imperfect proxies for the ground motion properties of interest (such as response spectra and duration) and those properties are only indirect indicators of seismic actions imposed on a structure (Iervolino and Cornell, 2005). Therefore, the seismological parameters tend to be poor predictors of seismic demands in the context of damage predictions.
The second approach is spectral matching in which compatibility between the response spectra calculated from accelerograms and the corresponding ‘target’ spectrum is sought. The ‘target’ spectrum is usually the UHS as derived from a PSHA, which takes into account all the possible earthquake scenarios that could affect the site corresponding to a specified return period or annual probability of exceedance. This approach has been applied widely to seismic codes, for example, EN 1998-1 (BSI, 2004), and has been utilised in both the force-based and performance-based design frameworks (Wen and Wu, 2001). However, as indicated by Somerville and Thio (2011), adopting the UHS as the ‘target’ spectrum makes the selection too ‘broadband’ thereby resulting in over-predictions of the ground motion intensities over a wide range of natural periods.
To overcome problems associated with the two aforementioned approaches, an emerging approach is to use the CMS, which estimates the distribution (comprising the mean and standard deviation) of the response spectrum, conditioned on the occurrence of a target spectral acceleration value at the period of interest (Baker et al., 2014). The reference response spectrum is generally the UHS obtained from PSHA so that the CMS maintains the probabilistic rigour of PSHA. Then the CMSs are used as the ‘target’ spectrum for the selection of ground motion records. Therefore, consistency is achieved between the PSHA and the selected ground motions. It has been shown that the CMS is an appropriate target response spectrum for selecting ground motions as inputs for dynamic analysis (Baker, 2011).
The CMS for rock sites can be generated through the following procedures:
Determination of the dominant earthquake scenarios in the region;
Generation of scenario-specific median response spectra for rock conditions;
Generation of the CMS.
Dominant earthquake scenarios
The dominant earthquake scenarios expressed in terms of magnitude-distance (M-R) combinations are first identified for the specified return periods. There are several approaches to determine the earthquake scenarios in a region, including de-aggregating regional seismic activity within the PSHA framework (Arup, 2015; Bommer et al., 2000; McGuire, 1995), ‘broad source zone’ modelling approach (Chandler and Lam, 2002), and expanding circular disc (ECD) method (Chandler and Lam, 2002). These three approaches have all been applied to the Hong Kong region to determine the dominant earthquake scenarios (Chandler and Lam, 2002; Pappin et al., 2008; Pappin and Koo, 2005). The typical trend is that small magnitude events close to the site contribute most to the response spectral contents in the short period range, whereas large magnitude events from a long distance contribute most to the response spectral contents in the longer period range. In this study, the earthquake scenarios of Hong Kong are extracted from the result of a recent report of the Geotechnical Engineering Office (Arup, 2015). By adopting the procedures recommended by McGuire (1995), the dominating scenarios with a return period of 2500 years have been determined within the PSHA framework as:
M = 5.5, R = 25 km for T* = 0.2 s;
M = 7.0, R = 60 km for T* = 1.0 s;
M = 7.75, R = 300 km for T* = 5.0 s.
where T* is the specific natural period.
Scenario-specific median response spectra for rock sites
For scenario earthquakes with the predicted M-R combinations, the CAM was used for simulating the median response spectra for rock conditions. CAM was developed based on stochastic simulations of the seismological model which was originally developed for Central and Eastern North America (Lam et al., 2002; Tsang and Chandler, 2006). Within the CAM model, a diversity of regional conditions can be taken into account by varying the values of geophysical parameters, enabling its application to a diversity of crustal environments. The latest version of CAM (Tang et al., 2018) is defined in a simple functional form which decouples the source and attenuation effects into different components as

where Y is the predicted ground motion intensity measure assuming 5% damping of the structural system, which is orientation-independent; Δ is the reference intensity measure for the reference scenario (e.g. M = 6, R = 30 km); α is the source factor, which is a function of the earthquake magnitude (M); β is the path factor that accounts for the attenuation effects excluding geometric attenuation; G is the geometric attenuation factor accounting for the effects of the ‘wave-guide’; γ is the crustal factor accounting for the upper crustal amplification and attenuation phenomena within the rock crust; S is the site factor which takes into account modifications of the upwards propagating seismic waves by soil sediments overlying bedrock; and C is the calibration factor. The modelling parameters can be obtained from Tang et al. (2017).
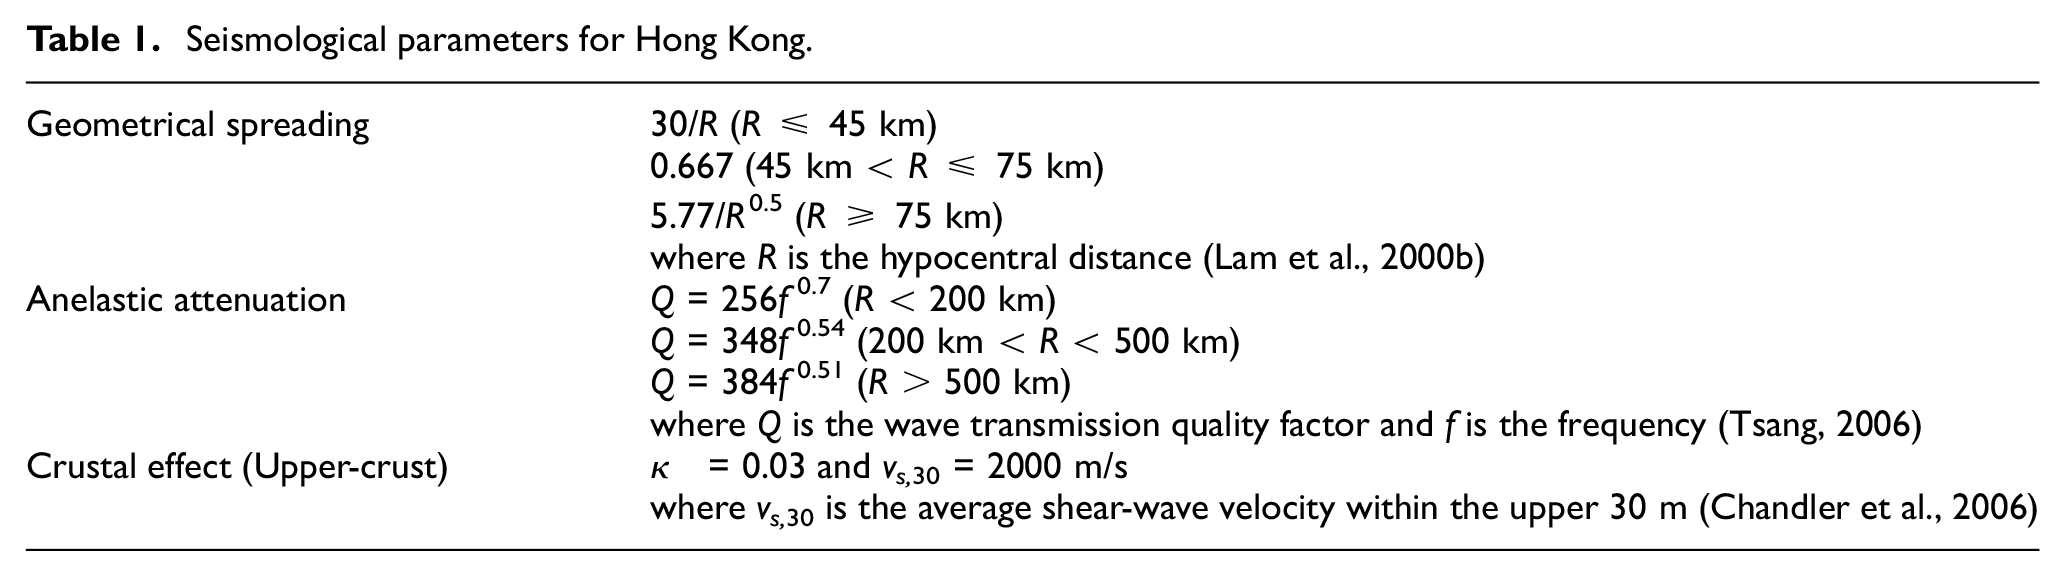
In the use of CAM, the necessary input parameters include the earthquake scenario parameters M and R, the anelastic attenuation parameter Q0, n and κ, and geometric attenuation parameters (such as limiting distances), all of which can be evaluated by analysing results from seismological surveys of earthquake tremors in the subject region of interest. The shear-wave velocity parameter vs,30 may also be used to characterise the condition of a soil site. Representative values of parameters based on recommendations for Hong Kong conditions by Mak et al. (2004) are summarised in Table 1. The notations used here are defined and explained in Lam et al. (2000a). Based on the available input parameters, CAM has been used to derive the scenario-specific median response spectra for rock sites for each M-R combination with a return period of 2500 years, as shown in Figure 2.
Seismological parameters for Hong Kong.
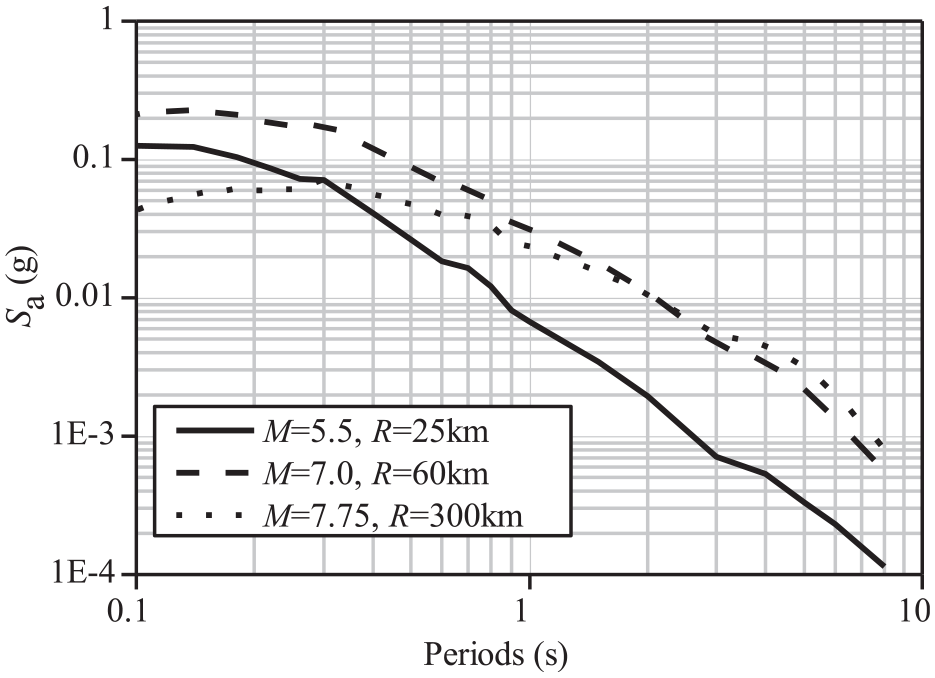
Median response spectra of dominant earthquake scenarios for rock sites based on stochastic simulations of the seismological model.
CMS
The CMS has accordingly been scaled up from the median spectrum to match with the target response spectrum UHS at the reference natural period (Baker, 2011, 2015; Baker et al., 2014), as
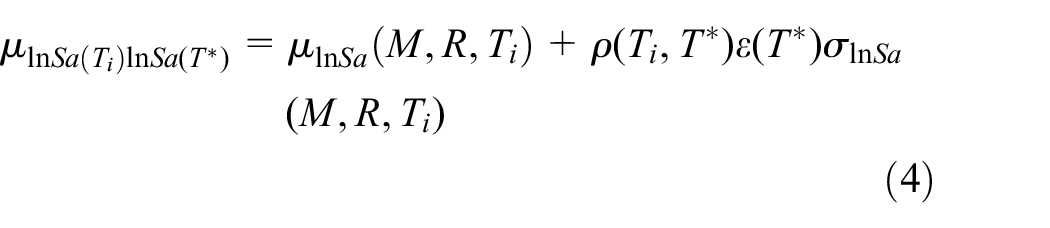
where
where
Step 1: determine
and
Step 2: compute
The value of epsilon ε at any natural period (Ti) is shown to be equal to
where
Step 3: generate CMS
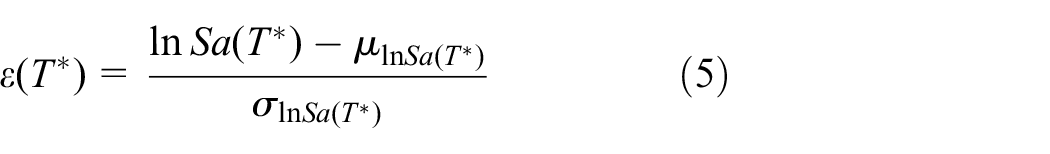
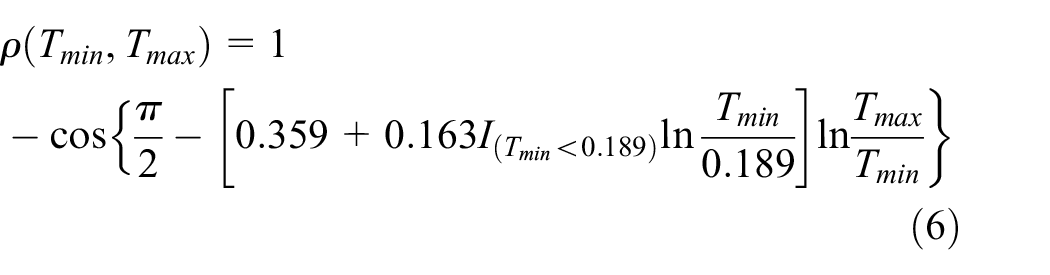
The CMS is generated based on equation (4) for all periods. Figure 3 shows the conditional mean values of spectral acceleration at all periods for the three dominant M-R combinations.
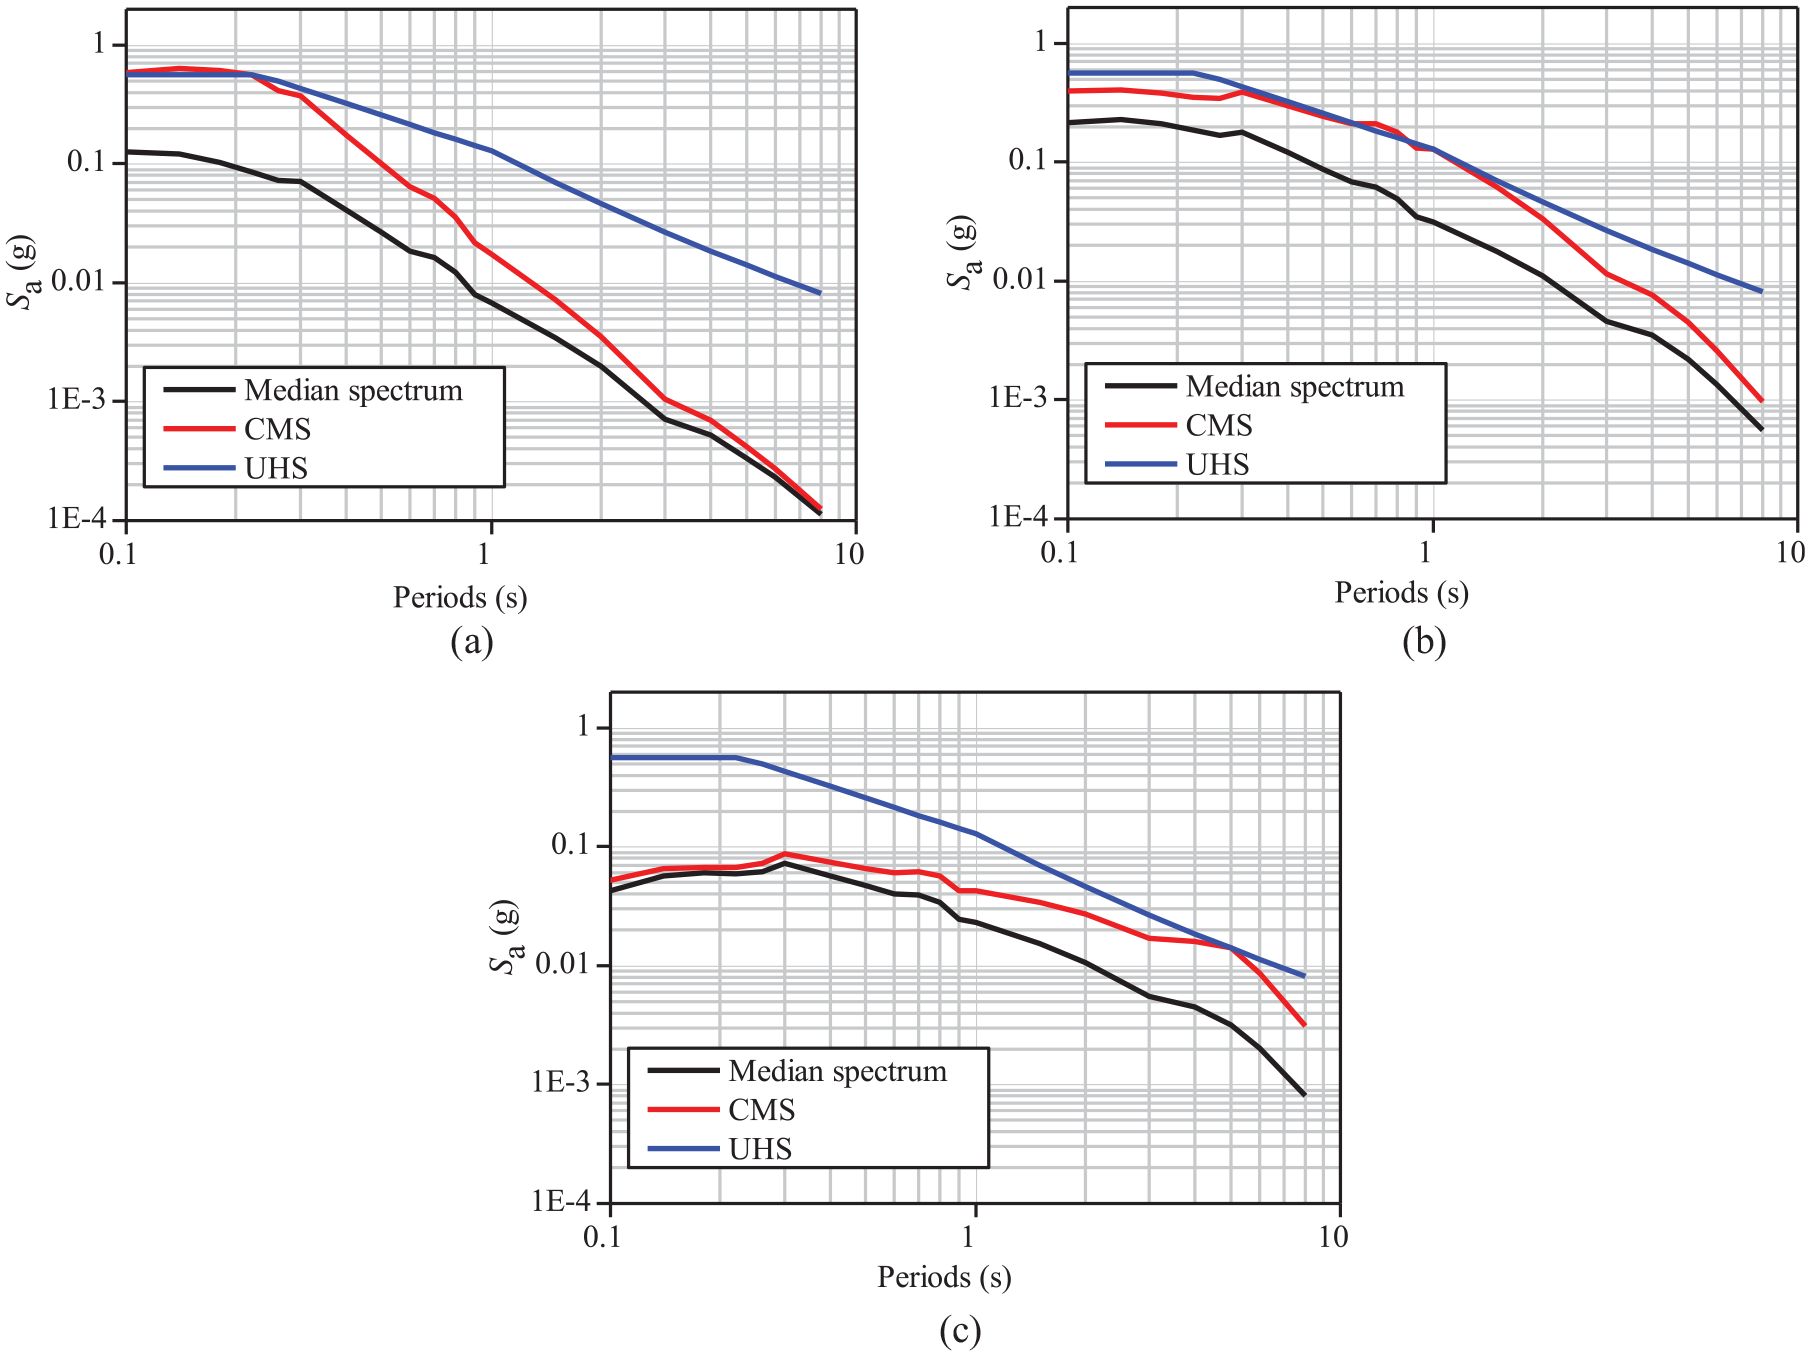
Conditional mean spectra (acceleration format) of dominant earthquake scenarios generated for specific natural periods T*: (a) M = 5.5, R = 25 km, T* = 0.2 s; (b) M = 7.0, R = 60 km, T* = 1 s; and (c) M = 7.75, R = 300 km, T* = 5 s.
Ground motion selection and scaling
Ground motion database
Recorded earthquake accelerograms are commonly used for the dynamic analysis of structures, being more realistic than spectrum-compatible artificial records. In this study, the PEER Strong Ground Motion Database has been used for selecting recorded earthquake accelerograms. It is noted that the PEER database consists of two databases: New NGA-East Ground Motion Database (NNEGMD) and New NGA-West 2 Ground Motion Database (NNW2 GMD). The former constitutes ground motions recorded in the stable continental regions, mainly from Central and Eastern North America (CENA), whereas the latter contains recordings of shallow crustal earthquakes in active tectonic regions worldwide. As Hong Kong is located within a stable continental intraplate region like CENA, it is considered appropriate to utilise NNEGMD for ground motion selection. However, NNEGMD has much fewer recordings than NNW2GMD and none or limited records can be selected from NNEGMD based on the selection criteria as discussed later. As a compromise, NNW2 GMD is used instead.
Selection criteria
The selection of recorded accelerograms is performed on the basis of spectral matching, that is, compatibility between their response spectra and the corresponding ‘target’ spectrum. As opposed to the common approach where UHS is used as discussed in section ‘General’, spectral matching in this study employs the CMS generated in the previous section. First, scaling is conducted by matching the spectral amplitude to the target spectrum with an acceptable upper limit of the scaling factor of 2 to avoid creating unrealistic ground motions. Then, the similarity between a ground-motion response spectrum and a CMS is achieved by computing a square-root-of-sum-of-squares (SRSS) spectrum for each pair of ground motions and minimising the mean squared error between the actual and target spectra (Haselton et al., 2012). Moreover, no restriction is set on the number of ground motions selected from a single earthquake, as suggested by Baker (2011).
Besides, the following important issues should also be taken into consideration in selecting accelerograms to match the target spectrum:
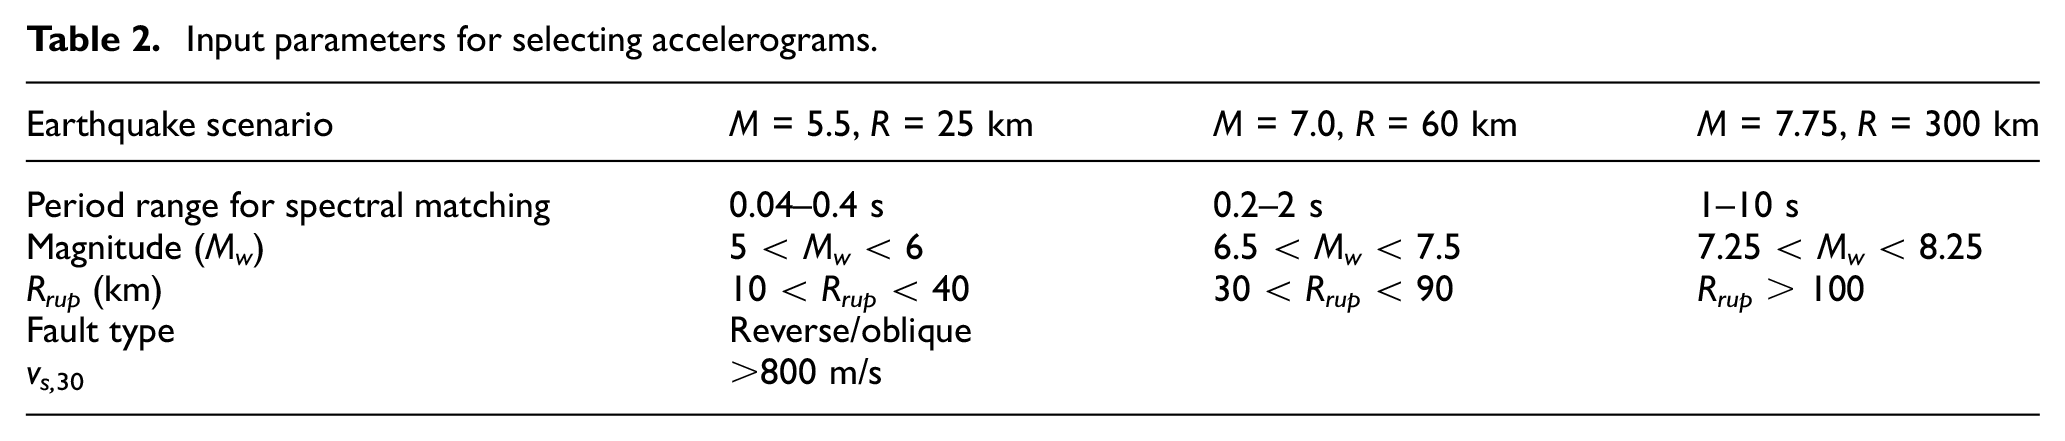
(a) The moment magnitude Mw and ruptured distance Rrup (km) from the site of interest are two common parameters related to the seismic event of a selected accelerogram. Several studies have revealed that Mw has a pronounced influence on the duration (or number of cycles) and the shape of the response spectrum (Bommer and Acevedo, 2004; Katsanos et al., 2010; Stewart et al., 2002), whereas the role of Rrup has not been well established. It is recommended that the search window for Mw should be as narrow as possible whereas the distance range could be extended in the selection of real records. In this study, a magnitude half-bin width of ±0.5 Mw is used for the magnitude of earthquake scenarios. This value is slightly higher than the value of ±0.25 Mw recommended by Stewart et al. (2002) or Bommer and Acevedo (2004), as a compromise has to be made for selecting sufficient recordings from the PEER database. The distance range for each earthquake scenario is associated with those suggested by Arup (2015) and Pappin et al. (2015). In particular, the minimum value of 10 km is set as all faults within 10 km from Hong Kong are considered inactive (Highways Department, 2013).
(b) There is a consensus that reverse/oblique faulting events produce larger amplitudes of motions than normal and strike-slip faulting ones. Therefore, the fault type is set as reverse/oblique.
(c) Given that the targeted site condition is rock, the selection excludes recordings on soft soil sites. With reference to EN 1998-1 (BSI, 2004), the average shear-wave velocity of the uppermost 30 m of the earth crust (vs,30) for rock site conditions is higher than 800 m/s.
(d) Spectral matching is established between the CMS and the mean spectrum of each record set in the period range of 0.2T*–2.0T*, where T* is the reference period for each earthquake scenario according to EN 1998-1 (BSI, 2004).
Table 2 summarises the key input parameters for selecting accelerograms for Hong Kong conditions. These parameters are determined as a compromise between the desire to have ground motion properties closely matching the target properties and the limitations of the recorded strong ground motions available from the PEER database.
Input parameters for selecting accelerograms.
Recorded data sets
Based on the selection criteria, pairs of ground motion records have been selected for each earthquake scenario, as listed in Table 3. The selected numbers of pairs of ground motions are 3, 6 and 6 for earthquake scenarios M = 5.5 and R = 25 km, M = 7.0 and R = 60 km, and M = 7.75 and R = 300 km, respectively.
Details of accelerograms selected from New NGA-West 2 Ground Motion Database (https://ngawest2.berkeley.edu/) to match the target CMS.
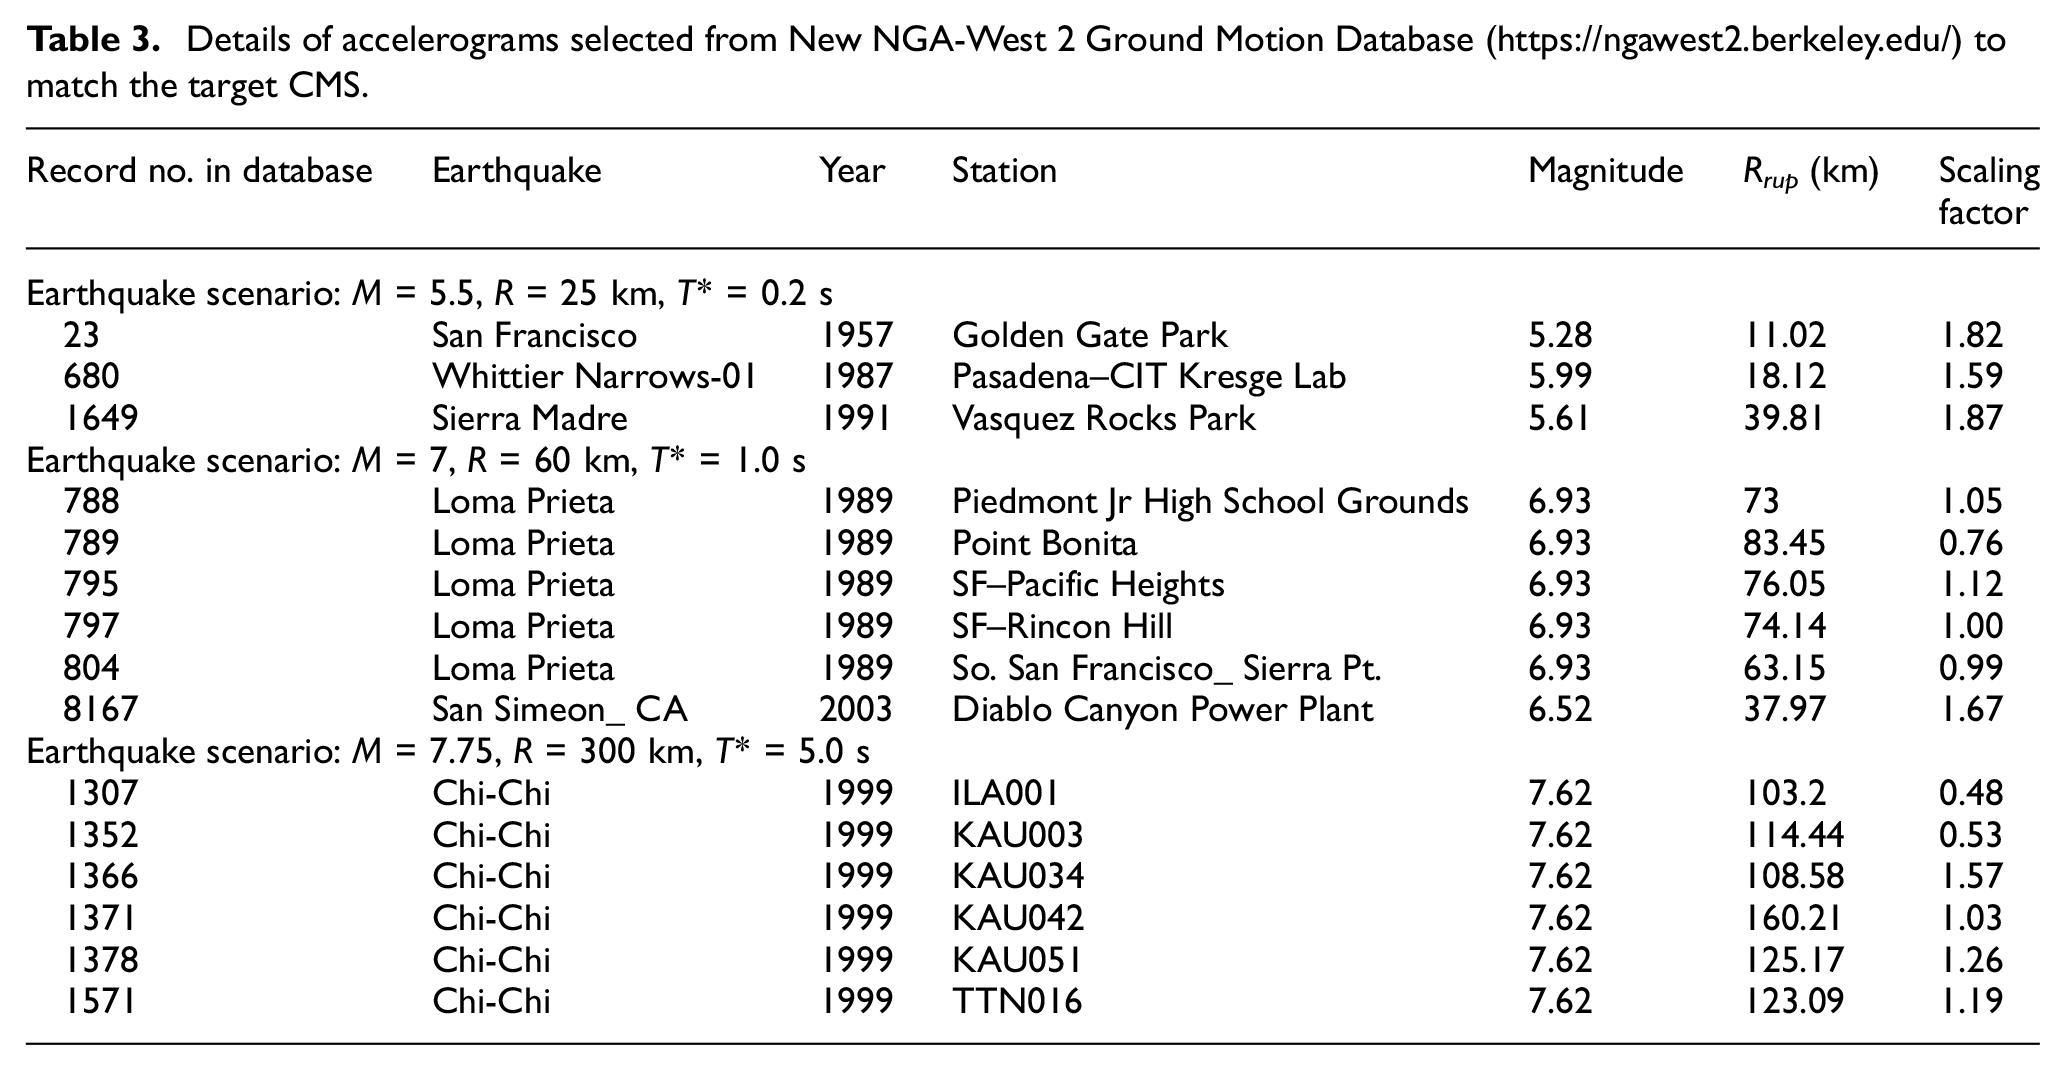
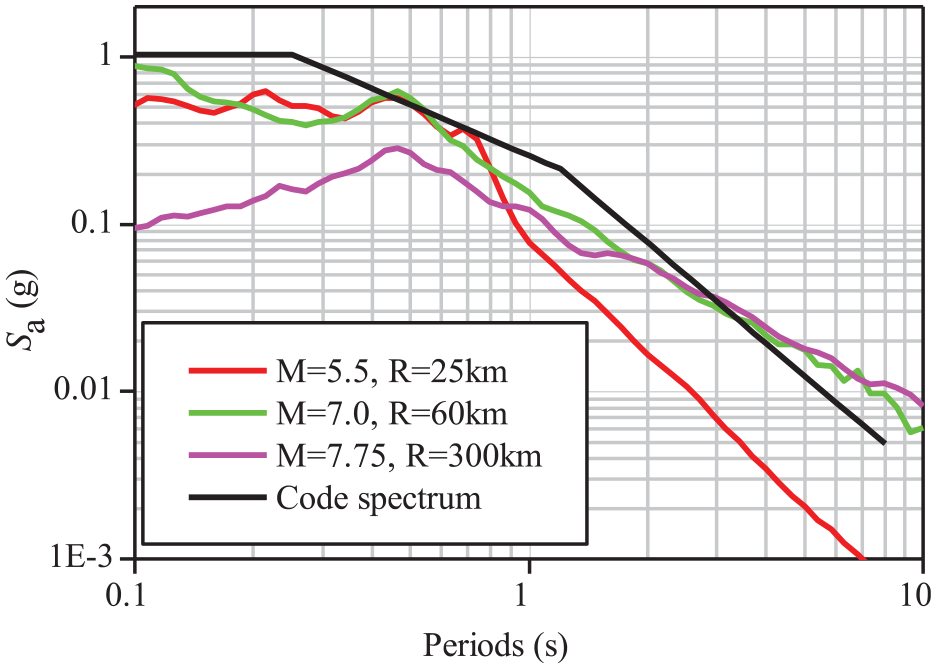
The response spectra of the selected ground motions for each earthquake scenario are shown in Figure 4(a) to (c), respectively. The SRSS spectra of the selected ground motions match closely with the target CMS in the period range of 0.2 T*–2.0 T* for spectral matching. Outside these ranges, deviation from the target CMS is unavoidable given the available ground motion library and selection criteria (Baker, 2011).
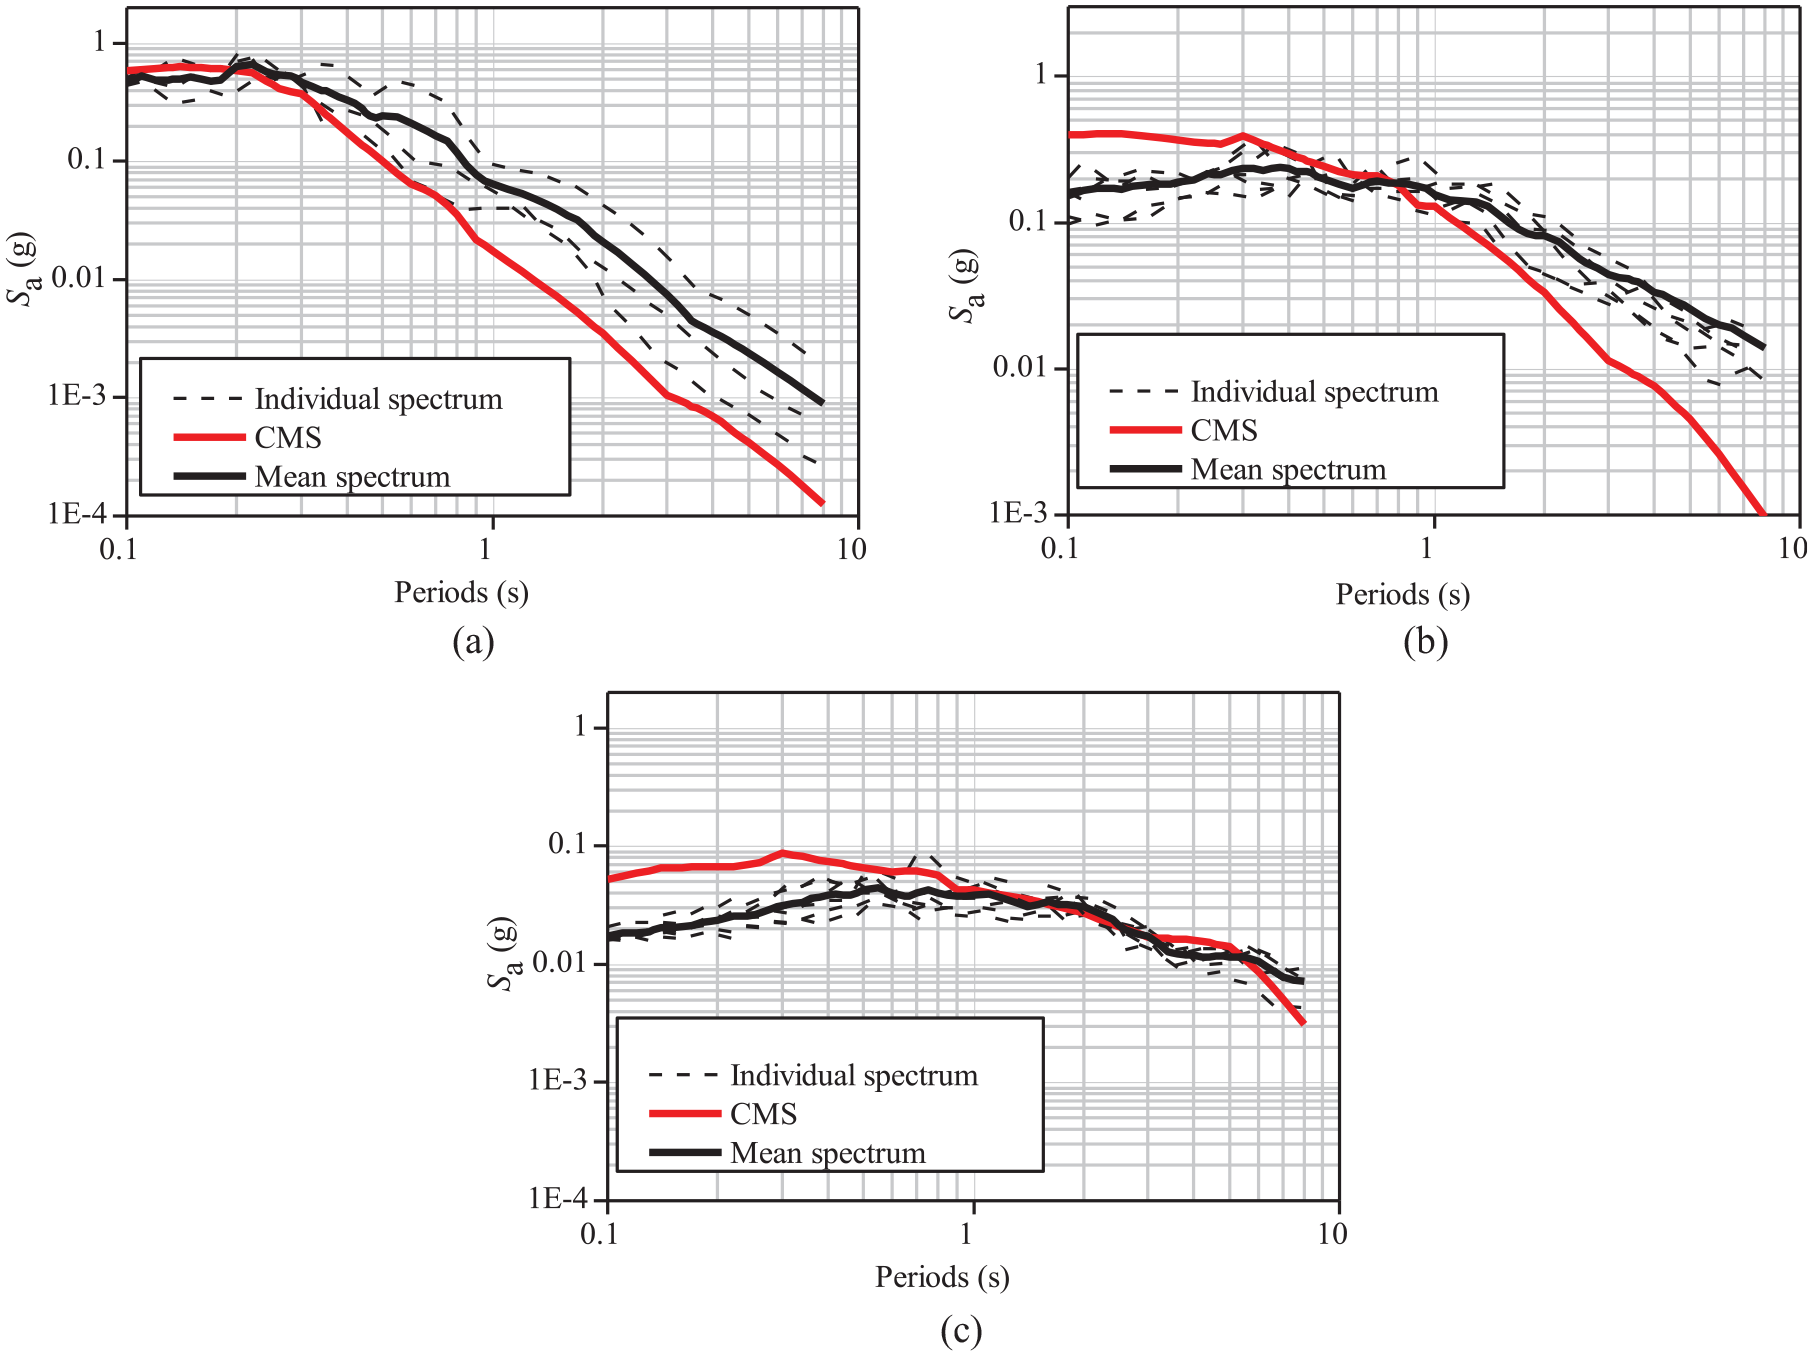
SRSS response spectra of the selected accelerograms for rock sites: (a) M = 5.5, R = 25 km, T* = 0.2 s; (b) M = 7.0, R = 60 km, T* = 1.0 s; and (c) M = 7.75, R = 300 km, T* = 5 s.
The CMS and the associated accelerograms that are presented in this article are intended for use in flat terrains including reclaimed areas. For mid-level areas, topographical effects can be significant and hence it should be taken into account (e.g. Wang et al., 2018).
CMS-compatible site-specific response spectra and accelerograms
The selected accelerogram pairs as described in the previous section can be employed for simulating ground motions on the soil surface for a range of ground types according to the definition in EN 1998-1 (BSI, 2004). This can be accomplished by performing the equivalent linear or full nonlinear site response analysis given the specified dynamic properties of different soil types in a particular site. In this study, the computer programme STRATA (Kottke and Rathje, 2008), which adopts an equivalent-linear method, is utilised to conduct dynamic site response analysis.
Recently, Arup (2018) carried out sophisticated ground investigations of North-west New Territories of Hong Kong, which consisted of standard penetration tests, in situ shear-wave velocity measurements, and field and laboratory testing. In total, 27 vertical boreholes, 59 geophysics field tests and 6 laboratory cyclic and static triaxial tests were conducted. Based on these investigations, the borehole data were collected in terms of soil types, shear-wave velocity, small-strain shear modulus versus depth, soil and rock bulk density, and so on. As an example, Figure 5 shows the soil profile of Borehole 01 extracted from Arup (2018). The dynamic properties are determined based on the available soil parameters by employing the hyperbolic skeleton curve of Hardin–Drnevich model (Hardin and Drnevich, 1972) in terms of the shear modulus reduction Gs/Gmax and damping curves, where Gs is the shear modulus and Gmax is the small strain shear modulus. Figure 6 shows the shear modulus degradation and damping ratio curves for various soil types of Borehole 01.
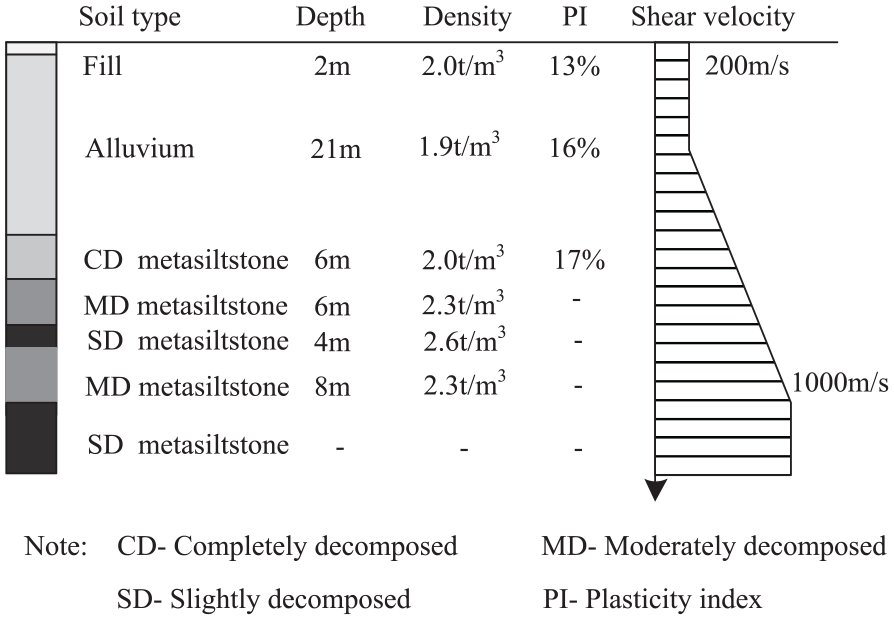
Soil profile of Borehole 01 in North-west New Territories (Arup, 2018).
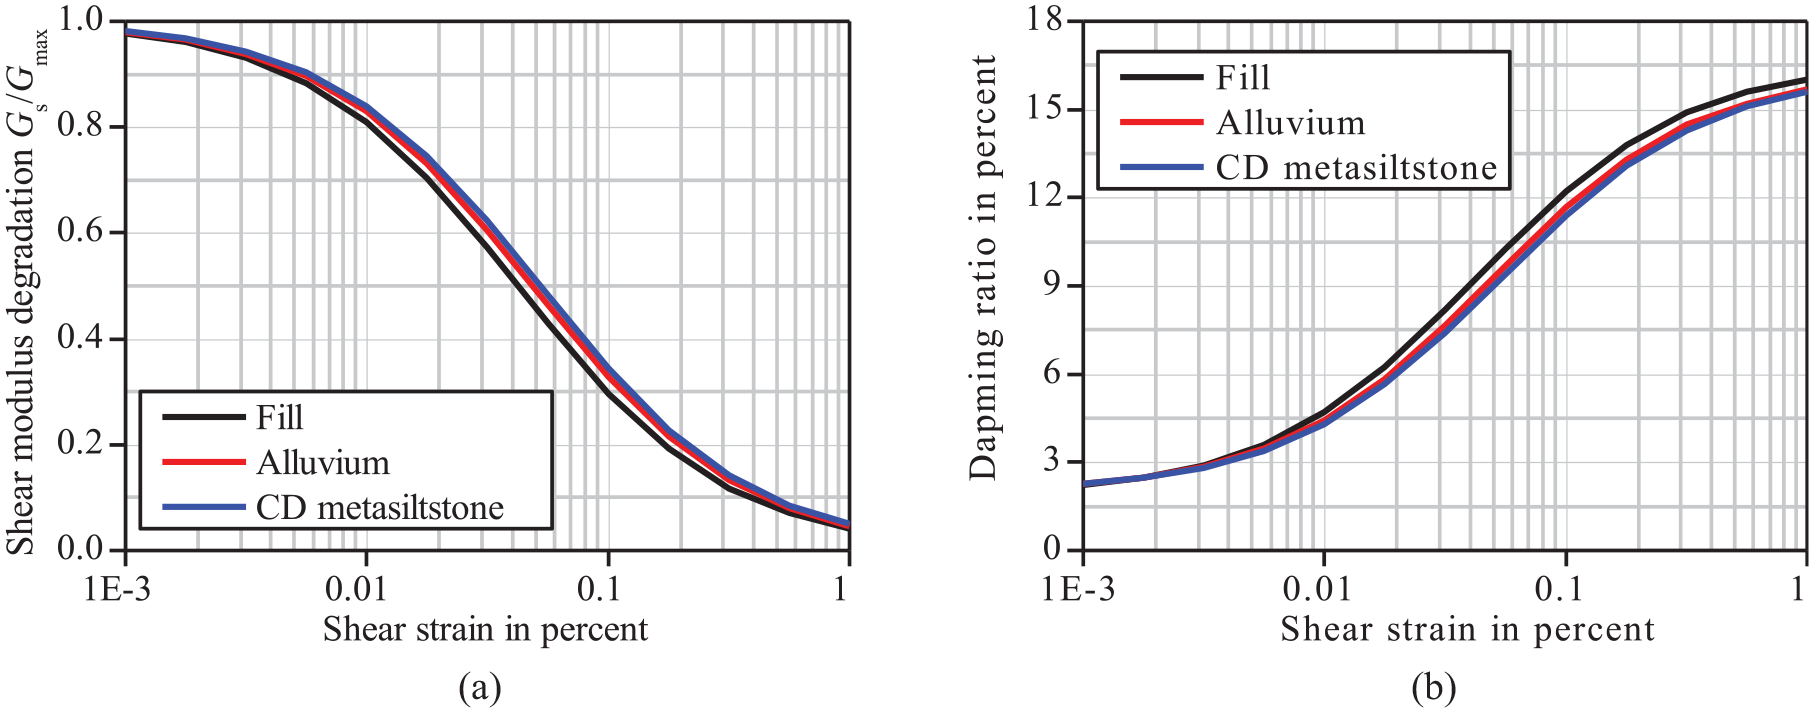
Shear modulus reduction and damping ratio curves for soil types Borehole 01: (a) shear modulus degradation and (b) damping ratio.
The hyperbolic functional form of Hardin and Drnevich (1972) was essentially used to generalise the rate of degradation of the shear modulus of the soil and the correlation of equivalent viscous damping in the soil with increasing shear strain in a unified algebraic form. What matters is the set of coefficients in the hyperbolic relationships for controlling the shape of the curves as presented in Figure 6(a) and (b). This format of characterising the rate of degradation of the shear modulus and damping in the soil has been adopted in many studies, including that by Tsang et al. (2006).
The accelerogram pairs selected in the previous section were used as inputs into the programme STRATA to simulate surface motions based on information derived from the records logged at Borehole 01. Figure 7 shows the sample acceleration time histories generated at the ground surface, whereas Figure 8 shows the average SRSS response spectrum of the generated surface motions for each earthquake scenario in comparison with an EC8 spectrum. Note that the soil profile of Borehole 01 is identified as vs,30 = 290 m/s, which classifies the site as Ground Type C according to EN 1998-1 (BSI, 2004). Therefore, Type 2 spectrum for Ground Type C of EN 1998-1 (BSI, 2004) is selected for comparison based on a peak ground motion of 0.276g (i.e. 2.3 × 0.12g) accounting for earthquakes with a return period of 2500 years, as 0.12g is the reference peak ground acceleration for seismic design in Hong Kong corresponding to a return period of 475 years and 2.3 is the importance factor corresponding to a return period of 2500 years (Highways Department, 2013). The simulated accelerograms and the response spectra are site- and event-specific, which are more representative of the projected earthquake scenario and site conditions as compared to those derived from the methodologies stipulated in the current code.
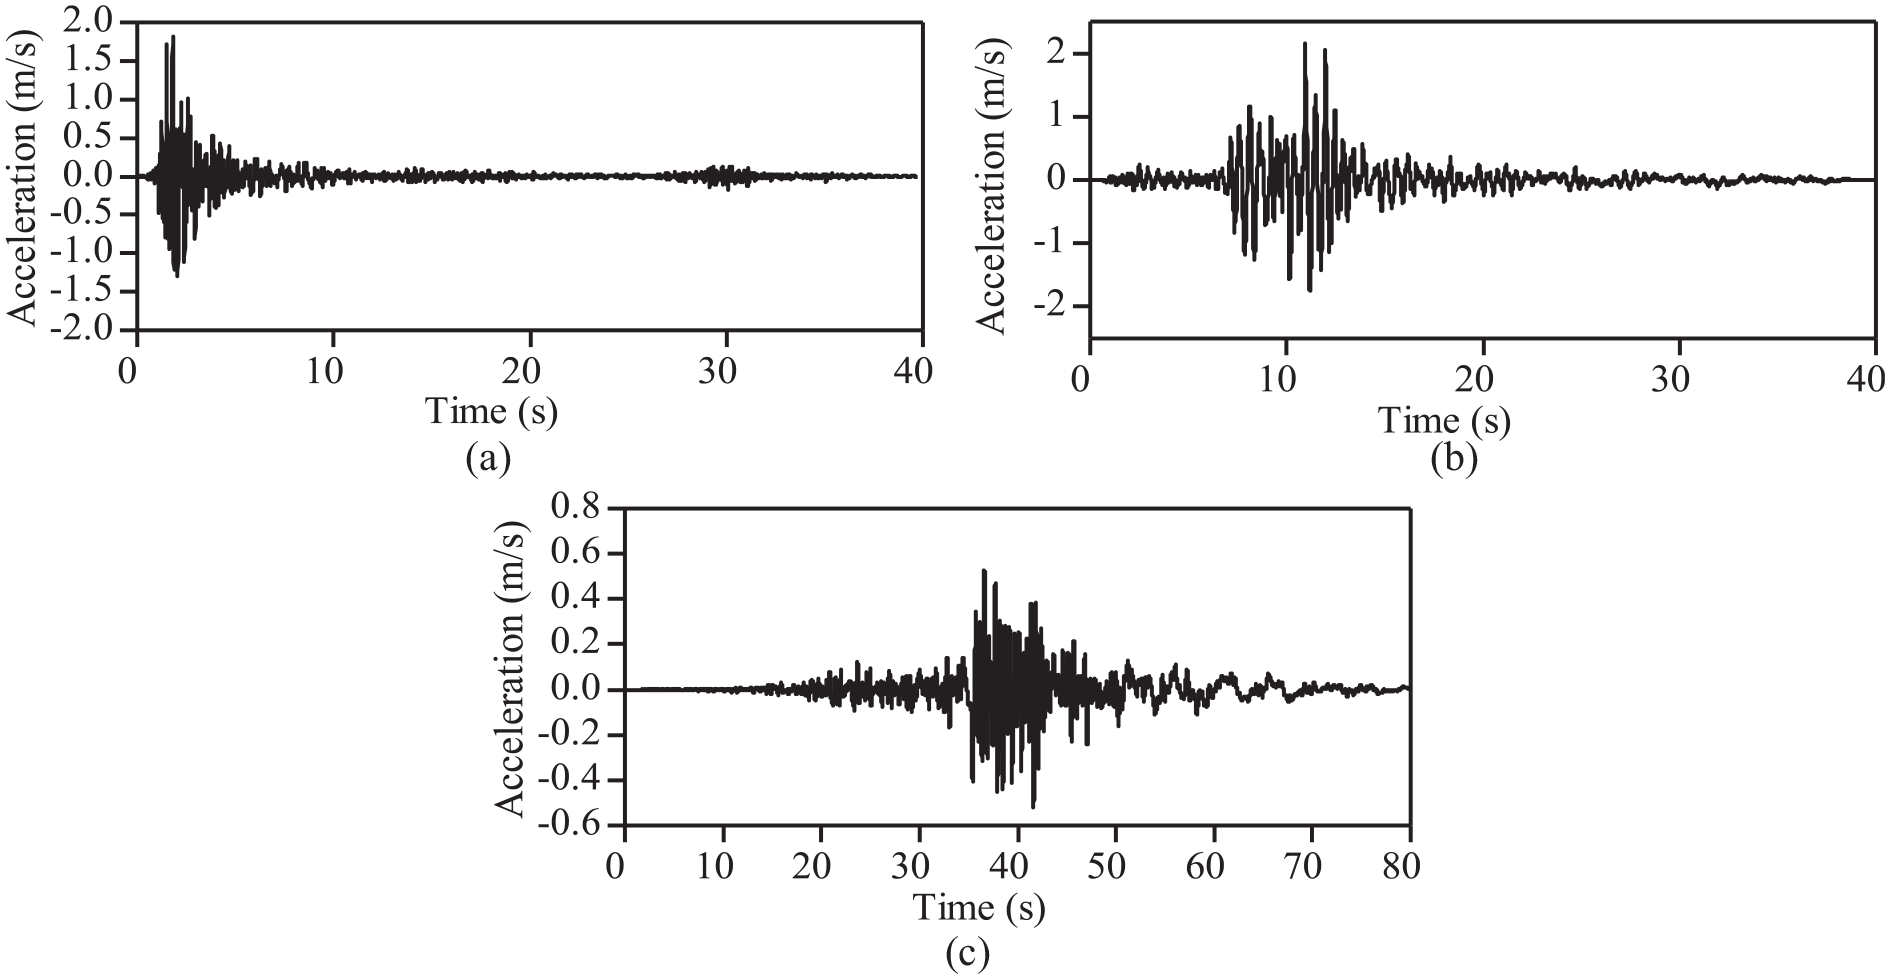
Simulated ground motions for the soil site in North-west New Territories based on CMS: (a) PEER record No. 23 for earthquake scenario: M = 5.5, R = 25 km, T* = 0.2 s; (b) PEER record No. 788 for earthquake scenario: M = 7.0, R = 60 km, T* = 1.0 s; and (c) PEER record No. 1307 for earthquake scenario: M = 7.75, R = 300 km, T* = 5.0 s.
SRSS response spectrum of the simulated ground motions for the soil site in North-west New Territories in comparison with EC8 Type 2 design spectrum for Ground Type C.
Conclusions
This study has built upon knowledge developed from years of research in the seismic hazard studies for Hong Kong culminating in the development of a UHS model for the city. Uncertainties associated with the paucity of indigenous ground motion data has also been (at least partly) resolved by the use of the CAM coupled with credible information on attenuation parameters specific to the Hong Kong conditions. Accelerograms so generated by this study for bedrock conditions will be potentially of great value for site-specific hazard studies such as the development of site-specific response spectra for given subsoil conditions. Examples of such soil surface simulations have been presented to illustrate the intended use of what has been delivered in this article. The key outcomes are listed as follows:
(a) The de-aggregation analysis in the PSHA procedure has been used to derive the following dominant earthquake scenarios for Hong Kong based on a return period of 2500 years: (1) M = 5.5 and R = 25 km for T* = 0.2 s; (2) M = 7.0 and R = 60 km for T* = 1.0 s and (3) M = 7.75 and R = 300 km for T* = 5.0 s.
(b) The CAM has been employed for simulating median response spectra for the dominant earthquake scenarios for rock conditions.
(c) The CMS have been derived for rock conditions by scaling up the median response spectra to match with the UHS at specific natural periods.
(d) Accelerograms sourced from the PEER database have then been selected and scaled to match with the respective CMS for each of the identified dominant scenarios.
(e) Site-specific response spectra and accelerograms have been generated by site response analysis using the Programme STRATA for each dominant earthquake scenario.
Footnotes
Declaration of Conflicting Interests
The author(s) declared no potential conflicts of interest with respect to the research, authorship and/or publication of this article.
Funding
The author(s) received no financial support for the research, authorship and/or publication of this article.