
Abstract
Many studies on the strength reduction factor mainly focused on structures with the conventional hysteretic models. However, for the self-centering structure with the typical flag-shaped hysteretic behavior, the corresponding study is limited. The main purpose of this study is to investigate the strength reduction factor of the self-centering structure with flag-shaped hysteretic behavior subjected to near-fault pulse-like ground motions by the time history analysis. For this purpose, the smooth flag-shaped model based on Bouc-Wen model which can show flag-shaped hysteretic behavior is first described. The strength reduction factor spectra of the flag-shaped model are then calculated under 85 near-fault pulse-like ground motions. The influences of the ductility level, vibration period, site condition, hysteretic parameter, and hysteretic model are investigated statistically. For comparison, the strength reduction factors under ordinary ground motions are also analyzed. The results show that the strength reduction factor from near-fault pulse-like ground motions is smaller. Finally, a predictive model is proposed to estimate the strength reduction factor for the self-centering structure with the flag-shaped model under near-fault pulse-like ground motions.
Keywords
Introduction
Conventional structures are normally designed to be able to suffer large plastic deformations without collapse based on the ductility-based design concept. However, these structures may experience severe residual displacement due to the accumulation of unrecoverable deformations. The existence of residual deformation after the earthquake may seriously reduce the structure’s resistance to aftershocks, increase the cost of post-earthquake structural retrofitting and maintenance, and even require the structure to be rebuilt.
Extensive research works have been carried out to reduce the large residual displacements of structures after severe earthquakes, and many methods have been proposed (Christopoulos et al., 2008; Lu et al., 2010, 2014; Xu et al., 2018b). These methods can be generally divided into two categories. In the first category, the post-tensioned rocking columns/joints are adopted (Han et al., 2019; Li et al., 2019; Nazarimofrad and Shokrgozar, 2019). Once the column/joint deviates from its original position during a strong earthquake, the pre-stressed tendons can provide large self-centering force to the column/joint and bring it back to its initial position, so that small residual displacement is achieved. In the second category, the self-centering energy dissipation braces (SCEBs) are adopted and installed to the structure to provide self-centering force (Dong et al., 2019a; Eatherton et al., 2014; Kitayama and Constantinou, 2016a; Xu et al., 2016). The SCEB system normally includes an energy dissipation group to provide stable energy dissipation capability and a self-centering group to help the structure to return to its original position. During a severe earthquake, the brace yields before the structure yielding so that most of the seismic energy is dissipated by the SCEB system and the key structure remains elastic or only experiences minor damage. Both of the two structures have the self-centering capability that can return the structure to its initial position after earthquakes, and they are hence called the self-centering structure. These self-centering structures normally exhibit typical flag-shaped (FS) hysteretic behavior with stable energy dissipation and excellent self-centering capacities (Araki et al., 2016; Dong et al., 2017; Xu et al., 2017, 2018a; Zhu and Zhang, 2008). Due to the excellent characteristics of self-centering structures, they are widely applied in engineering practices. Therefore, the seismic design method of such structures has attracted more and more attentions of the structural earthquake engineering community as well (Eatherton et al., 2014; Kitayama and Constantinou, 2016b; Liu et al., 2018; Qiu and Zhu, 2017a).
For the current seismic design codes, the conventional design spectrum of elastic single-degree-of-freedom (SDOF) structural systems is adopted to estimate the design forces or displacements of the system with specified period and damping in the structural design procedure (ASCE, 2005; Eurocode 8, 2003; GB 50011, 2010; Japan Road Association, 2002). Because structures may enter the plastic stage under strong earthquakes (Hatzigeorgiou and Beskos, 2009; Hatzigeorgiou and Liolios, 2010), the inelastic design spectrum is required for nonlinear seismically resistant structures in seismic design. The inelastic design spectrum is conventionally obtained by scaling down the elastic design spectrum through the strength reduction factor
The present study aims to investigate the strength reduction factor for self-centering structures with the FS model under near-fault pulse-like ground motions based on the nonlinear dynamic analysis of a single degree of freedom (SDOF) system. Here, the near-fault pulse-like ground motions consider soil and rock sites, and the target ductility factors of the self-centering structure are from 2.0 to 10. To highlight the characteristics of the strength reduction factor for the FS model, the Bouc-Wen model is also analyzed. Moreover, the effects of the hysteresis parameters of the FS model including post-yielding stiffness ratio and energy dissipation ratio are investigated statistically. Comparisons of the strength reduction factor between the near-fault pulse-like ground motions and ordinary motions are also carried out. Finally, based on the statistical results, the predictive model of the strength reduction factor for the self-centering structure under near-fault pulse-like ground motions is presented and verified.
Analytical method
The proposed self-centering structure normally consists of two systems: the energy dissipation system and the self-centering system. The self-centering structure can be regarded as the self-centering system and the energy dissipation system assembled in parallel. Figure 1(a) shows the mass-spring-dashpot idealization of the self-centering structure. In this figure,
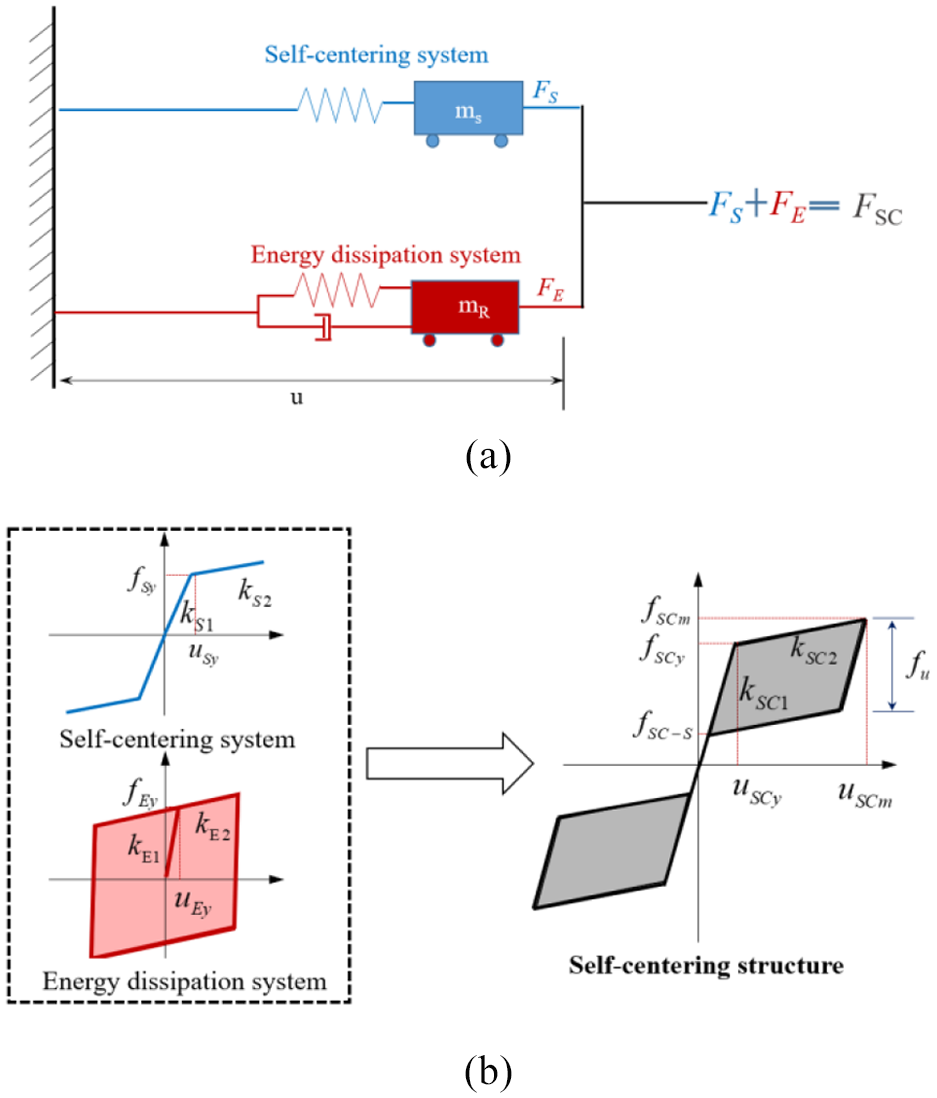
The self-centering structure: (a) mass-spring-dashpot idealization; (b) simplified hysteretic model.
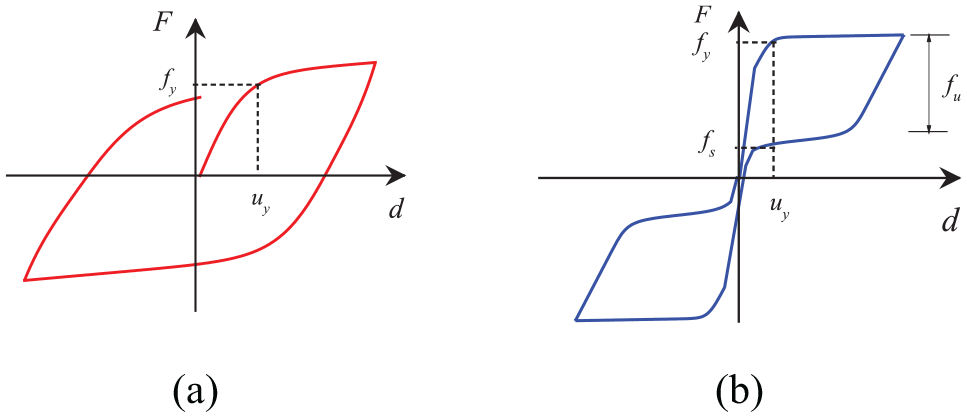
Many previous studies (Dong et al., 2017; Erochko et al., 2014) indicated that the self-centering structure shows the FS hysteretic behavior with the excellent self-centering capability. Figure 1(b) gives the simplified hysteretic model of the self-centering structure. The hysteretic behavior of the self-centering structure is the superposition of those of the energy dissipation system and the self-centering system. In Figure 1(b),
As shown in Figure 1(b), some parameters as mentioned above can be used to determine the FS model. Two key dimensionless parameters controlling the hysteretic behavior of the self-centering structure are defined in the present study.
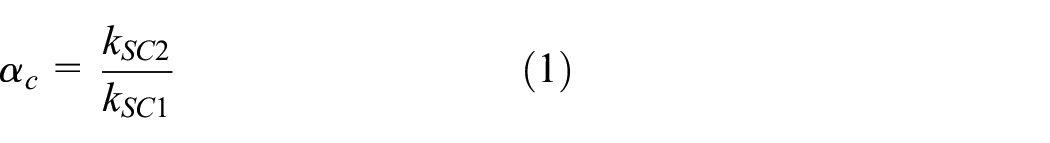
1. Post-yielding stiffness ratio
2. Energy dissipation ratio
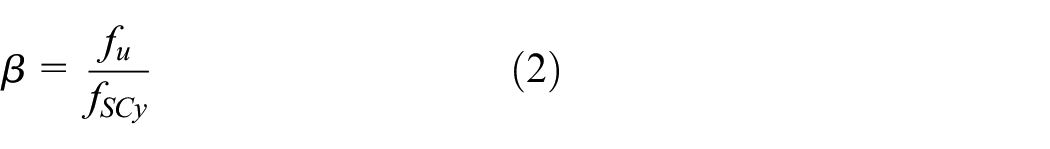
in which, the energy dissipation ratio represents the energy dissipation capability of the self-centering structure, and it also manages the self-centering ability of the structure. The energy dissipation capability gets better as the energy dissipation ratio increases, whereas the larger the energy dissipation ratio, the smaller the self-centering force
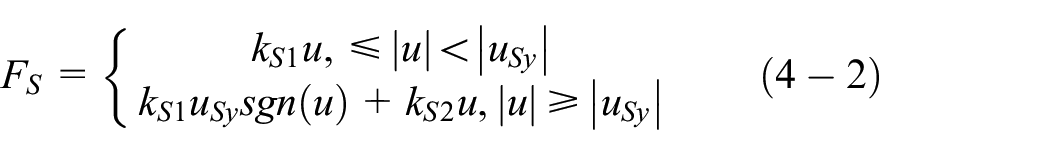
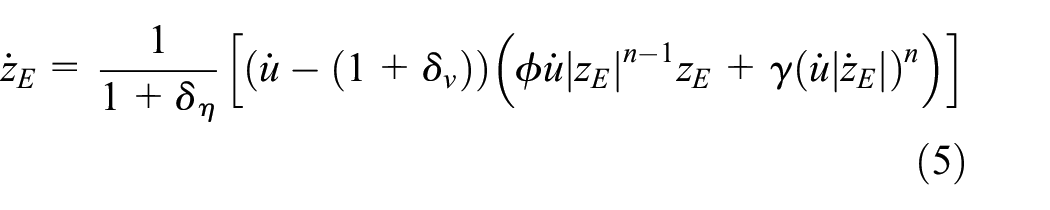
The smooth FS model based on Bouc-Wen model has been developed to predict the unique FS hysteretic behavior of the self-centering structure (Dong et al., 2019b), which is expressed as

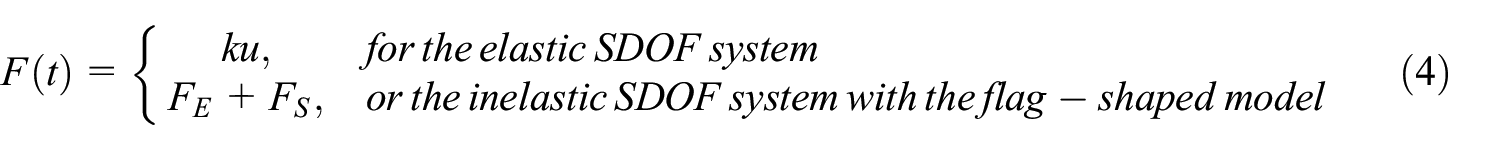
in which

where
where
(a) Bouc-Wen model; (b) smooth FS model.
The strength reduction factor is defined as the ratio of strength demand of elastic structure to the yield strength of the corresponding inelastic structure under ground motions as shown in Figure 3. The strength reduction factor can be expressed as

where
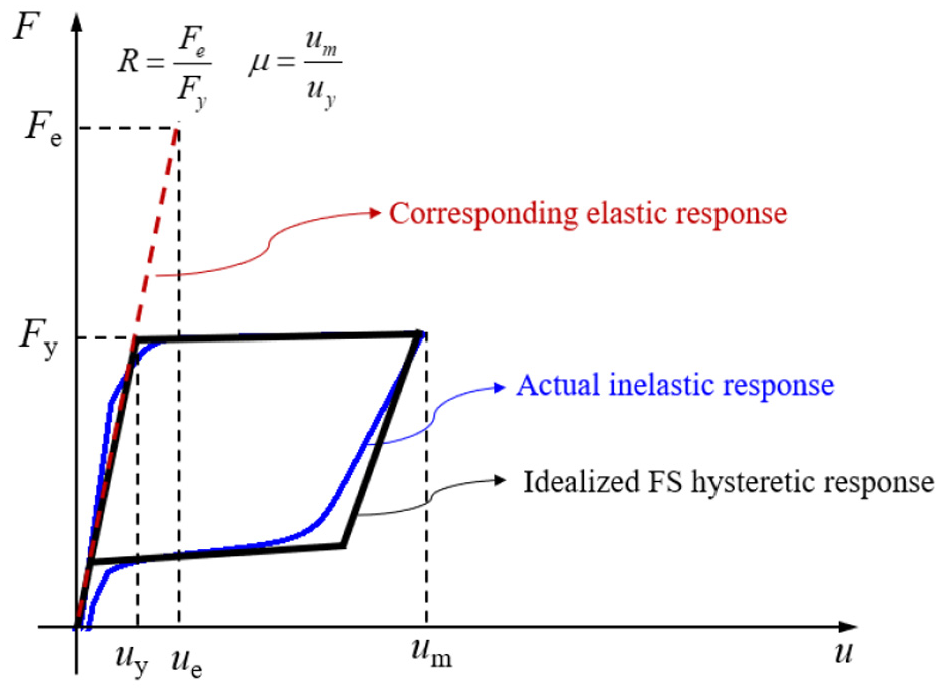
Schematic representation of the strength reduction factor and ductility factor.
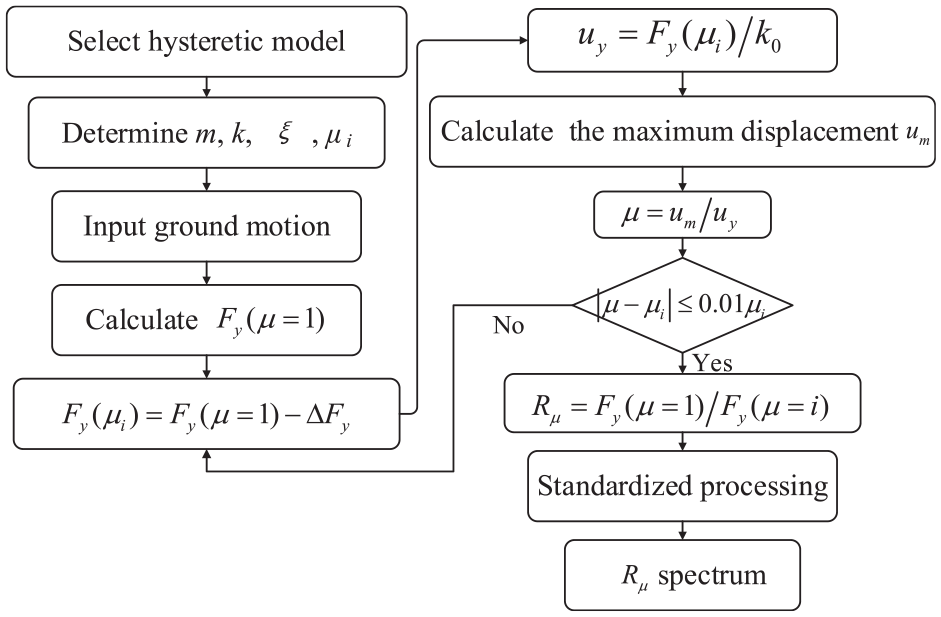
Flowchart for the strength reduction factor spectrum.
Ground motions
A set of near-fault pulse-like earthquake records from 26 different earthquake events is used as inputs in the present study. The set of records is downloaded from the NGA West II and NGA East Database. These earthquake records cover a moment magnitude range from 5.0 to 7.5 and rupture distance range from 0.0 to 19.8 km. Table 1 lists information about these records. The total sample of earthquakes can be characterized as fairly broad since it ranges in terms of shear wave velocity between 163 and 2016 m/s. According to the ground soil conditions classified by United States Geological Survey (Surhone et al., 1998), it is rock soil conditions when the shear wave velocity is larger than 360 m/s; it is soil conditions for the shear wave velocity less than 360 m/s. In the present study, 42 ground motions on rock soil conditions and 43 ground motions on soil conditions are considered.
Characteristics of selected near-fault pulse-like ground motion records.
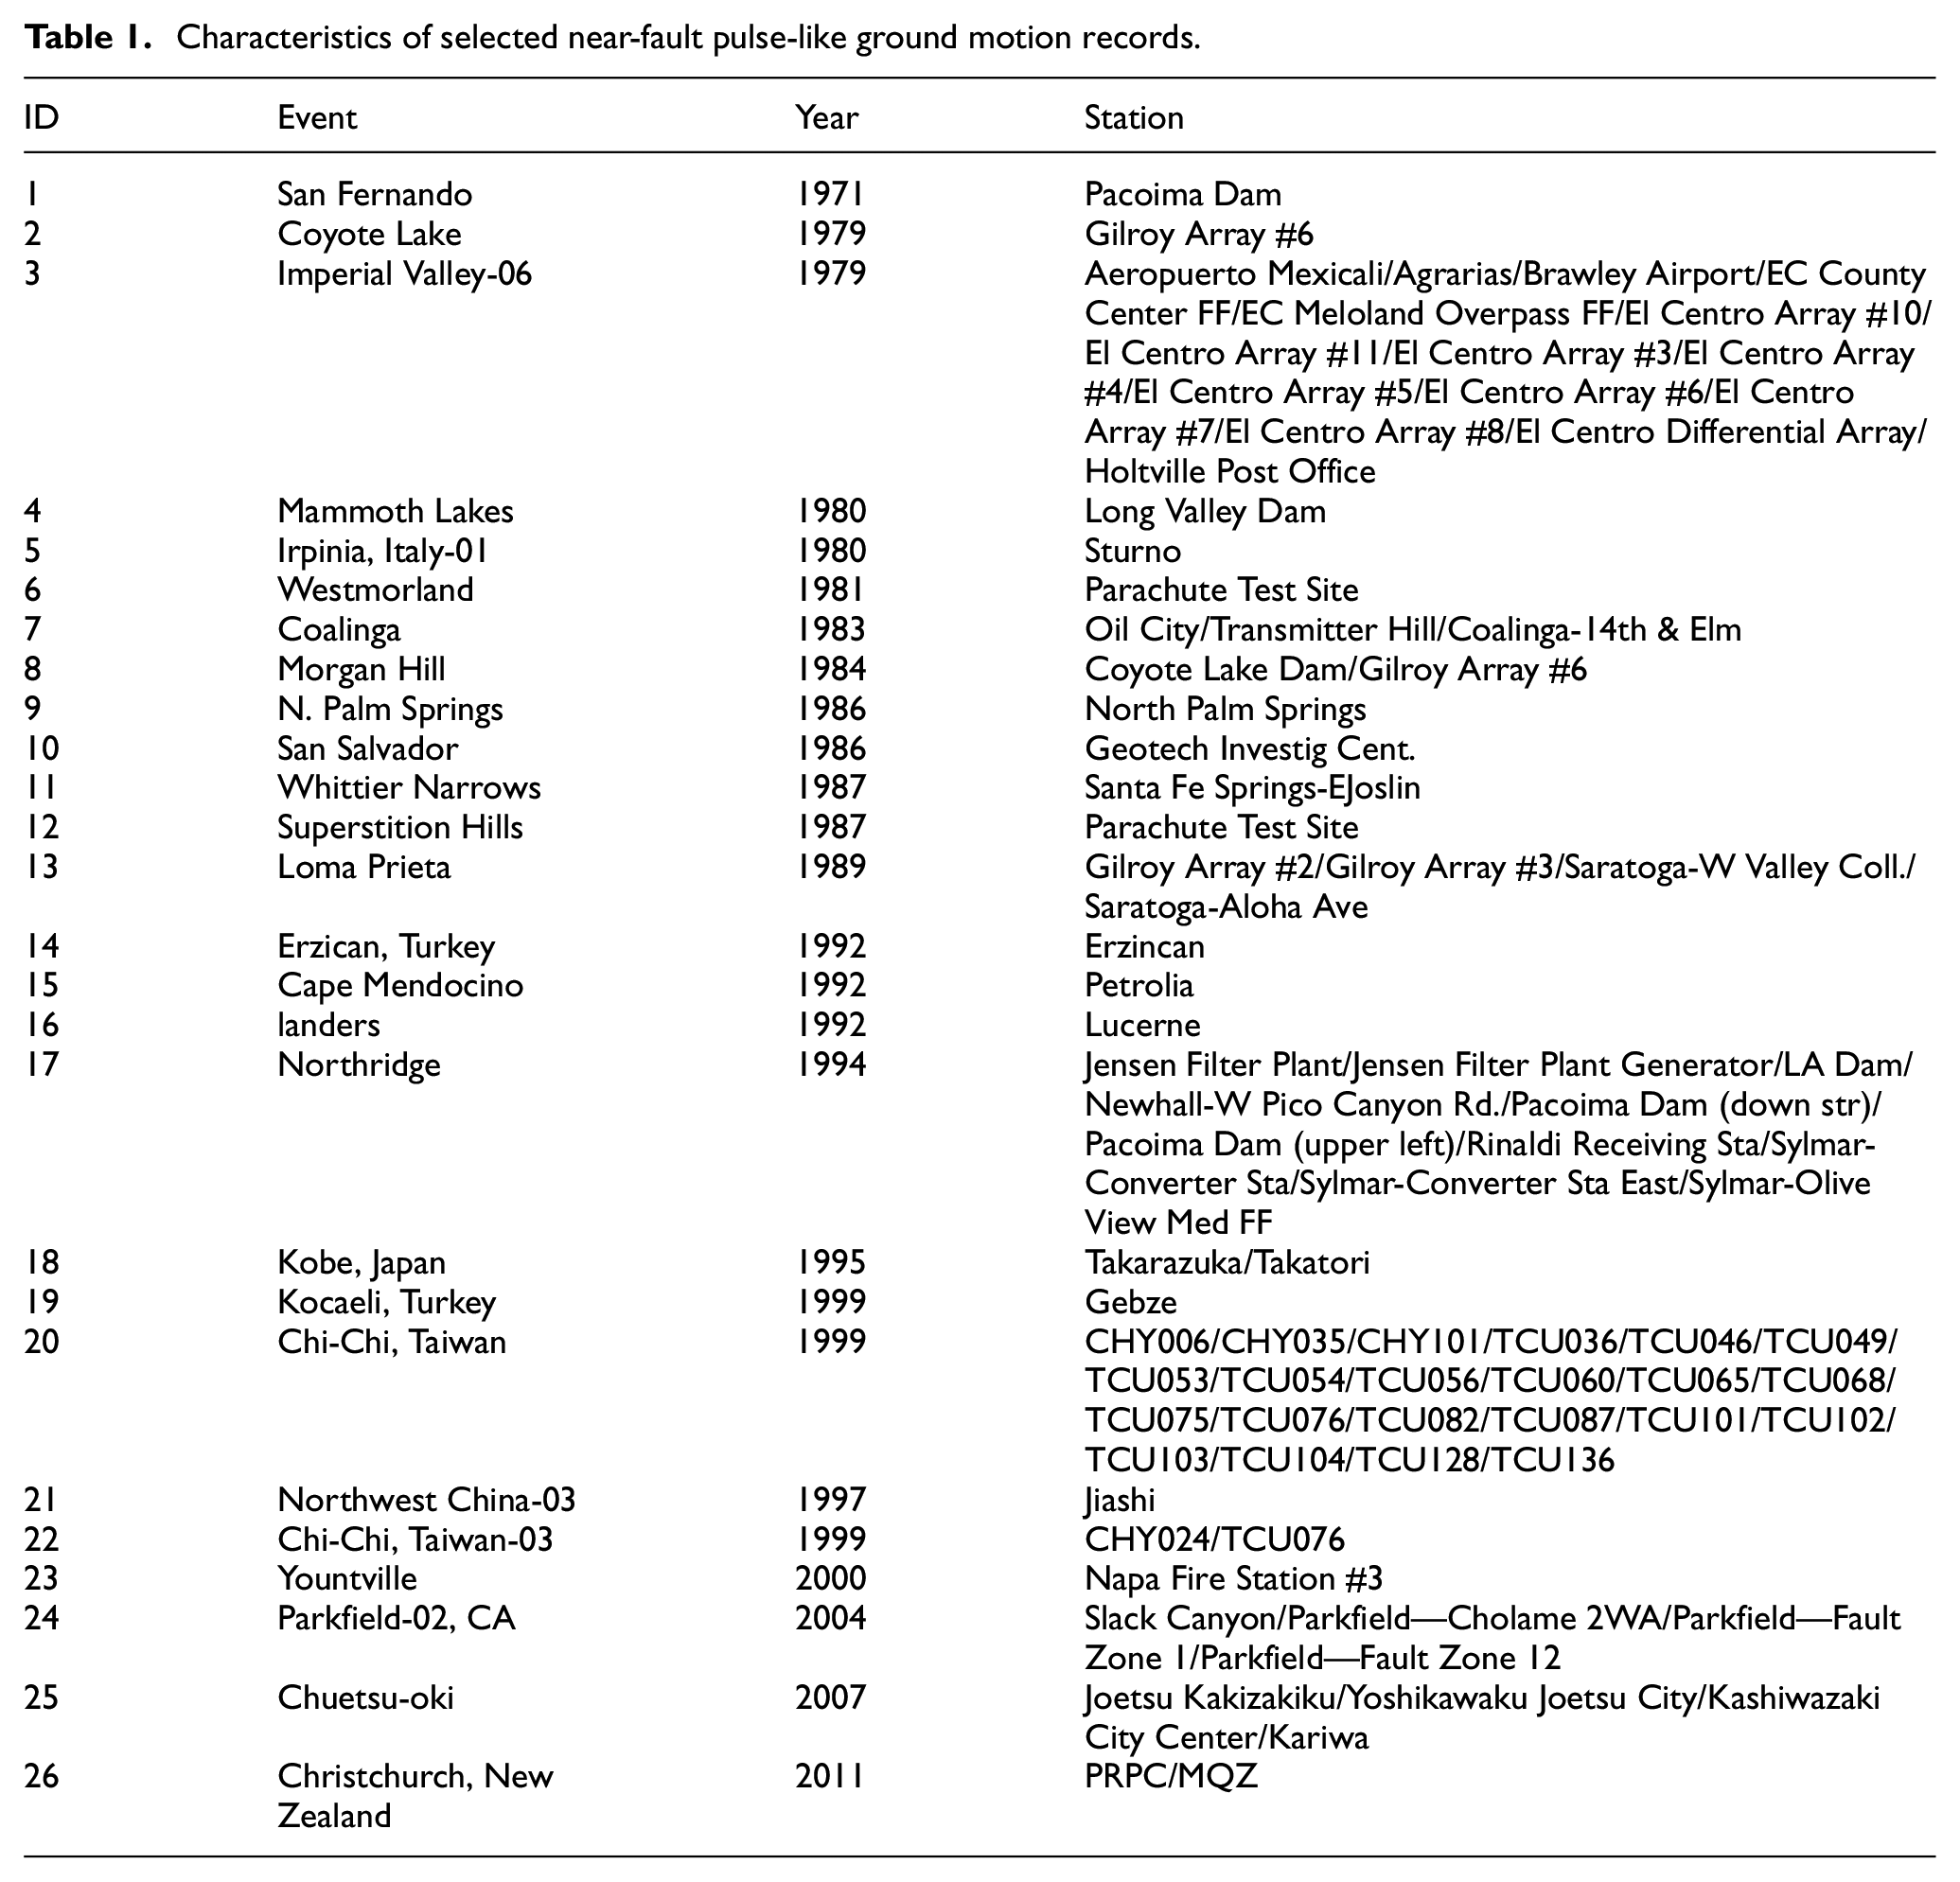
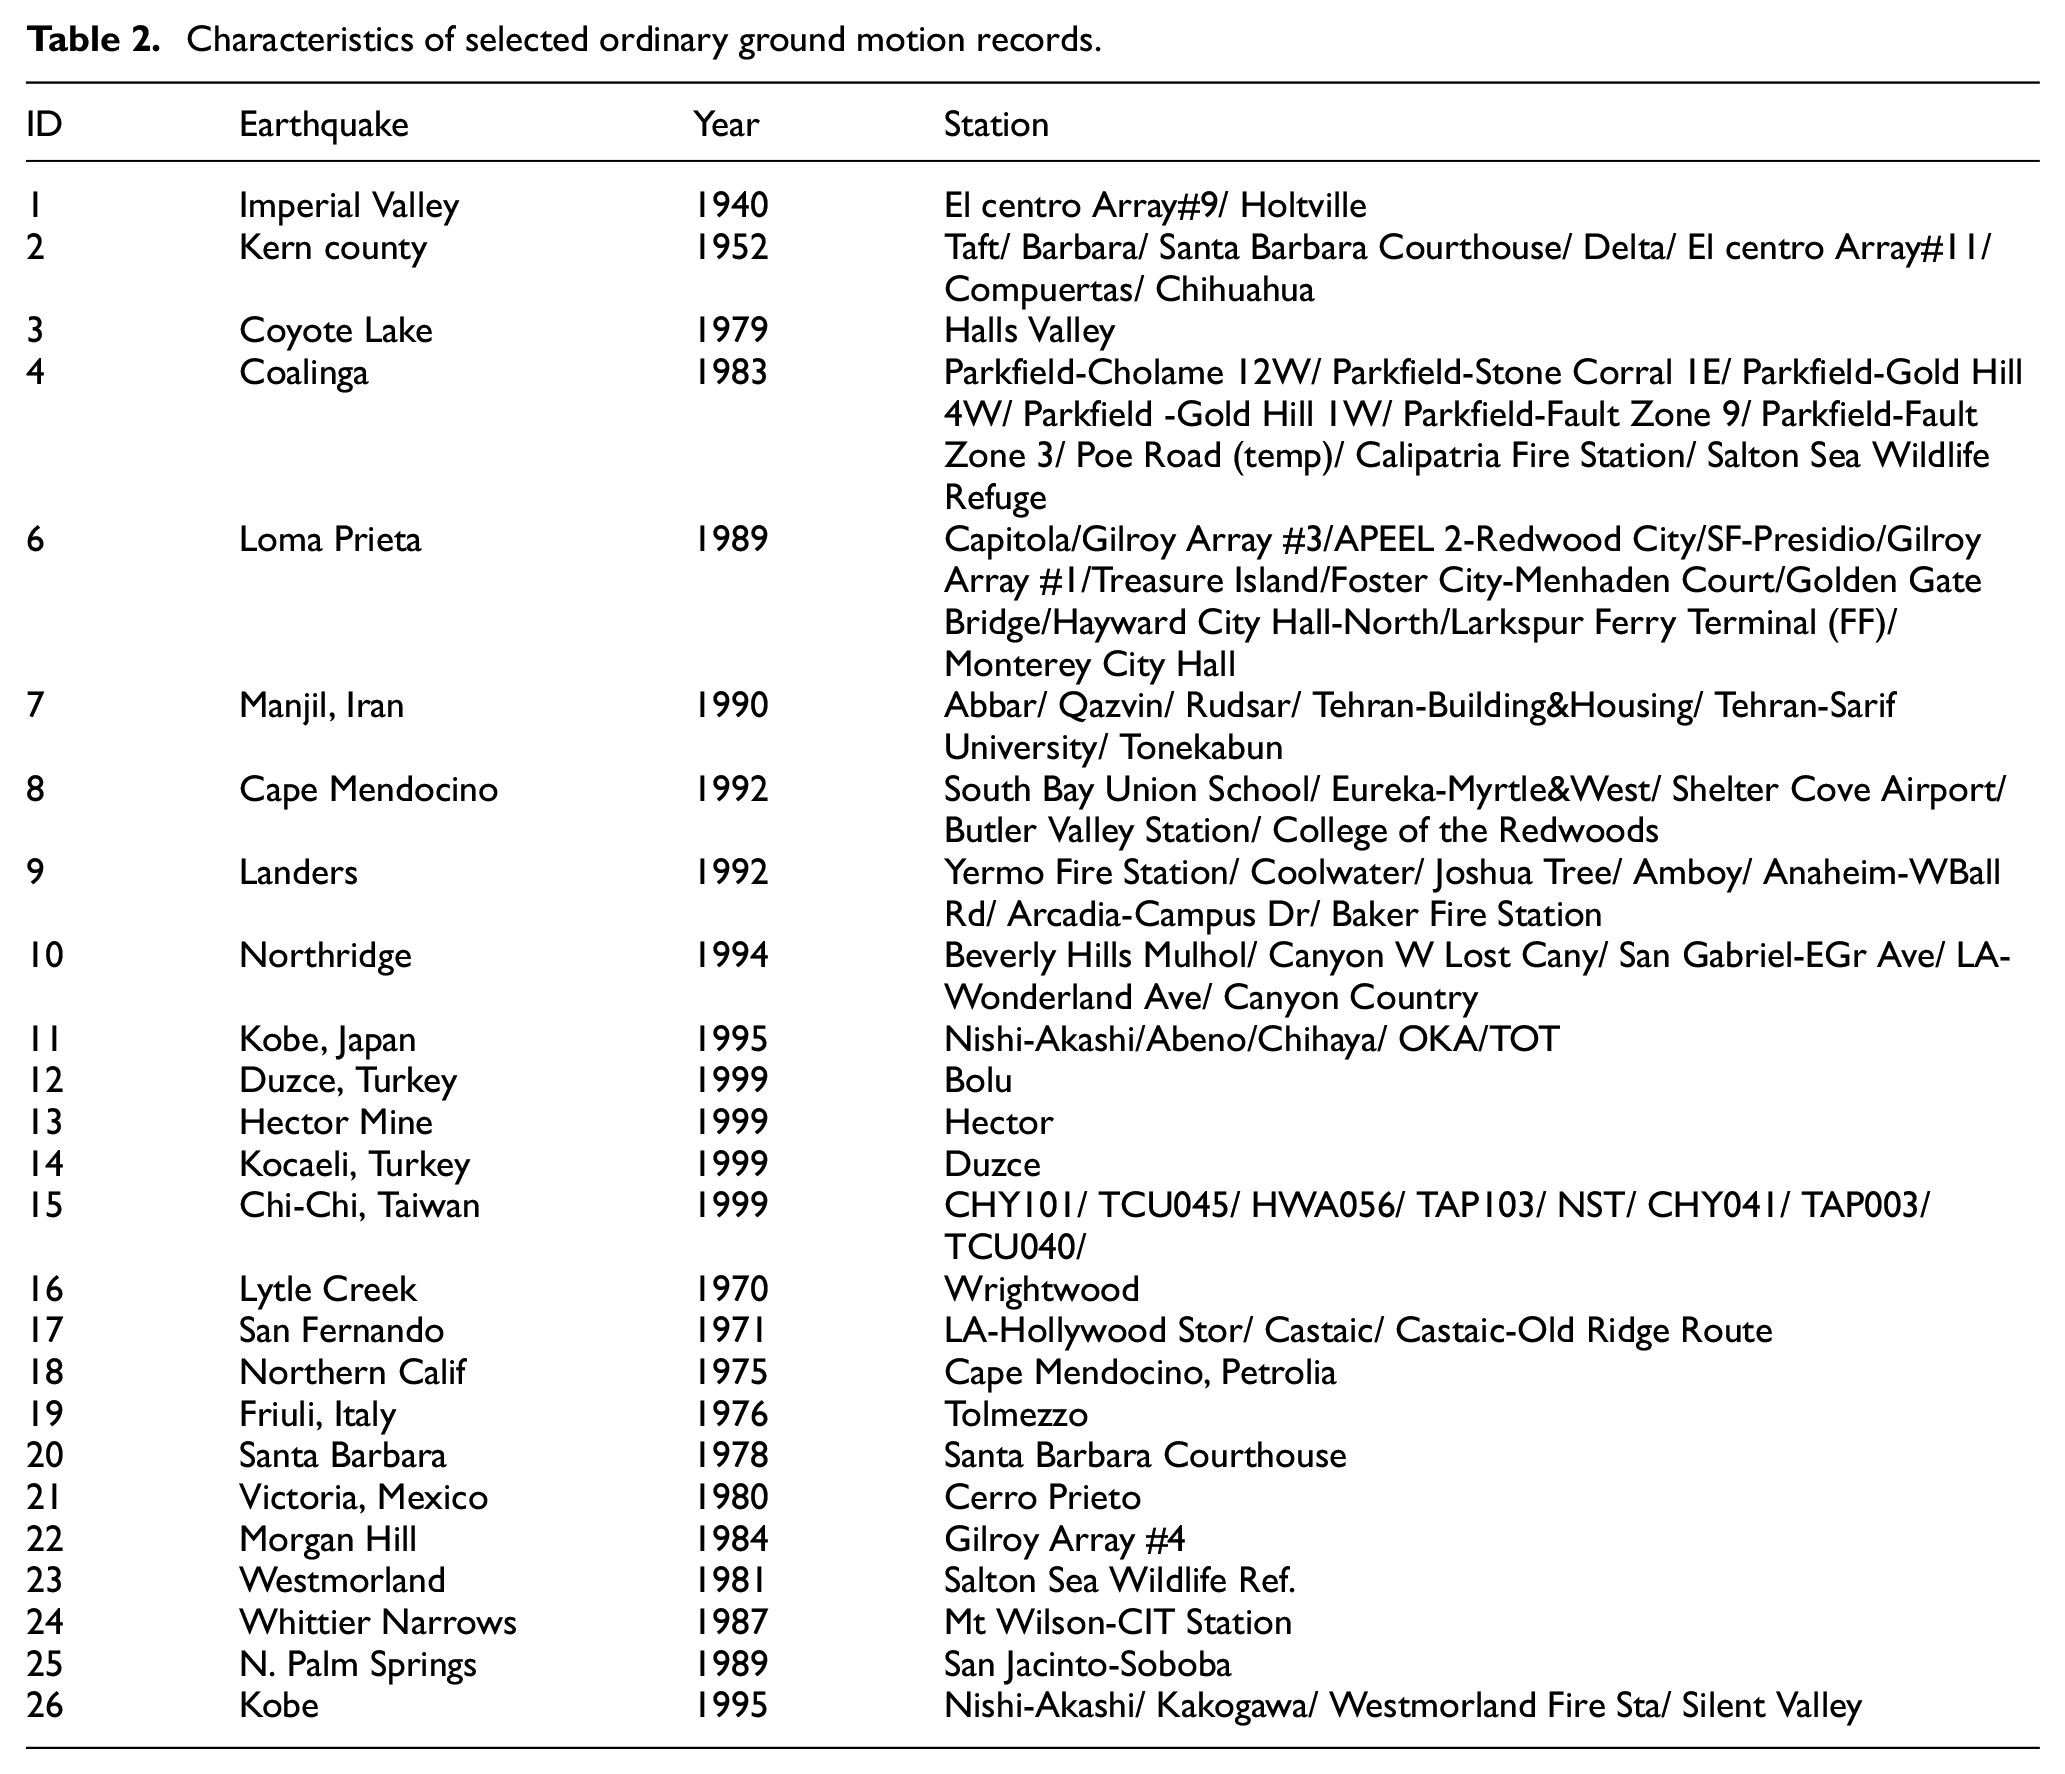
Figure 5(a) shows the acceleration, velocity, and displacement time history curves of the near-fault pulse-like ground motion (i.e., Rinaldi, Northridge earthquake). As shown, this ground motion record displays an obvious large long period pulse in the acceleration history with a similar pulse in the velocity and displacement histories. However, such a significant characteristic does not exist in some other ground motion records, for example, the Imperial Valley record obtained from El Centro #9, 1940 as shown in Figure 5(b). To better understand the influence of the near-fault pulse-like ground motion on the strength reduction factor for the self-centering structure with the FS model, a set of ordinary ground motions without obvious large long period pulse listed in Table 2 is also used for comparison purposes.
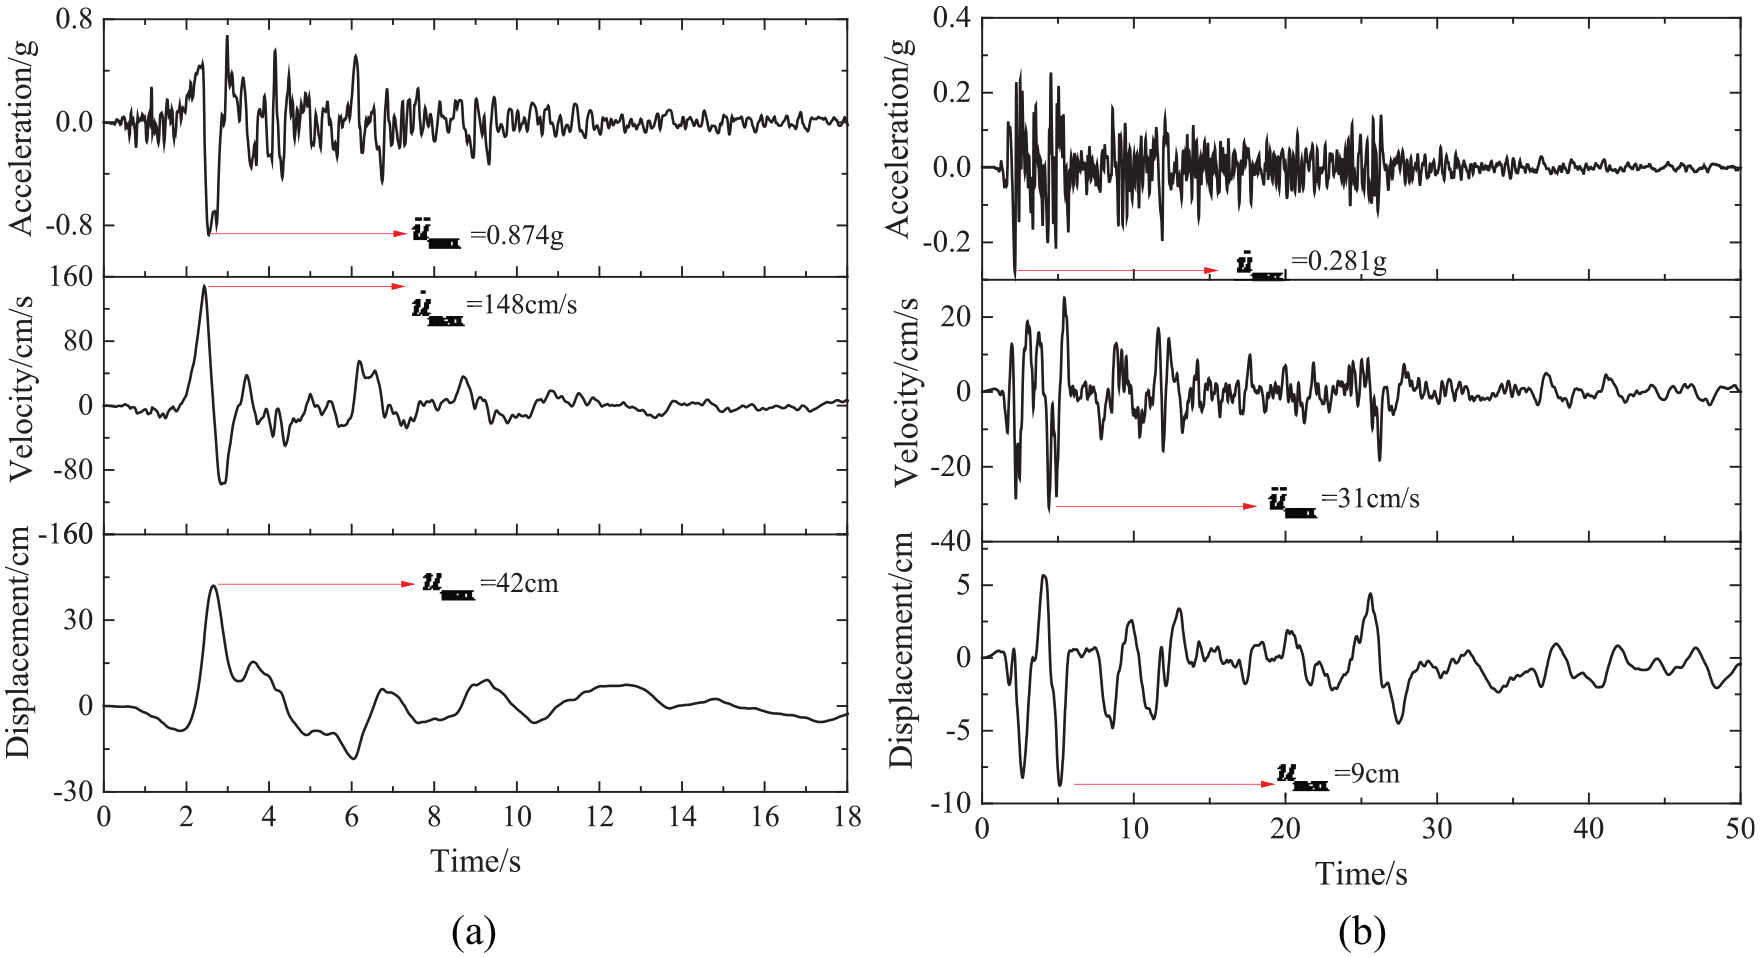
Ground motions: (a) Rinaldi, Northridge earthquake; (b) El Centro #9, 1940 Imperial Valley.
Characteristics of selected ordinary ground motion records.
Statistical analyses
In this study, the inelastic SDOF system for the self-centering structure with the FS model is used as the target system. The FS model with
Strength reduction factor of the self-centering structure with FS model on different site conditions
The strength reduction factor of the self-centering structure with the FS model subjected to 42 near-fault pulse-like ground motions on the rock site and 43 near-fault pulse-like ground motions on the soil site as shown in Table 1 are calculated. The results are, respectively, plotted in Figure 6(a) and (b). The mean value of these strength reduction factors computed by averaging results for the two sites is also discussed as shown in Figure 6(c). The values of the strength reduction factors for difference ductility levels corresponding to the formulation by Newmark and Hall (1982) are included in these figures as a benchmark. It should be noted that the shape of the strength reduction factor provided in the research report by Jalali and Trifunac (2008) is different from that in this study. In the research report, they adopt a simplified approach and model the near-fault motions by smooth pulses. The results indicate that the strength reduction factor for the near-fault pulse-like ground motions is quite different from that for a simplified approach by smooth pulses.
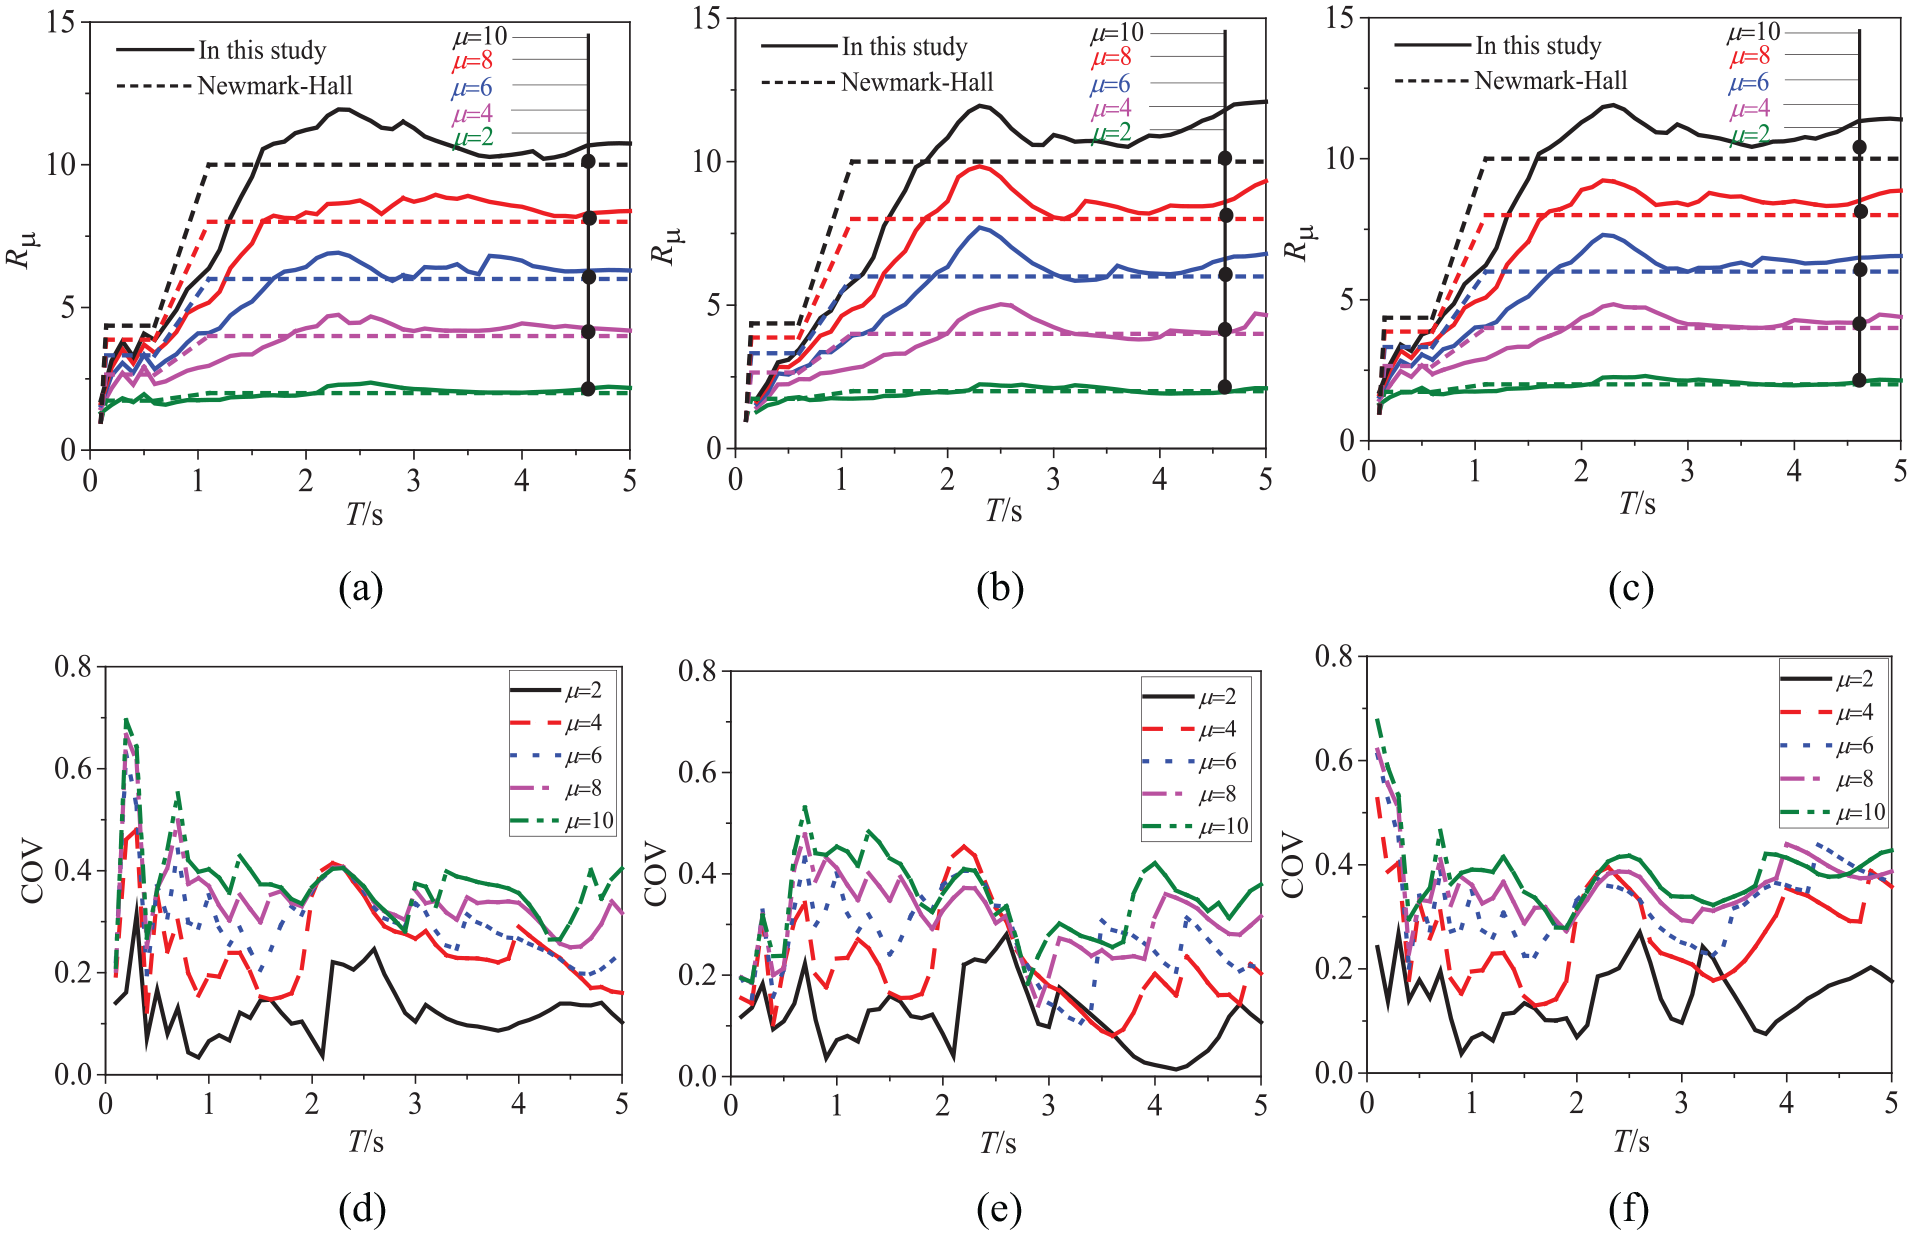
Strength reduction factors for the self-centering structure under near-fault pulse-like ground motions: (a) mean values on rock site; (b) mean values on soft site; (c) mean values on rock site and soft site; (d) COVs on rock site; (e) COVs on soft site; (f) COVs on rock site and soft site.
As shown in Figure 6, the strength reduction factor of the FS model is affected by the displacement ductility level, vibration period, and site condition. It is obvious that the displacement ductility factor is the most important factor determining the strength reduction factor for the FS model. During the period less than 5.0 s, the strength reduction factor for the self-centering structure increases with the increase of the ductility level. During the short-medium period region, the strength reduction factor is significantly dependent on the structural period, and it increases sharply with the increase of the period. For the long period, the effect of the period on the strength reduction factor becomes negligible. For systems with the period higher than 3.0 s, the strength reduction factor oscillates around the corresponding displacement ductility factor. Moreover, the strength reduction factor from this study shows a similar variation trend as the equations by Newmark and Hall with the increase of the vibration period or ductility level.
It is found that the strength reduction factors of the FS model on the two site conditions present a similar general trend. To further investigate the influence of the site condition on the strength reduction factor for the FS model, the ratios of the strength reduction factors for the FS model between different sites and all sites are calculated and shown in Figure 7. During the short period region, the ratio is larger than 1.0 for rock site, and the maximum value reaches 1.17. It means that the strength reduction factor of the FS model on all site conditions would underestimate that on rock site. For the medium-long period region, the ratios for rock site and soft site are both small and within the interval [0.93, 1.07]. The results mean that the strength demand of the FS model on rock site tends to be smaller than that on soft site for the short period. The result is reasonable. This is because the displacement response of the structure with the short period on rock site is generally smaller than that on soft site. Moreover, the ratio is not dependent on the ductility level. All these observations indicate that the effect of the site condition on the strength demand of the FS model is not significant.
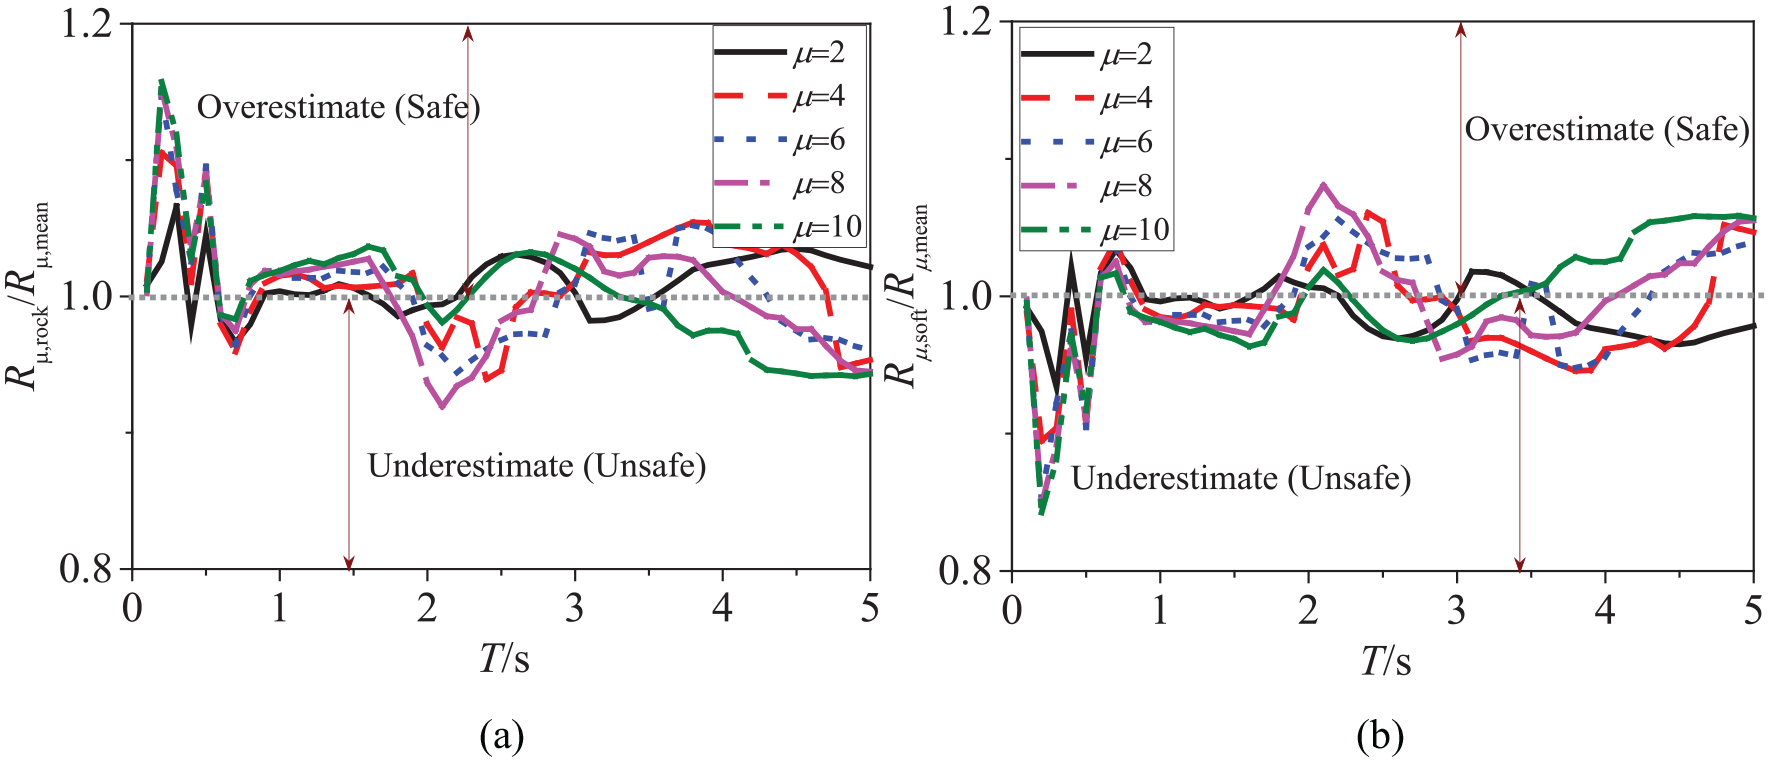
The ratio of strength reduction factors for the FS model between different sites and all sites: (a) rock site; (b) soft site.
In this analysis, the coefficient of variation (COV) is used to evaluate the dispersion of the strength reduction factor for the FS model under near-fault pulse-like ground motions. The COV is defined as the ratio of the standard deviation to the mean. Figure 6(d) to (f) shows the COVs of the strength reduction factor for the FS model on two site conditions. In general, the COVs of the strength reduction factor for the two site conditions show a similar trend. However, they present different trends during the short period region. For the short period region, the COV on rock site is large and reaches to be 0.7, while the COV on soil site is small. For the medium and long period regions, the COVs are within the interval [0.0, 0.5]. Moreover, it is found that the COVs are relatively sensitive to the displacement ductility factor and increase with the increase of the displacement ductility level. For example, the COVs are about 10% for
Influence of hysteretic models
To highlight the influence of the FS model on the strength reduction factor, the ratio of the strength reduction factor between the FS model and the Bouc-Wen model, denoted as
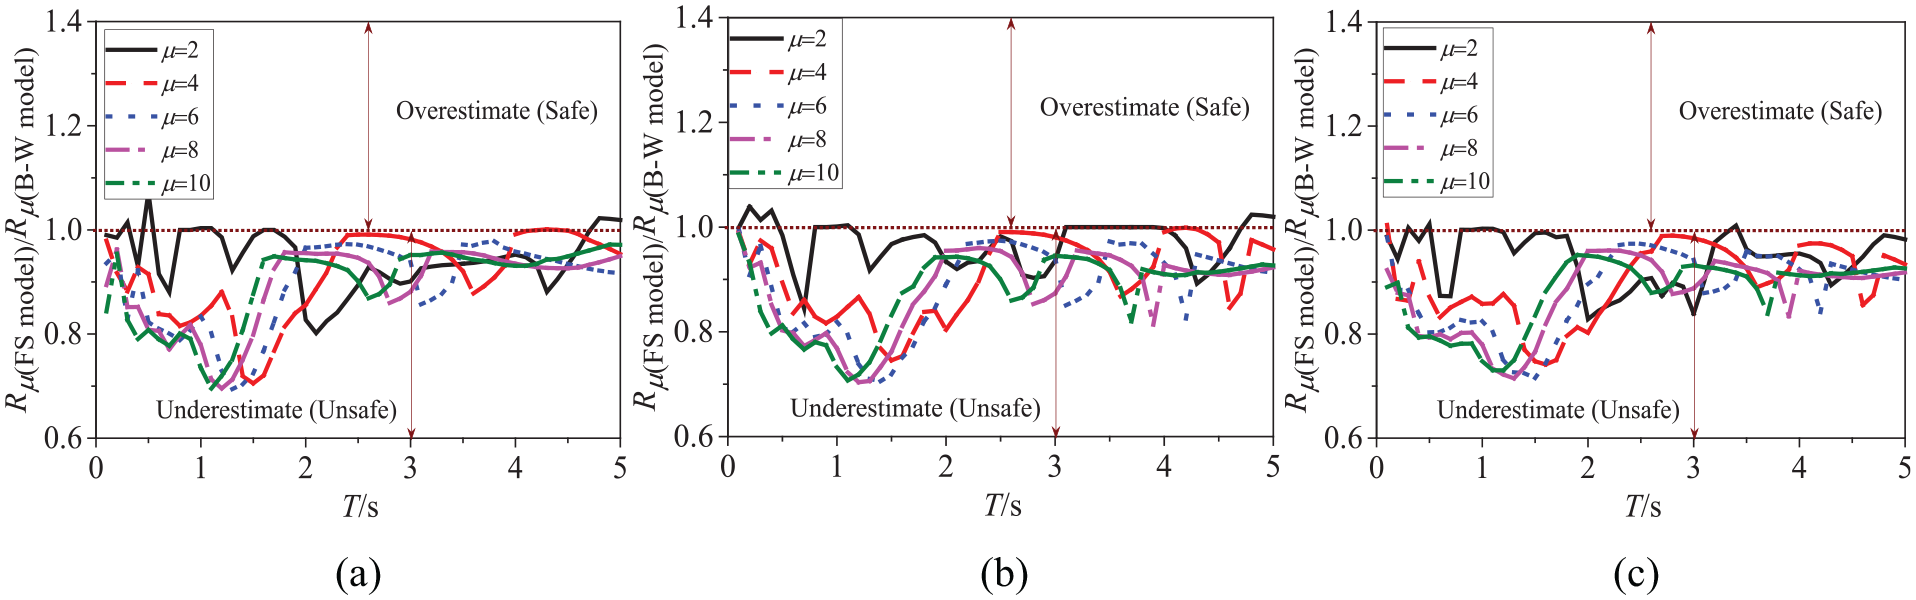
Ratio of the strength reduction factor for the FS model and that for the Bouc-Wen model: (a) on rock site; (b) on soil site; (c) on rock sites and soft sites.
As shown in Figure 8, all the value of
Influence of hysteretic parameters
Hysteretic parameters of the self-centering structure can appreciably influence the seismic performances of the self-centering structure (Araki et al., 2016; Qiu and Zhu, 2017b). Without loss of generality, the strength reduction factor for the self-centering structure also may be affected by the hysteretic parameter. To examine the effect of the hysteretic parameter on the strength reduction factor, the effects of the post-yielding stiffness ratio and the energy dissipation ratio are discussed in this section.
The strength reduction factor for the different ductility level self-centering structures with
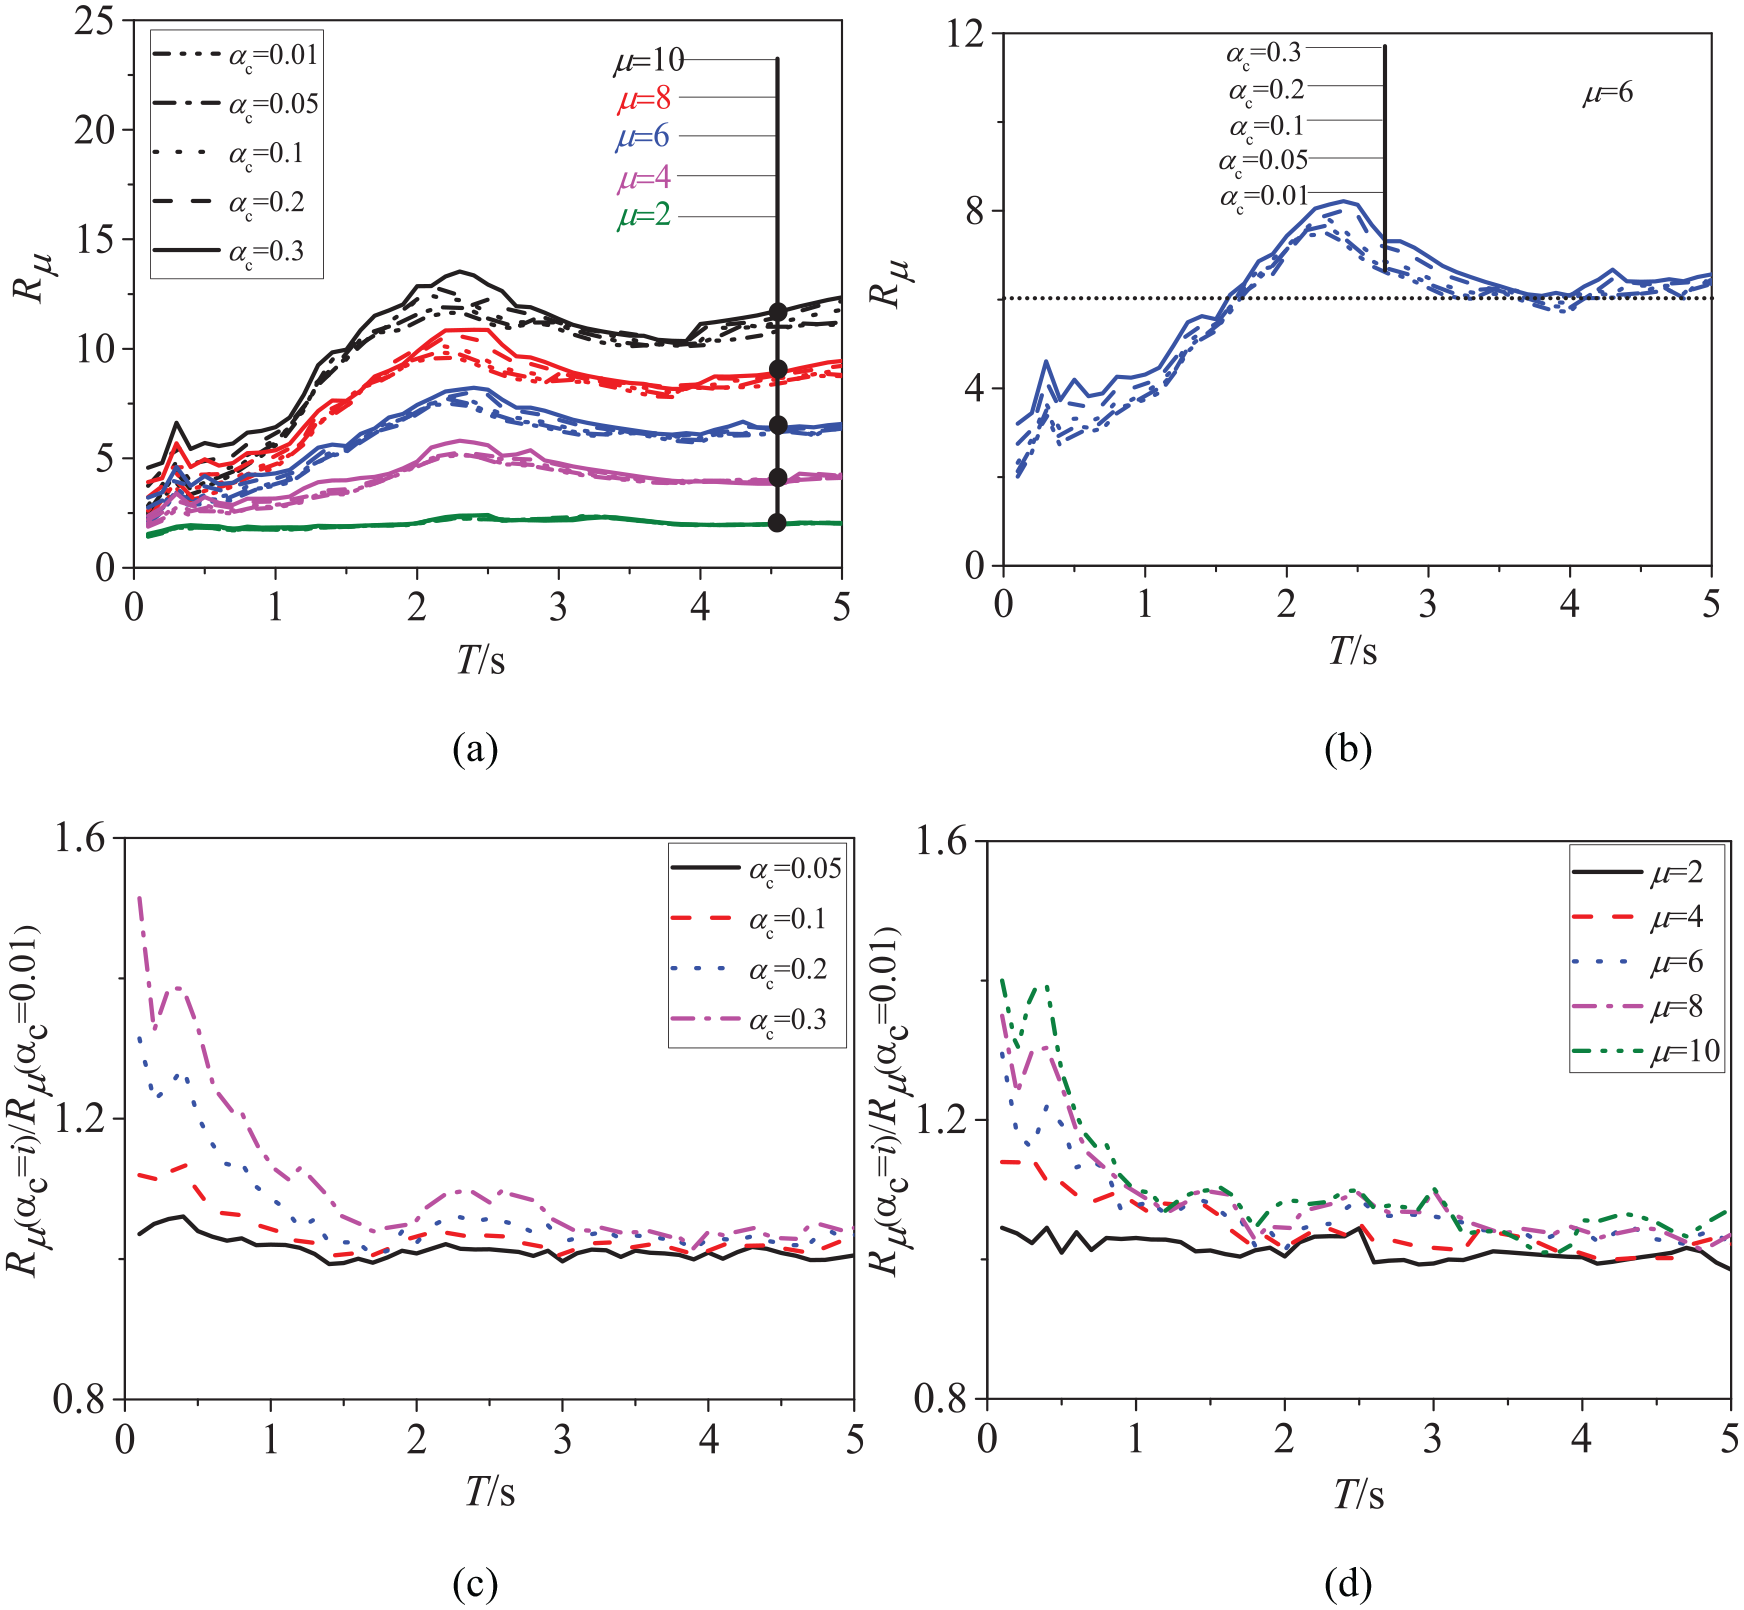
(a) Strength reduction factor spectra of the self-centering structures with various post-yielding stiffness ratios, (b) strength reduction factor spectra of the self-centering structures with various post-yielding stiffness ratios when the ductility factor is 6, (c) the effect of the energy dissipation on the ratio of strength reduction factor for the systems between α c = i (i > 0.01) and α c = 0.01, (d) the effect of the ductility factor on the ratio of strength reduction factor for the systems between α c = i (i > 0.01) and α c = 0.01.
Figure 9(c) shows the ratios of the strength reduction factors for the self-centering structures with
Figure 10 shows the strength reduction factor of the self-centering structures with
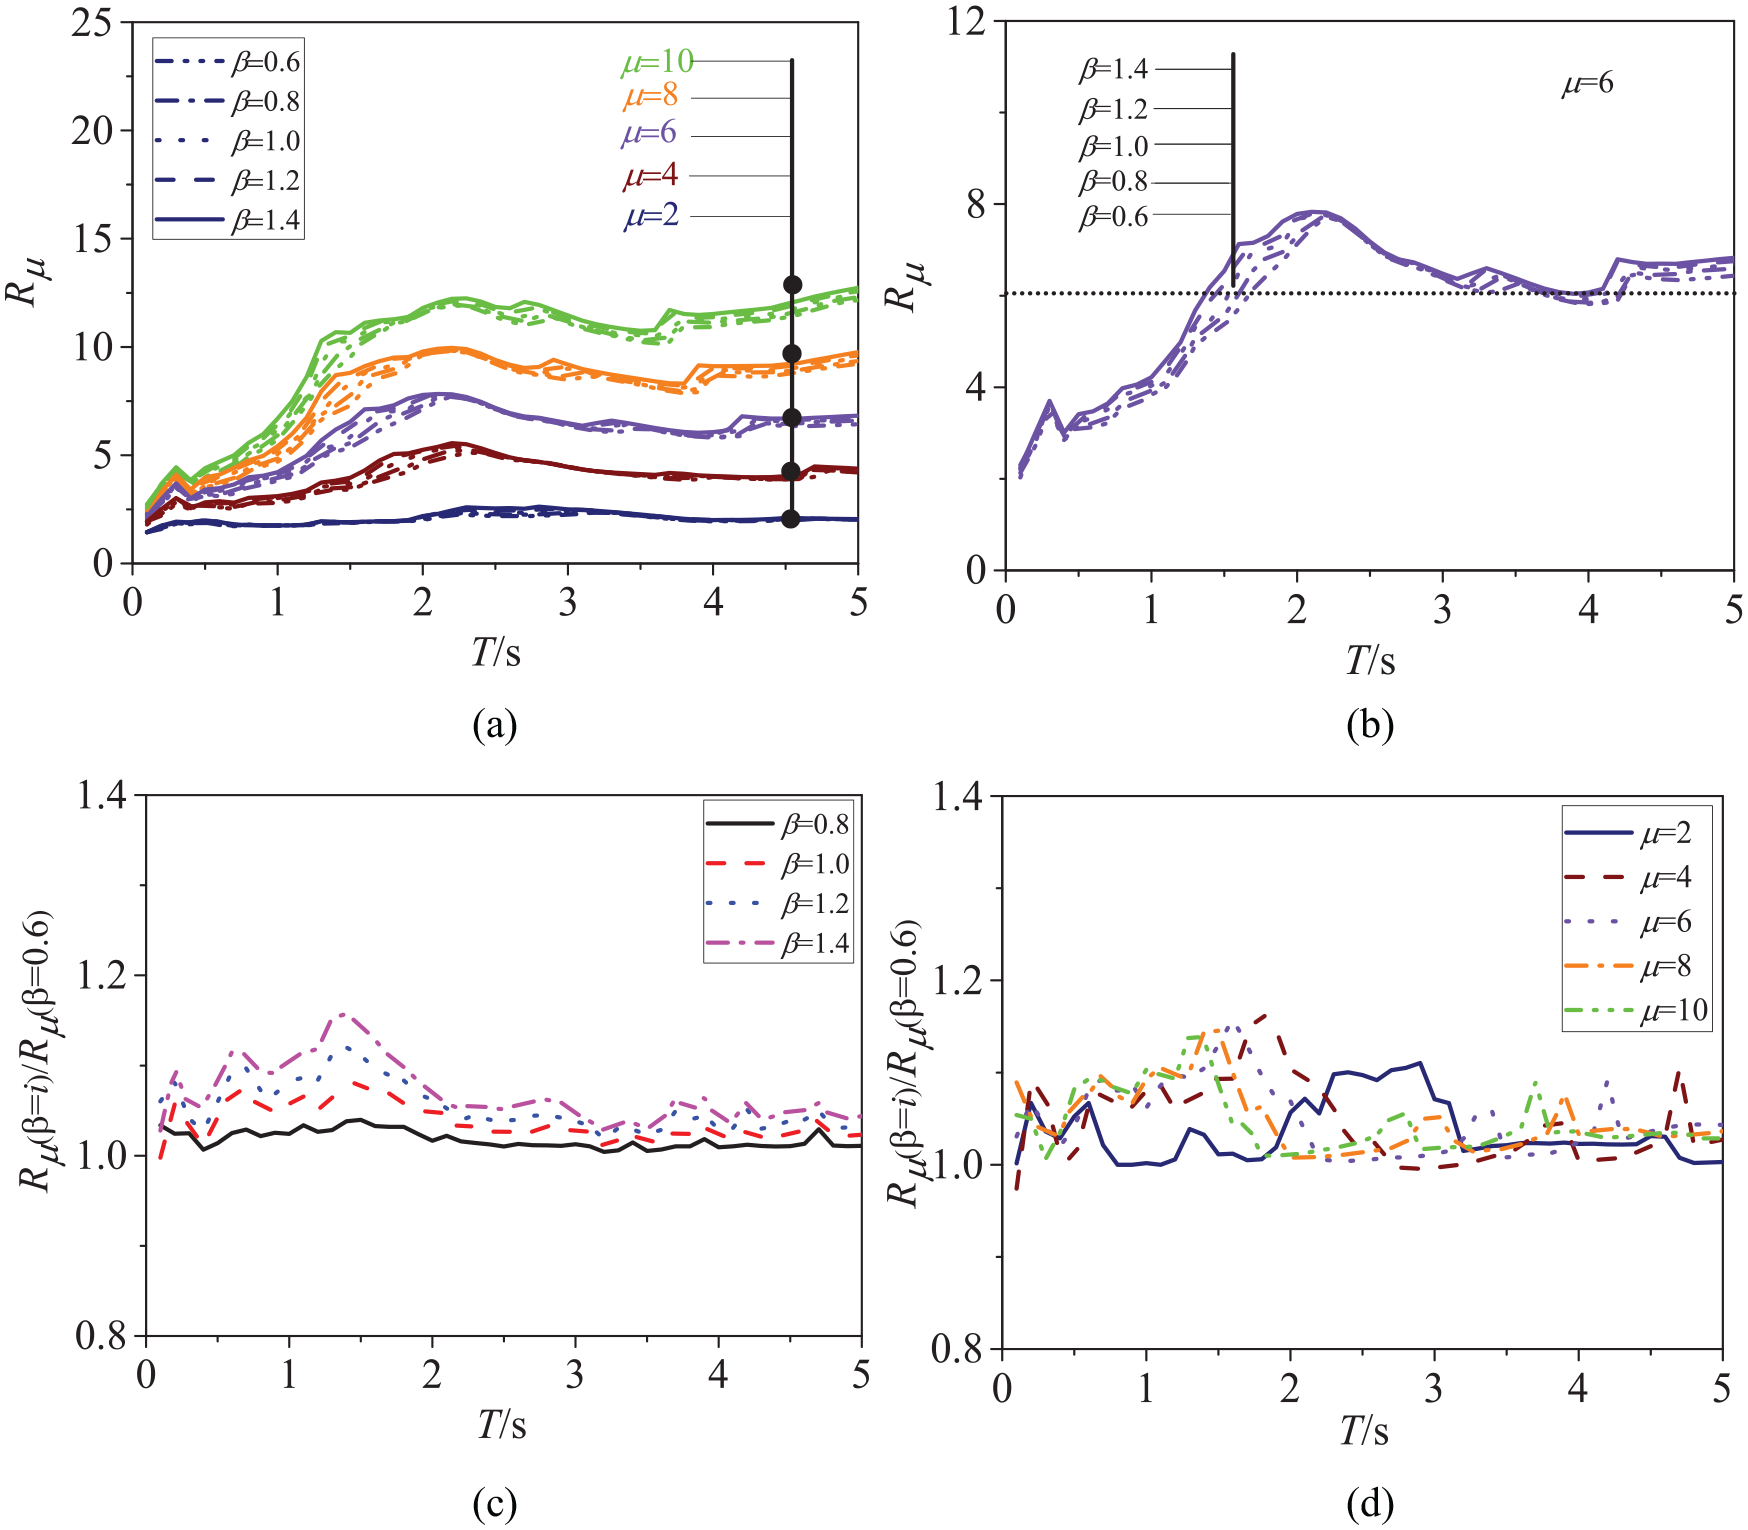
(a) Strength reduction factor spectra of the self-centering structures with various energy dissipation ratios, (b) strength reduction factor spectra of the self-centering structures with various dissipation energy ratios when the ductility factor is 6, (c) the effect of the energy dissipation on the ratio of strength reduction factor for the systems between β= i (i > 0.6) and β = 0.6, (d) the effect of the ductility factor on the ratio of strength reduction factor for the systems between β = i (i > 0.6) and β = 0.6.
Figure 10(c) illustrates the ratios of the strength reduction factor for the self-centering structures with
Comparisons of strength reduction factor spectra between near-fault pulse-like and ordinary ground motions
To investigate the influence of near-fault pulse-like ground motions on the strength reduction factor of the FS model, the comparisons of the strength reduction factor between near-fault pulse-like motions and ordinary motions are investigated in this section. Near-fault pulse-like ground motion records and ordinary ground motion records as listed in Tables 1 and 2, respectively, are utilized to calculate.
Figure 11 shows comparisons of the strength reduction factor for the FS model between near-fault pulse-like ground motions and ordinary ground motions. As shown in Figure 11(a), with the increase of the period, the general variation tendencies of both strength reduction factor for the two sets of ground motion records are similar. It should be noted that the strength reduction factor of the FS model under near-fault pulse-like ground motions are smaller than that under ordinary motions. This phenomenon for the FS model is consistent with that for the Bilinear model (Gillie et al., 2010).
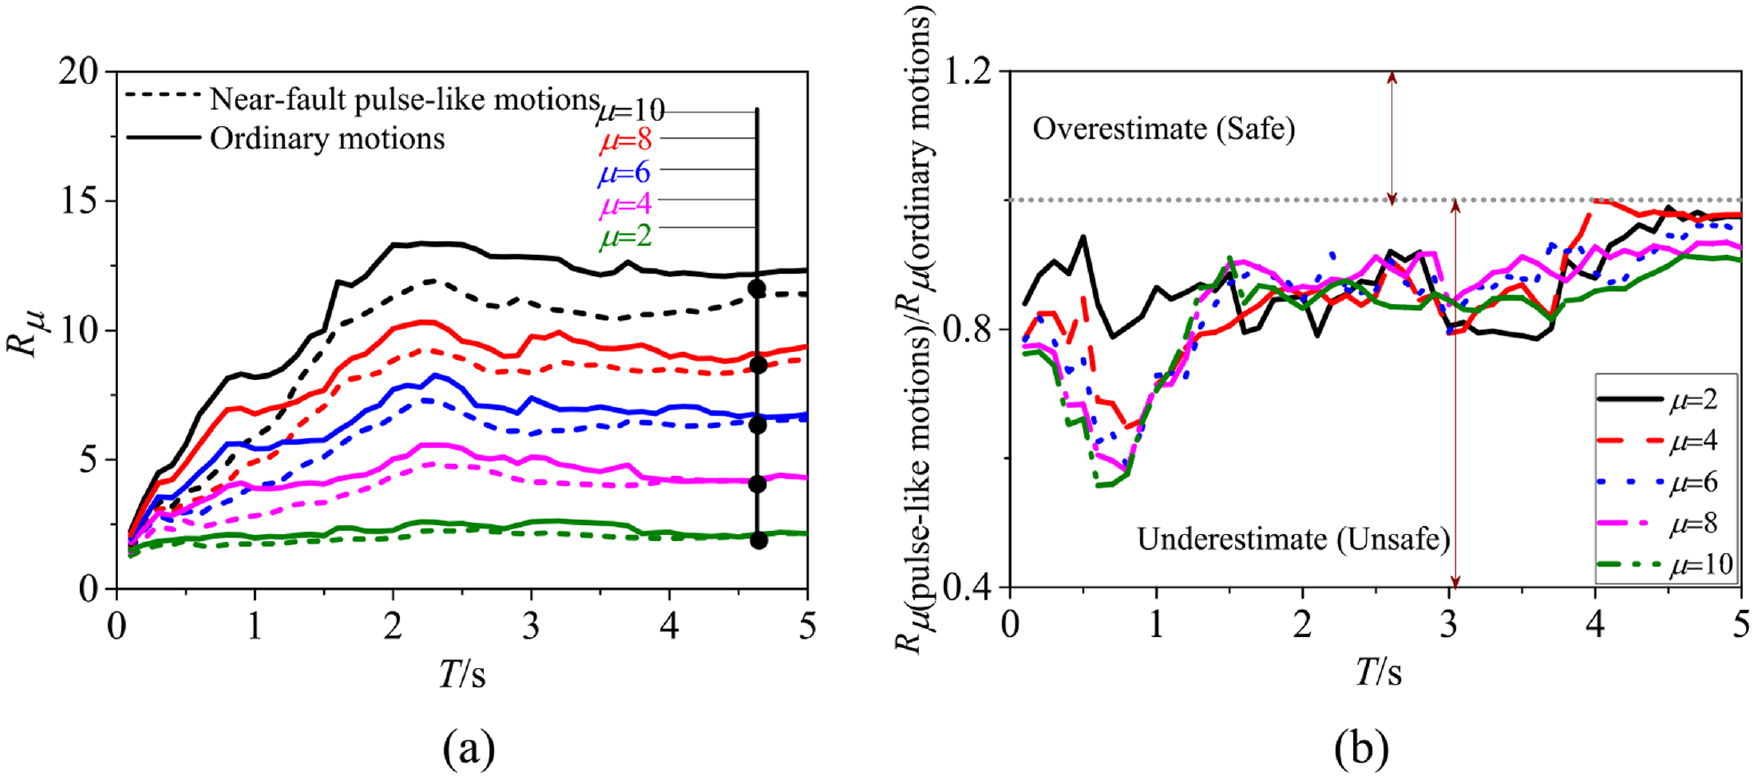
(a) Strength reduction factor spectra for near-fault pulse-like motions and ordinary motions, and (b) ratio of the strength reduction factor between the pulse-like motions and the ordinary motions.
The ratio of the strength reduction factor for near-fault pulse-like motions to that for ordinary motions
Predictive model
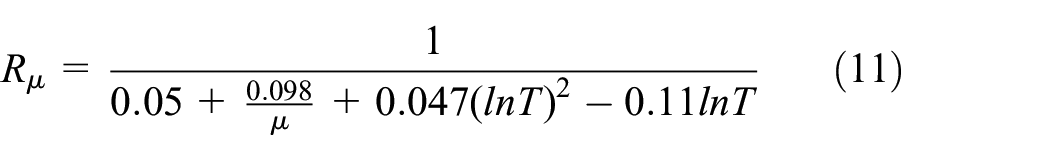
The predictive model of the strength reduction factor is an appealing tool used to determine the strength demand for the seismic design of the structure. In this study, a two-step nonlinear regression analysis is carried out (Hatzigeorgiou, 2010b): first, the relation of the strength reduction factor spectra and the structural period and ductility factor is regressed from the statistical analysis as discussed above; second, the effect of the structural and ground motion characteristic is considered. Based on the general tendencies of the strength reduction factor spectra of FS model for near-fault pulse-like ground motions as above mentioned, it is found that the effects of the site conditions and energy dissipation ratio are not significant and the corresponding errors are not less than 20%, and the post-yield stiffness ratio has a significant effect. Therefore, the simplified equation of the strength reduction factor spectra for the self-centering structure with the FS model which only considers the effect of the post-yielding stiffness ratio is developed as
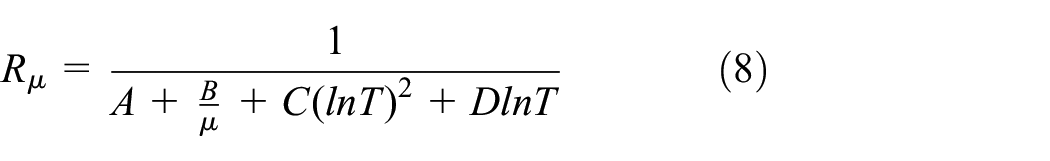


where A, B, C, and D are coefficients which take into account the effect of the post-yield stiffness ratio, A1, B1, C1, and D1 is the corresponding parameters.
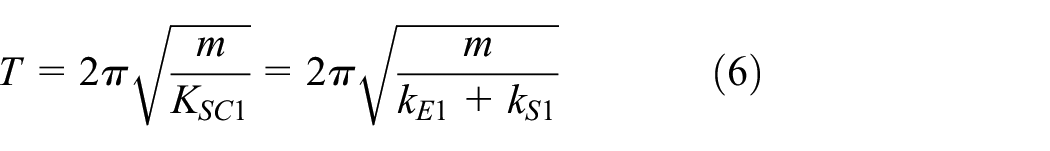
The boundary conditions of the strength reduction factor confirmed by many researchers which are applied to equation (6) can be expressed as


The function expression of the strength reduction factor for a self-centering structure (
The comparison results of the strength reduction factor for the FS model between the predicted model and the statistical results are shown in Figure 12(a). As shown, the developed predicted model can provide a good estimation of the strength reduction factor for self-centering structure under near-fault pulse-like ground motions.
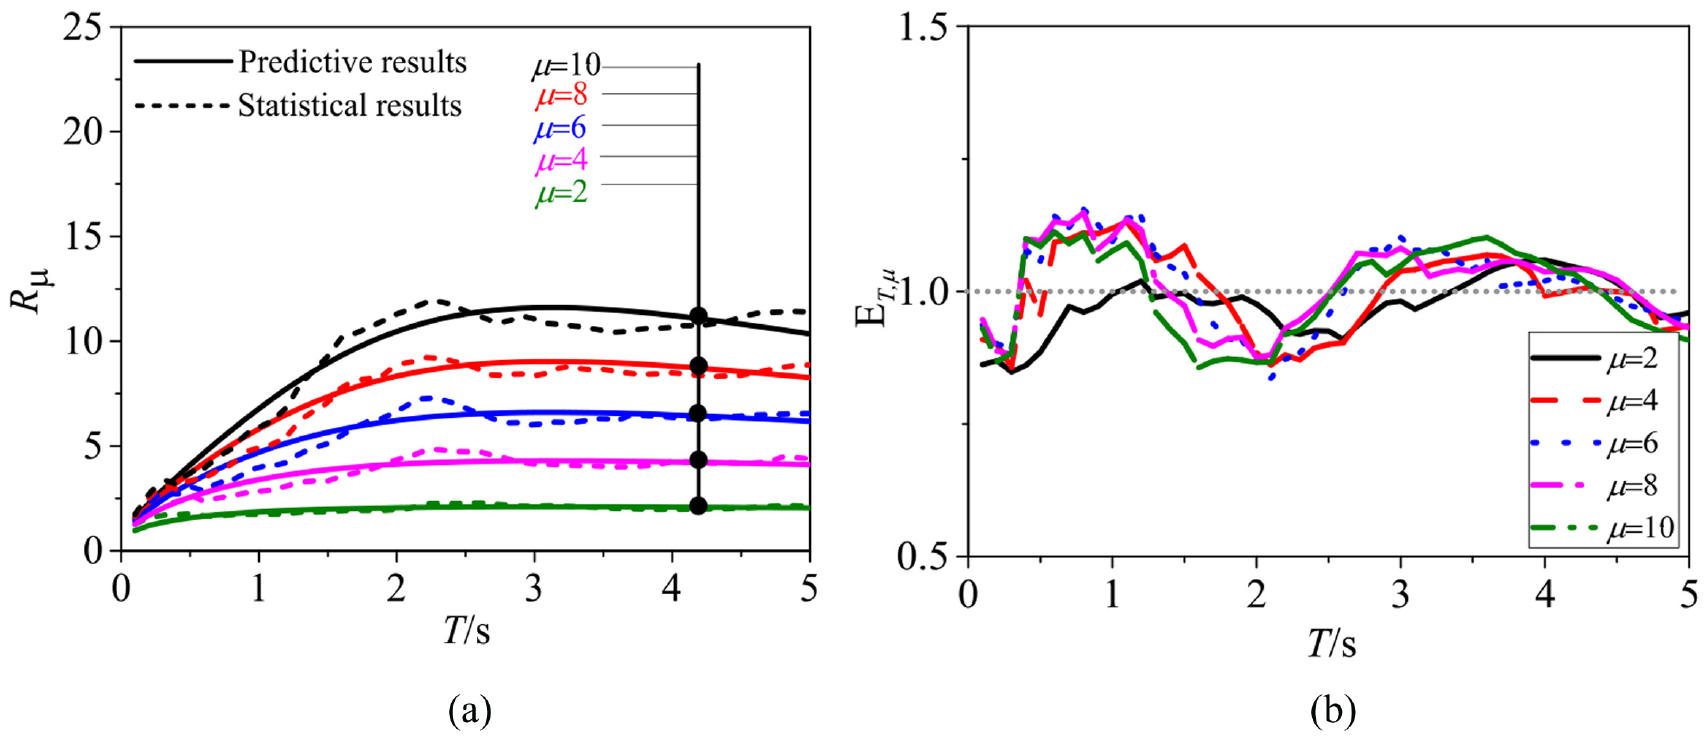
(a) Comparisons of the predicted strength reduction factor with the statistical results of the self-centering structure, (b) sample mean error
To evaluate the accuracy of the developed predicted model (i.e. equation (6)), the sample mean error
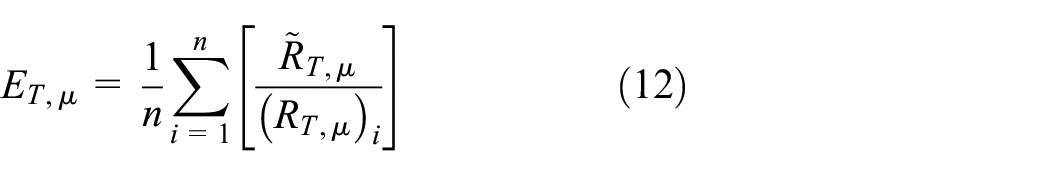
in which, n is the number of the ground motions,
Conclusions
The main objective of the article was the statistical and analytical characterization of the strength reduction factor of the self-centering structure. Some conclusions drawn from this study are as follows:
The strength reduction factor for the FS model under near-fault pulse-like motions is relatively sensitive to the ductility factor and vibration period. The effect of the site condition on the strength reduction factor of the FS model for the near-fault pulse-like ground motions is not significant.
During the period range 0.1–5.0 s, the strength reduction factor of the FS model is smaller than that of the Bouc-Wen model, and the minimum value of
The post-yielding stiffness ratio has a significant effect on the strength reduction factor for the FS model, in particular for the short period region. The effect of the energy dissipation ratio on the strength reduction factor is within 20% and not significant during the whole period region.
The strength reduction factor of the FS model for near-fault pulse-like motions is obviously smaller than that for ordinary motions. The phenomenon indicates that it is unsafe for the structural design of the self-centering structure under near-fault pulse-like motions if the strength reduction factor from the ordinary motions is used, particularly for the short-medium period region.
The proposed predicted model can provide a good estimation of the strength reduction factor for the self-centering structure with FS model under near-fault pulse-like ground motions.
Footnotes
Declaration of conflicting interests
The author(s) declared no potential conflicts of interest with respect to the research, authorship, and/or publication of this article.
Funding
The author(s) disclosed receipt of the following financial support for the research, authorship, and/or publication of this article: The authors acknowledge the partial support from the National Science Foundation of China (No. 51908325 and No. 51778023), Postdoctoral Science Foundation of China (2018M641363), and Beijing Municipal Education Commission (No. IDHT20190504 and KZ202010005001).