
Abstract
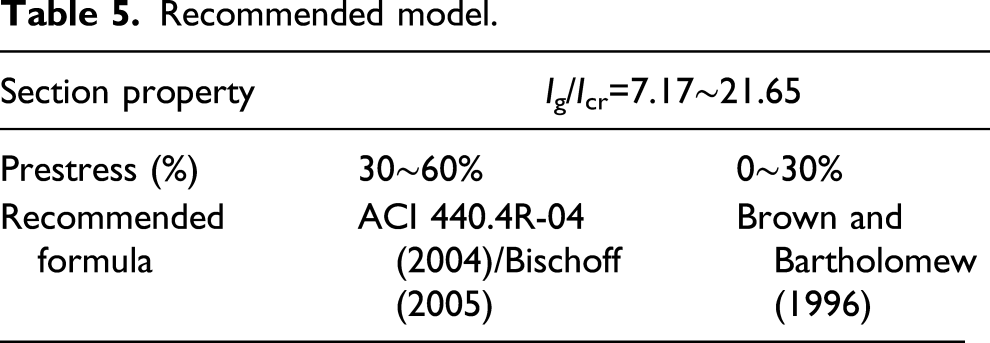
Fiber-reinforced polymer–reinforced ballastless track slabs not only improve the insulation performance but also have advantages in their mechanical properties. The objective of the article is to propose a corresponding design method of the ballastless track slabs considering different parameters by a finite element analysis model. The deformation performance of the ballastless track slabs, as well as the prediction results of several models, was studied considering the different prestress levels, reinforcement ratios, and prestressed materials. The results show that ACI 440.4R-04 and Bischoff models are suggested for predicting the deflection of a ballastless track slab when the prestress level is between 30% and 60% and the Brown and Bartholomew model is suitable for those with a prestress level below 30%.
Keywords
Introduction
High-speed railways are receiving more attention because of their characteristics of high automation, good safety, and ideal comfort (Esveld, 2010; Kang et al., 2018a; Qin and Gao, 2017). As a critical component of a high-speed railway, the ballastless track slab system shows better performance in terms of stability, durability, and maintainability compared to the ballasted track system (Kang et al., 2019b; Sun et al., 2013; Zeng et al., 2019). However, closed-loop circuits are commonly observed in ballastless track slabs because the steel mesh is composed of longitudinal and transverse steel bars, which significantly reduce the transmission performance of the track circuit system because a mutual inductance is created between the closed-loop circuit and the electric current in the track circuit system(Kim et al., 2009a, 2009b; Yang et al., 2015a, 2015b).
To solve this insulation problem, researchers have adopted numerous measures, such as painting an insulation coating onto the steel mesh, applying heat-shrinkable sleeves, or using insulating cards (Wu et al., 2014; Yu et al., 2007). However, the insulation properties of the ballastless track slab still cannot meet the requirements of TB10002.3 (2005). Moreover, additional maintenance should be included to improve the insulation performance of ballastless track slab systems (Yang et al., 2015a, 2015b; Wu et al., 2014). Fiber-reinforced polymers (FRPs) can be regarded as a substitute for steel reinforcing bars in concrete structures because of their high strength, light weight, and good insulation properties (Chen et al., 2020; Xiang et al., 2020; Yang 2016; Yang et al., 2015a, 2015b). Based on the author’s previous work (Yang et al., 2015a, 2015b, 2016), the insulation properties of FRP-reinforced slabs have been demonstrated to be much better than those of traditional slabs. Compared with traditional slabs, the effect of basalt-fiber–reinforced polymer (BFRP)-reinforced slabs on the rail resistance increment decreases to 26∼41%, and the effect of the steel-fiber–reinforced polymer composite bar (SFCB) slab decreases to 70∼74%. In addition, the observed load-carrying capacity of the BFRP and SFCB slabs is slightly higher than that of the reinforced concrete (RC) slab (corresponding 102% and 112% for RC) (Yang et al., 2015a, 2015b).
However, due to the limited number of test specimens, the influence of different parameters on the structural performance of ballastless track slabs has not been fully considered. (1) The reinforcement ratio: A large number of studies show that the combination of prestressed and non-prestressed tendons can effectively limit the crack width and deflection of partially prestressed concrete structures. In addition, the reinforcement ratio of prestressing and non-prestressing tendons plays an important role in the performance of a prestressed member, which not only affects the bearing capacity but also has an influence on the crack performance of partially prestressed concrete structures (Qin et al., 2017). (2) The prestressed reinforcement: Currently, the characteristics of the prestressed reinforcement are quite different from other types of reinforcement. For example, the carbon-fiber–reinforced polymer (CFRP) provides high strength and good durability but has a high cost. However, the aramid-fiber–reinforced polymer (AFRP) has a comparable tensile strength to CFRP tendons but lower elastic modulus compared to the CFRP. The glass-fiber–reinforced polymer (GFRP) is not suitable for prestressed concrete, as suggested by many scholars, due to its reduced strength in alkaline environments and high creep rate under sustained loads (ACI 440.4R-04, 2004; Dolan, 1999). (3) The prestress levels: Although the prestress level seems to have little effect on the ultimate load, it significantly increases the cracking loads observed in both PC and PPC concrete structures. Furthermore, the crack width can be effectively limited at both the service load and ultimate load because the prestress can noticeably restrict the strains in non-prestressing reinforcement (Mostakhdemin Hosseiniet al., 2014; Wang et al., 2018).
The finite element analysis (FEA) model can be used to investigate the structural performance of the structure. Several studies show that the FEA method can provide satisfactory calculations for the linear and nonlinear behavior of concrete structures. Moreover, in the FEA model, the structural performance considering the above parameters can be easily investigated by changing the cross-sectional area of materials or replacing the prestressing material, which is a standard method for obtaining credible results (Domenico et al., 2014; Hawileh, 2015; Moreira et al., 2018).
Therefore, the objective of the article is to study the characteristics and development process of ballastless track slabs considering the above parameters, and the FEA model was adopted to analyze the structural performance of ballastless track slabs with different parameters. Six specimens, including BFRP, SFCB, and RC ballastless track slabs, are used to validate the FEA models. Next, a parametric study considering the prestressing degrees, reinforcement ratios, and prestressing materials is carried out to investigate the structural performance and mechanical properties of the slabs. An appropriate design method of such slabs can be proposed by comparing the results with the code requirements that are normally used for PC members. Such information can provide useful suggestions for the design of this type of concrete structure.
Finite element model of FRP-reinforced ballastless track slab
The commercial FE software “ANSYS” is used to carry out the numerical analysis of a full-scale ballastless track slab. A three-dimensional FEA model is established considering the geometry, mechanical properties, and boundary conditions, which are set according to the test prototypes in the experiment. The mesh of the elements of the three-dimensional FE model we developed is shown in Figure 1(a). FEA model: (a) mesh of the elements; (b) stress–strain of the concrete in compression; (c) stress–strain of the steel bars; (d) stress–strain of the BFRP bars; (e) stress–strain of the SFCBs. Note: FEA: finite element analysis; BERP: basalt-fiber–reinforced polymer; SFCB: steel-fiber–reinforced polymer composite bar.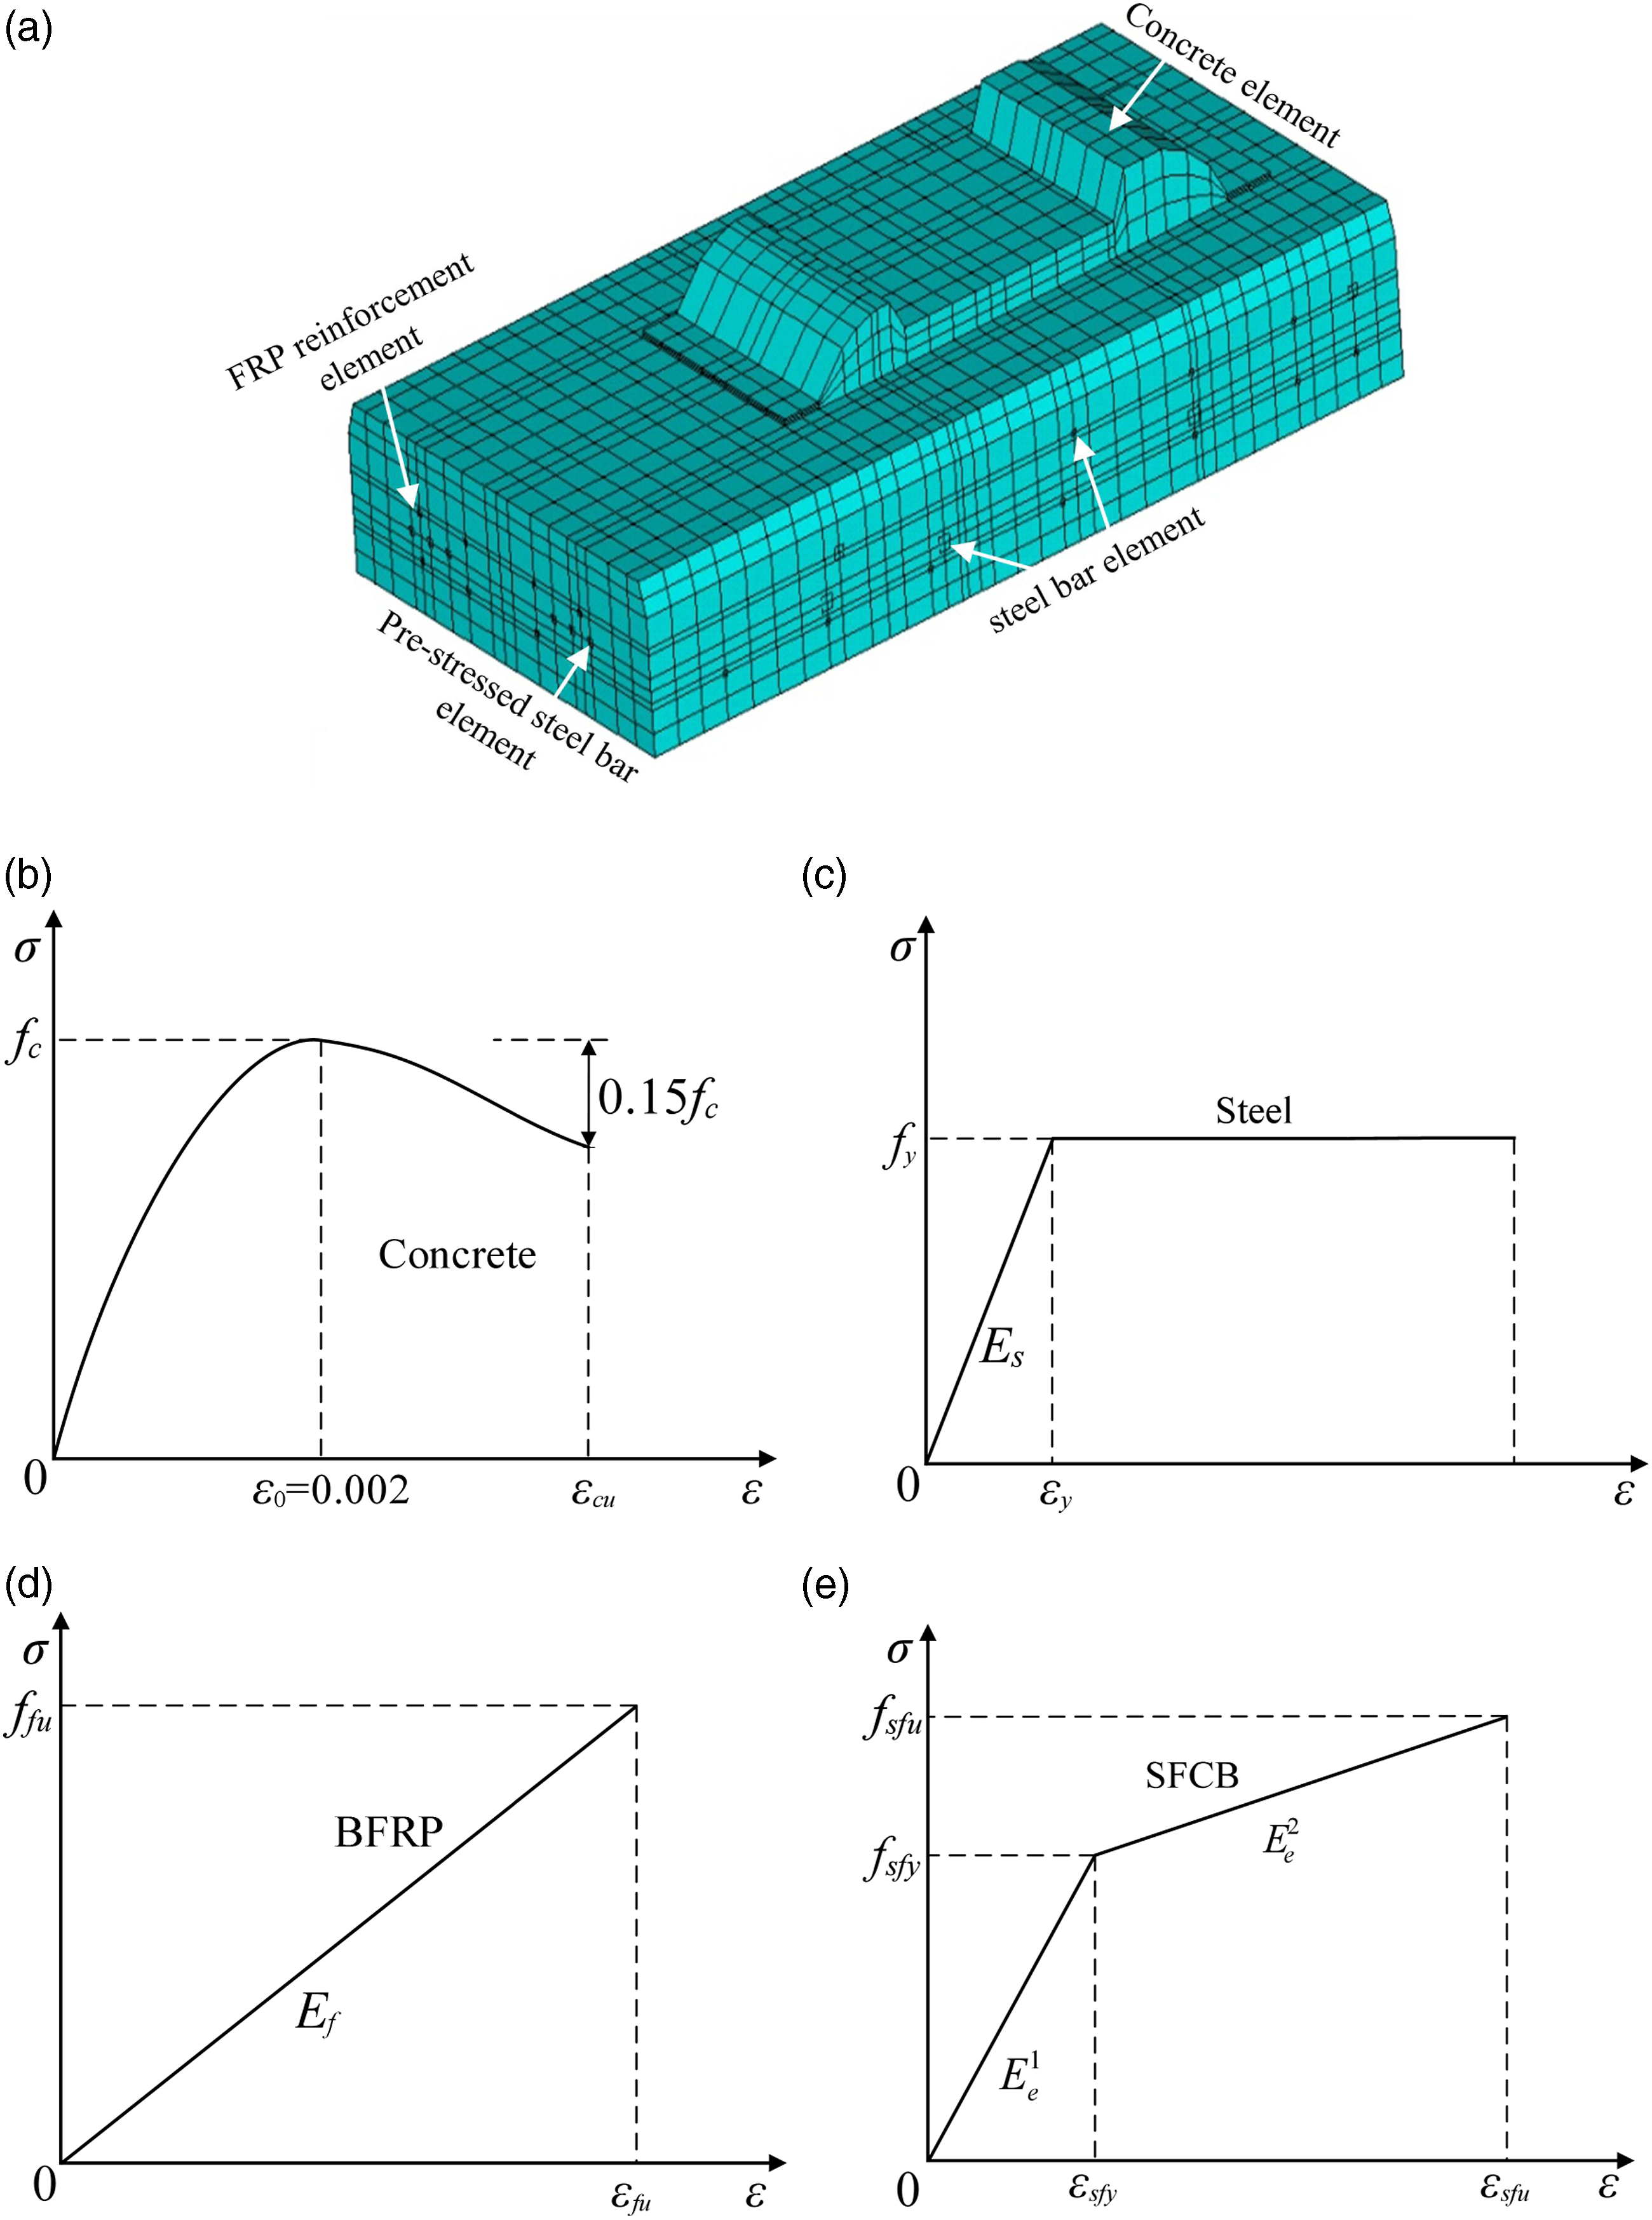
Element types
The SOLID65 element (an eight-node element with three degrees of freedom per node) in ANSYS can be used to simulate the nonlinear behavior of concrete, together with the crushing and cracking behavior in compression and tension, respectively. The sizes of the concrete elements for the slabs ranged from 20 to 50 mm, as recommended by Kwak and Filippou (1997).
The LINK8 element (a two-node element with three degrees of freedom per node) in ANSYS is employed to model the reinforcement and prestressed tendons. No discrepancy exists between LINK8 and SOLID65 elements in terms of the degrees of freedom; therefore, there is no need for multiple constraints between these elements.
The cracking of the FEA model can be expressed by the smeared crack analogy, which appears perpendicular to the principal stress direction as the cracking strain is exceeded. The SOLID65 element presented isotropic behavior before cracking, whereas the concrete model showed orthotropic behavior after cracking (ASCE 1982). More details can be obtained in ANSYS (2013).
Since the main purpose of this article is to investigate the structural performance of ballastless track slabs and the bond-slip behavior of RC has a limited influence on the structural response, perfect bonds were modeled for the constituent materials. It is worth nothing that the prestressing effect of the prestressed steel bar was provided by initial strains and the Newton–Rapson method of analysis was used for the nonlinear response.
Material properties
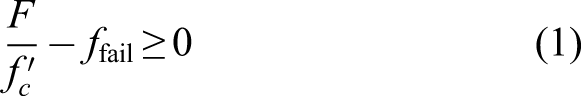
In this study, the Hognestad model (1995) was employed to model the concrete in compression. The FRP bars were modeled as a linear elastic material, while the other reinforcement materials (steel bars, prestressed steel bars, and SFCBs) were modeled as a bilinear elastic material based on the tested results. The Willam and Warnke (1975) approach was adopted to model the concrete behavior. Once the stress state satisfies formula (1), the concrete element fails. The multiaxial stress failure criterion is given as
Specimen design
All 42 specimens are divided into four groups and modeled in ANSYS software. Group A consists of six slabs considering two series, that is, the double rail-platform slab (S-DR) series and the single rail-platform slab (S-SR) series (each series includes one RC slab, one BFRP slab, and one SFCB slab), which are used to validate the developed FEA models.
The remaining 36 components are divided equally into 3 groups (Groups B, C, and D). Each group has 12 specimens divided equally into three series, that is, four RC slabs, four BFRP slabs, and four SFCB slabs. Group B is designed based on the same equivalent reinforcement ratio to study the effect of the prestress level on the structural performance of the slabs. Group C is designed with the same prestress level to study the influence of equivalent reinforcement ratio on the performance of the slabs. Group D is designed with the same prestress to study the effect of prestress materials on the performance of slabs.
Experimental review
Figure 2 describes the geometric dimensions and details of these slab specimens. Six slabs were divided into two series based on their dimensions. Series S-DR consisted of three slabs: slab S-DR-SFCB and slab S-DR-RC were both 2550 mm long × 650 mm wide × 200 mm deep, as shown in cross-Introduction; slab S-DR-BFRP was 2550 mm long × 550 mm wide × 200 deep mm, as shown in cross-Finite Element Model of FRP reinforced ballastless track slab. Series S-SR which had half the length of series S-DR also had three slabs: slab S-SR-BFRP, slab S-SR-SFCB, and slab S-SR-RC were all 1275 mm long × 650 mm wide × 200 mm deep. The two RC slabs consisting of eight No. 8 steel bars in the cross-section served as the control specimen. For the two SFCB-reinforced slabs and two BFRP-reinforced slabs, the transverse reinforcements consisted of eight No. 11 S6B27s and eight No. 16 BFRPs, respectively. The longitudinal reinforcements of each series slabs were consisted of No. 8, No. 20, and No. 16 mm steel bars. In addition, six prestressed steel bars were arranged on the cross-section of each slab with a nominal diameter of 10 mm, a yield stress of 1449 MPa, and a tensile strength of 1725 MPa. The total prestress force was 409 KN. The concrete with average 28 days cubes compressive strength of 87 MPa was adopted for casting the specimens, and the test method was in accordance with GB 50,010 (2010). Four-point and three-point loading was conducted on series S-DR and series S-SR, respectively (Yang et al., 2015b). The loading was applied to the slabs through the hydraulic jack controlled by an electro-hydraulic servo test system with a bearing capacity of 1000 KN. The loading diagram of the slab specimens with the detailed drawing of the reinforcement was shown in Figure 2. The test results show that all specimens were subject to bending-shear failure. Design of specimens.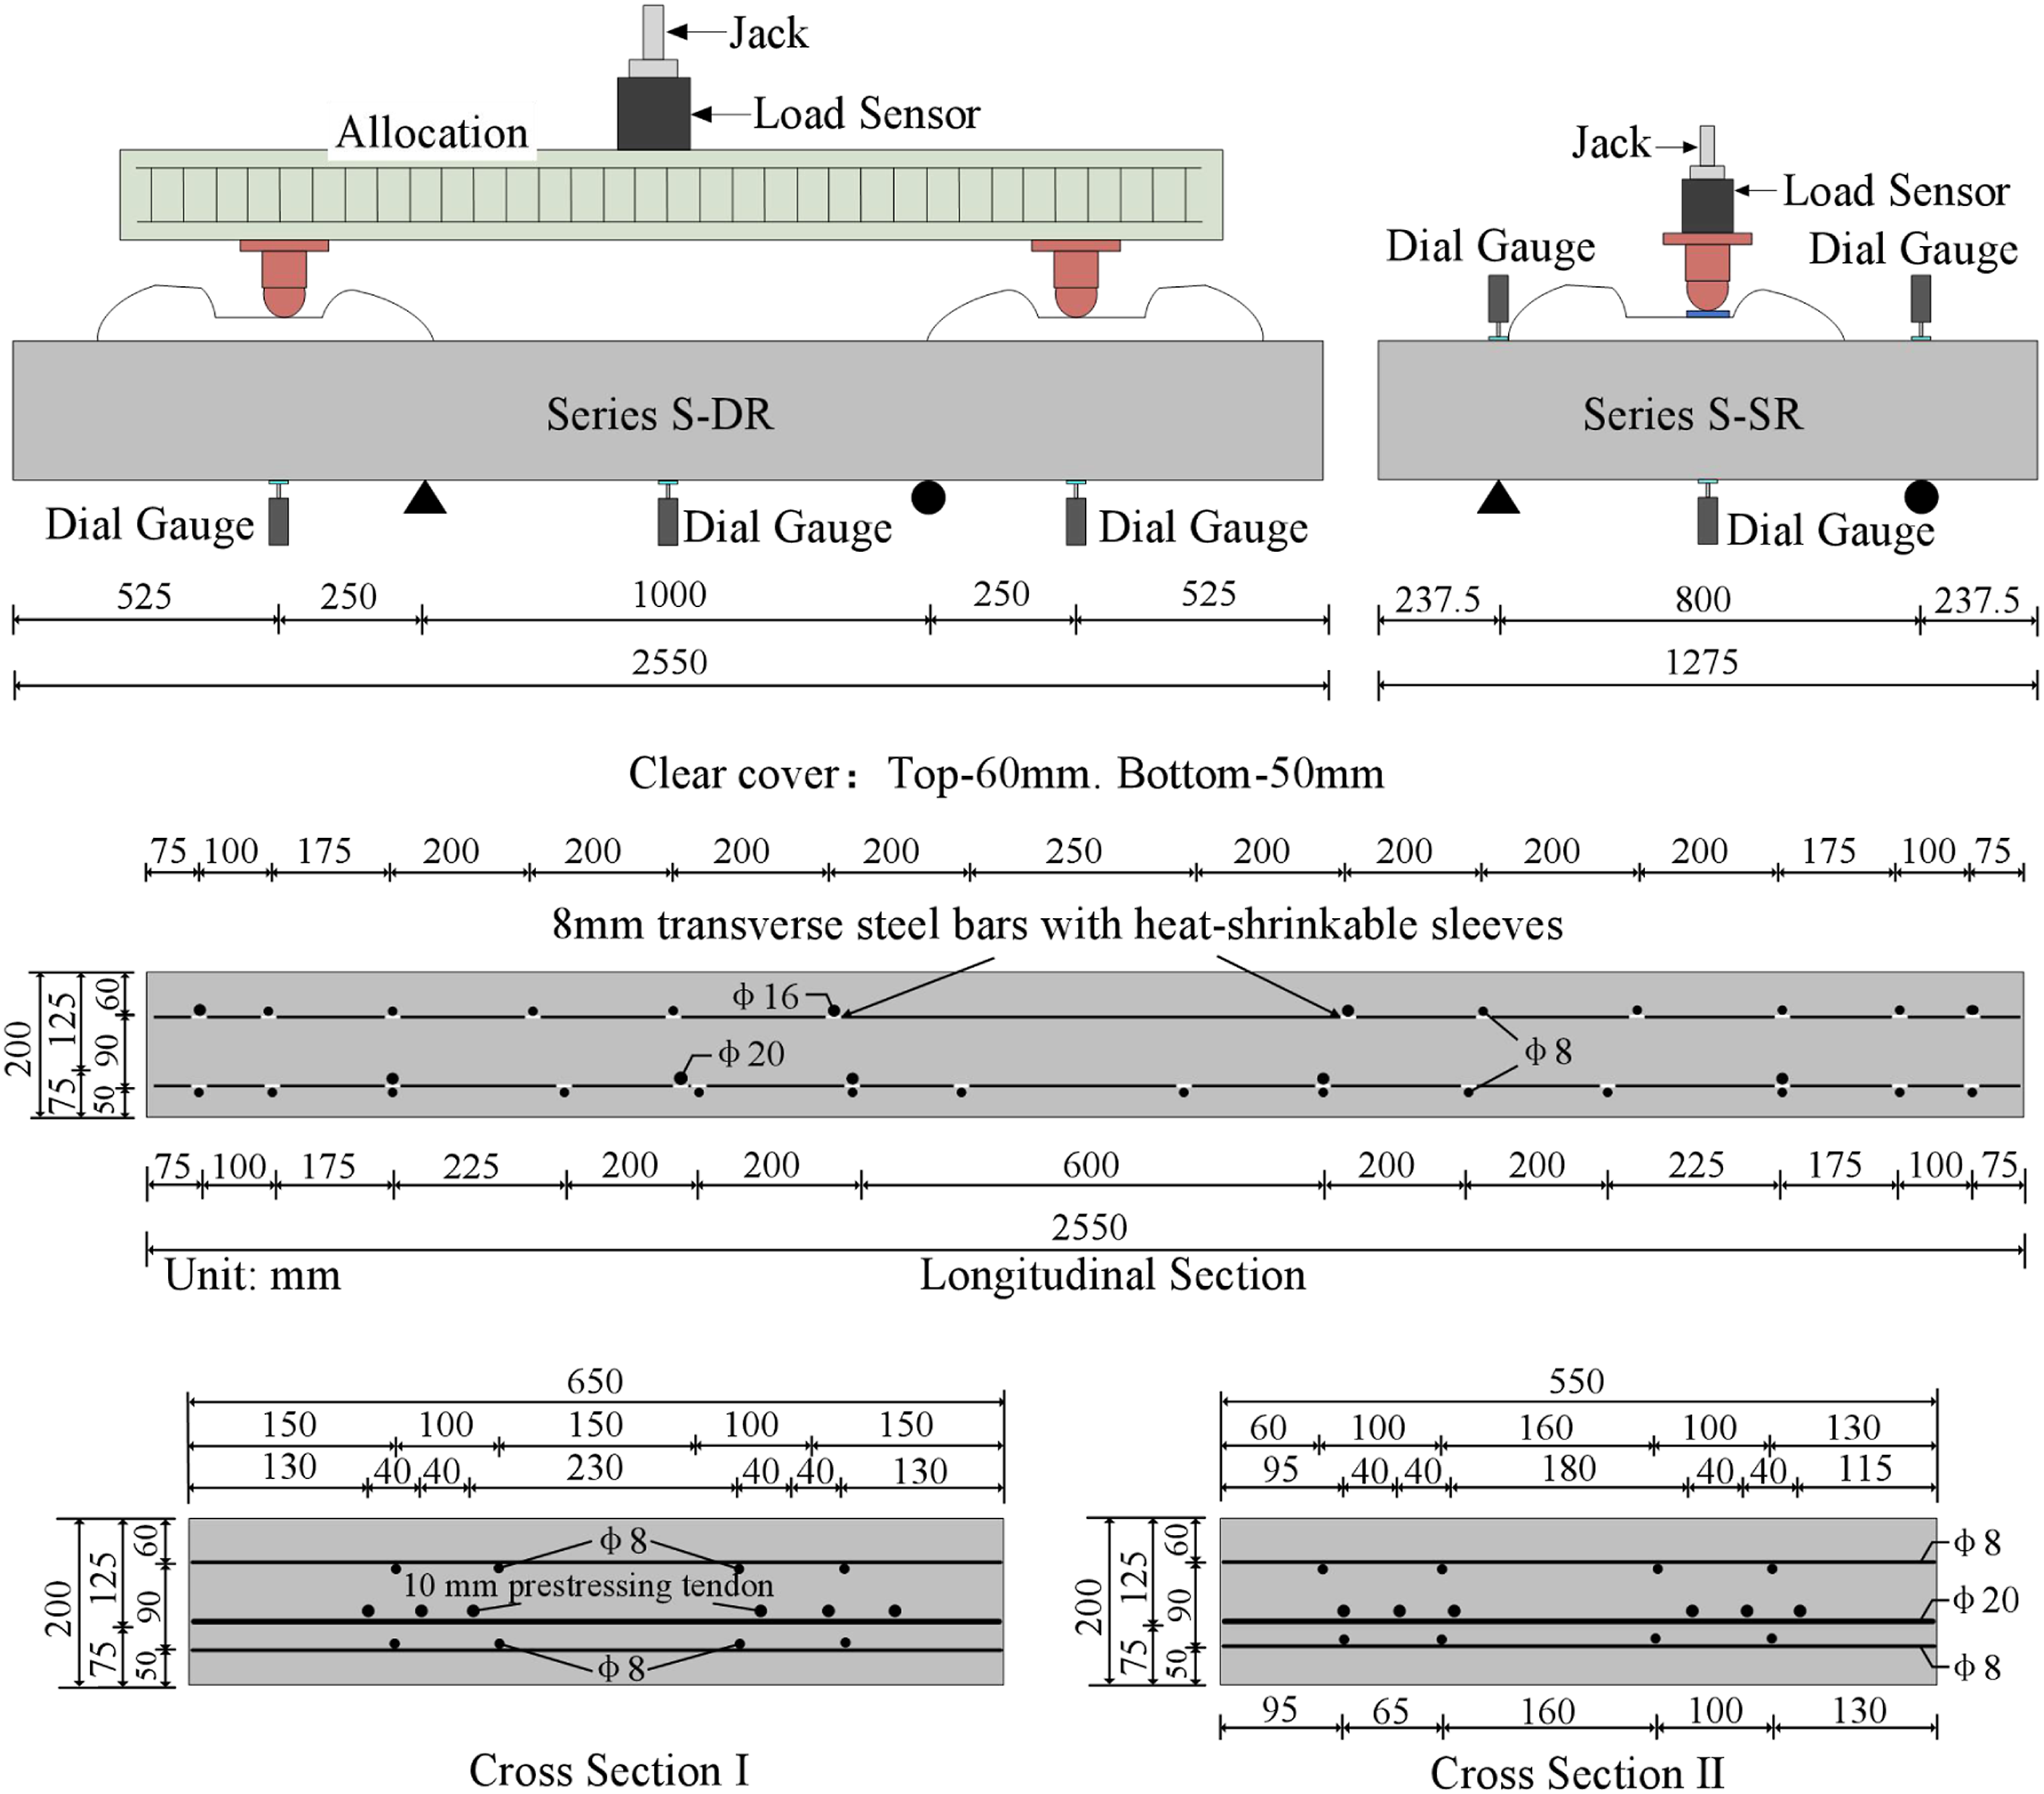
Finite element calculation results analysis
To determine the failure mode of the FEA model, the Willam and Warnke (1975) approach was adopted based on the obtained maximum stress. In the test, six ballastless track slabs failed in flexural shear; therefore, the stress distribution of the concrete in the bending-shear section was considered in the FEA model. Then, the FEA model of the ballastless track slabs is discussed in terms of the following two aspects. First, the accuracy of the developed FEA models was validated by the experimental results. Second, the effect of the parameters (prestressed degrees, reinforcement ratios, and prestressing materials) on the structural performance of the ballastless track slabs was evaluated by the FEA models.
Validation of the FEA results
The failure modes of the FEA simulation are shown in Figure 3 The maximum stress of the element is obtained by the von Mises yield criterion to determine the component damage. Based on the concrete failure criteria illustrated previously, the FEA model indicates that bending-shear failure occurs in the ballastless track slabs, which can be validated by a comparison with the experimental results. Failure mode of finite element method: (a) S-DR series; (b) S-SR series. Note: S-DR: double rail-platform slab; S-SR: single rail-platform slab.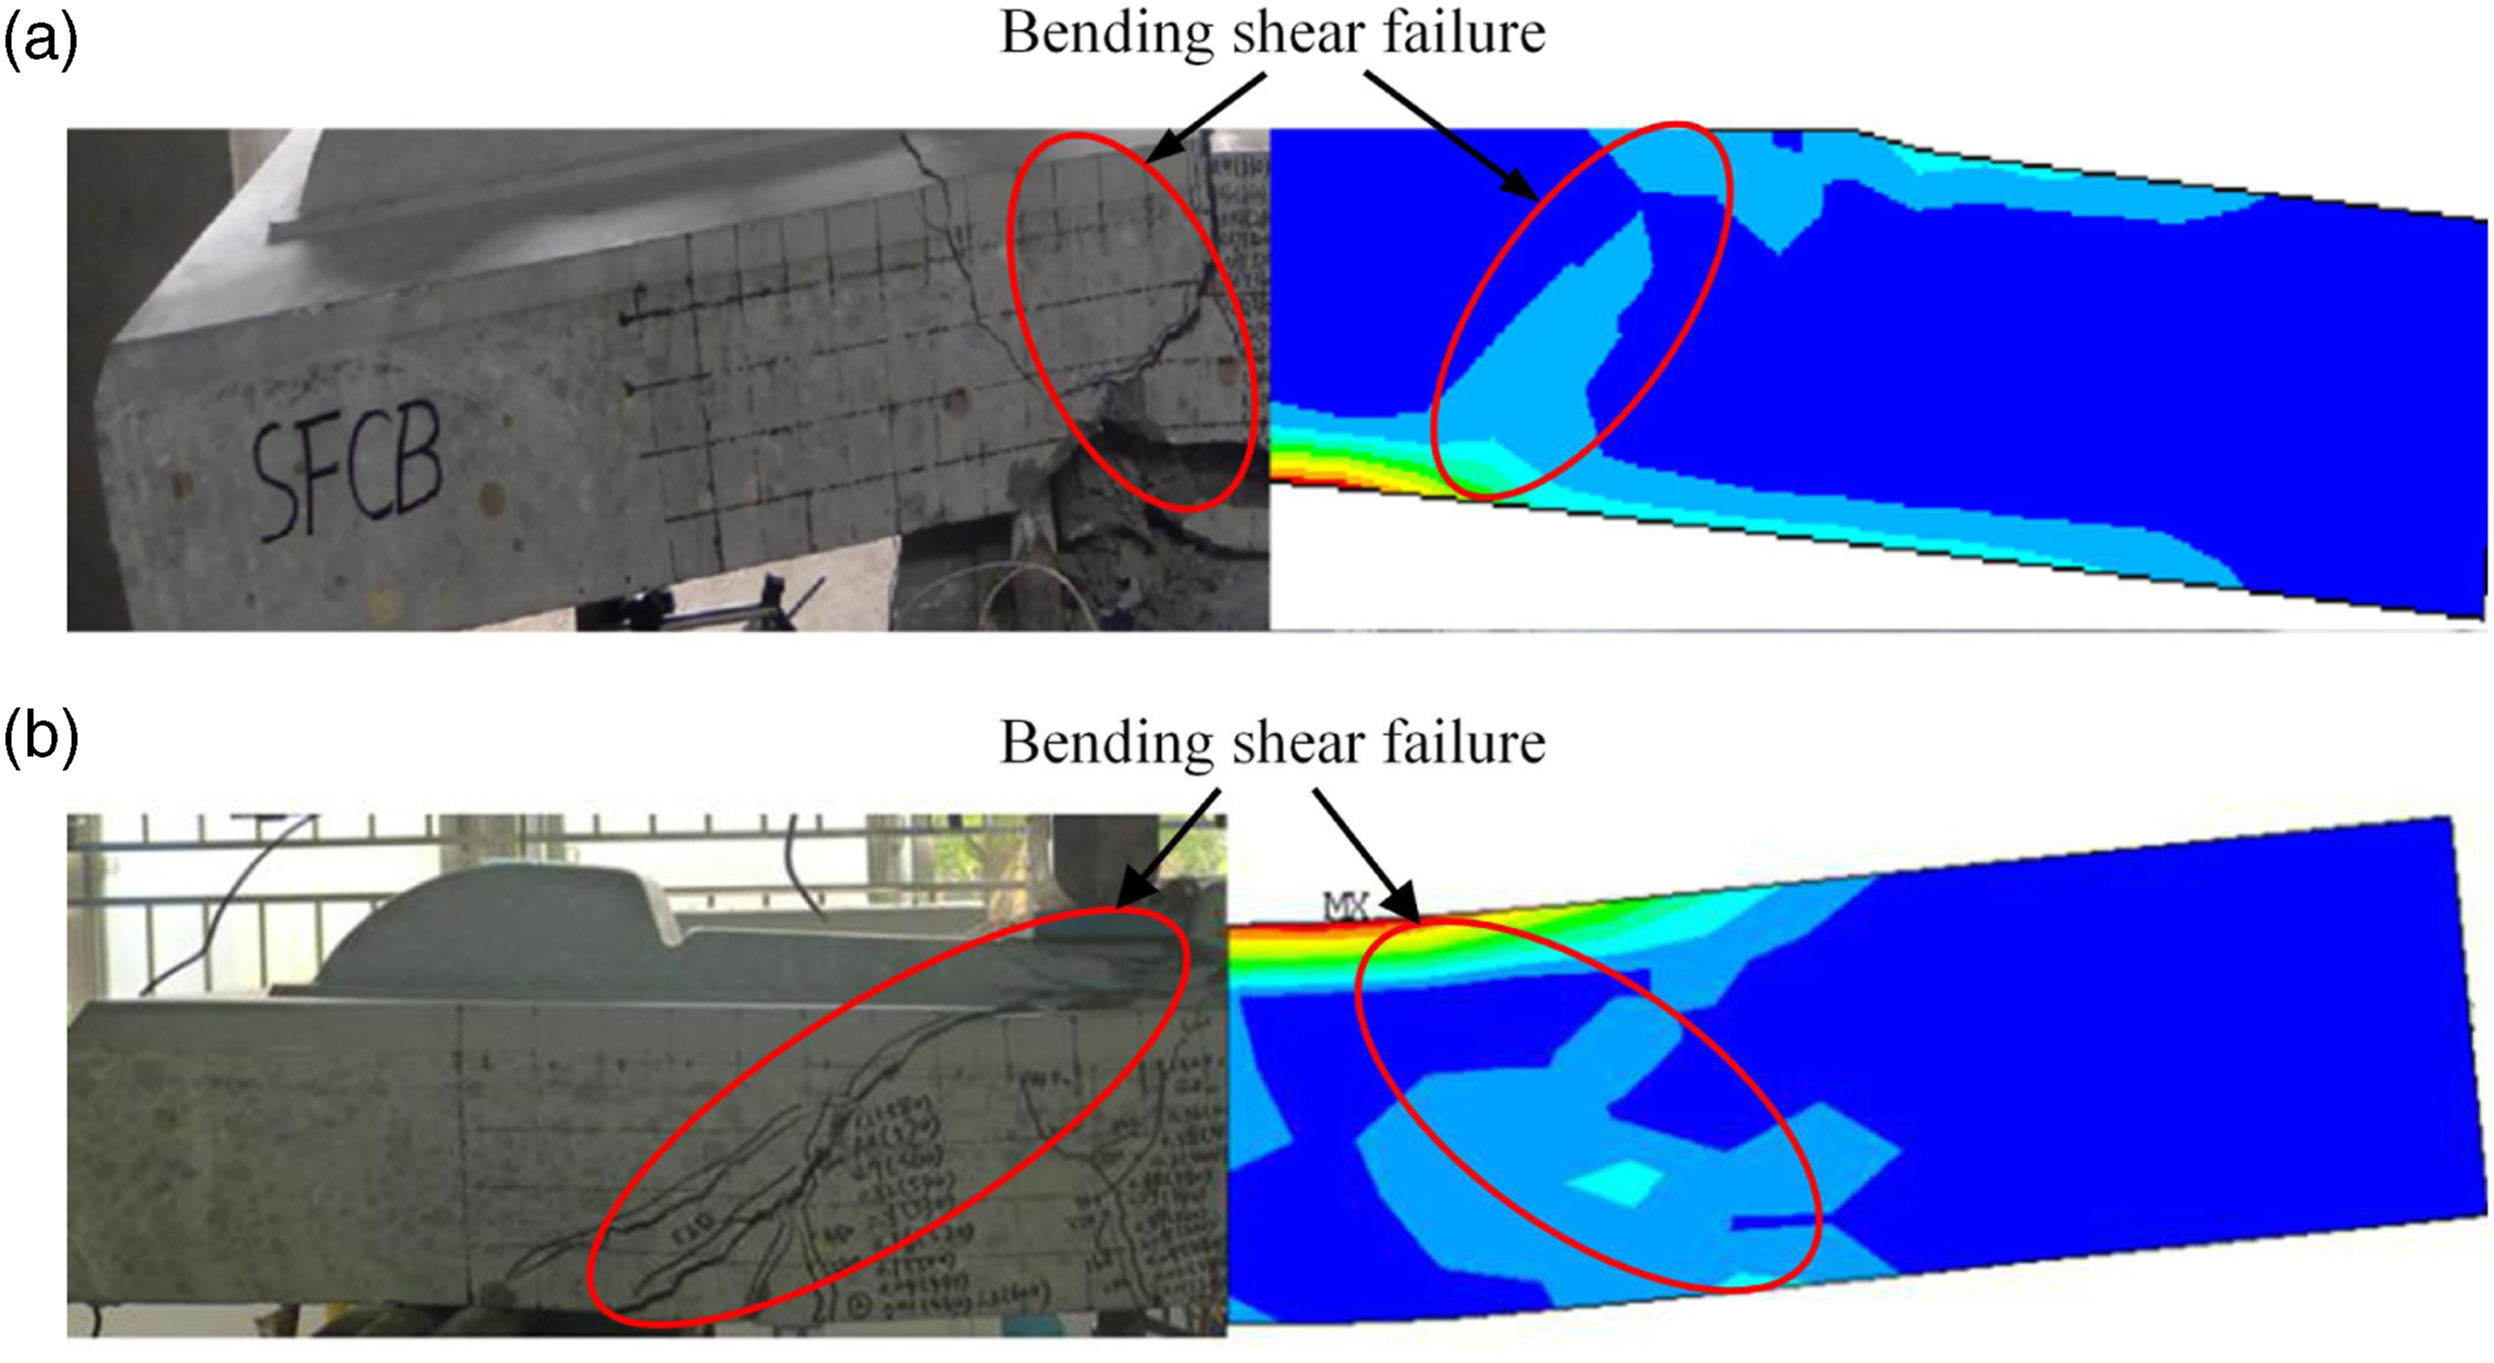
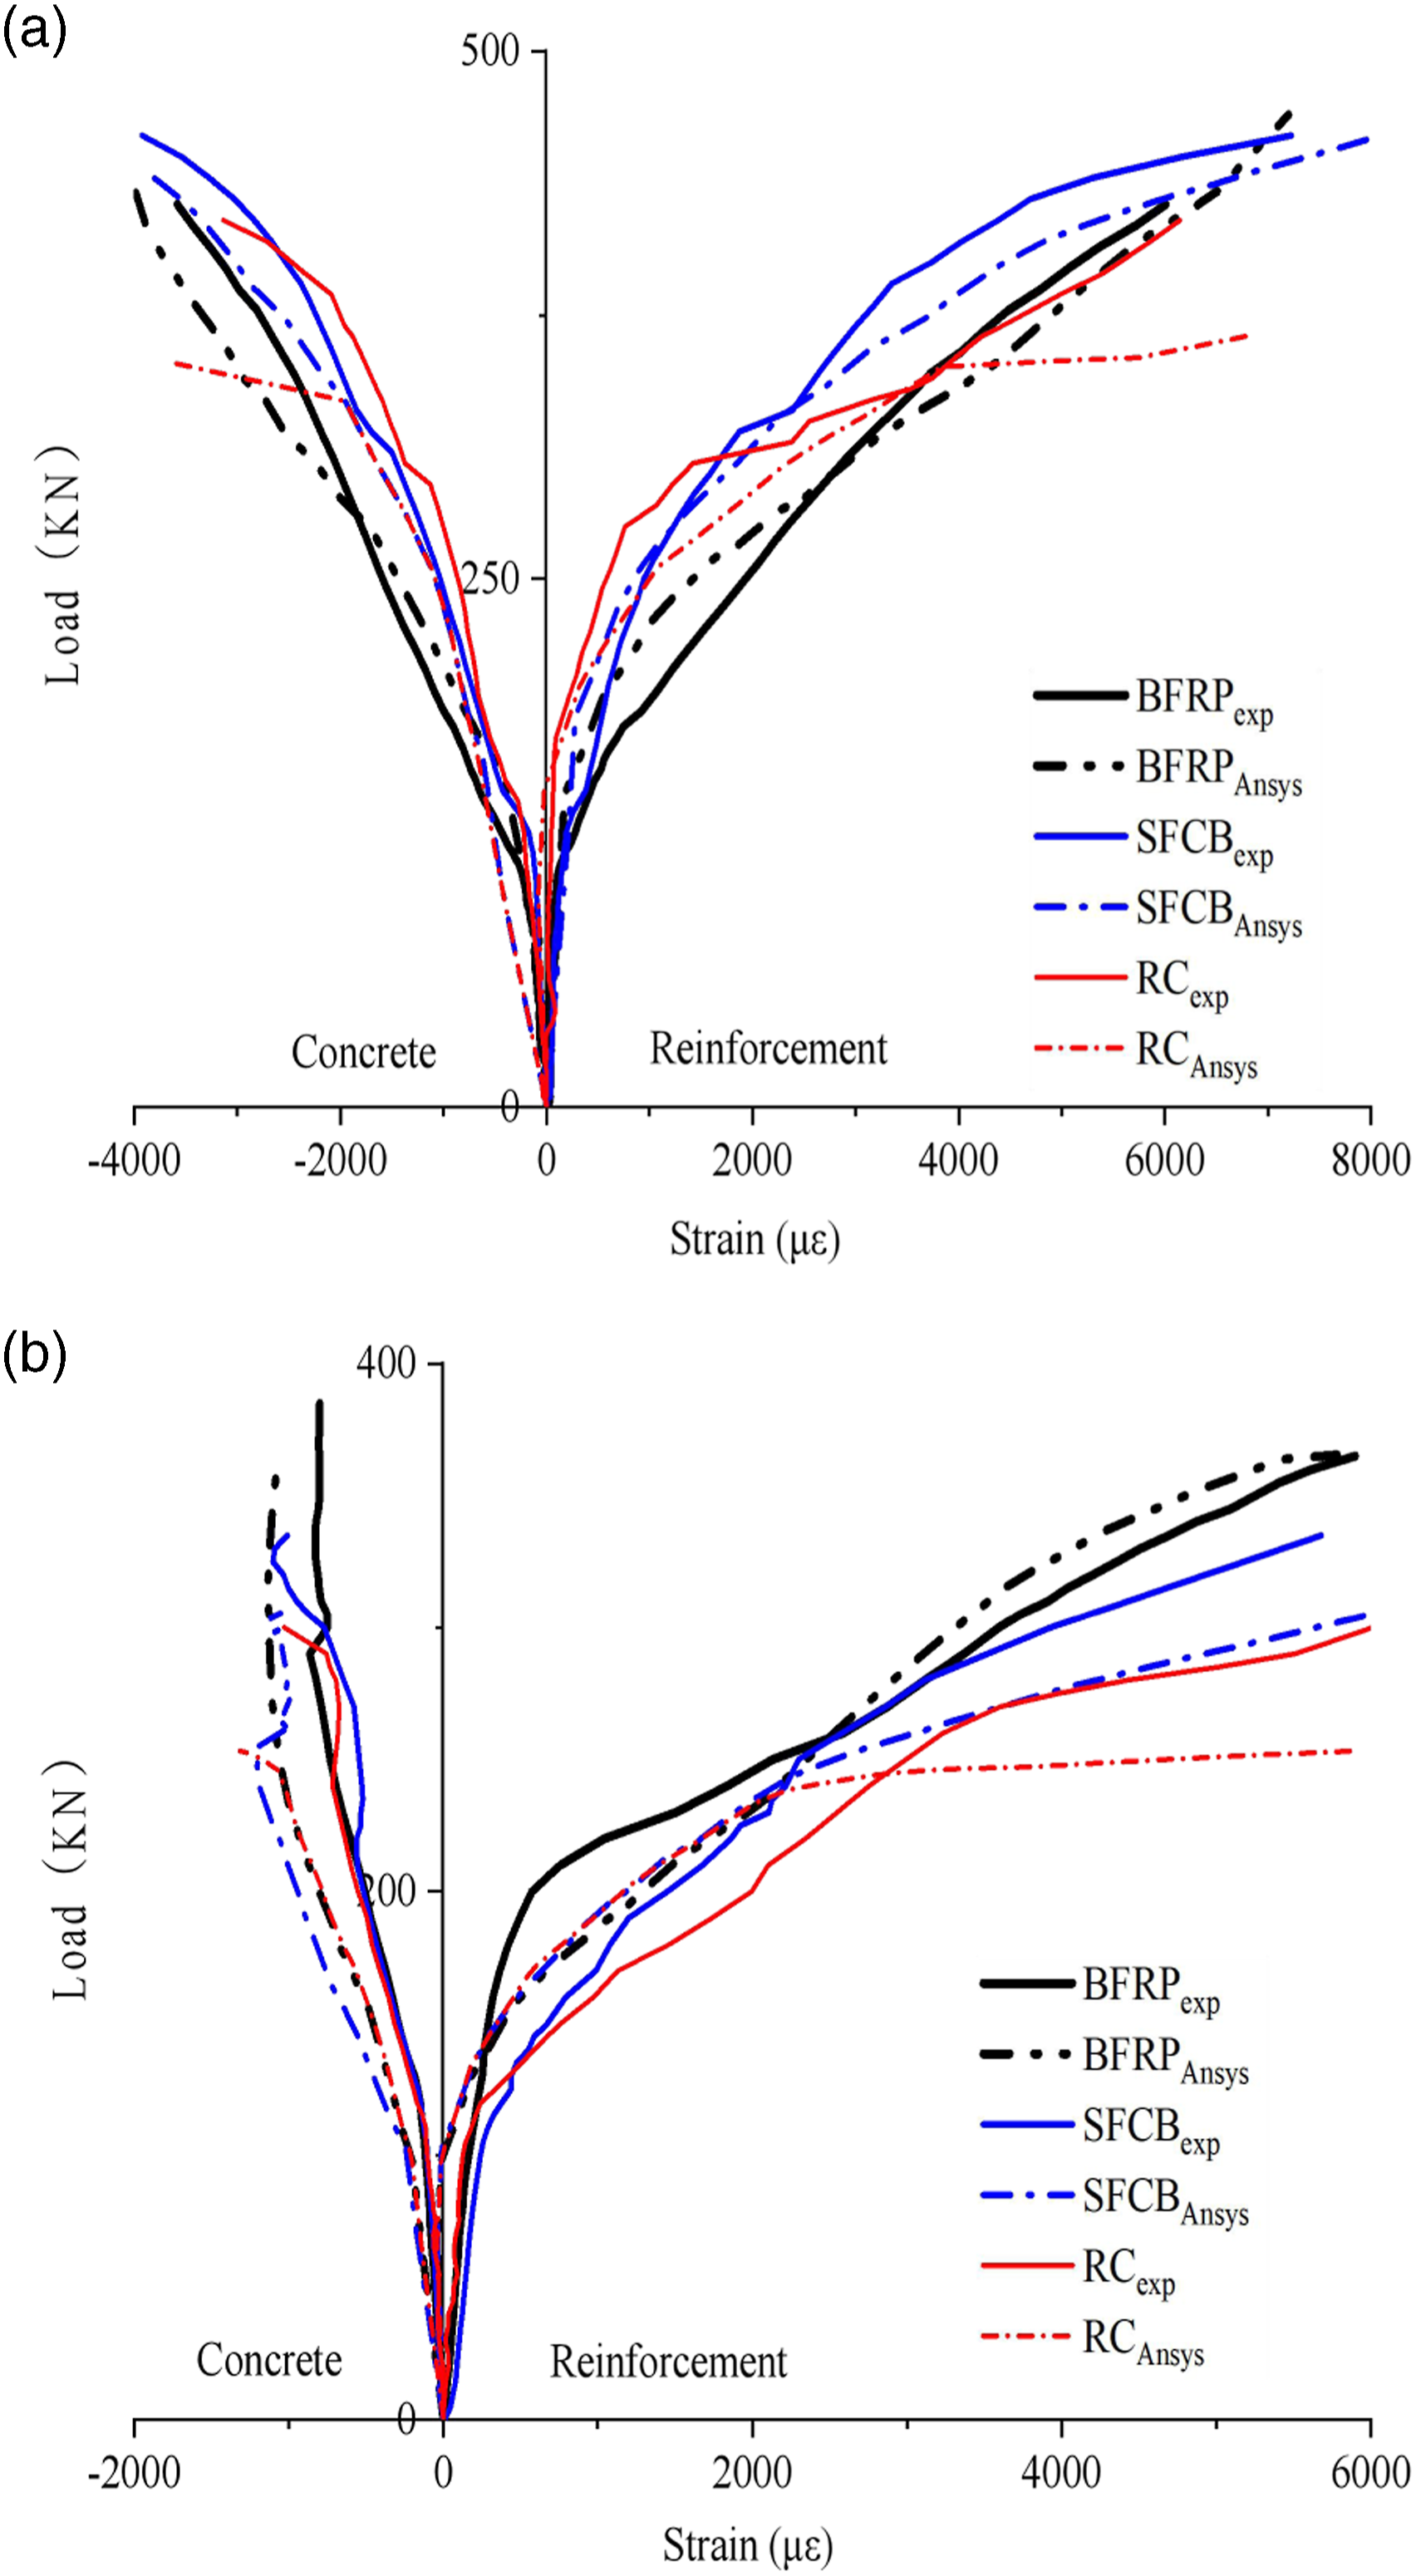
Figure 4 shows the comparisons of load–deflection curves between the FEA calculation and the experimental results. It can be seen from the figure that the effect of changing the reinforcement on the crack load of the track slab is not significant. Due to the linear constitutive relationship of the BFRP (the BFRP slab has no obvious yield point), the curves of the BFRP slab vary linearly after cracking, which is different from the bilinear response of the RC and SFCB slabs. After the SFCB slab reaches the yield point, the post-yield stiffness decreases. However, for RC slabs, after yielding, the FEA model fails to show the hardening section of the reinforcement, so the curve becomes a yield platform with almost no stiffness. Figure 5 also shows the load–strain curves of the reinforcements and the concrete in each specimen, which is consistent with the corresponding deflection development. The maximum deviation between the FEA results and experimental data (including the ultimate bearing capacity, the deflection, and the strain) is less than 10%, indicating that the FEA model and the experimental result are in good agreement. Comparison of load–deflection curves between finite element method and test: (a) series BFRP slabs; (b) series SFCB slabs; (c) series RC slabs. Note: BFRP: basalt-fiber–reinforced polymer; SFCB: steel-fiber–reinforced polymer composite bar; RC: reinforced concrete. Comparison of finite element load–strain and test result: (a) load–strain curves of series S-DR; (b) load–strain curves of series S-SR. Note: S-SR-RC: single rail-platform slab; S-DR: double rail-platform slab.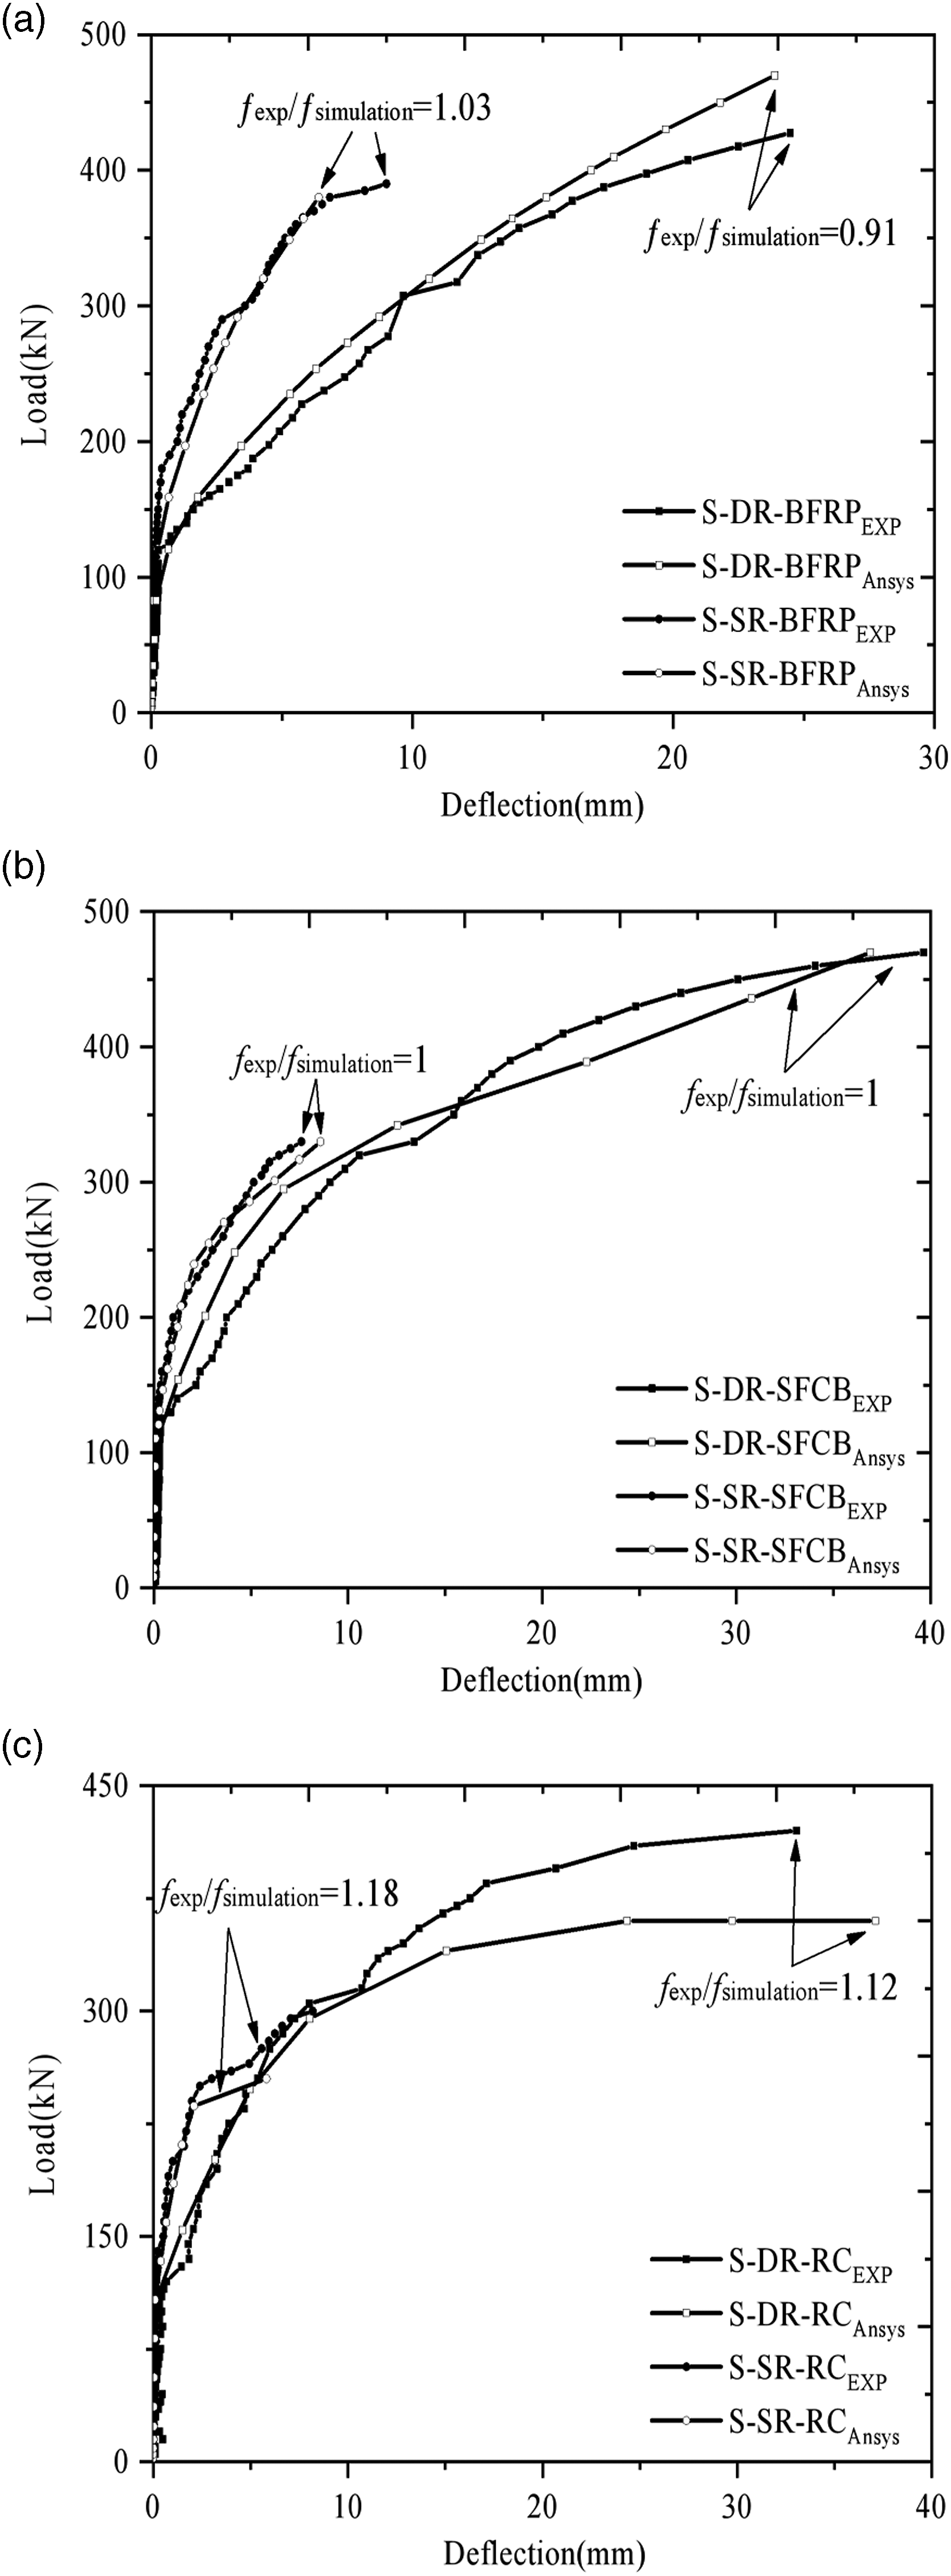
Parameter analysis
A parametric analysis was performed with the FEA model to study the effect of different prestressing degrees, reinforcement ratios, and prestressing materials on the deflection development of ballastless track slabs. Three series of bal lastless track slabs were studied in the FEA model, that is, RC, SFCB, and BFRP slabs. For each series, the load–deflection curve was investigated considering the above parameters.
Prestress degree effect
In the previous test results (Yang et al., 2016), the initial stiffnesses (Ig/Icr ranged from 12.03 to 13.2) of the ballastless track slabs were almost the same due to the same equivalent reinforcement ratio (approximately 0.41%), and the prestress level of the ballastless track slab in the test was only 0.54 Pu. In this article, four prestressing degrees (0, 0.125, 0.33, and 0.5 Pu) were considered to investigate the deflection of ballastless track slabs in the FEA models. To study the prestress level effect, the initial prestress can be applied to the FEA model of the ballastless track slab, as previously illustrated. Song et al. (2015) studied the effects of applied load level and severity of fatigue damage on the fatigue and post-fatigue monotonic behavior of partially prestressed concrete beams. The results indicated that the fatigue behavior of beams with a high degree of prestress was dependent on the applied load level. Rezazadeh et al. (2014) evaluated the influence of the prestress levels on the flexural behavior of reinforced concrete beams. The results showed that applying a prestress force increased the load-carrying capacity corresponding to the limitation of the concrete cracking and steel yielding.
Figure 6(a)–(c) shows that (1) a “shift” can be observed in the load–deflection curves, indicating that the cracking loading is governed by the prestress level. For example, the cracking loading increases by 12.5% Pu as the prestress level increases by 25.23% in the RC series slabs. After adjusting the prestress level to 33% Pu, the cracking load increases by 82.72%. (2) After cracking, it is obvious that the slopes of the load–deflection curves are parallel to each other, which shows that the stiffnesses of the specimens are unchanged and independent of the prestress level. (3) At the end of the curves, the maximum deflection increases with the decrease in the prestress level, which is in proportion to the prestress level of the specimens. For example, the maximum deflection decreases by 52.65% as the prestress level increased by 50% Pu in the RC series slabs; however, this value is 14.31% in the SFCB series slab when increased by the same prestressed level, but the ultimate bearing capacity of the specimens does not significantly change for all the simulated specimens (dependent of the concrete strength). Influence of different prestress degree on the mid-span vertical deflection of each slab: (a) S-SR-RC; (b) S-SR-SFCB; (c) S-SR-BFRP. Note: S-SR-RC: single rail-platform slab-reinforced concrete; S-SR-SFCB: single rail-platform slab-steel-fiber–reinforced polymer composite bar; S-SR-BFRP: single rail-platform slab-basalt-fiber–reinforced polymer.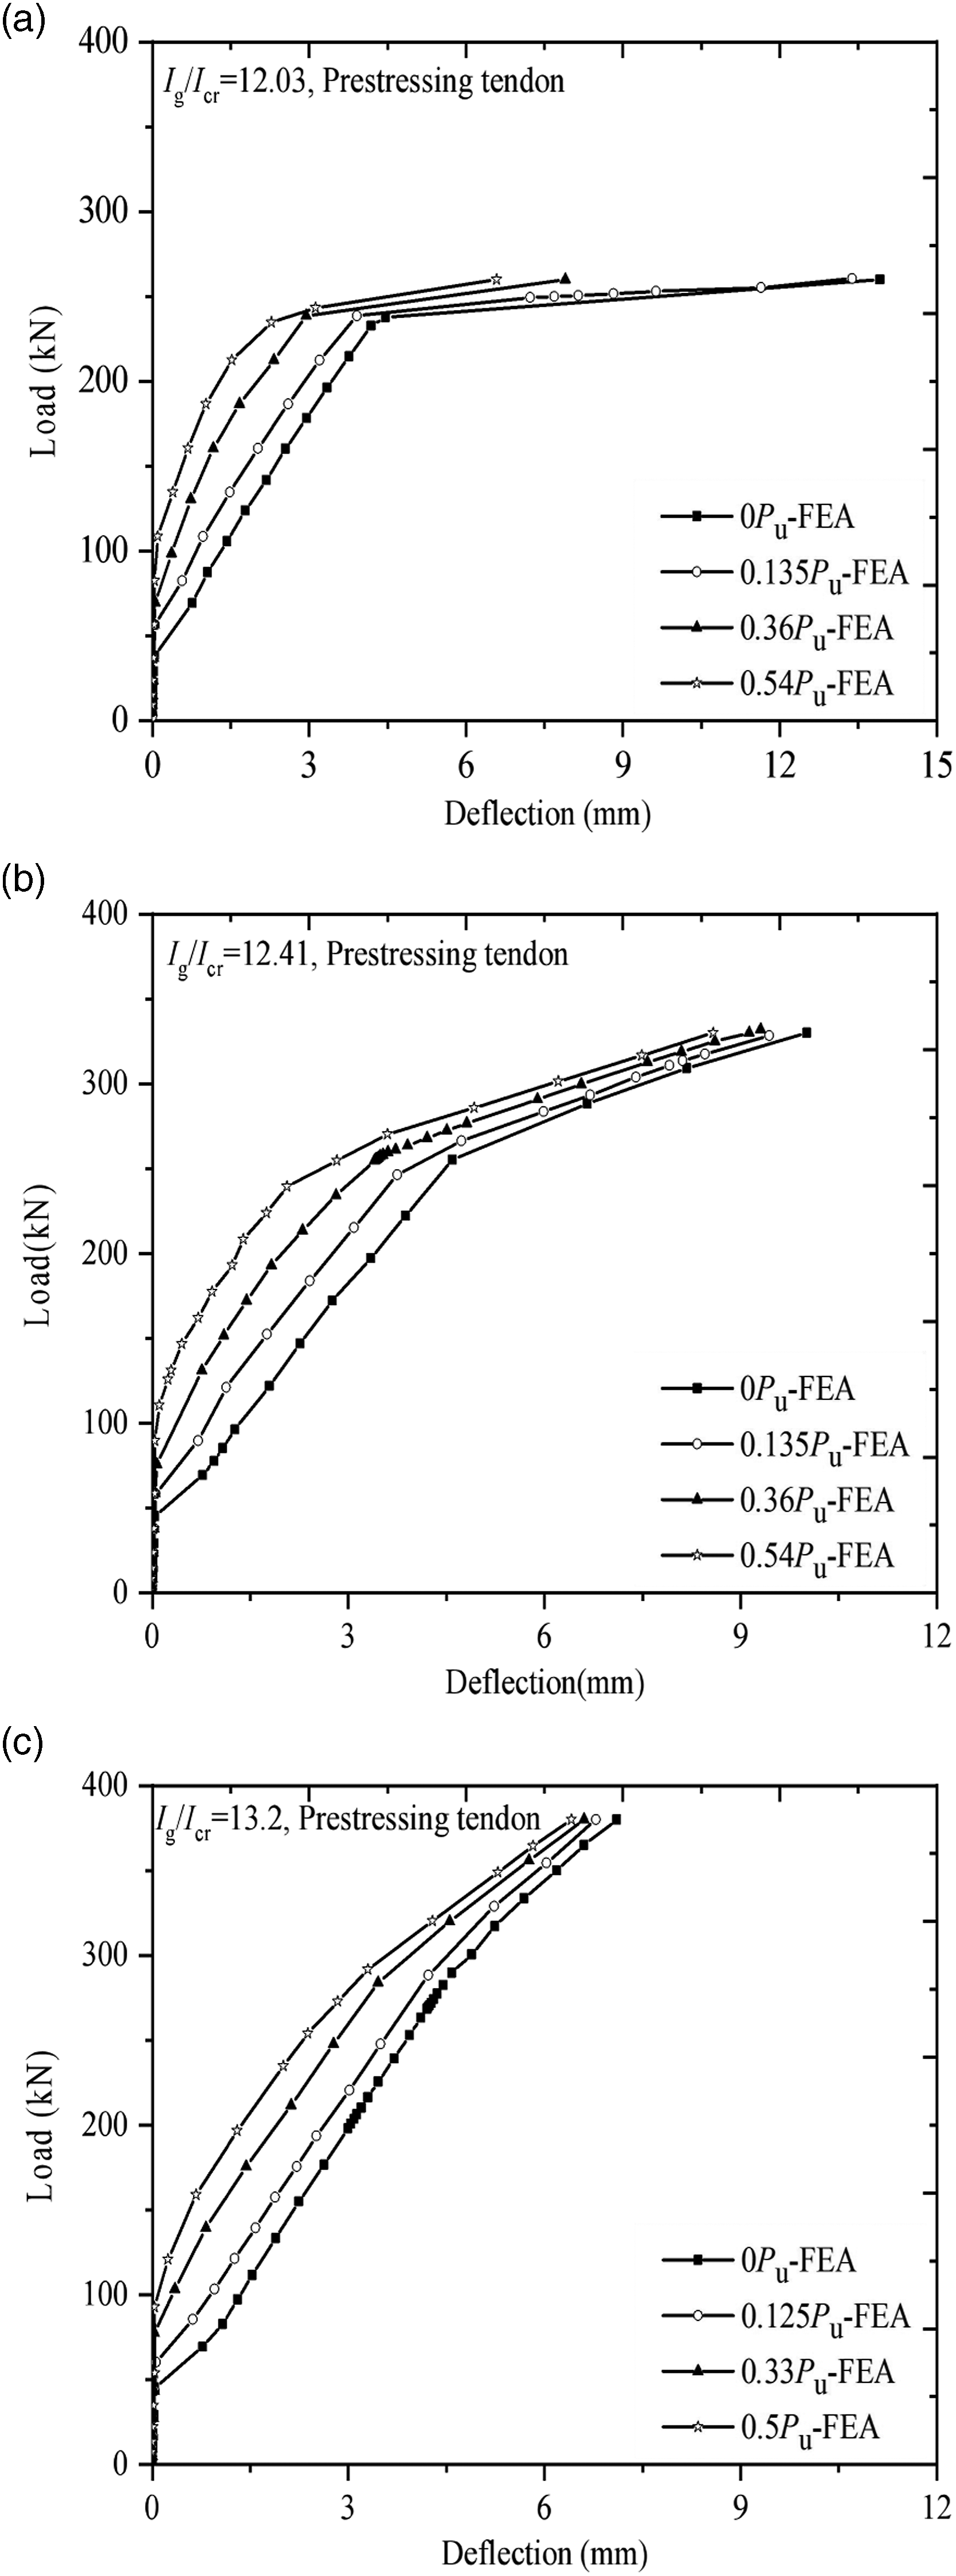
Effect of the reinforcement ratio
Nominal properties of materials.
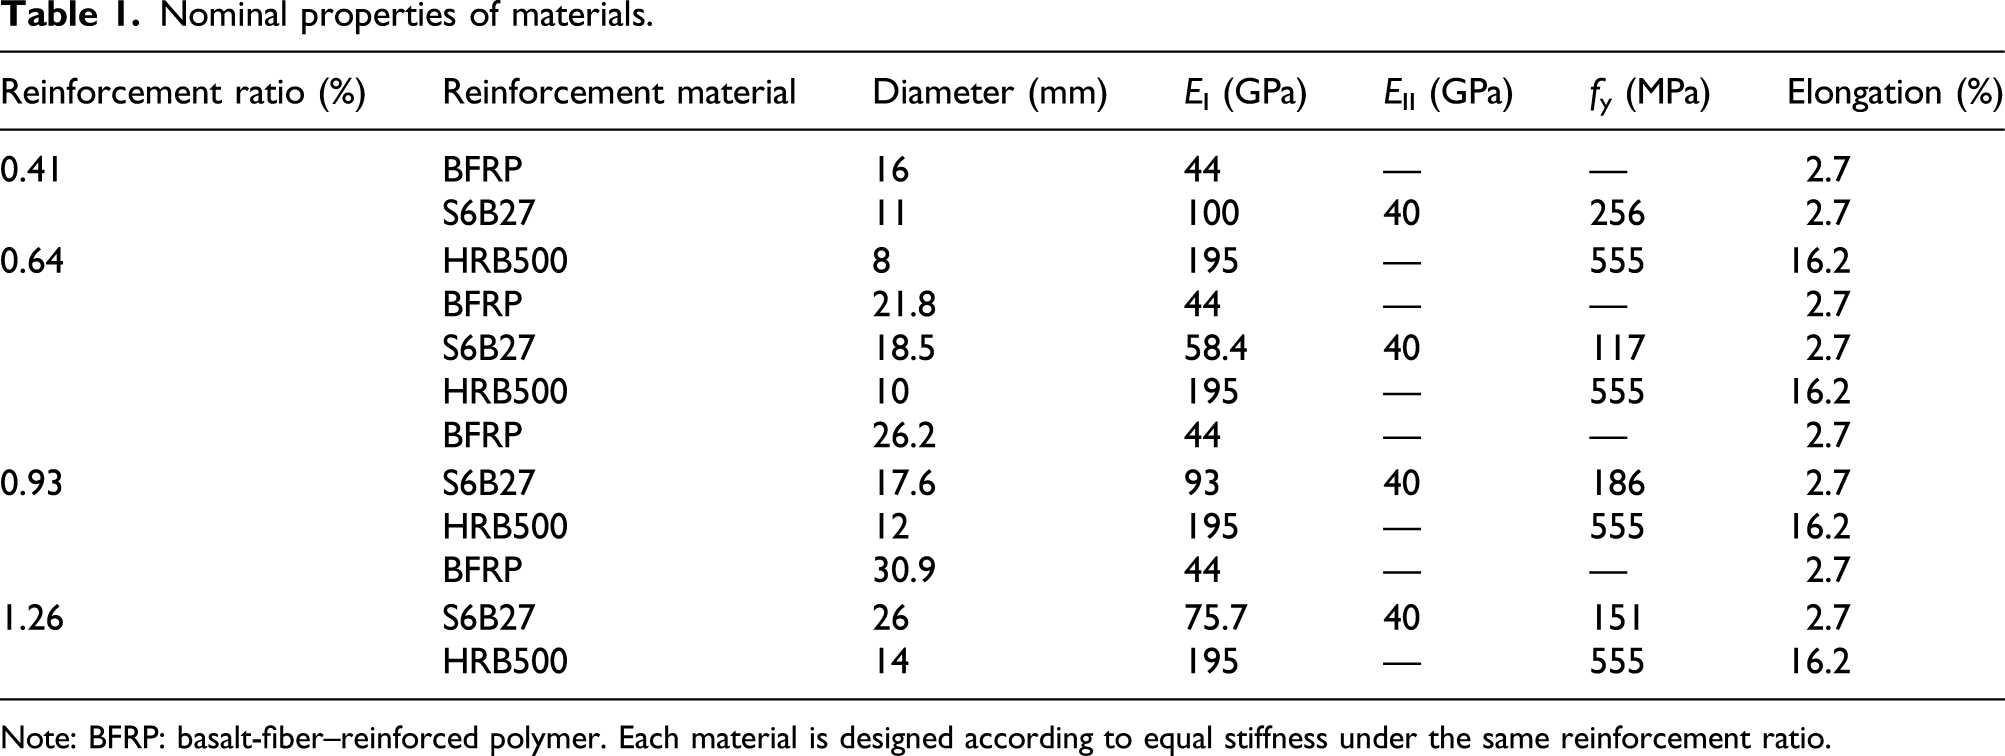
Note: BFRP: basalt-fiber–reinforced polymer. Each material is designed according to equal stiffness under the same reinforcement ratio.
Figure 7 shows the load–deflection curve of each specimen with the same 50% Pu prestress level. It can be found that (1) the cracking loads of the members were close to each other and were independent of the reinforcement ratio; (2) the stiffness and the ultimate capacity increased with increasing reinforcement ratio, but the maximum deflection decreased. A higher reinforcement ratio resulted in a greater stiffness but a smaller deformation. For example, the carrying capacity increased by 9.49%, whereas the deformation decreased by 22.13% as the reinforcement ratio increased to 0.64% in the RC series slab. This phenomenon was mainly due to the increased ratio of the gross inertia moment Ig and cracking inertia moment Icr; and (3) the decrease in the ultimate displacement was limited as the reinforcement ratio increased. Although the reinforcement ratio increased from 0.64% to 1.26%, only 9.86% of the deformation decreased for the RC slab. The same conclusion can be found for the SFCB and BFRP series slabs. Influence of different reinforcement ratio on the mid-span vertical deflection of each slab: (a) S-SR-RC; (b) S-SR-SFCB; (c) S-SR-BFRP. Note: S-SR-RC: single rail-platform slab-reinforced concrete; S-SR-SFCB: single rail-platform slab-steel-fiber–reinforced polymer composite bar; S-SR-BFRP: single rail-platform slab-basalt-fiber–reinforced polymer.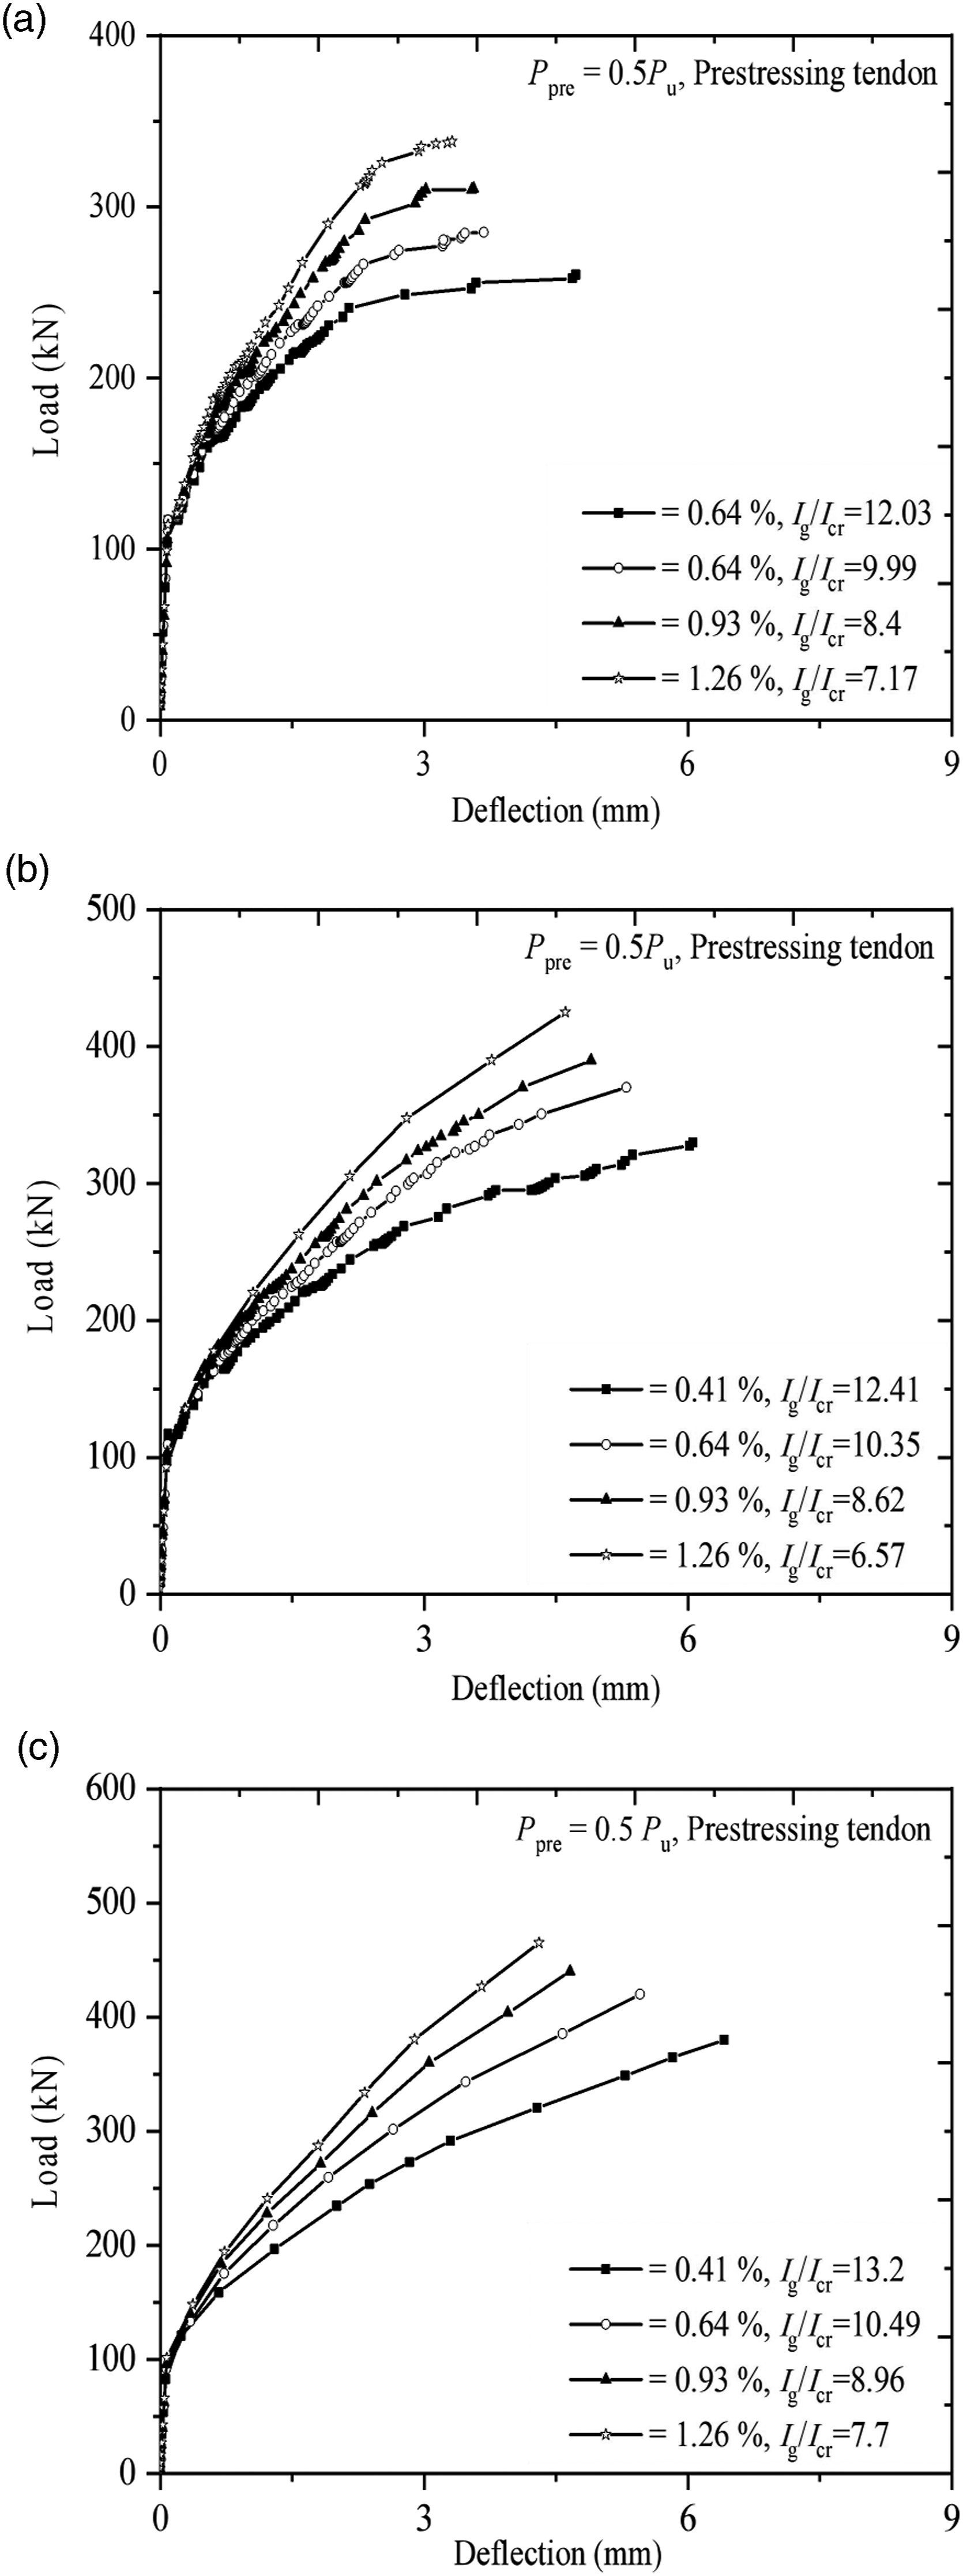
Effect of different prestressed tendons
Properties of prestressed materials.
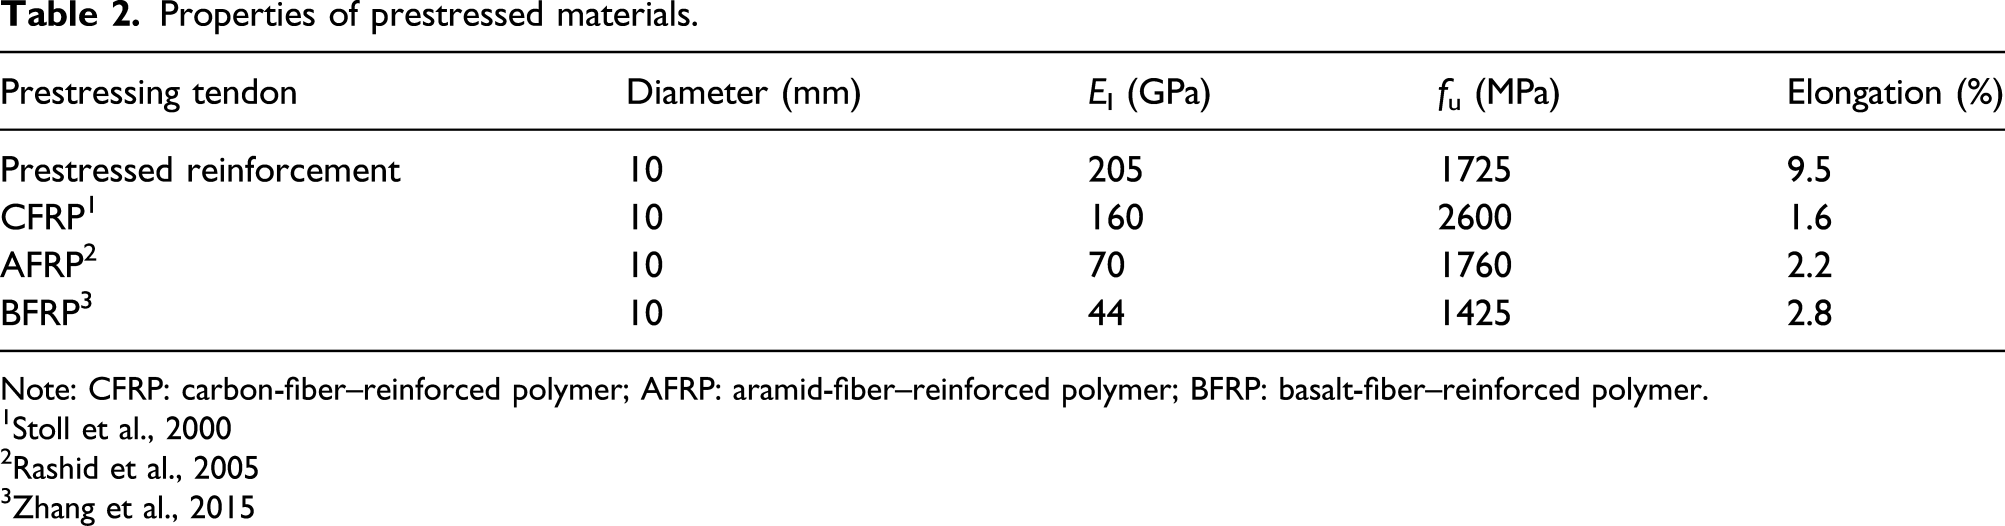
Note: CFRP: carbon-fiber–reinforced polymer; AFRP: aramid-fiber–reinforced polymer; BFRP: basalt-fiber–reinforced polymer.
Figure 8 shows the load–deflection curve of each specimen with four different prestressing tendons. (1) Although the largest stiffness was observed for the specimens using prestressed steel bars, this specimen exhibited the lowest bearing capacity in each series due to the bilinear constitution of the specimen. (2) There is a clear correlation between the deformation and the type of FRP prestressed tendons. A higher elastic modulus of the FRP tendons in the specimens results in a smaller deformation because the stiffness of the specimens varies with the ratio of the gross inertia moment Ig and cracking inertia moment Icr due to the different elastic moduli. For example, the deformation of the RC-BFRP slab increases by 55.35% as the elastic modulus decreases by 72.5% compared to that of the RC-CFRP slab. (3) The FRP prestressed member has almost the same ultimate capacity, indicating that the capacity was independent of the prestressing materials because the same flexural-shear failure mode is observed for all the specimens and the strength of the reinforcement cannot be fully utilized. Influence of different prestressing tendons on the mid-span vertical deflection of each slab: (a) S-SR-RC; (b) S-SR-SFCB; (c) S-SR-BFRP. Note: S-SR-RC: single rail-platform slab-reinforced concrete; S-SR-SFCB: single rail-platform slab-steel-fiber–reinforced polymer composite bar; S-SR-BFRP: single rail-platform slab-basalt-fiber–reinforced polymer.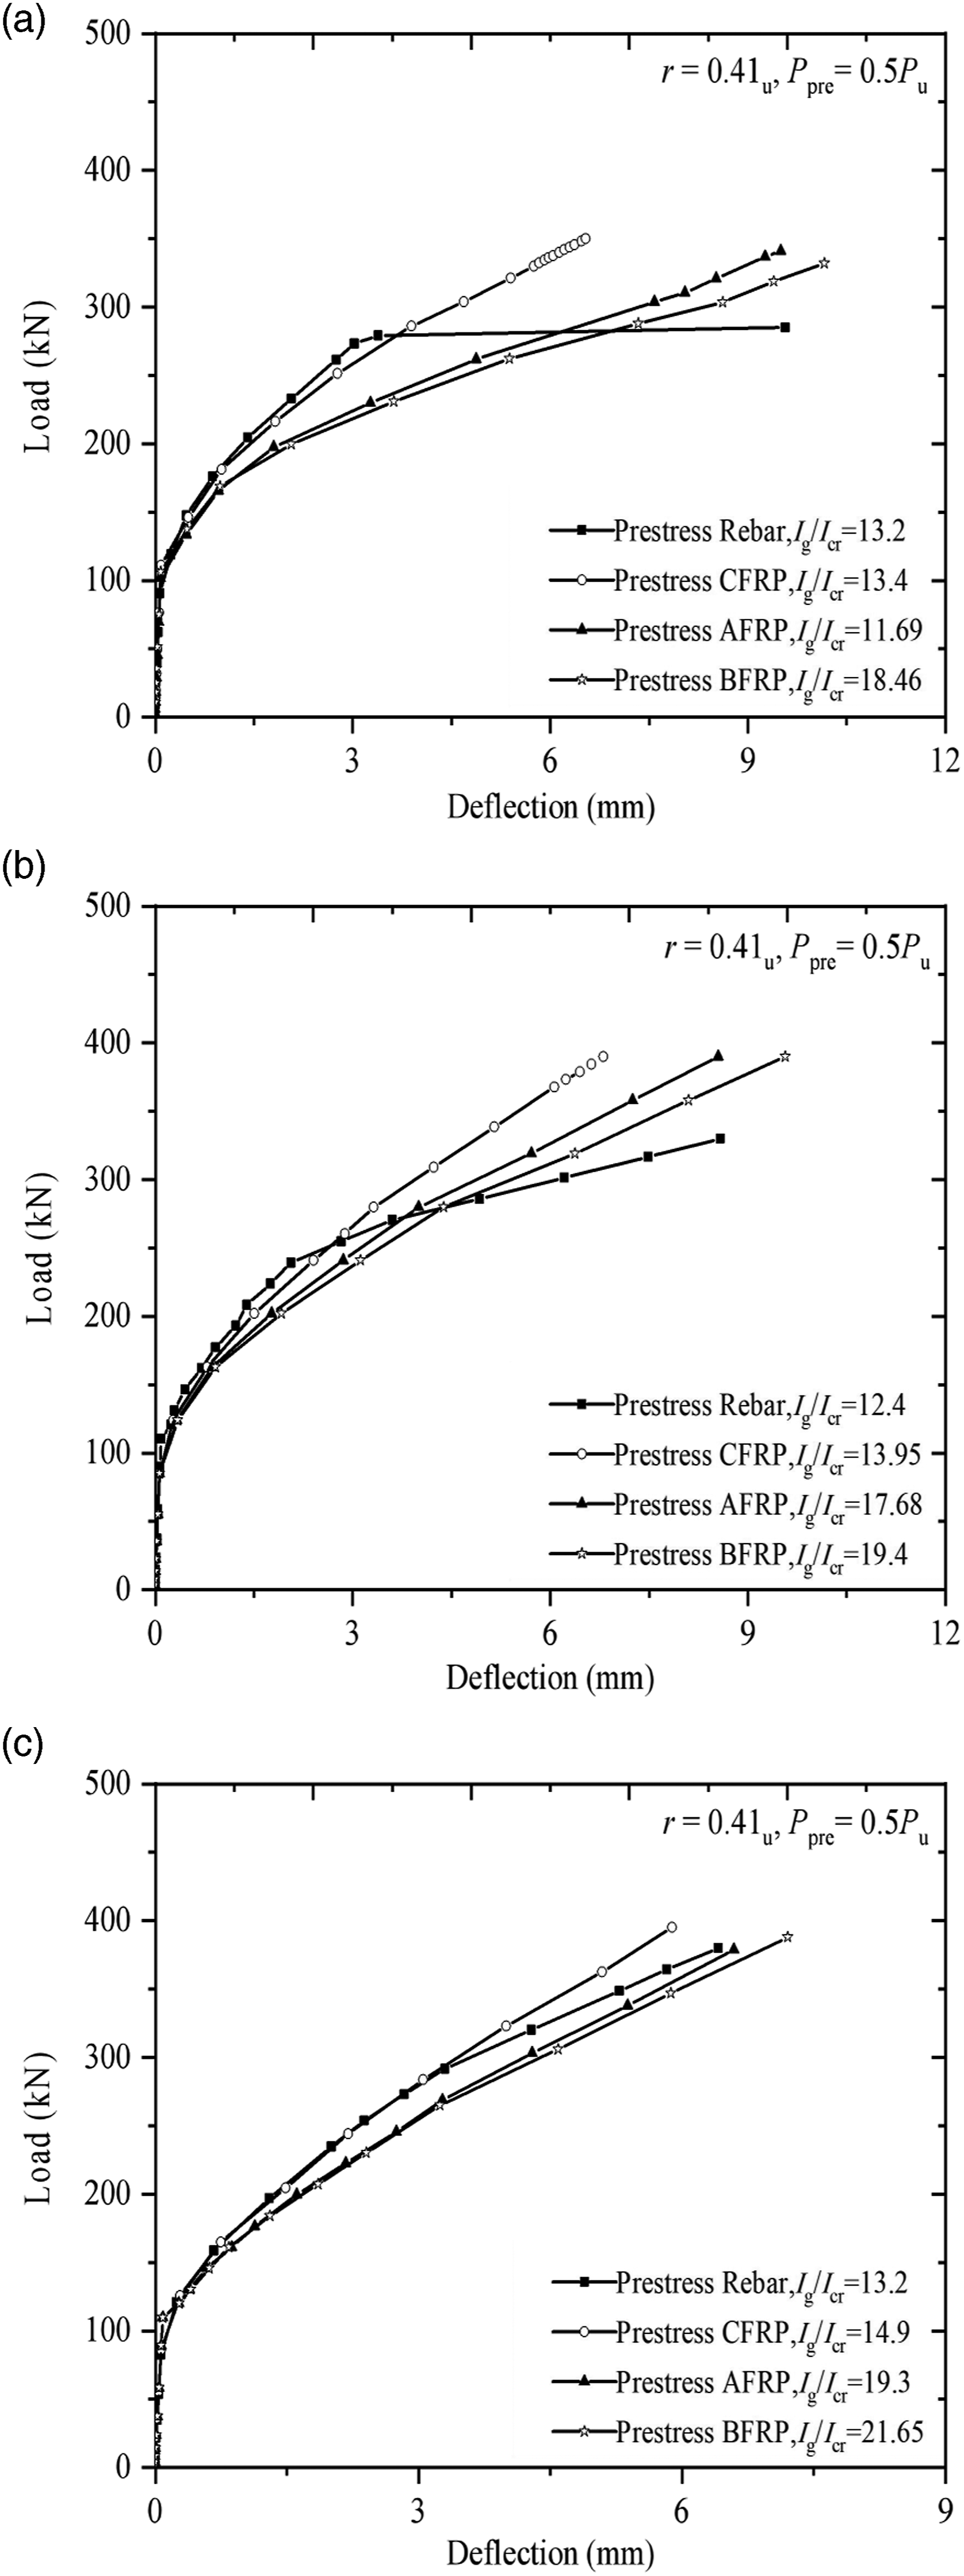
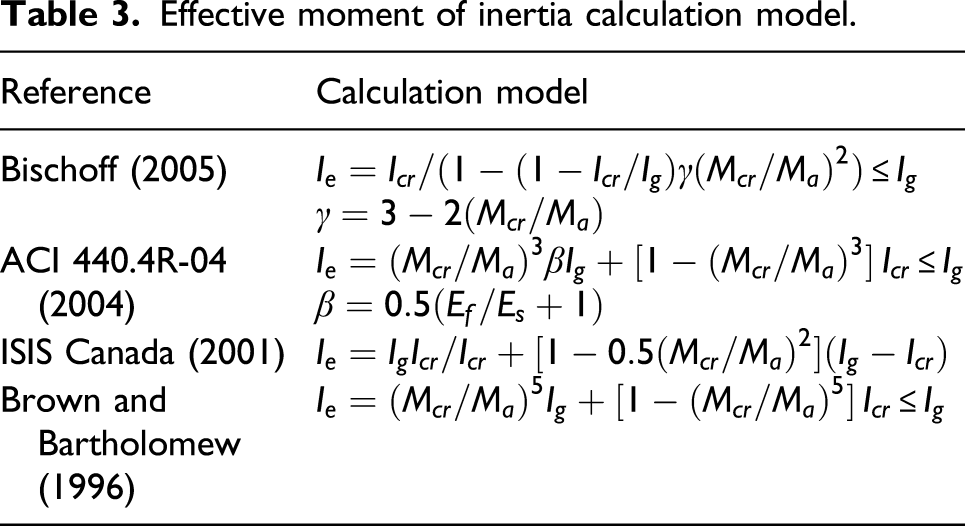
Comparative analysis of different specifications
Effective moment of inertia calculation model.
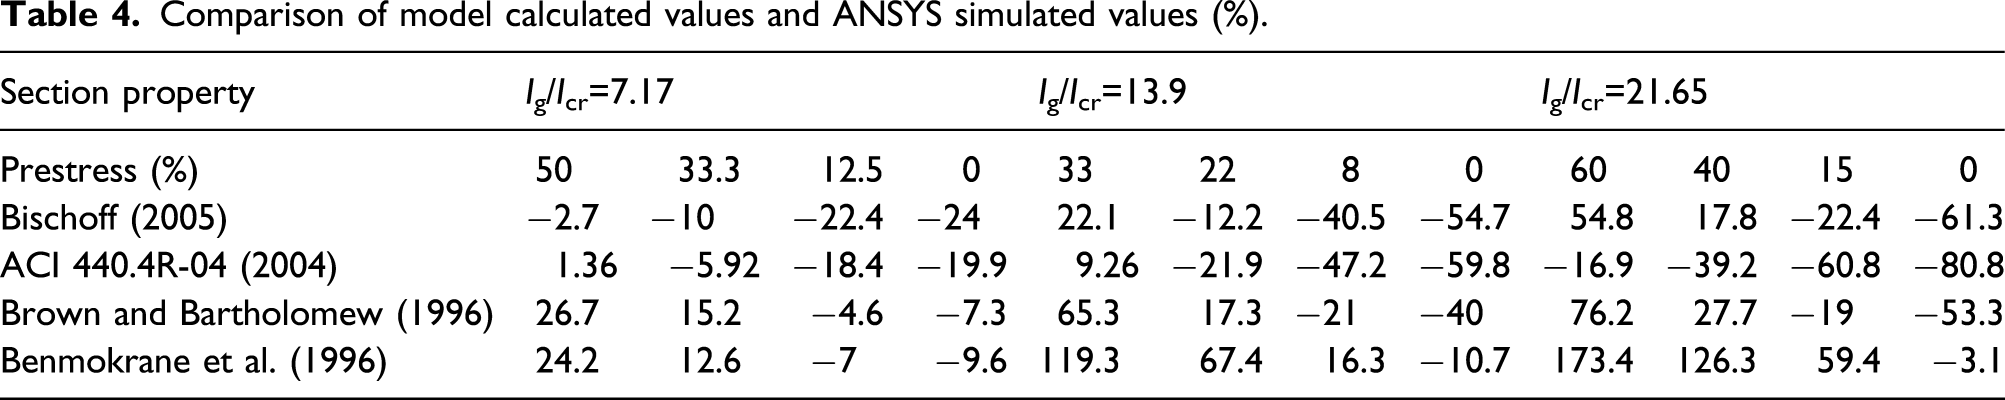
Comparison of model calculated values and ANSYS simulated values (%).
Figures 9–11 show the comparison of the load–deflection curve of typically selected specimens between the FEA result and the normally used code, which ranged from 7.17 to 21.65. Figure 9 shows the load–deflection curve of the RC specimen (Ig/Icr =7.17) reinforced with steel bars and prestressed steel bars. The Bischoff (2005) and ACI 440.4R-04 (2004) calculations agree with the simulated values at the prestress level of 50% Pu, and the Benmokrane et al. (1996) and the Brown and Bartholomew (1996) are overestimated by 26% and 24%, respectively. However, as the prestress level decreases, the FEA results gradually approach the Benmokrane et al. (1996) and Brown and Bartholomew (1996), especially at the prestress level of 12.5% Pu. When the prestress level is reduced to 0, the FEA result is closer to the Benmokrane et al. (1996); meanwhile, the Bischoff (2005) and the ACI 440.4R-04 (2004) calculations are underestimated by 22% and 20%, respectively. Load–deflection curve of specimens with Ig/Icr=7.17: (a) 50% prestress level; (b) 33% prestress level; (c) 12.5% prestress level; (d) 0% prestress level. Load–deflection curve of specimens with Ig/Icr=13.9: (a) 33% prestress level; (b) 22% prestress level; (c) 8% prestress level; (d) 0% prestress level. Load–deflection curve of specimens with Ig/Icr=21.65: (a) 60% prestress level; (b) 40% prestress level; (c) 15% prestress level; (d) 0% prestress level.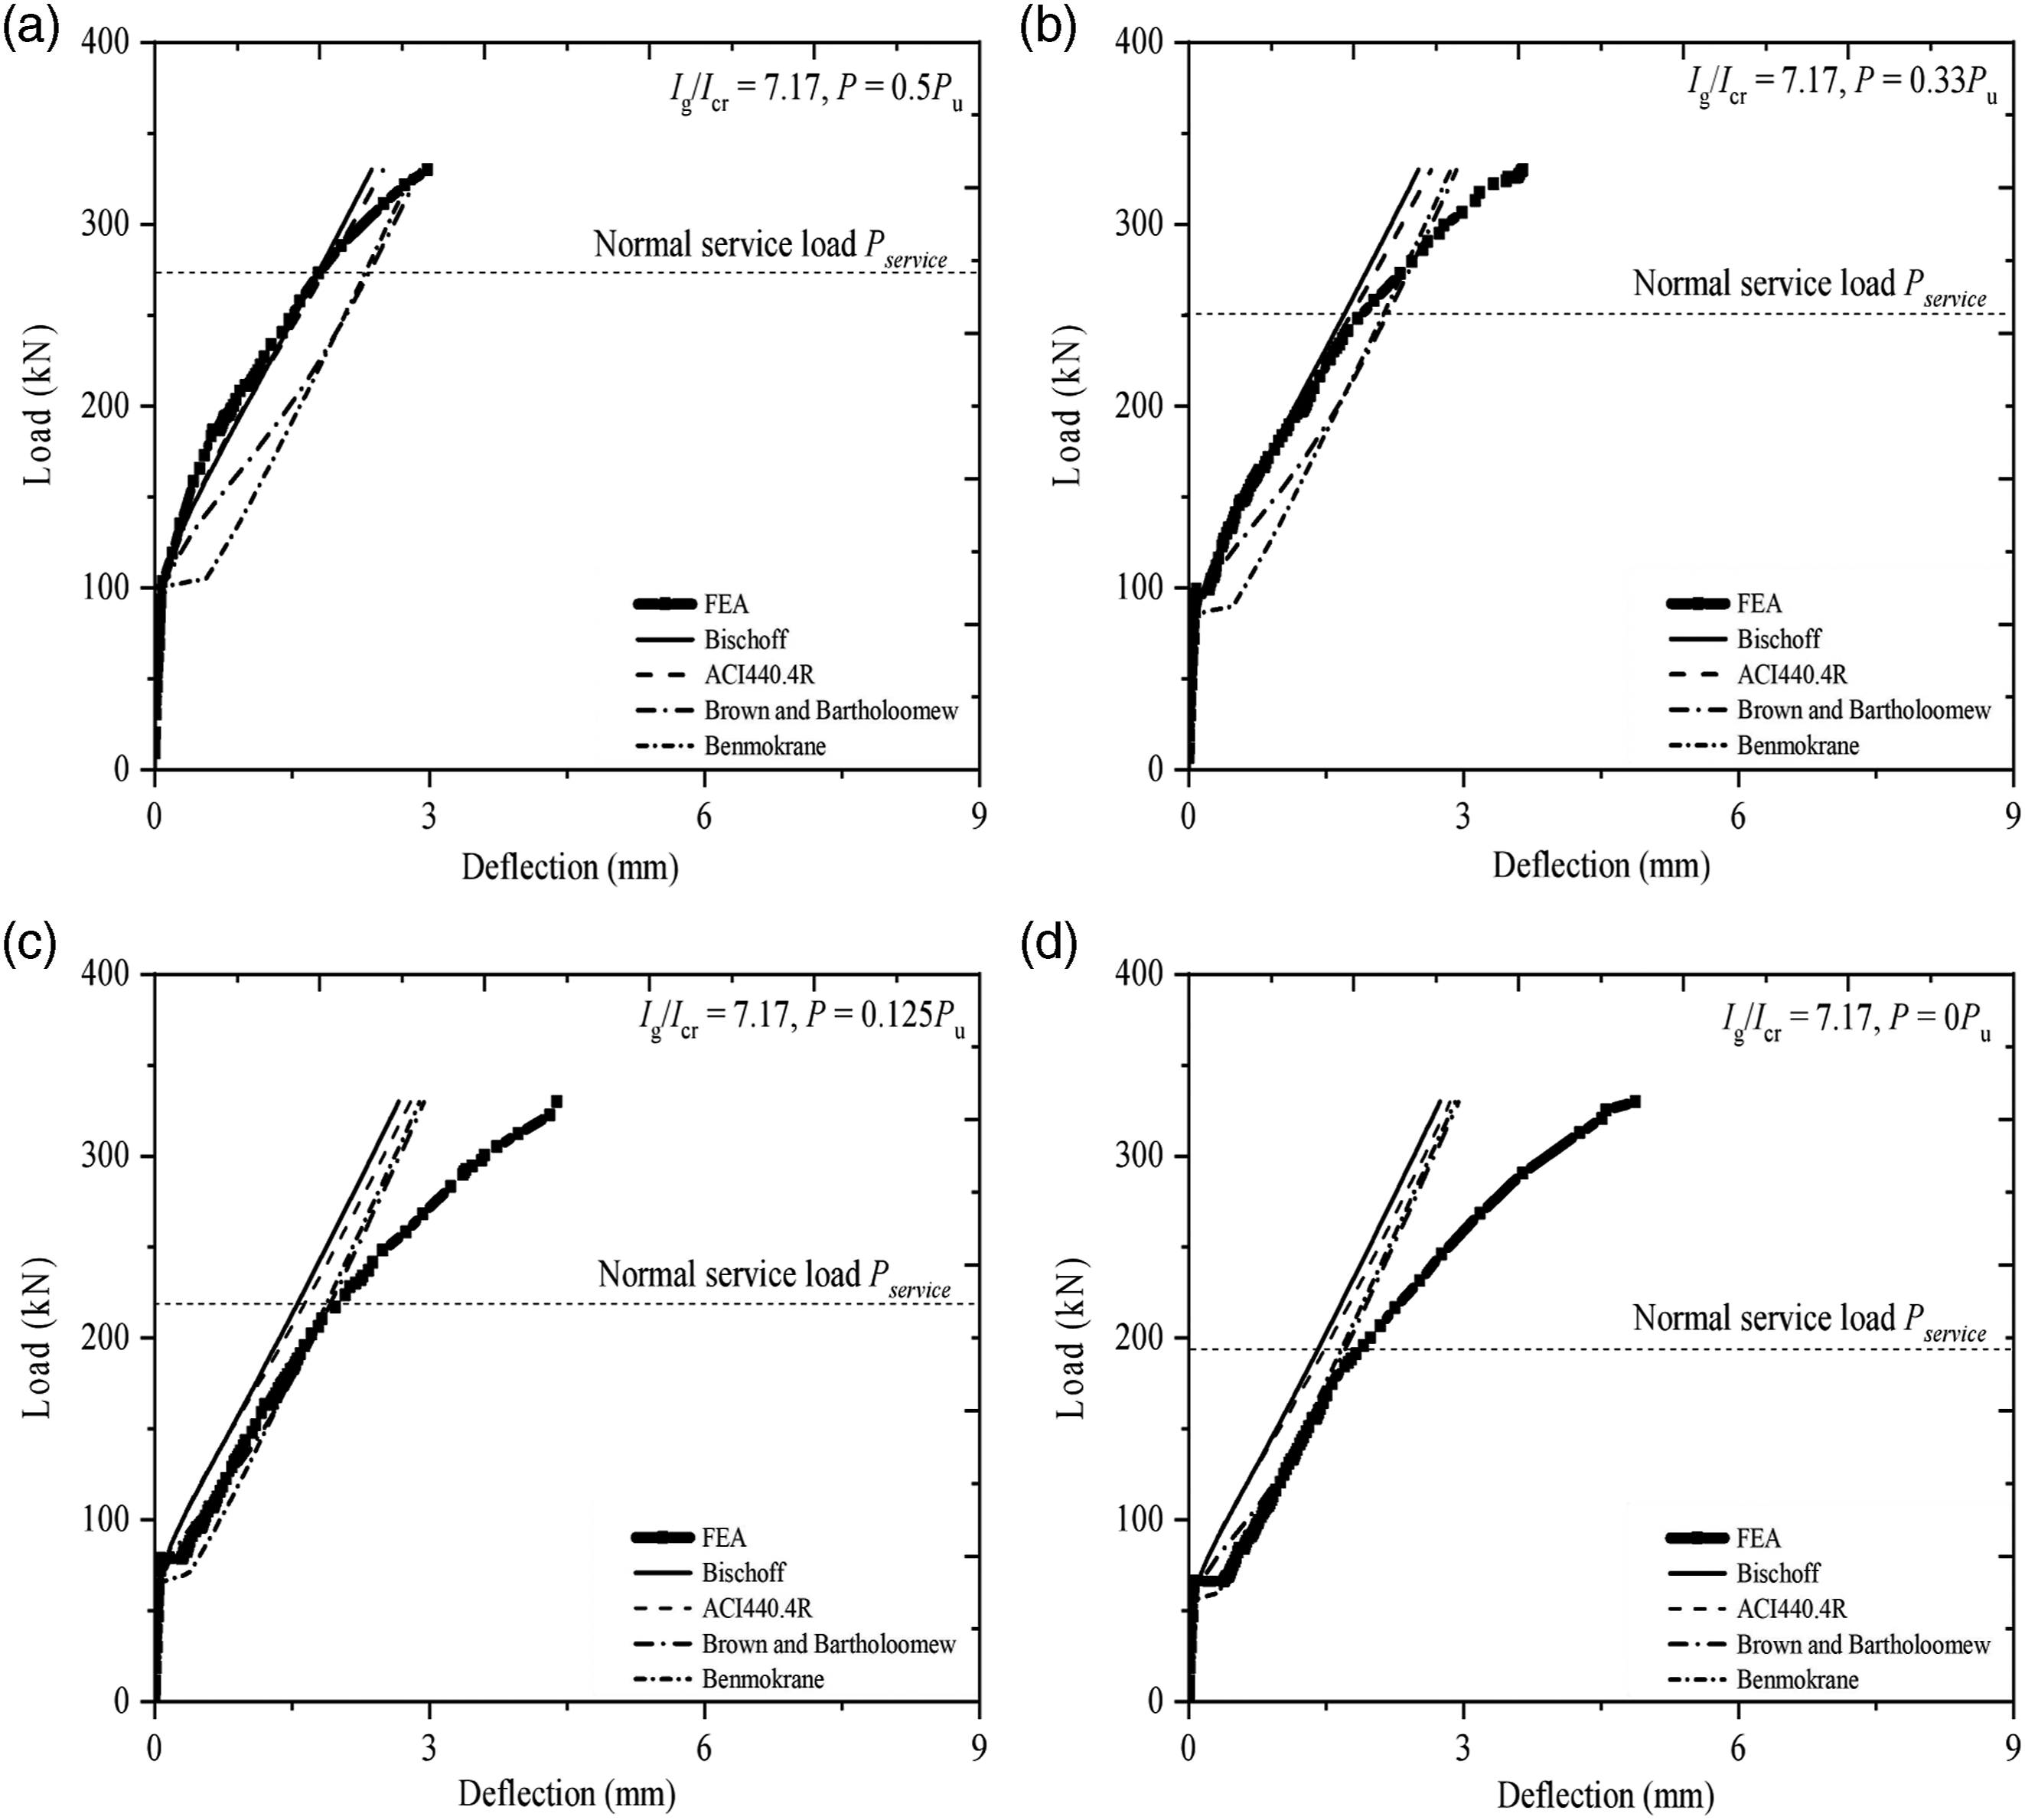
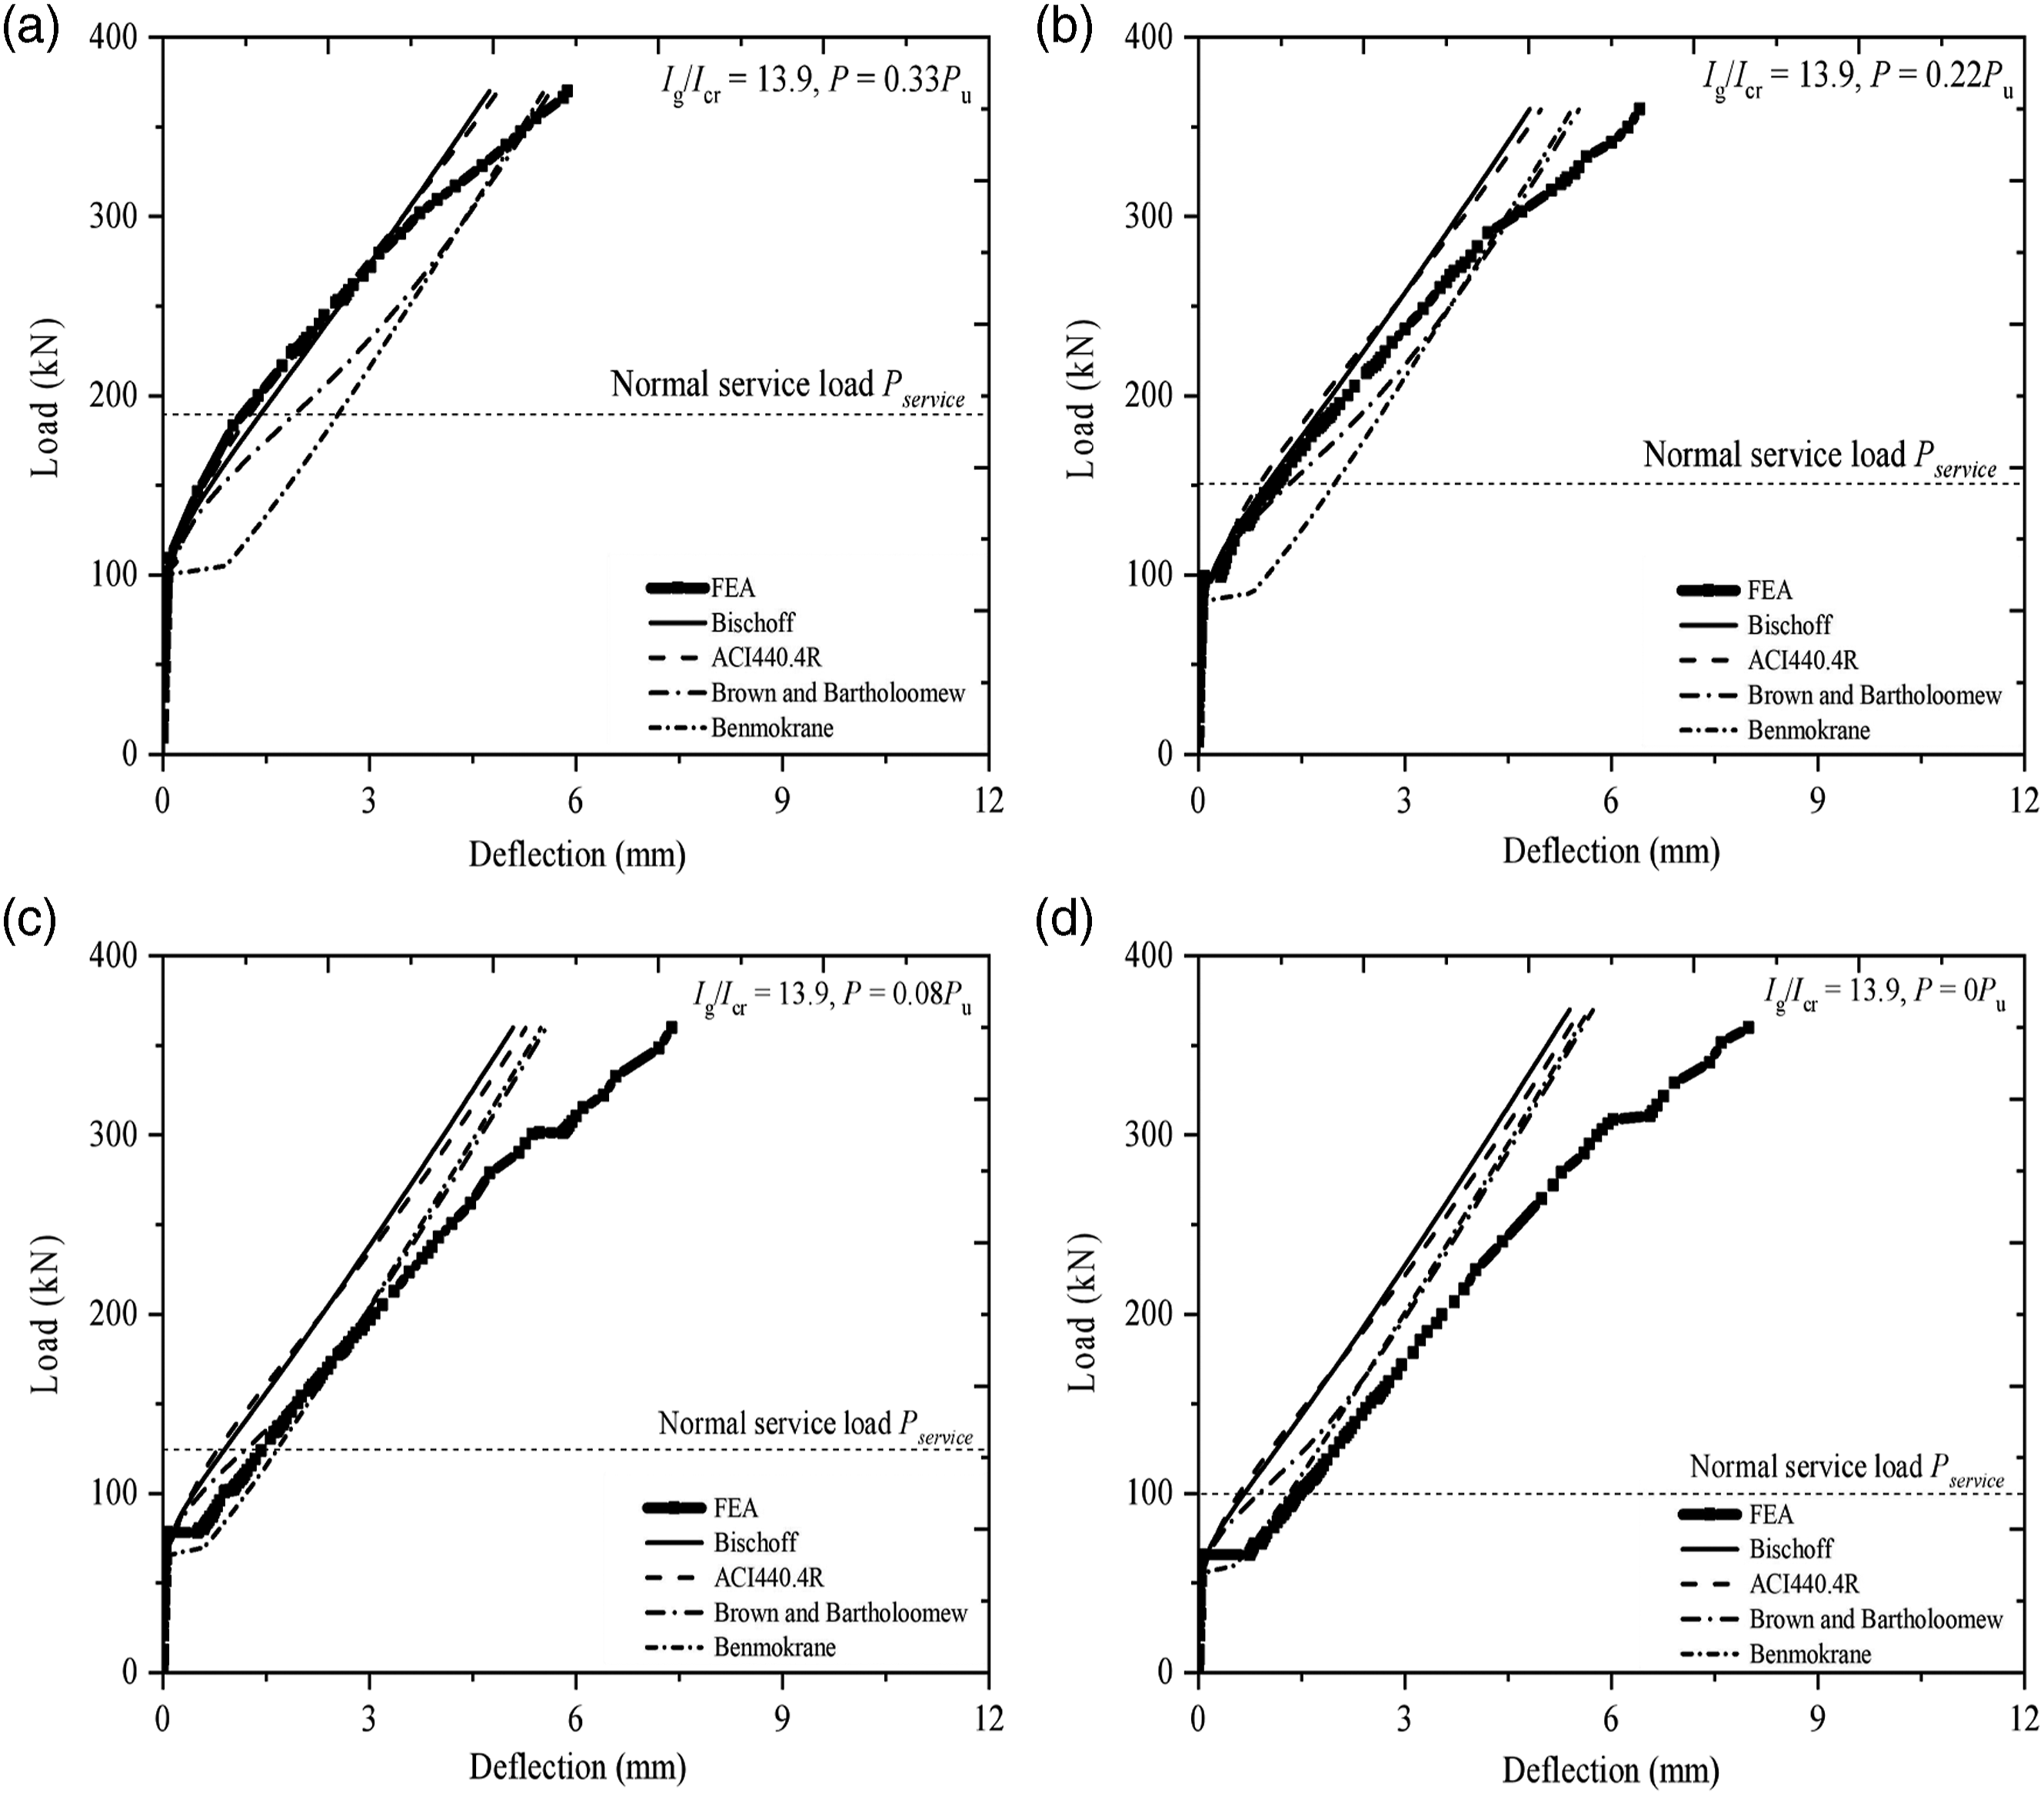
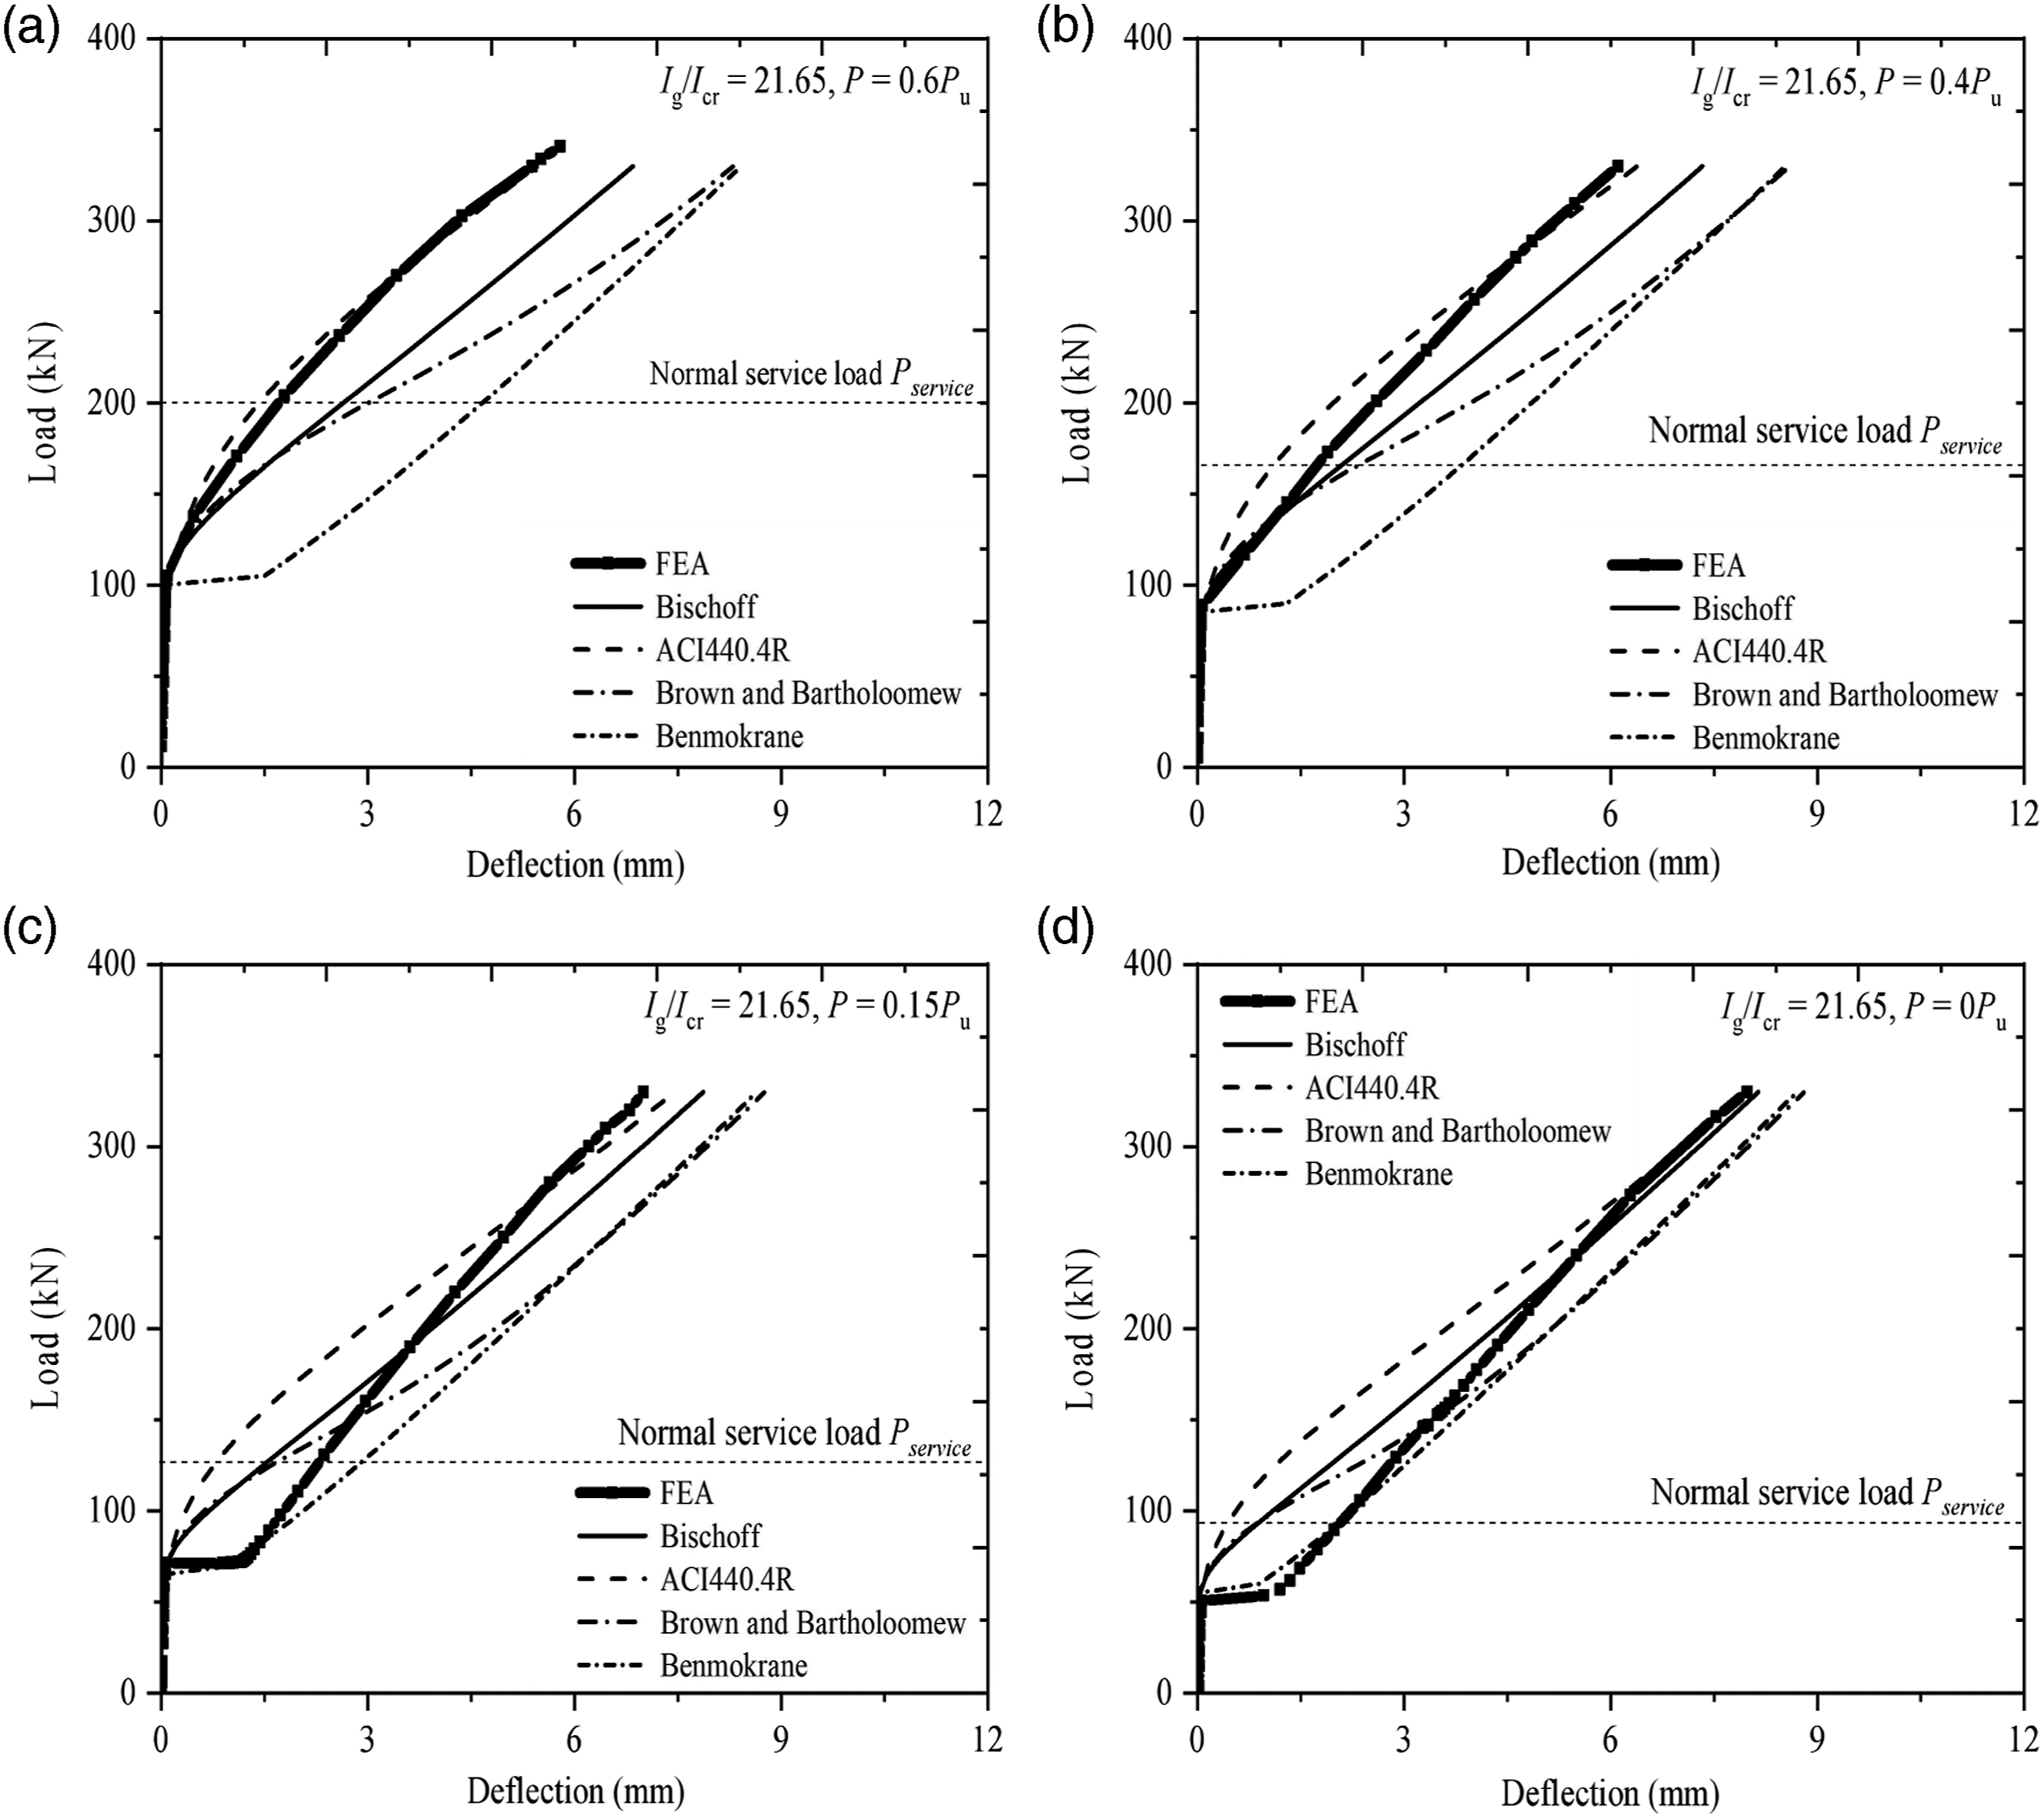
Figure 10 shows the load–deflection curve of the SFCB specimen (Ig/Icr =13.9) reinforced with SFCBs and prestressed with CFRP bars. Only ACI 440.4R-04 (2004) can effectively predict the deflection at the service load at a prestress level of 33% Pu, and the Bischoff (2005) is overestimated by approximately 19%. In contrast, as the prestress level decreases to 22% Pu, the ACI 440.4R-04 (2004) underestimates the deflection by 18%, and the results of the Bischoff (2005) agree well with the FEA results. As the prestress level continually decreases, the simulated values gradually approach the Benmokrane et al. (1996), which are closest to the simulated value at the prestress level of 0.
Figure 11 shows the load–deflection curve of the BFRP specimen (Ig/Icr =21.65) reinforced and prestressed with both BFRP tendons. At the prestress level of 60%, only the ACI 440.4R-04 (2004) calculation was close to the FEA value, and the other models deviated significantly from the simulated value. As the prestress level decreased to 40%, only the Bischoff (2005) approached the FEA result at the service load level; however, as the load level increased, the Bischoff (2005) overestimated the simulated value by 20.08%. As the prestress level decreased to 15%, the model simulation was no longer accurate, and the Bischoff (2005) prediction changed from overestimating the simulation value to underestimating the simulation value. When the prestress level decreased to 0, only the prediction of the Benmokrane et al. (1996) was relatively close to the FEA result. It should be noted that although the Bischoff (2005) underestimated the simulation value at a normal service load Pservice, the calculated value was closest to the simulated result as the load level increased.
Figure 12 shows the comparisons between the models and the simulation results under normal service load conditions. Figure 12(a) shows that the Brown and Bartholomew and Benmokrane et al. (1996) have an error of −7% to 9.6% at a prestress level ranging from 0% to 30%, which is closer to the FEA results. As the prestress level exceeds 30%, the Bischoff (2005) and ACI 440.4R-04 (2004) are closer to the FEA results, with an error of −2.7% to 1.36%. Comparison of models and simulated values: (a) load–deflection curve of specimens with Ig/Icr=7.17; (b) load–deflection curve of specimens with Ig/Icr=13.9; (c) load–deflection curve of specimens with Ig/Icr=21.65.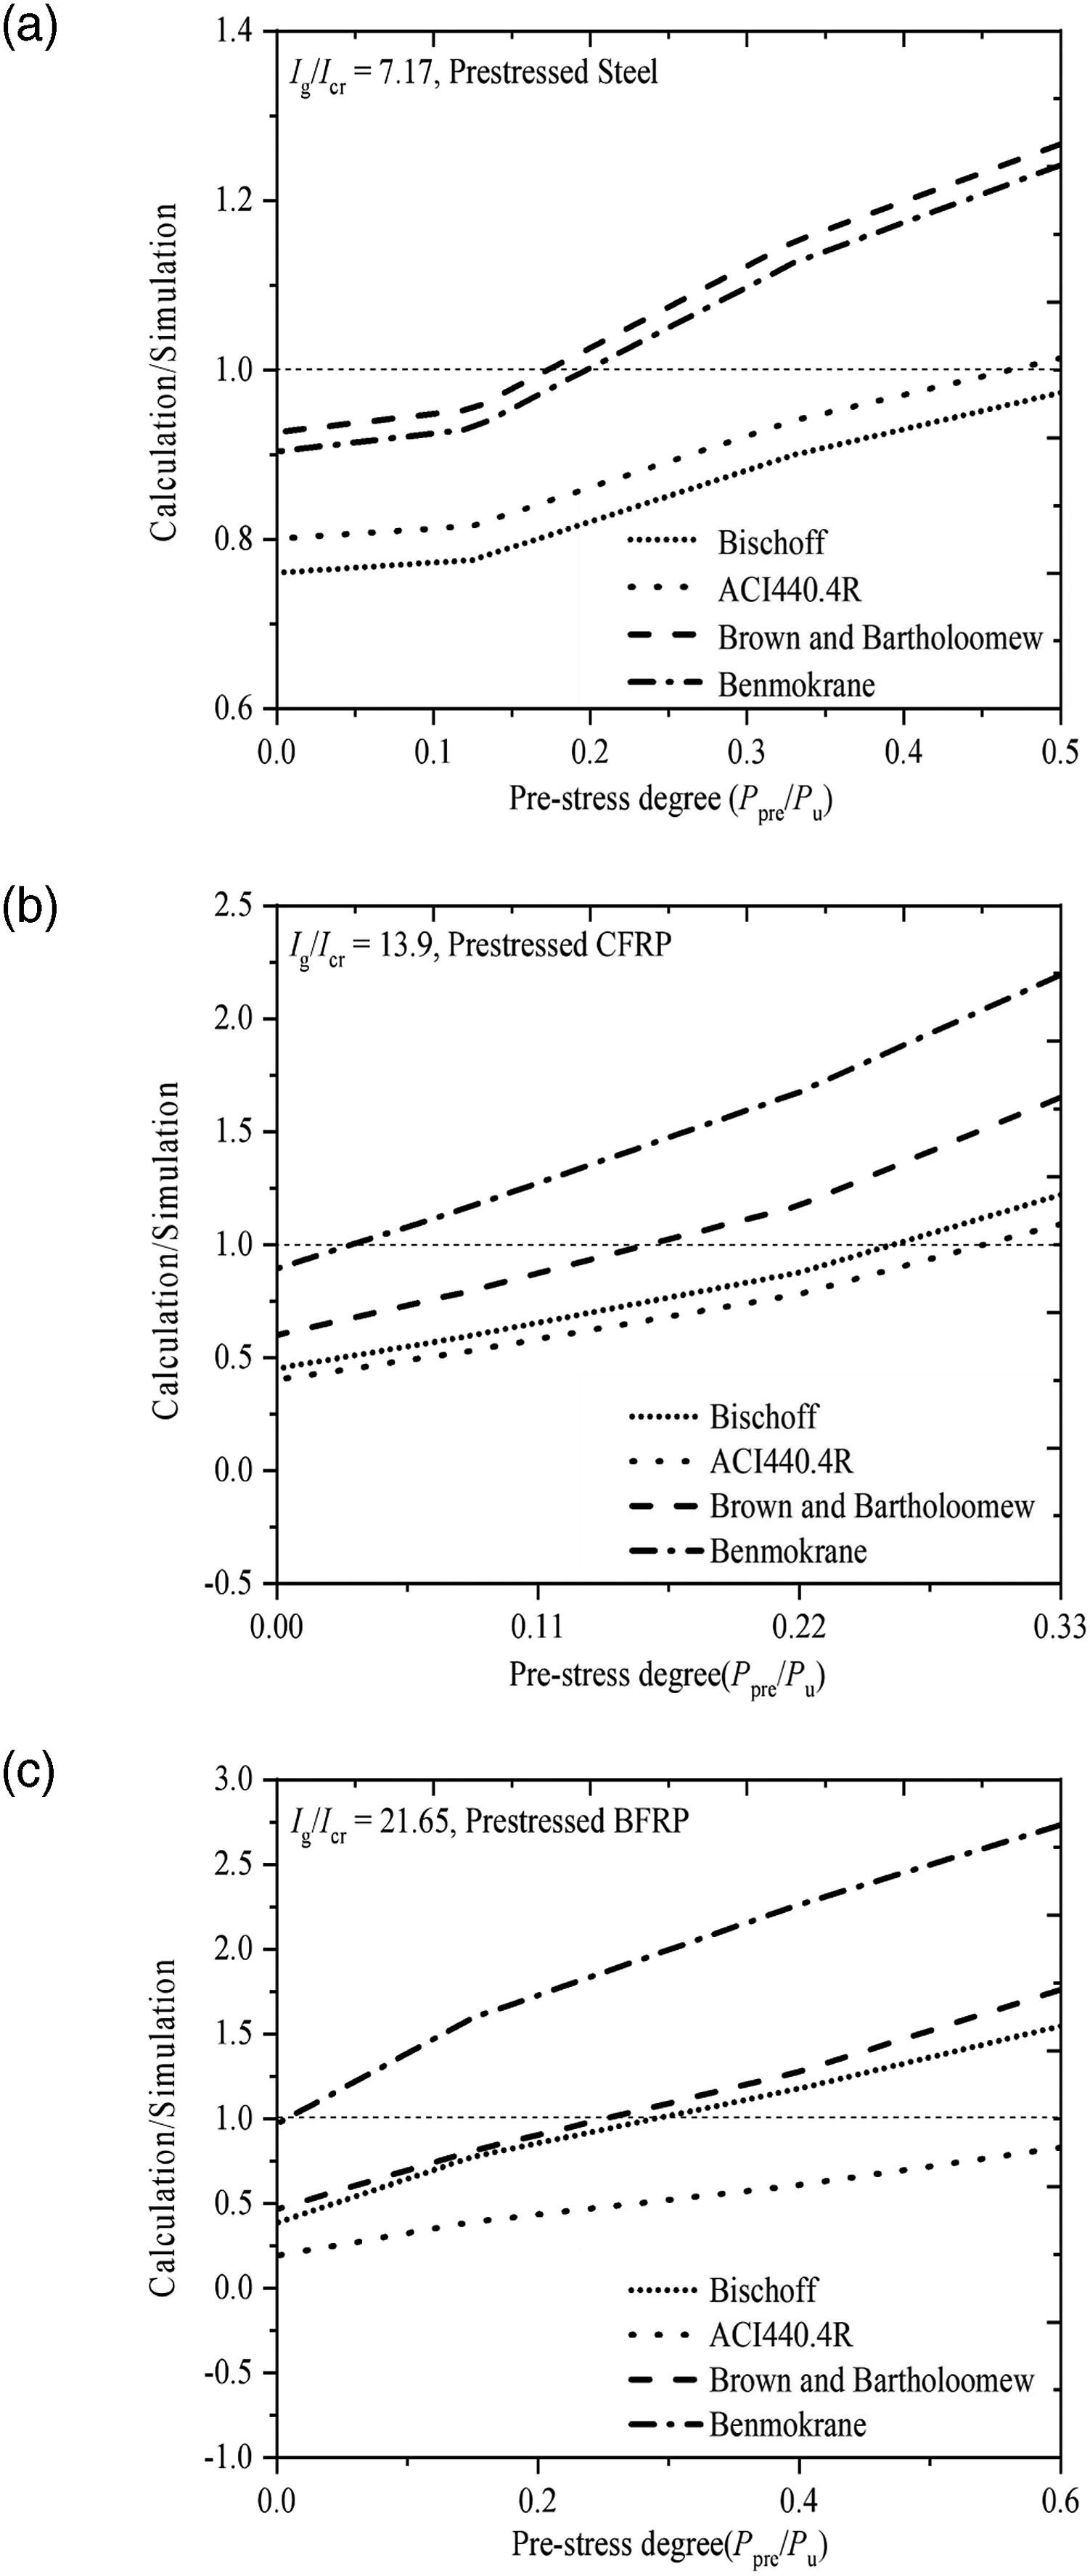
In Figure 12(b), when the prestress level is between 0% and 30%, and only the Brown and Bartholomew (1996) has an error of −40% to 17.3%, which is the closest to the simulation value. As the prestress level exceeded 30%, the Bischoff (2005) and ACI 440.4R-04 (2004) are closer to the simulation values. At a prestress level of 33%, the ACI 440.4R-04 (2004) obtains the most accurate results, with an error of 9.26%.
In Figure 12(c), the Brown and Bartholomew (1996) and Bischoff (2005) are closest to the simulated values at the prestress level of 0 to 30%. Other models underestimate or overestimate the simulated values significantly. As the prestress level exceeds 30%, Bischoff (2005) gradually overestimates the simulated value, and the error increased to 54% at the prestress level of 60%. Meanwhile, the ACI 440.4R-04 (2004) is closer to the simulated value. Table 4 shows the detailed comparison of the accuracy between the code prediction and the FEA result for the normal service load condition.
Recommended model.
Conclusions
Based on the experimental results, the ballastless track slab model is developed by the FEA method considering the effect of the prestressing degree, different reinforcement ratios, and different prestressed materials. The load–deflection curves of the specimens with Ig/Icr ranging from 7.17 to 21.65 were analyzed and compared with the available codes. The main conclusions are as follows: The FEA model of the ballastless track slab was validated by a comparison with the experimental results in terms of the failure mode, strain, deflection, and capacity. Although the bearing capacity of the specimen did not change significantly, the maximum deflection decreased with increasing prestress level. Both the stiffness and carrying capacity of the specimen increased with increasing reinforcement ratio, but the deflection decreased significantly. The prestressing tendons had a significant effect on the stiffness of the specimen mainly due to the elastic modulus. ACI 440.4R-04 and Bischoff (2005) models are suggested for the deflection prediction of the ballastless track slab when the prestress level is between 30% and 60%, while the Brown and Bartholomew (1996) is more suitable for those specimens with a prestress level below 30%.
Footnotes
Declaration of conflicting interests
The author(s) declared no potential conflicts of interest with respect to the research, authorship, and/or publication of this article.
Funding
The author(s) disclosed receipt of the following financial support for the research, authorship, and/or publication of this article: The work was supported by National Natural Science Foundation of China (Grant No: 51908486); the China Postdoctoral Science Foundation (Grant No: 2020M671620); the Postdoctoral Research Project of Jiangsu Province, China (Grant No: 2020Z290); and the Natural Science Foundation of Jiangsu Province, China (Grant No: BK20180931).